Article

Increasing Impact of Precipitation on Alpine-Grassland Productivity over Last Two Decades on the Tibetan Plateau

1
China (Xi’an) Institute for Silk Road Research, Xi’an University of Finance and Economics, Xi’an 710100, China
2
Research Center for Population Resource and Environment Statistics, Xi’an University of Finance and Economics, Xi’an 710100, China
3
Key Laboratory of Ecosystem Network Observation and Modelling, Lhasa National Ecological Research Station, Institute of Geographic Sciences and Natural Resources Research, Chinese Academy of Sciences, Beijing 100101, China
4
School of Geographic Sciences, Nantong University, Nantong 226007, China
*
Author to whom correspondence should be addressed.
Remote Sens. 2022, 14(14), 3430; https://doi.org/10.3390/rs14143430
Submission received: 16 June 2022 / Revised: 8 July 2022 / Accepted: 15 July 2022 / Published: 17 July 2022

Abstract

:
Understanding the importance of temperature and precipitation on plant productivity is beneficial, to reveal the potential impact of climate change on vegetation growth. Although some studies have quantified the response of vegetation productivity to climate change at local, regional, and global scales, changes in climatic constraints on vegetation productivity over time are not well understood. This study combines the normalized difference vegetation index (NDVI) and the net primary production (NPP) modeled by CASA during the plant-growing season, to quantify the interplay of climatic (growing-season temperature and precipitation, GST and GSP) constraints on alpine-grassland productivity on the Tibetan Plateau, as well as the temporal dynamics of these constraints. The results showed that (1) 42.2% and 36.3% of grassland NDVI and NPP on the Tibetan Plateau increased significantly from 2000 to 2019. GSP controlled grassland growth in dryland regions, while humid grasslands were controlled by the GST. (2) The response strength of the NDVI and NPP to precipitation (partial correlation coefficient RNDVI-GSP and RNPP-GSP) increased substantially between 2000 and 2019. Especially, the RNDVI-GSP and RNPP-GSP increased from 0.14 and 0.01 in the first 10year period (2000–2009) to 0.83 and 0.78 in the second 10-year period (2010–2019), respectively. As a result, the controlling factor for alpine-grassland productivity variations shifted from temperature during 2000–2009 to precipitation during 2010–2019. (3) The increase in precipitation constraints was mainly distributed in dryland regions of the plateau. This study highlights that the climatic constraints on alpine-grassland productivity might change under ongoing climate change, which helps the understanding of the ecological responses and helps predict how vegetation productivity changes in the future.

1. Introduction

Global greening has been confirmed by ground-based observations, satellite observations, and process-based ecosystem modeling [1,2,3]. The greenness was tightly associated with regional different climatic and environmental drivers, such as elevated atmospheric CO2 concentration and climate change (temperature and precipitation) [4,5,6]. These driving factors show strong interactions with one another in controlling the interannual variability of vegetation productivity [1,7]. Identifying the primary factor from these driving factors and quantifying its contribution to vegetation-greening trends are essential to understand and predict how vegetation respond to current and future climate change [8,9]. However, the controlling factors were affected by environmental conditions, such as biome type, water-use efficiency, and location, so were not static but dynamic [10,11]. Therefore, it is critical to investigate how these key factors change over time, in regulating the dynamics of ecosystem functions.
Grasslands are mainly distributed in dryland regions where plants are sensitive and vulnerable to climate change [12]. Previous studies have reported that temperature and precipitation are the factors controlling the dynamics of grassland productivity [13,14,15]. Rising temperatures and shifting precipitation patterns have substantially altered vegetation productivity in global grasslands [9]. On the one hand, warming can improve plant growth in cold grasslands by enhancing photosynthesis and lengthening the growing season [16,17]. However, dramatic warming may increase vapor-pressure deficit and decrease soil moisture, resulting in a decline in grassland productivity [18]. On the other hand, precipitation is closely related to the vegetation productivity of dry grasslands, and precipitation sensitivity is thought to be a major indicator of vegetation functioning [19,20], growth [21], and phenology [22]. In the future, climates are expected to include frequent droughts, high-intensity precipitation patterns, and heatwaves [23,24]. Understanding the changes in the relationship between climate and grassland productivity over time will help us predict ecosystem-function variations under disturbances.
The Tibetan Plateau is the highest and largest plateau in the world (the average elevation is over 4000 m above sea level), and it is a significant reservoir of biodiversity and carbon storage [25,26,27]. The ongoing climate change of the plateau is dramatic compared to the global average [26,28]. Thus, this plateau is ideal for analyzing climate’s impact on an alpine-grassland ecosystem. Previous analyses have quantified the relative effect of climate factors on alpine-grassland productivity based on in situ manipulated experiments, long-term field or satellite observations, and large-scale ecological modeling [29,30,31]. The results of these studies are not always consistent. For example, Fu et al. [18] suggested that increased precipitation rather than experimental warming contributed to most of the variations in alpine-grassland productivity on the northern Tibetan Plateau. Lehnert et al. [32] found that precipitation controlled the vegetation-cover dynamics on this plateau. However, Zeng et al. [33] observed that the inter-annual variation of grassland biomass on this plateau was significantly correlated with temperature but not with precipitation; a study by Zhang et al. [34] reported a similar result. They attributed this inconsistent finding to the differences in spatial scale. Besides, the change of the relationship between alpine-grassland growth and climatic factors over time could be another potential explanation. However, to our knowledge, few studies have investigated how and where the impacts of temperature and precipitation on alpine-grassland productivity have changed over the last two decades on this plateau.
To fill this gap, we first collected the normalized difference vegetation index (NDVI) of the alpine grasslands of the Tibetan Plateau from 2000 to 2019 and simulated the net primary production (NPP) based on a light-use efficiency model. Then, the variabilities in growing-season NDVI and NPP as well as temperature and precipitation were quantified. Finally, the statistical relationships of precipitation and temperature with alpine-grassland growth were assessed to examine the changes in vegetation response to water and energy availability over the last two decades. This study aimed to identify the controlling factors regulating alpine-grassland productivity; to investigate whether the key factors changed over time; and to explore the underlying mechanisms of the changes.

2. Materials and Methods
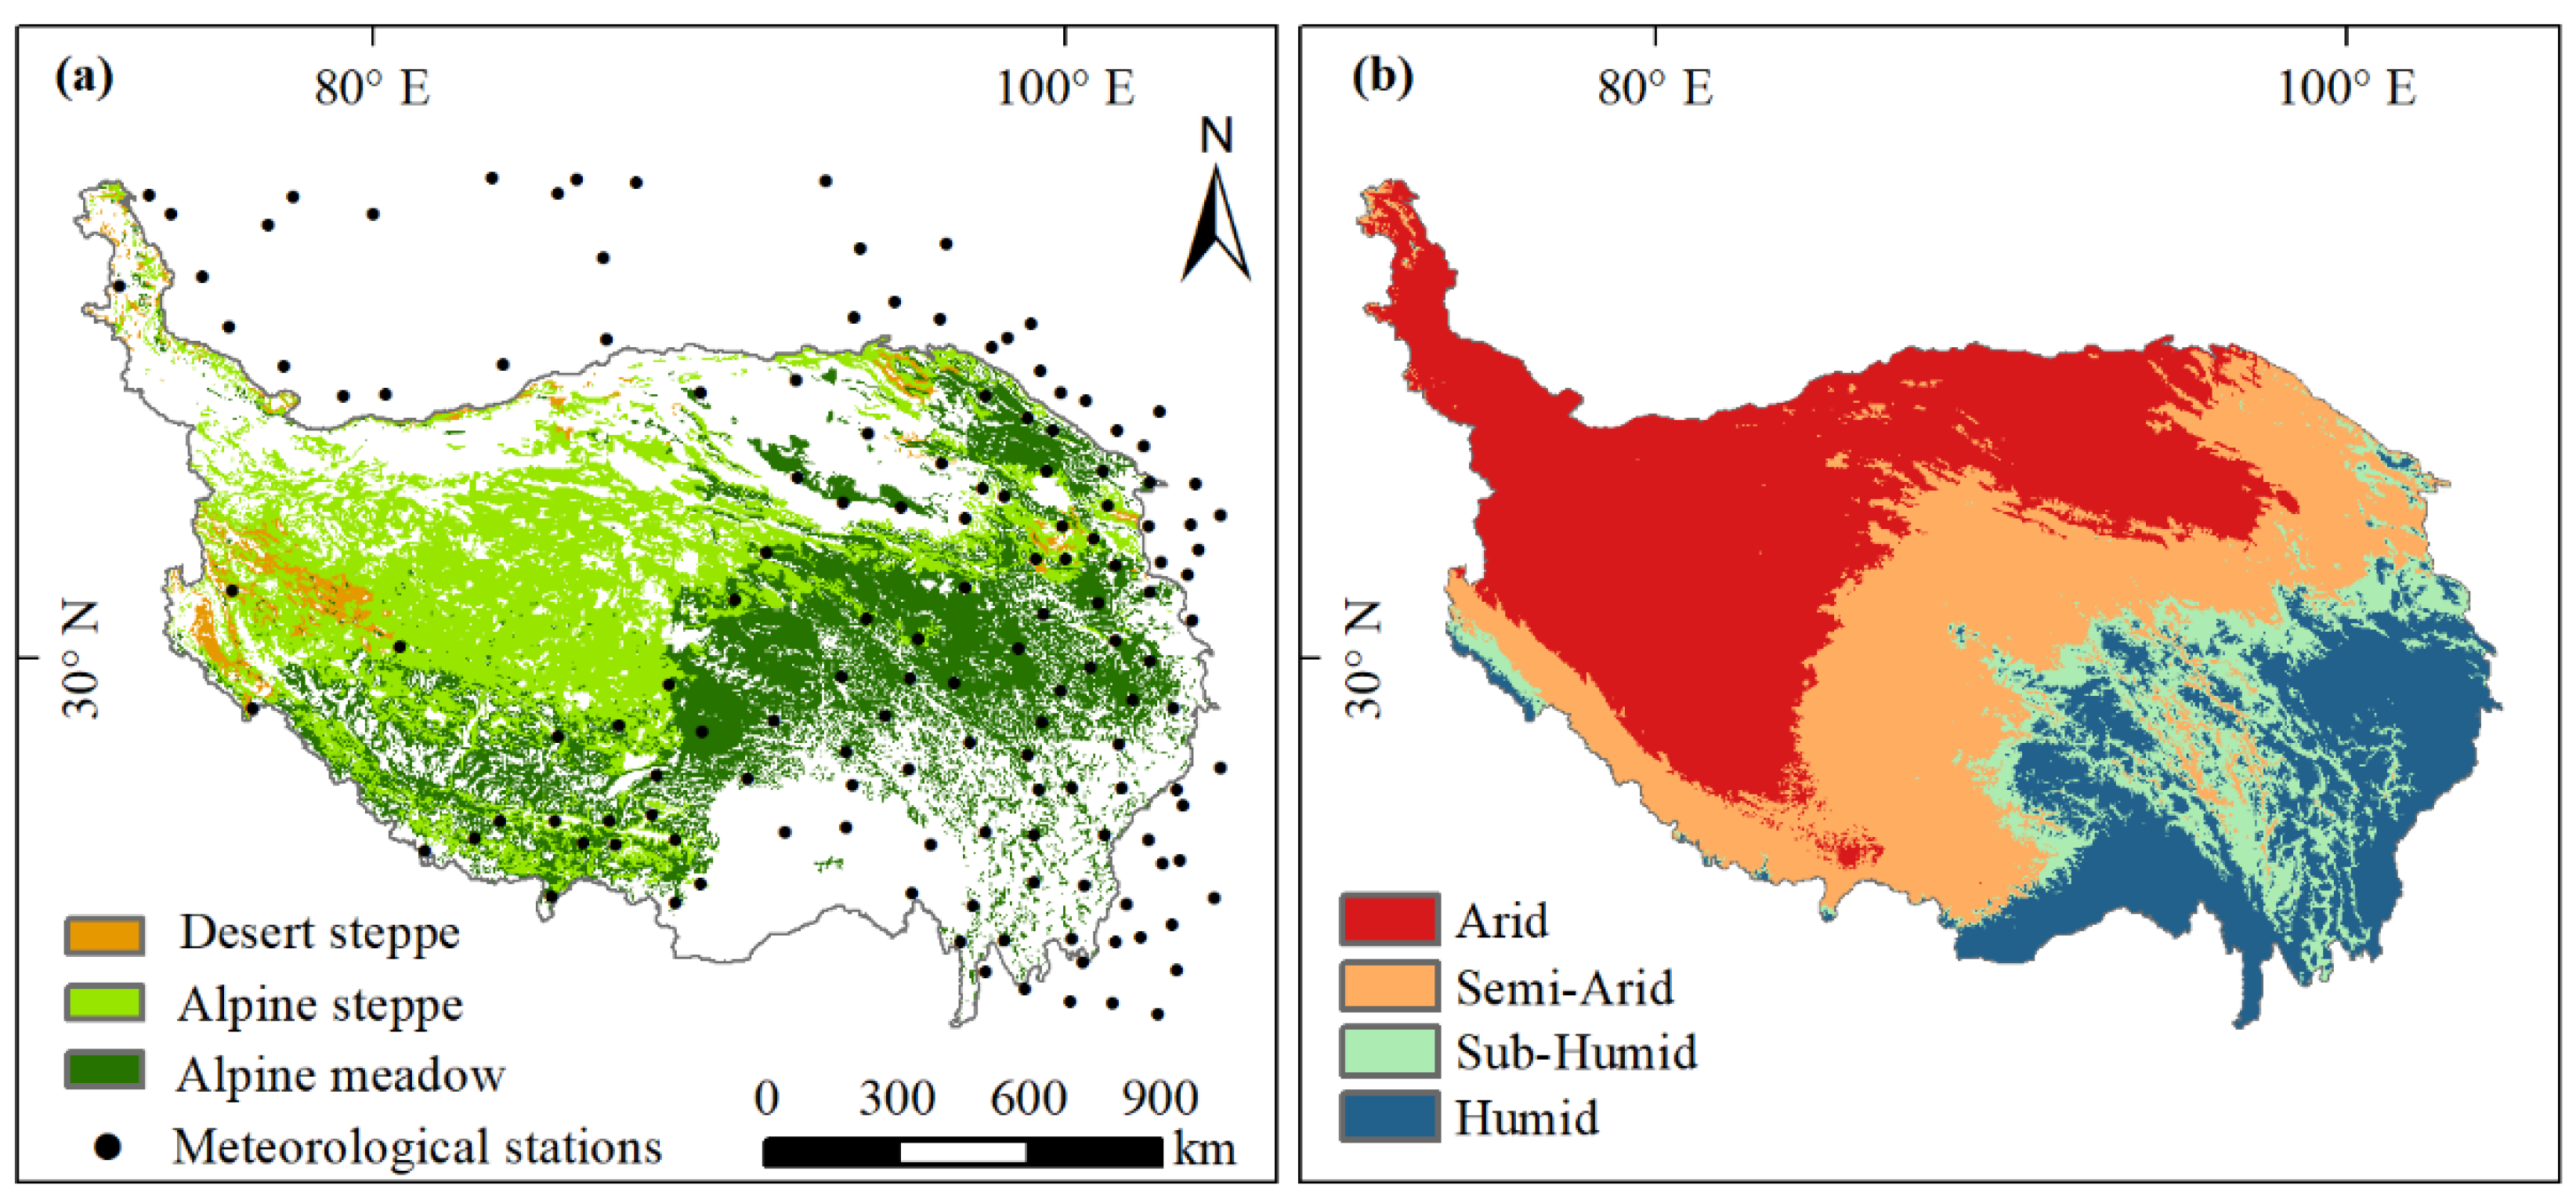
2.1. Study Area

The Tibetan Plateau, also called “the roof of the world”, “the third pole”, and “the Asian water tower”, is located in the southwestern part of China, which is considered to be an important ecological security barrier for China [26]. The annual average temperature of this plateau ranges from −15 to 10 °C. The precipitation distribution is uneven. Annual average precipitation is less than 50 mm in the northwest of the plateau, while it is more than 1000 mm in the southeast [35]. Grassland, the most widely distributed vegetation type, occupies in about 75% of the plateau areas. From southeast to northwest, grassland types transit from humid alpine meadow to semi-arid alpine steppe and to arid alpine-desert steppe (Figure 1).

2.2. NDVI and Meteorological Datasets

The normalized difference vegetation index (NDVI) was the most widely used indicator for monitoring the regional ecosystem changes. In this study, during 2000–2019, the sixth version of NDVI from the MOD13A3 product, Moderate Resolution Imaging Spectroradiometer (MODIS), was used for collection. Meteorological data were downloaded from the National Meteorological Information Center (NMIC) of the China Meteorological Administration (CMA). We selected 145 long-term observing stations with complete meteorological records in and around the Tibetan Plateau, to assess the dynamics of climate variables. These meteorological stations are mainly distributed in the east of this plateau (Figure 1a). We interpolated the origin meteorological data into raster surfaces, with a spatial resolution of 1 km, using ANUSPLIN 4.3 [36].
The dry/wet-climate regions were defined based on the aridity index (AI), which was calculated as the ratio of multi-year average precipitation to multi-year average potential evapotranspiration. AI value was used to reclassify the Tibetan Plateau to arid (AI < 0.2), semi-arid (0.2 ≤ AI ≤ 0.5), sub-humid (0.5 ≤ AI ≤ 0.65), and humid (AI ≥ 0.65) regions [37].

2.3. NPP Calculation

In this study, we employed CASA (Carnegie–Ames–Stanford approach) model to calculate alpine grassland NPP from 2000 to 2019. The driving factors includes grassland vegetation index (NDVI), climate (e.g., temperature, precipitation, and radiation), soil (the content of clay, silt, and sand) and grassland types. In this model, the land-use change and human harvest from plant material were reflected by the changes of NDVI [25,38]. The formulas are as follows:
NPP(x, t) = APAR(x, t) × ε(x, t)
APAR(x, t) = PAR(x, t) × FPAR(x, t) × 0.5
ε(x, t)= Tε1(x, t) × Tε2 (x, t) × Wε(x, t) × ε*
where x and t represent location and time, respectively. NPP is grassland net primary production (g C m−2). APAR is the absorbed photosynthetically active radiation. ε is light-use efficiency. PAR and FPAR are total solar radiation (MJ m−2) and the fraction of the incoming solar radiation intercepted by vegetation. ε* is the maximum possible light energy-conversion efficiency, which was set as 0.56 g C MJ−1 [25]. Tε1 and Tε2 are temperature limitation on ε*; Wε(x, t) is water limitation.
To assure the accuracy of the NPP, observed NPP on the Tibetan Plateau data was applied to validate the simulated CASA NPP. The observed NPP dataset was acquired from field surveys on the Tibetan Plateau. First, we collected 224 aboveground biomass (AGB) observations on this plateau and then converted AGB to aboveground NPP (ANPP), by multiplying by 0.45. Finally, NPP was calculated by the ratio of BNPP to ANPP (0.413). The results showed that there is a significant relationship between simulated NPP and observed data. The simulated NPP can explain 80% of the observed NPP’s overall measurements in alpine grasslands. More detailed information of NPP validation can be found in our previous study, Li et al. [25].

2.4. Data Analyses

Prior to data analysis, we first calculated the average temperature and precipitation (GST and GSP) during growing season (May to September) because climate in growing season has a stronger effect on NDVI/NPP than that in non-growing season (Figure A1). Then, the ordinary least-squares method was employed to calculate the temporal trend of climate variables and alpine-grassland productivity as well as their relationships for each grid cell during the study period. The relationship between NDVI and GSP (RNDVI-GSP), NDVI and GST (RNDVI-GST), NPP and GSP (RNPP-GSP), and NPP and GST (RNPP-GST) were calculated based on the Spearman partial correlation coefficient. Partial correlation can remove the compound effect and determine the key factor of NDVI or NPP based on its absolute value. The partial correlation analysis was conducted in R 4.1.2 using the ggm package (https://CRAN.R-project.org/package=ggm, accessed on 1 October 2021). Differences among dry/wet-climate regions in RNDVI-GSP, RNDVI-GST, RNPP-GSP, and RNPP-GST were examined based on the Analysis of Covariance (ANCOVAs).
To test the temporal changes in the relationship between climate variables and alpine productivity, first, we divided this study to a period of warming and slowly increasing precipitation (2000–2009) and a period of cooling and rapidly increasing precipitation (2010–2019) (Figure A2). We compared the differences in RNDVI-GSP, RNDVI-GST, RNPP-GSP, and RNPP-GST between the two subperiods. Then, a 10-year moving window was used in the partial correlation analysis, rolling from 2000 until 2019. We calculated partial correlation coefficients between NDVI/NPP and GST/GSP for each 10-year moving window. Consequently, there were 11 moving windows centered from 2005 (2005 represents the period of 2000–2009, 2006 represents the period of 2001–2010, and so on) to 2015, and, correspondingly, there were 11 values of RNDVI-GSP, RNDVI-GST, RNPP-GSP, and RNPP-GST, respectively. The temporal changes in RNDVI-GSP, RNDVI-GST, RNPP-GSP, and RNPP-GST were calculated using the ordinary least squares method. All analyses of this study were performed in R 4.1.2 and mapped with ArcGIS 10.8 and Origin 2020.

3. Results

3.1. Spatio-Temporal Trends of Climatic Factors, NDVI, and NPP

From 2000 to 2019, we observed evident warming in 30.4% of the alpine grasslands (Table 1, p < 0.05). In the southeastern Tibetan Plateau, the warming rates exceeded 0.6 °C /10 year (Figure 2a). Significant increases in GSP were found in 12% of the grassland pixels distributed in the eastern plateau (Figure 2b and Table 1). In the south-central region, we detected decreases in GSP that ranged between −3 and −6 mm/year but were not significant in most grassland pixels (Figure 2b). Regarding the NDVI, 42.2% of grassland pixels showed a significant increase, mainly distributed in the northern plateau. The NDVI significantly decreased, only occupying 3.3% of the grassland pixels (Figure 2c and Table 1). We observed significant increase in the NPP in 36.3% of the grassland pixels and a significant decrease in 2% of the plateau (Figure 2d and Table 1).
Within different dry/wet-climate regions, the proportion of the pixels with significant warming was around 80% in sub-humid and humid regions, which was significantly higher than that in arid and semi-arid regions (Table 1). Meanwhile, humid regions had the most considerable fraction of the pixels with a significant increase in GSP. Although the fraction of pixels with increased or decreased GST and GSP was lowest in arid regions, the NDVI and NPP significantly increased and decreased in around 40% of grassland pixels in those regions, respectively (Table 1).

3.2. Relationships of NDVI and NPP with Climatic Variables over the Last Two Decades

Over the entire study period, GSP and GST governed 61.8% and 38.2% of NDVI variations, respectively, with an average RNDVI-GSP of 0.27 and RNDVI-GST of 0.07. Meanwhile, the two climatic variables dominated 40.7% and 59.3% of NPP variations, with an average RNPP-GSP of 0.34 and RNPP-GST of 0.46, respectively. In terms of the geographic pattern, GSP restrained alpine-grassland growth in the southwestern and northeastern plateau, and GST was the controlling factor for NDVI and NPP variations in the mid-eastern plateau (Figure 3a,b).
For alpine grasslands in different dry/wet-climate regions, we observed that dry regions (arid and semi-arid regions) had a high correlation with precipitation, while wet regions (sub-humid and humid regions) correlated well with temperature. Specifically, the spatial-averaged RNDVI-GSP and RNPP-GSP were 0.29 and 0.42 in arid regions (Figure 3c,e) and were 0.00 and 0.15 in humid regions (Figure 3d,f). By contrast, the RNDVI-GST and RNPP-GST in arid regions were significantly lower than those in humid regions (p < 0.05).

3.3. Temporal Changes in the Relationship between Alpine-Grassland Productivity and Climatic Variables

The RNDVI-GSP increased from 0.14 for the first 10-year period (2000–2009) to 0.83 for the second 10-year period (2010–2019), but the RNDVI-GST declined from 0.32 to −0.37 (Figure 4a). Similarly, the RNPP-GSP increased from 0.01 of 2000–2009 to 0.78 for 2010–2019, while the RNPP-GST declined from 0.68 to 0.62 (Figure 4b). These results suggested that the dominant climate factor for alpine-grassland productivity variations shifted from temperature during 2000–2009 to precipitation during 2010–2019. To test the robustness of these results, we applied a 10-year moving window to calculate the temporal changes in the relationship between alpine-grassland productivity and climate variables.
The RNDVI-GSP and RNPP-GSP increased significantly (p < 0.05), while the RNDVI-GST and RNPP-GST decreased significantly (p < 0.05) from 2005 (the 2000–2009 window) to 2015 (the 2010–2019 window) (Figure 4a,b). On the entire Tibetan Plateau, the RNDVI-GSP and RNPP-GSP significantly increased in 37% and 43.6% of alpine grasslands, and the RNDVI-GST and RNPP-GST significantly decreased in 37.5% and 19.4% of alpine grasslands, respectively (Figure 4c–f). Moreover, most of the areas with a significantly increased trend in RNDVI-GSP and RNPP-GSP were in dry regions (arid and semi-arid regions). Specifically, dry regions accounted for 83.7% and 83.5% of the significant increase in RNDVI-GSP and RNPP-GSP, respectively (Figure 4c,e).

3.4. Spatial Changes in Climate Controls on Alpine-Grassland Productivity

It is found that a remarkable trend with an expansion of precipitation-dominated areas and a contraction of temperature-dominated areas over the last two decades (Figure 5). From 2000 to 2009, GSP was the dominant climatic driver for 51.4% of the NDVI variations and 42.9% of the NPP variations, and GST governed 48.6% of the NDVI variations and 57.1% of the NPP variations, respectively. However, during the second sub-period (2010–2019), the NDVI and NPP variations for the GSP-dominated areas increased to 62.0% and 45.6%, respectively. This scenario was apparent especially in the southeastern grasslands of the Tibetan Plateau. In contrast, the grasslands where NDVI and NPP variations were dominated by GST decreased to 38.0% and 54.4%, respectively, in the second sub-period.

4. Discussion

4.1. Changes in Alpine-Grassland Productivity on the Tibetan Plateau over the Last Two Decades

From 2000 to 2019, increased NDVI and NPP were found in 79.5% and 80.6% of the total grassland areas on the Tibetan Plateau, respectively, of which 42.2% and 36.3% had a significant increase (p < 0.05). Numerous studies have reported that alpine-grassland productivity showed an increasing trend since 2000. For example, Chen et al. [39] suggested that alpine-grassland NPP increased with a rate of 0.93 g C m−2 year−1 in the period of 2001–2011, with 8.05% of the grasslands showing a significant increase. Gao et al. [40] found aboveground biomass increased in 66.55% of alpine-grassland areas of this plateau from 2000 to 2017. Meanwhile, we also found that the spatial pattern of the NDVI trends was not a total match with that of the NPP trends. For example, the NDVI increased with a high rate in the central Tibetan Plateau, while the NPP increased with a low rate in the same area. The potential explanation for this difference may be that vegetation greenness (NDVI) is not always correlated with vegetation productivity [41]. Early studies reported that remote sensing of the NDVI showed strong correlations with photosynthetic activity [42]. We also found that the NDVI of the alpine grassland on the Tibetan Plateau was significantly correlated with aboveground net primary production (Figure A3) and, thus, can be used as a proxy for vegetation productivity. However, recent studies suggested that the relationship between vegetation greenness and productivity varies strongly along with the climatic fluctuations [41]. For example, Doughty et al. [43] found that vegetation greenness decreased but productivity remained stable in Amazonian rainforests in a drought year. Therefore, in our study, we evaluated inter-annual changes in vegetation productivity with the combination of NDVI and NPP to remove bias assessments.
More than three-quarters of the grasslands showed an increasing trend in GST and GSP, especially in the eastern plateau, which matched well with the spatial pattern of the NDVI and NPP trends. This continuous increase in precipitation and warming is more favorable for the vegetation growth of the plateau, which is consistent with Chen et al. [44], who indicated that the rising temperature and increasing precipitation contributed most to the increase in the grassland productivity of the Tibetan Plateau. Correlation analysis revealed that precipitation and temperature could affect vegetation in entirely different pathways and result in either increasing or decreasing grassland productivity across the Tibetan Plateau. GSP had the strongest inhibitory effect on the growth of alpine grasslands in the southwest and northeast of the Tibetan Plateau, and GST was the controlling factor for the NDVI and NPP variations in the mid-eastern plateau. This spatial pattern was determined by the complex meteorological and biotic conditions of the Tibetan Plateau [30,45]. The alpine grasslands in the arid and semi-arid regions, such as the desert steppe and alpine steppe in the northern Tibetan Plateau, were water-limited ecosystems. Increasing precipitation benefits grassland productivity due to a more available water supply, while warming might reduce water availability for vegetation growth in these ecosystems [46]. This was also demonstrated by Shen et al. [47] who found that the spring phenology of the alpine grasslands in the arid areas of the Tibetan Plateau had high precipitation sensitivity. In contrast, the grasslands of the humid regions, such as the alpine meadow in the eastern plateau, were more sensitive to temperature than those of the dryland regions. This agrees with the finding that humid regions are energy-limited but are not water-limited. Previous studies have found that the moisture in humid regions is adequate, and a short-term precipitation deficiency did not limit plant growth or vegetation expansion [48,49]. However, this explanation is still controversial, so the effects of precipitation on alpine-grassland growth need to be explored by manipulative experiments in the future.

4.2. Increasing Impact of Precipitation on Alpine-Grassland Growth

Our findings showed that, over the last two decades, precipitation has increasingly restricted the Tibetan Plateau. Furthermore, we found that the increasing importance of precipitation for plant growth was mainly distributed in water-limited areas (arid and semi-arid regions). The results were consistent whether the NDVI or the NPP was used, confirming the importance of moisture in controlling plant growth, which has been demonstrated at a global scale and particularly in dryland regions [50,51,52].
For both the NDVI and NPP, the expansion of GSP-constrained areas was met by the shrinking of GST-constrained areas. This suggested that warming on the Tibetan Plateau promoted vegetation to meet its temperature requirements. In contrast, the increasing precipitation in these regions had not met the water requirements. Over the last five decades, warming is becoming more and more prominent across the Tibetan Plateau and is about twice as fast as the global average [28,53]. This dramatic warming is “relaxing” the temperature constraint on plant growth and even reaches above the range of vegetation-acclimation conditions [51,54], leading to a reduced sensitivity of vegetation productivity to temperature. Besides, warming-induced drought events and heatwaves have potentially changed the response strength of productivity to climate factors. For instance, high temperature along with increased extremely hot days increases evapotranspiration/potential evapotranspiration, which then reduces water availability for vegetation growth and exacerbates vegetation water-stress exposure, especially in dryland regions [50,55,56,57]. Thus, plants living in arid/semi-arid regions can increase productivity when a sudden precipitation event occurs [58]. This high precipitation sensitivity under dry conditions demonstrated that drought could increase the positive impact of precipitation on productivity.
To further analyze the effects of drought on productivity sensitivity to precipitation, the relationship between the temporal trend of the standardized precipitation evaporation index (SPEI) and the temporal trend of the RNDVI-GSP and RNPP-GSP for 32 meteorological stations was examined. It was found that the RNDVI-GSP and RNPP-GSP trends were significantly and positively correlated with the trends in the SPEI (Figure 6) (a decreasing trend in SPEI indicates increasing drought severity). Thus, drought is a driver that alters the sensitivity of grassland NDVI or NPP to precipitation. Besides, increasing CO2 is another potential driver for the changes in vegetation response to precipitation [59]. Luo et al. [60] found the rising atmospheric CO2 concentration contributed 14% of the interannual variations of GPP on the plateau, suggesting that elevated CO2 concentration promoted the carbon uptake of alpine vegetation. The increased water-use efficiency due to the elevated CO2 concentration might explain part of the changes of GPP [6]. This CO2 fertilization effect, as well, has a positive effect on the precipitation sensitivity of the NDVI/NPP.

5. Conclusions

This study examined changes in the relationship between alpine-grassland productivity and climate factors (temperature and precipitation), using satellite NDVI observations and the modeled NPP of the Tibetan Plateau. The results showed that the sensitivity of alpine-grassland growth to precipitation increased over time, but alpine-grassland sensitivity to temperature decreased over time. As a result, the GSP-constrained areas increased substantially between 2000 and 2019 across the Tibetan Plateau. The increase in the relationship between grassland growth and precipitation occurred mainly in the dryland regions. These observed dynamics of vegetation sensitivity to climate change enrich our understanding of the carbon and water cycles in grassland ecosystems.

Author Contributions

X.Z., conceptualization, investigation, methodology, formal analysis, visualization, and writing and editing; B.N., methodology, investigation, and formal analysis; M.L., software and visualization; C.D., supervision, writing–review and editing, and resources. All authors have read and agreed to the published version of the manuscript.

Funding

This research was funded by the Central Government Guides Local Science and Technology Development Program, grant number XZ202201YD0014C; the Key R&D Program of Tibet, grant number XZ202001ZY0050G.

Data Availability Statement

The monthly MOD13A3C6 NDVI data were downloaded from the NASA LP DAAC (Land Processes Distributed Active Archive Center) website (https://lpdaac.usgs.gov/get_data/data_pool, accessed on 1 June 2021). The meteorological data, including temperature, precipitation and sunshine duration, were obtained from the National Meteorological Information Center of China Meteorological Administration (http://geodata.cn, accessed on 1 June 2021).

Conflicts of Interest

The authors declare no conflict of interest.

Appendix A

Figure A1. The relationships between precipitation and grassland productivity. (a) The relationship between growing-season precipitation (GSP) and NDVI. (b) The relationship between non-growing-season precipitation (NGSP) and NDVI. (c) The relationship between GSP and NPP. (d) The relationship between NGSP and NPP. Growing season is defined as May to September in each year, and non-growing season is defined as October in the previous year to April in the current year. Lines in this figure are the fitting lines of least square regression with significant (solid lines) and non-significant (dotted lines) relationship.
Remotesensing 14 03430 g0a1
Figure A2. Temporal anomaly of the (a) growing-season precipitation (GSP) and (b) temperature (GST) on the Tibetan Plateau during the period of 2000–2009 and the period of 2010–2019. Lines in this figure are the fitting lines of least square regression.
Remotesensing 14 03430 g0a2
Figure A3. The relationship between NDVI and aboveground net primary production (ANPP). Lines in this figure are the fitting lines of least square regression.
Remotesensing 14 03430 g0a3

References

  1. Zhu, Z.; Piao, S.; Myneni, R.B.; Huang, M.; Zeng, Z.; Canadell, J.G.; Ciais, P.; Sitch, S.; Friedlingstein, P.; Arneth, A.; et al. Greening of the Earth and its drivers. Nat. Clim. Chang. 2016, 6, 791–795. [Google Scholar] [CrossRef]
  2. Brandt, M.; Yue, Y.; Wigneron, J.P.; Tong, X.; Tian, F.; Jepsen, M.R.; Xiao, X.; Verger, A.; Mialon, A.; Al-Yaari, A.; et al. Satellite-Observed Major Greening and Biomass Increase in South China Karst During Recent Decade. Earth’s Future 2018, 6, 1017–1028. [Google Scholar] [CrossRef]
  3. Mao, J.; Ribes, A.; Yan, B.; Shi, X.; Thornton, P.E.; Séférian, R.; Ciais, P.; Myneni, R.B.; Douville, H.; Piao, S.; et al. Human-induced greening of the northern extratropical land surface. Nat. Clim. Chang. 2016, 6, 959–963. [Google Scholar] [CrossRef]
  4. Piao, S.; Wang, X.; Park, T.; Chen, C.; Lian, X.; He, Y.; Bjerke, J.W.; Chen, A.; Ciais, P.; Tømmervik, H.; et al. Characteristics, drivers and feedbacks of global greening. Nat. Rev. Earth Environ. 2020, 1, 14–27. [Google Scholar] [CrossRef]
  5. Seddon, A.W.; Macias-Fauria, M.; Long, P.R.; Benz, D.; Willis, K.J. Sensitivity of global terrestrial ecosystems to climate variability. Nature 2016, 531, 229–232. [Google Scholar] [CrossRef] [PubMed] [Green Version]
  6. Schimel, D.; Stephens, B.B.; Fisher, J.B. Effect of increasing CO2 on the terrestrial carbon cycle. Proc. Natl. Acad. Sci. USA 2015, 112, 436–441. [Google Scholar] [CrossRef] [PubMed] [Green Version]
  7. Craine, J.M.; Nippert, J.B.; Elmore, A.J.; Skibbe, A.M.; Hutchinson, S.L.; Brunsell, N.A. Timing of climate variability and grassland productivity. Proc. Natl. Acad. Sci. USA 2012, 109, 3401–3405. [Google Scholar] [CrossRef] [Green Version]
  8. De Jong, R.; Verbesselt, J.; Schaepman, M.E.; de Bruin, S. Trend changes in global greening and browning: Contribution of short-term trends to longer-term change. Glob. Chang. Biol. 2012, 18, 642–655. [Google Scholar] [CrossRef]
  9. Fensholt, R.; Langanke, T.; Rasmussen, K.; Reenberg, A.; Prince, S.D.; Tucker, C.; Scholes, R.J.; Le, Q.B.; Bondeau, A.; Eastman, R.; et al. Greenness in semi-arid areas across the globe 1981–2007—An Earth Observing Satellite based analysis of trends and drivers. Remote Sens. Environ. 2012, 121, 144–158. [Google Scholar] [CrossRef]
  10. Fu, Y.H.; Zhou, X.; Li, X.; Zhang, Y.; Geng, X.; Hao, F.; Zhang, X.; Hanninen, H.; Guo, Y.; De Boeck, H.J. Decreasing control of precipitation on grassland spring phenology in temperate China. Glob. Ecol. Biogeogr. 2021, 30, 490–499. [Google Scholar] [CrossRef]
  11. Piao, S.L.; Liu, Z.; Wang, T.; Peng, S.S.; Ciais, P.; Huang, M.T.; Ahlstrom, A.; Burkhart, J.F.; Chevallier, F.; Janssens, I.A.; et al. Weakening temperature control on the interannual variations of spring carbon uptake across northern lands. Nat. Clim. Chang. 2017, 7, 359–363. [Google Scholar] [CrossRef]
  12. Bardgett, R.D.; Bullock, J.M.; Lavorel, S.; Manning, P.; Schaffner, U.; Ostle, N.; Chomel, M.; Durigan, G.; Fry, E.L.; Johnson, D.; et al. Combatting global grassland degradation. Nat. Rev. Earth Environ. 2021, 2, 720–735. [Google Scholar] [CrossRef]
  13. Wilcox, K.R.; Shi, Z.; Gherardi, L.A.; Lemoine, N.P.; Koerner, S.E.; Hoover, D.L.; Bork, E.; Byrne, K.M.; Cahill, J.; Collins, S.L.; et al. Asymmetric responses of primary productivity to precipitation extremes: A synthesis of grassland precipitation manipulation experiments. Glob. Chang. Biol. 2017, 23, 4376–4385. [Google Scholar] [CrossRef] [PubMed]
  14. Ma, W.; He, J.-S.; Yang, Y.; Wang, X.; Liang, C.; Anwar, M.; Zeng, H.; Fang, J.; Schmid, B. Environmental factors covary with plant diversity–productivity relationships among Chinese grassland sites. Glob. Ecol. Biogeogr. 2010, 19, 233–243. [Google Scholar] [CrossRef]
  15. Knapp, A.K.; Fay, P.A.; Blair, J.M.; Collins, S.L.; Smith, M.D.; Carlisle, J.D.; Harper, C.W.; Danner, B.T.; Lett, M.S.; McCarron, J.K. Rainfall variability, carbon cycling, and plant species diversity in a mesic grassland. Science 2002, 298, 2202–2205. [Google Scholar] [CrossRef] [Green Version]
  16. Fernández-Martínez, M.; Sardans, J.; Chevallier, F.; Ciais, P.; Obersteiner, M.; Vicca, S.; Canadell, J.G.; Bastos, A.; Friedlingstein, P.; Sitch, S.; et al. Global trends in carbon sinks and their relationships with CO2 and temperature. Nat. Clim. Chang. 2019, 9, 73–79. [Google Scholar] [CrossRef] [Green Version]
  17. Fu, Z.; Stoy, P.C.; Luo, Y.; Chen, J.; Sun, J.; Montagnani, L.; Wohlfahrt, G.; Rahman, A.F.; Rambal, S.; Bernhofer, C.; et al. Climate controls over the net carbon uptake period and amplitude of net ecosystem production in temperate and boreal ecosystems. Agric. For. Meteorol. 2017, 243, 9–18. [Google Scholar] [CrossRef] [Green Version]
  18. Fu, G.; Shen, Z.-X.; Zhang, X.-Z. Increased precipitation has stronger effects on plant production of an alpine meadow than does experimental warming in the Northern Tibetan Plateau. Agric. For. Meteorol. 2018, 249, 11–21. [Google Scholar] [CrossRef]
  19. Li, M.; Wu, J.S.; Song, C.Q.; He, Y.T.; Niu, B.; Fu, G.; Tarolli, P.; Tietjen, B.; Zhang, X.Z. Temporal Variability of Precipitation and Biomass of Alpine Grasslands on the Northern Tibetan Plateau. Remote Sens. 2019, 11, 360. [Google Scholar] [CrossRef] [Green Version]
  20. Knapp, A.K.; Smith, M.D. Variation among biomes in temporal dynamics of aboveground primary production. Science 2001, 291, 481–484. [Google Scholar] [CrossRef] [Green Version]
  21. Dannenberg, M.P.; Wise, E.K.; Smith, W.K. Reduced tree growth in the semiarid United States due to asymmetric responses to intensifying precipitation extremes. Sci. Adv. 2019, 5, eaaw0667. [Google Scholar] [CrossRef] [PubMed] [Green Version]
  22. Qiu, T.; Song, C.H.; Clark, J.S.; Seyednasrollah, B.; Rathnayaka, N.; Li, J.X. Understanding the continuous phenological development at daily time step with a Bayesian hierarchical space-time model: Impacts of climate change and extreme weather events. Remote Sens. Environ. 2020, 247, 111956. [Google Scholar] [CrossRef]
  23. Chang, J.; Ciais, P.; Viovy, N.; Soussana, J.-F.; Klumpp, K.; Sultan, B. Future productivity and phenology changes in European grasslands for different warming levels: Implications for grassland management and carbon balance. Carbon Balance Manag. 2017, 12, 11. [Google Scholar] [CrossRef] [PubMed] [Green Version]
  24. Peng, S.Z.; Yu, K.L.; Li, Z.; Wen, Z.M.; Zhang, C. Integrating potential natural vegetation and habitat suitability into revegetation programs for sustainable ecosystems under future climate change. Agric. For. Meteorol. 2019, 269, 270–284. [Google Scholar] [CrossRef]
  25. Li, M.; Zhang, X.; Wu, J.; Ding, Q.; Niu, B.; He, Y. Declining human activity intensity on alpine grasslands of the Tibetan Plateau. J. Environ. Manag. 2021, 296, 113198. [Google Scholar] [CrossRef]
  26. Yao, T.; Thompson, L.G.; Mosbrugger, V.; Zhang, F.; Ma, Y.; Luo, T.; Xu, B.; Yang, X.; Joswiak, D.R.; Wang, W.; et al. Third Pole Environment (TPE). Environ. Dev. 2012, 3, 52–64. [Google Scholar] [CrossRef]
  27. Shen, M.; Piao, S.; Jeong, S.J.; Zhou, L.; Zeng, Z.; Ciais, P.; Chen, D.; Huang, M.; Jin, C.S.; Li, L.Z.; et al. Evaporative cooling over the Tibetan Plateau induced by vegetation growth. Proc. Natl. Acad. Sci. USA 2015, 112, 9299–9304. [Google Scholar] [CrossRef] [Green Version]
  28. Chen, H.; Zhu, Q.; Peng, C.; Wu, N.; Wang, Y.; Fang, X.; Gao, Y.; Zhu, D.; Yang, G.; Tian, J.; et al. The impacts of climate change and human activities on biogeochemical cycles on the Qinghai-Tibetan Plateau. Glob. Chang. Biol. 2013, 19, 2940–2955. [Google Scholar] [CrossRef]
  29. Wu, J.; Li, M.; Zhang, X.; Fiedler, S.; Gao, Q.; Zhou, Y.; Cao, W.; Hassan, W.; Mărgărint, M.C.; Tarolli, P.; et al. Disentangling climatic and anthropogenic contributions to nonlinear dynamics of alpine grassland productivity on the Qinghai-Tibetan Plateau. J. Environ. Manag. 2021, 281, 111875. [Google Scholar] [CrossRef]
  30. Yu, H.; Ding, Q.; Meng, B.; Lv, Y.; Liu, C.; Zhang, X.; Sun, Y.; Li, M.; Yi, S. The Relative Contributions of Climate and Grazing on the Dynamics of Grassland NPP and PUE on the Qinghai-Tibet Plateau. Remote Sens. 2021, 13, 3424. [Google Scholar] [CrossRef]
  31. Cai, H.; Yang, X.; Xu, X. Human-induced grassland degradation/restoration in the central Tibetan Plateau: The effects of ecological protection and restoration projects. Ecol. Eng. 2015, 83, 112–119. [Google Scholar] [CrossRef]
  32. Lehnert, L.W.; Wesche, K.; Trachte, K.; Reudenbach, C.; Bendix, J. Climate variability rather than overstocking causes recent large scale cover changes of Tibetan pastures. Sci. Rep. 2016, 6, 24367. [Google Scholar] [CrossRef] [PubMed] [Green Version]
  33. Zeng, N.; Ren, X.L.; He, H.L.; Zhang, L.; Zhao, D.; Ge, R.; Li, P.; Niu, Z.E. Estimating grassland aboveground biomass on the Tibetan Plateau using a random forest algorithm. Ecol. Indic. 2019, 102, 479–487. [Google Scholar] [CrossRef]
  34. Zhang, L.; Zhou, G.; Ji, Y.; Bai, Y. Spatiotemporal dynamic simulation of grassland carbon storage in China. Sci. China Earth Sci. 2016, 59, 1946–1958. [Google Scholar] [CrossRef]
  35. You, Q.; Fraedrich, K.; Ren, G.; Pepin, N.; Kang, S. Variability of temperature in the Tibetan Plateau based on homogenized surface stations and reanalysis data. Int. J. Climatol. 2013, 33, 1337–1347. [Google Scholar] [CrossRef] [Green Version]
  36. Hutchinson, M. Anusplin; Version 4.3; Centre for Resource and Environmental Studies, The Australian National University: Canberra, Australia, 2004. [Google Scholar]
  37. Jiao, W.; Wang, L.; Smith, W.K.; Chang, Q.; Wang, H.; D’Odorico, P. Observed increasing water constraint on vegetation growth over the last three decades. Nat. Commun. 2021, 12, 3777. [Google Scholar] [CrossRef]
  38. Potter, C.S.; Randerson, J.T.; Field, C.B.; Matson, P.A.; Vitousek, P.M.; Mooney, H.A.; Klooster, S.A. Terrestrial ecosystem production: A process model based on global satellite and surface data. Glob. Biogeochem. Cycles 1993, 7, 811–841. [Google Scholar] [CrossRef]
  39. Chen, B.; Zhang, X.; Tao, J.; Wu, J.; Wang, J.; Shi, P.; Zhang, Y.; Yu, C. The impact of climate change and anthropogenic activities on alpine grassland over the Qinghai-Tibet Plateau. Agric. For. Meteorol. 2014, 189-190. [Google Scholar] [CrossRef]
  40. Gao, X.X.; Dong, S.K.; Li, S.; Xu, Y.D.; Liu, S.L.; Zhao, H.D.; Yeomans, J.; Li, Y.; Shen, H.; Wu, S.N.; et al. Using the random forest model and validated MODIS with the field spectrometer measurement promote the accuracy of estimating aboveground biomass and coverage of alpine grasslands on the Qinghai-Tibetan Plateau. Ecol. Indic. 2020, 112, 106114. [Google Scholar] [CrossRef]
  41. Hu, Z.; Piao, S.; Knapp, A.K.; Wang, X.; Peng, S.; Yuan, W.; Running, S.; Mao, J.; Shi, X.; Ciais, P.; et al. Decoupling of greenness and gross primary productivity as aridity decreases. Remote Sens. Environ. 2022, 279, 113120. [Google Scholar] [CrossRef]
  42. Yang, S.; Feng, Q.; Liang, T.; Liu, B.; Zhang, W.; Xie, H. Modeling grassland above-ground biomass based on artificial neural network and remote sensing in the Three-River Headwaters Region. Remote Sens. Environ. 2018, 204, 448–455. [Google Scholar] [CrossRef]
  43. Doughty, C.E.; Metcalfe, D.B.; Girardin, C.A.J.; Amézquita, F.F.; Cabrera, D.G.; Huasco, W.H.; Silva-Espejo, J.E.; Araujo-Murakami, A.; da Costa, M.C.; Rocha, W.; et al. Drought impact on forest carbon dynamics and fluxes in Amazonia. Nature 2015, 519, 78–82. [Google Scholar] [CrossRef] [Green Version]
  44. Chen, Y.; Feng, X.; Tian, H.; Wu, X.; Gao, Z.; Feng, Y.; Piao, S.; Lv, N.; Pan, N.; Fu, B. Accelerated increase in vegetation carbon sequestration in China after 2010: A turning point resulting from climate and human interaction. Glob. Chang. Biol. 2021, 27, 5848–5864. [Google Scholar] [CrossRef] [PubMed]
  45. Huang, K.; Zhang, Y.; Zhu, J.; Liu, Y.; Zu, J.; Zhang, J. The Influences of Climate Change and Human Activities on Vegetation Dynamics in the Qinghai-Tibet Plateau. Remote Sens. 2016, 8, 876. [Google Scholar] [CrossRef] [Green Version]
  46. Sun, J.; Qin, X.; Yang, J. The response of vegetation dynamics of the different alpine grassland types to temperature and precipitation on the Tibetan Plateau. Environ. Monit. Assess. 2016, 188, 20. [Google Scholar] [CrossRef] [PubMed] [Green Version]
  47. Shen, M.; Piao, S.; Cong, N.; Zhang, G.; Jassens, I.A. Precipitation impacts on vegetation spring phenology on the Tibetan Plateau. Glob. Chang. Biol. 2015, 21, 3647–3656. [Google Scholar] [CrossRef] [Green Version]
  48. Li, L.; Zhang, Y.; Liu, L.; Wu, J.; Wang, Z.; Li, S.; Zhang, H.; Zu, J.; Ding, M.; Paudel, B. Spatiotemporal Patterns of Vegetation Greenness Change and Associated Climatic and Anthropogenic Drivers on the Tibetan Plateau during 2000–2015. Remote Sens. 2018, 10, 1525. [Google Scholar] [CrossRef] [Green Version]
  49. Sun, J.; Cheng, G.; Li, W.; Sha, Y.; Yang, Y. On the Variation of NDVI with the Principal Climatic Elements in the Tibetan Plateau. Remote Sens. 2013, 5, 1894. [Google Scholar] [CrossRef] [Green Version]
  50. Forkel, M.; Migliavacca, M.; Thonicke, K.; Reichstein, M.; Schaphoff, S.; Weber, U.; Carvalhais, N. Codominant water control on global interannual variability and trends in land surface phenology and greenness. Glob. Chang. Biol. 2015, 21, 3414–3435. [Google Scholar] [CrossRef]
  51. Garonna, I.; de Jong, R.; Stöckli, R.; Schmid, B.; Schenkel, D.; Schimel, D.; Schaepman, M.E. Shifting relative importance of climatic constraints on land surface phenology. Environ. Res. Lett. 2018, 13, 024025. [Google Scholar] [CrossRef] [Green Version]
  52. Hao, Y.B.; Zhou, C.T.; Liu, W.J.; Li, L.F.; Kang, X.M.; Jiang, L.L.; Cui, X.Y.; Wang, Y.F.; Zhou, X.Q.; Xu, C.Y. Aboveground net primary productivity and carbon balance remain stable under extreme precipitation events in a semiarid steppe ecosystem. Agric. For. Meteorol. 2017, 240–241, 1–9. [Google Scholar] [CrossRef]
  53. Yao, T.D. Tackling on environmental changes in Tibetan Plateau with focus on water, ecosystem and adaptation. Sci. Bull. 2019, 64, 417. [Google Scholar] [CrossRef] [Green Version]
  54. Piao, S.; Nan, H.; Huntingford, C.; Ciais, P.; Friedlingstein, P.; Sitch, S.; Peng, S.; Ahlstrom, A.; Canadell, J.G.; Cong, N.; et al. Evidence for a weakening relationship between interannual temperature variability and northern vegetation activity. Nat. Commun. 2014, 5, 5018. [Google Scholar] [CrossRef] [PubMed] [Green Version]
  55. Fu, Z.; Ciais, P.; Bastos, A.; Stoy, P.; Yang, H.; Green, J.; Wang, B.; Yu, K.; Huang, Y.; Knohl, A.; et al. Sensitivity of gross primary productivity to climatic drivers during the summer drought of 2018 in Europe. Philos. Trans. R. Soc. B Biol. Sci. 2020, 375, 20190747. [Google Scholar] [CrossRef]
  56. Yuan, W.; Zheng, Y.; Piao, S.; Ciais, P.; Lombardozzi, D.; Wang, Y.; Ryu, Y.; Chen, G.; Dong, W.; Hu, Z.; et al. Increased atmospheric vapor pressure deficit reduces global vegetation growth. Sci. Adv. 2019, 5, eaax1396. [Google Scholar] [CrossRef] [Green Version]
  57. Li, X.; Piao, S.; Wang, K.; Wang, X.; Wang, T.; Ciais, P.; Chen, A.; Lian, X.; Peng, S.; Peñuelas, J. Temporal trade-off between gymnosperm resistance and resilience increases forest sensitivity to extreme drought. Nat. Ecol. Evol. 2020, 4, 1075–1083. [Google Scholar] [CrossRef]
  58. Poulter, B.; Frank, D.; Ciais, P.; Myneni, R.B.; Andela, N.; Bi, J.; Broquet, G.; Canadell, J.G.; Chevallier, F.; Liu, Y.Y.; et al. Contribution of semi-arid ecosystems to interannual variability of the global carbon cycle. Nature 2014, 509, 600–603. [Google Scholar] [CrossRef] [Green Version]
  59. Lu, X.; Wang, L.; McCabe, M.F. Elevated CO2 as a driver of global dryland greening. Sci. Rep. 2016, 6, 20716. [Google Scholar] [CrossRef] [Green Version]
  60. Luo, X.; Jia, B.; Lai, X. Contributions of climate change, land use change and CO2 to changes in the gross primary productivity of the Tibetan Plateau. Atmos. Ocean. Sci. Lett. 2020, 13, 8–15. [Google Scholar] [CrossRef] [Green Version]
Figure 1. Spatial distribution of (a) grassland types and (b) arid, semi-arid, sub-humid, and humid regions.
Remotesensing 14 03430 g001
Figure 2. Spatial patterns of the trends in (a) GST, (b) GSP, (c) NDVI, and (d) NPP from 2000 to 2019 on the Tibetan Plateau.
Remotesensing 14 03430 g002
Figure 3. Spatial patterns of the correlations of alpine-grassland productivity with GST and GSP over the last two decades. (a) shows the spatial distribution of the partial correlation coefficients of NDVI with the GSP (RNDVI-GSP) and GST (RNDVI-GST). (b) shows the partial correlation coefficients of NPP with GSP (RNPP-GSP) and GST (RNPP-GST) for the entire study period. (cf) are the statistical distributions of RNDVI-GSP, RNDVI-GST, RNPP-GSP, and RNPP-GST for arid, semi-arid, sub-humid, and humid regions, respectively. A letter above the box indicates significant difference at the level of p < 0.05.
Remotesensing 14 03430 g003
Figure 4. The relationship of spatially averaged NDVI and NPP with climate. (a,b) Changes in the partial correlation coefficient of (c) NDVI and (f) NPP with GSP and GST after applying 10-year moving windows. The x-axis in (a,b) indicates the central year of the 10-year moving window (e.g., 2005 represent a moving window 2000–2009).Lines in this figure are the fitting lines of least square regression. (cf) The statistical distributions of the trend of the partial correlation coefficient of NDVI and NPP with GSP and GST for arid, semi-arid, sub-humid, and humid regions.
Remotesensing 14 03430 g004
Figure 5. Spatial patterns of RNDVI-GSP (blue) and RNDVI-GST (red) (a) in 2000–2009 and (c) in 2010–2019 and RNPP-GSP and RNPP-GST (d) in 2000–2009 and (f) in 2010–2019. (b,e) Changes in the area from 2000–2009 to 2010–2019 regarding the factor, either GSP or GST, controlling (b) NDVI and (e) NPP variations.
Remotesensing 14 03430 g005
Figure 6. The relationships of the trends in the (a) RNDVI-GSP and (b) RNPP-GSP with trends in SEPI for 32 meteorological stations. Lines in this figure are the fitting lines of least square regression, and shadows represent 95% confidence intervals.
Remotesensing 14 03430 g006
Table 1. Fraction of grassland with different change trends in GST, GSP, NDVI, and NPP of the entire plateau and within arid, semi-arid, sub-humid, and humid regions. Signs of +/*, +/ns, −/*, and −/ns indicate significant increasing, insignificant increasing, significant decreasing, and insignificant decreasing, respectively, at a level of p < 0.05.
TrendsGSTGSPNDVINPP
Tibetan Plateau+/*30.41242.236.3
+/ns46.963.937.344.3
−/*0.203.32
−/ns22.524.117.317.4
Arid+/*5.62.952.844.4
+/ns6887.432.641.4
−/*0.602.11.3
−/ns25.89.712.512.9
Semi-arid+/*26.111.838.730.9
+/ns44.655.635.243.6
−/*004.83.1
−/ns29.232.621.322.3
Sub-humid+/*78.418.327.728.6
+/ns16.84650.252.7
−/*002.51.2
−/ns4.835.719.617.5
Humid+/*84.237.233.136.6
+/ns12.733.548.549
−/*0021
−/ns3.229.316.313.3
Publisher’s Note: MDPI stays neutral with regard to jurisdictional claims in published maps and institutional affiliations.

