1. Introduction
Soft asbestos fibers are utilized for their insulation, heat, and corrosion resistance properties, and they were widely used in construction, electrical appliances, automobiles, household goods, etc., in the 1960s and 1970s. With the progress of medical and health science and technology, research reports have emerged showing that asbestos fibers may be harmful to the human body, and that the inhalation of asbestos dust can lead to lung fibrosis and may also induce malignant tumors. The World Health Organization’s (WHO) International Cancer Research Institute (IARC) has listed asbestos as a level 1 carcinogen, and pointed out that long-term exposure to asbestos can cause lung, throat, and ovarian cancer, and mesothelioma. Encountering asbestos can also cause other diseases, such as asbestos lung (pulmonary fibrosis), thoracic plaque, thoracic thickening, and thoracic fluid. Asbestos is a first-class carcinogen, and the world has gradually reduced or even banned its use. Taiwan’s Ministry of the Economy (MOE) officially banned the use of asbestos in fire-resistant materials in 2006. To ensure labor safety and protect surrounding residents’ health, finding the number and location of asbestos roof tiles is the top priority when considering the demolition and replacement of such construction materials. Performing an island-wide asbestos-roof-tile baseline investigation of at least 85% accuracy in a short period of time with historical data has become a challenging task for the remote sensing community in Taiwan.
The national remote sensing imagery cube served as the primary data source, providing archived 25 cm resolution aerial RGB imagery, multi-band Sentinel-1 and 2, and some aerial hyperspectral data. The Sentinel-1 and 2 satellites offer three days revisit and 12 bands of data at different resolutions [
1], and were used in this study to detect the amount and location of asbestos corrugated roof tiles in Taiwan. The fusion of various resolution images with the least square error method was applied on different sizes of images to obtain a satisfying result [
2] The investigation required both texture and spectrum information from higher-resolution RGB images to separate the asbestos and steel corrugated roof tiles. Meanwhile, the spectrum response was used to distinguish asbestos corrugated roof tiles from cement roof tiles. There are more than 7000 ortho-rectified images with 25 cm ground sampling resolution to cover the entire island of Taiwan, which has an area of 36,000 km
2. However, multi-band data were still needed to distinguish the asbestos roof tiles from the cement roof tiles due to their similar optical features. This work established a ground-truth dataset that contained more than 400 asbestos roof tiles via hyperspectral image classification and ground validation. Forty samples from this dataset were examined by X-ray diffraction (XRD) to confirm the existence of asbestos. The boundaries of the roofs were detected and superimposed on the multi-band Sentinel-2 satellite imagery data as well as aerial photos. Both the convolutional neural network (CNN) and support vector machines (SVM) of machine learning were imported to handle the loose target detection task of finding the borders of the asbestos corrugated roof tiles from the combined images. A total of 24,000 buildings with asbestos roofs were discovered, representing about 2.7% of the total buildings on the island, and an 82% identification accuracy was determined through random in situ inspections by independent third-party personnel.
2. Related Work
Asbestos roof tiles have been successfully detected via the fusion of RGB and color infrared (CIR) aerial photos at a resolution of 25 cm using CNN algorithms [
3]. Another example of applying 8-channel WorldView-2 satellite images and the digital terrain model (DTM) to identify asbestos roof tiles revealed an accuracy of around 70–80% [
4]. Object-based image analysis (OBIA) with WordlView-2 images has also been used to map the presence of asbestos roofs, with an overall accuracy of around 80% [
5]. The identification of different roof types and determination of those with asbestos components were achieved using high-ground and spectral (126 bands) resolution airborne hyperspectral imagery (AISA Eagle II). This method resulted in accurate maps of the roof types, and asbestos-cement roofs were identified with over 85% accuracy [
6]. Multispectral infrared and visible imaging spectrometry (MIVIS) can detect asbestos-cement roofs in urban areas, with an average producer’s accuracy (PA) of 86% and a user’s accuracy (UA) of 89% [
7]. Quantitative mapping of asbestos cement covering a large region of the Western Alps in Italy was performed using multispectral infrared and visible imaging spectrometer sensors. The results showed an overall mapping accuracy of 80% in terms of the asbestos-cement surfaces detected [
8]. A hyperspectral scanner with suitable operational characteristics could allow for good clustering of asbestos-cement roofs as a function of their deterioration status, and be used to evaluate their deterioration status related to the asbestos fiber [
9]. A QGIS plugin via WorldView-3 imagery was used to automatically classify asbestos roofing, with an overall accuracy of around 82% [
10].
The above findings were carried out using automatic algorithms together with high resolution, multi-band remote sensing images. From the technical point of view, if the resolution of imagery is fulfilled by minimum request, the accuracy of the asbestos roof tile classification result should be assured by using modern technology. In practice, when investigating asbestos roof tile distribution over the thousands of square kilometers covering Taiwan, it is difficult to collect the same kinds of remote sensing images with the least time lag and at an affordable cost. WorldView-3 can acquire panchromatic images at a 0.31 m maximum spatial resolution using eight visible and near-infrared (VNIR) bands at a 1.24 m maximum spatial resolution and eight short-wave infrared (SWIR) bands at 3.7 m [
11]. With this kind of resolution plus the spectrum information, the archived worldview-2 and 3 images could serve as the fundamental dataset to map the distribution of asbestos-cement corrugated roofing tiles. However, variations in the image tasking time and the inability to cover the target area using the same remote sensing instrument are major drawbacks that need to be addressed. The images of aged asbestos roof tiles include patches, water stains, and moss coverage, as well as shadows from nearby trees and construction. These phenomena alter the optical texture of asbestos-cement corrugated roofing tiles and could contaminate the classification results. Traditional supervised classification cannot locate such regions as the target; therefore, this study used machine learning combined with spectral and visible information to overcome the above-mentioned defects.
3. Testing Site and Methodology
The population of Taiwan is around 24 million, and the total number of buildings is 8.81 million. Most of the residential area is located at an altitude of less than 700 m, and represents one-third of the area of Taiwan. The distribution of resident regions on top of elevation contours is shown in
Figure 1, in which examples of the crowded residential houses and large varieties of roof types are also illustrated. The workflow of this study is demonstrated in
Figure 2. There were three major parts: establishing the ground-truth database, partitioning the images, and using artificial intelligence (AI) to identify various types of images from the official image cubes of Taiwan. Establishing the ground-truth database was the first step in mapping the asbestos-cement corrugated roofing tiles via remote sensing. This database needed to have an adequate quantity of data and complete coverage of all the various types of asbestos tile. To ensure the accuracy of the database, archived aerial hyperspectral scanning data covering about one-tenth of Taiwan were utilized. Hyperspectral data could identify the asbestos-cement corrugated roofing tiles by local peak bandwidths of 410, 550, 670, 740, 870, 990, 1310, 1700, 1840, 2130, 2200, and 2700 nm, and the maximum difference in reflectance between asbestos and other roofing could be found by studying APEX airborne hyperspectral data [
12]. Thirty samples from 400 chosen locations were directly examined via hyperspectral and X-ray diffusion (XRD) to confirm the existence of asbestos. The sample locations and steps of ground data gathering are shown in
Figure 3. The initial ground-truth database had an accuracy of 90%, as validated through the independent inspection and the sampled locations scattered around the entire island to guarantee the completeness of coverage. Databases were updated by replacing the erroneous contents to achieve 100% accuracy before running the classification task. Then, archived aerial RGB photos and Sentinel-2 satellite images from these target locations were superposed to reveal not only the special texture but also bandwidth characters of the asbestos-cement corrugated roofing tiles. Then the portion images of building rooftops were partitioned by combining the eCongnition feature exaction function and boundary detection method. These 400 reserved images were labeled as the true dataset in the training model; meanwhile, a set of another 400 images of non-asbestos roof tiles were taken from the same image frames and labeled as false.
Deep learning is a machine learning method that imitates the human brain in processing data and learning. Compared to traditional machine learning methods, it requires more samples and computing power but offers better learning results. With the computer hardware advancements of the past two decades, especially the rapid development of graphics processing units (GPUs), the required time to train the network model has been greatly reduced, giving deep learning a significant step forward in the field of image recognition. To increase the classification result accuracy ratio, SVM and CNN were deployed as machine learning methods in this work. The same ground-truth database was applied to the same image set with each of these two methods to find the regions with asbestos-cement corrugated roofing tiles, as these two methods have been demonstrated to have high accuracy and efficiency in hyperspectral image classification [
13]. SVM is a classification approach, but it can be employed in both classification and regression problems, as it can easily handle multiple continuous and categorical variables. SVM constructs a hyperplane in multidimensional space for separating different classes, and it generates the optimal hyperplane in an iterative manner to minimize errors. The fundamental idea of SVM is to find a maximum marginal hyperplane (MMH) that can best divide a dataset into various classes. The SVM model aims to draw decision boundaries between data points from different classes and separate them with the maximum margin for handling both linear and non-linear data. A 400-image labeled ground-truth dataset was trained for the SVM method via TensorFlow-based Keras Python open-source code. Then the radial basis function (RBF) was adopted to solve the classifier during nonlinear classification [
13]. Features within the ground-truth datasets were adopted for the SVM method as the searching references. As for the optimization procedure, SVM procedures sought the best parameter, γ, of the RBF function along with the best regularization parameter, C. The combinations of the optimal γ and C values were sorted so the impact would be high enough to have a resulting surface without misclassifying the training set, which minimized the over-prediction. Cross-validation was performed by developing a multi-class SVM model that relied on different training/testing sets in several rounds. To ensure the best possible optimization, this study first performed a grid search across five orders of magnitude in a logarithmic scale for varying C (from e
+1 to e
+5) and γ (from e
−1 to e
−6) values. Then, 100 rounds of cross-validation were performed for the multi-class SVM. In some cases, two types of roofs were misclassified due to their similar features. These types were defined as difficult pairs, as it was difficult to distinguish between them. Another binary class SVM was then used to better distinguish between these roof types. In this study, 100 rounds of cross-validation were performed. For the hybrid multi-stage SVM model, the multi-class model was run first during each round of cross-validation. If the obtained result happened to be one of the difficult pairs, the results were then fed into a binary-class SVM to separate the difficult pairs. This concatenated method was not performed, and the process would be stopped after the multi-class SVM if the outcome roof type was not from a difficult pair [
14].
CNNs is an artificial neural network used for deep learning, generally in the analysis of visual images, including face recognition and object recognition. CNN capture features in images using fewer parameters, making them better in operation than other methods. The architecture of a CNN mainly includes convolution, pooling, flattening, and fully connected feedforward network layers [
15]. For the input hyperspectral image after principal component analysis transformation, the neighborhood pixels around central pixel
i were extracted at
n scales. Then, the specific CNN models were applied at each scale to extract high-level features that were more abstract than the size of the output vector. Finally, the feature vectors were concatenated into a single feature vector, which could be used as an input for a fully connected layer to perform classification [
13]. This study uses OTBTF software as an automatic image classification tool of CNN, an extension of the Orfeo ToolBox with TensorFlow [
16]. Orfeo ToolBox (OTB) is an open-source library tool for satellite image processing written in C++ developed by the French National Space Research Center [
17,
18], while TensorFlow is a deep learning software library originally developed by the Google Brain team and released in 2015.
Figure 4 shows the operation flow chart of the image recognition using OTBTF. First, the image feature block extraction was carried out using the ground-truth data point layer, in which multiple image sources could be applied simultaneously. Then the network model was configured according to the image size, feature, number of layers, and network class. Typical feature blocks were used for network training until convergence, and the trained network model was employed to classify the image features for the entire area. The types of imported images and detailed data attributes from the official image cube of Taiwan are illustrated in
Figure 5. Historical aerial orthorectified photos at a resolution of 25 cm and up-to-date Sentinel-2 images were the fundamental data sources for the task; meanwhile, the hyperspectral images, which only covered portions of Taiwan and served to establish the ground-truth database, were also listed.
Proposed locations of asbestos-cement corrugated roofing tiles from both the CNN and SVM methods were grouped as truth–truth (TT); locations where they are not detected by either of the methods are grouped as false–false (FF). Locations detected by only one method were grouped as truth–false (TF) as described [
19], and the locations in this group were re-examined by either Google Street view or Unmanned Aviation Vehicle (UAV) images to ensure accuracy. Archived aerial orthorectified photos taken from 2008 to 2020 were used, and the most recent Sentinel-2 images were precisely geocoded via 5000 ground control points (GCP). The asbestos roofs existing in the historical aerial photos but no longer existing today were ruled out by AI for non-agreement between the texture and spectrum subsets of these two data sources. Only the portions of the images that were identified as asbestos-cement corrugated roofing tiles using both methods were marked. A demonstration of this special feature target detection is shown in
Figure 6, in which an omission error was found via a manual check using Google Street view. It was found that the performance of the AI code played an essential role in converting the microstructural patterns of the input images into their digital descriptors; nevertheless, an independent check was required to improve the accuracy rate. The status of the asbestos-cement corrugated roofing tiles was the key factor affecting the classified results and was revealed by examining the mismatched images from these two methods. The most common causes for the misinterpretations were patches, water stains, and the presence of moss on top of the asbestos-cement corrugated roofing tiles, which altered the image features. Irregular boundary polygons marked by the joint AI method were then expanded into the roof edge by the wavelet method [
20] for measuring area. Polygons of the asbestos-cement corrugated roofing tile locations are represented in pink as the final block of
Figure 6.
Confusion metrics were used to evaluate the prediction quality by calculating each round of cross-validation, from which we derived the counts for the true positive (TP), false positive (FP), true negative (TN), and false negative (FN) cases. Due to the nature of multi-classification, we computed the values for each class label from an
M ×
M confusion matrix as follows. Let
CM ×
M be the confusion matrix for
M types of roofs, where the rows represent the actual class label, and the columns stand for the predicted labels. The accuracy of classification results shows by statistical verification; it clearly presents the number of correct and false predictions within the confusion matrix.
Table 1 shows a simple binary classification confusion matrix as an example. After completing the classification of the image features, it was necessary to further evaluate the correctness of the classification results. This study used the following commonly used analysis indicators: the overall classification accuracy, the kappa coefficient, the precision, the recall, and the F-score. The overall classification accuracy represents the percentage of check points in the correct land cover category after classification divided by the total number of check points extracted; that is, the percentile produced by the sum of all values of the diagonal line in the error matrix divided by the sum of all samples. Because of its good classification result, it should be able to balance both accuracy and recall. The F-score is an evaluation factor that considers both accuracies, and the pixel score can be determined by the following.
In general, when the accuracy rate is the same as the recall weight (
β = 1), it can be changed to:
Due to the results of the automatic classification of images, there were still misclassified results that needed to be further reviewed and edited by manual review. Then the correct classified results were fed back to the labeled dataset, thus altering the AI computing parameters automatically. Using the results of SVM and CNN, after comparison, it was found that the SVM missed some judgments, but the CNN results were successfully classified; therefore, after manual correction and the elimination of objects that had been misjudged as asbestos-cement corrugated roofing tiles, the correct classification could be obtained.
Table 1.
A simple binary classification confusion matrix.
Table 1.
A simple binary classification confusion matrix.
| | Actual Class |
|---|
| Positive | Negative |
|---|
| Predict class | Positive | TP | FP |
| Negative | FN | TN |
The precision, recall, and F-score assessment values of the asbestos-cement corrugated roofing tile classification are listed in
Table 2. The values all reached 0.8 or above, showing that the automatic identification classification model with composed images had good identification ability. The kappa value of 0.72 for the overall validation data evaluation was the result of applying the same method to high-resolution aerial photos, as illustrated in
Figure 7. Combining the aerial photo with SVM resulted in higher accuracy than applying the same method to the Sentinel-2 satellite image. Meanwhile, using CNN on the joint set of aerial and satellite photos had the best classified accuracy rate. The above accuracy estimations were carried out by self-validation using randomly chosen training and validating points via SVM and CNN, as demonstrated in
Figure 8 and
Figure 9, respectively. If the matching accuracy rate was lower than the threshold, the parameters were altered to predict another location set until the threshold was fulfilled. The different natures of the SVM and CNN algorithms meant that they selected various target points with the same labeled training data; CNN required more data points to model an outcome with the same accuracy level of kappa, which is why CNN required 1.5 times the processing time of SVM.
4. Conclusions
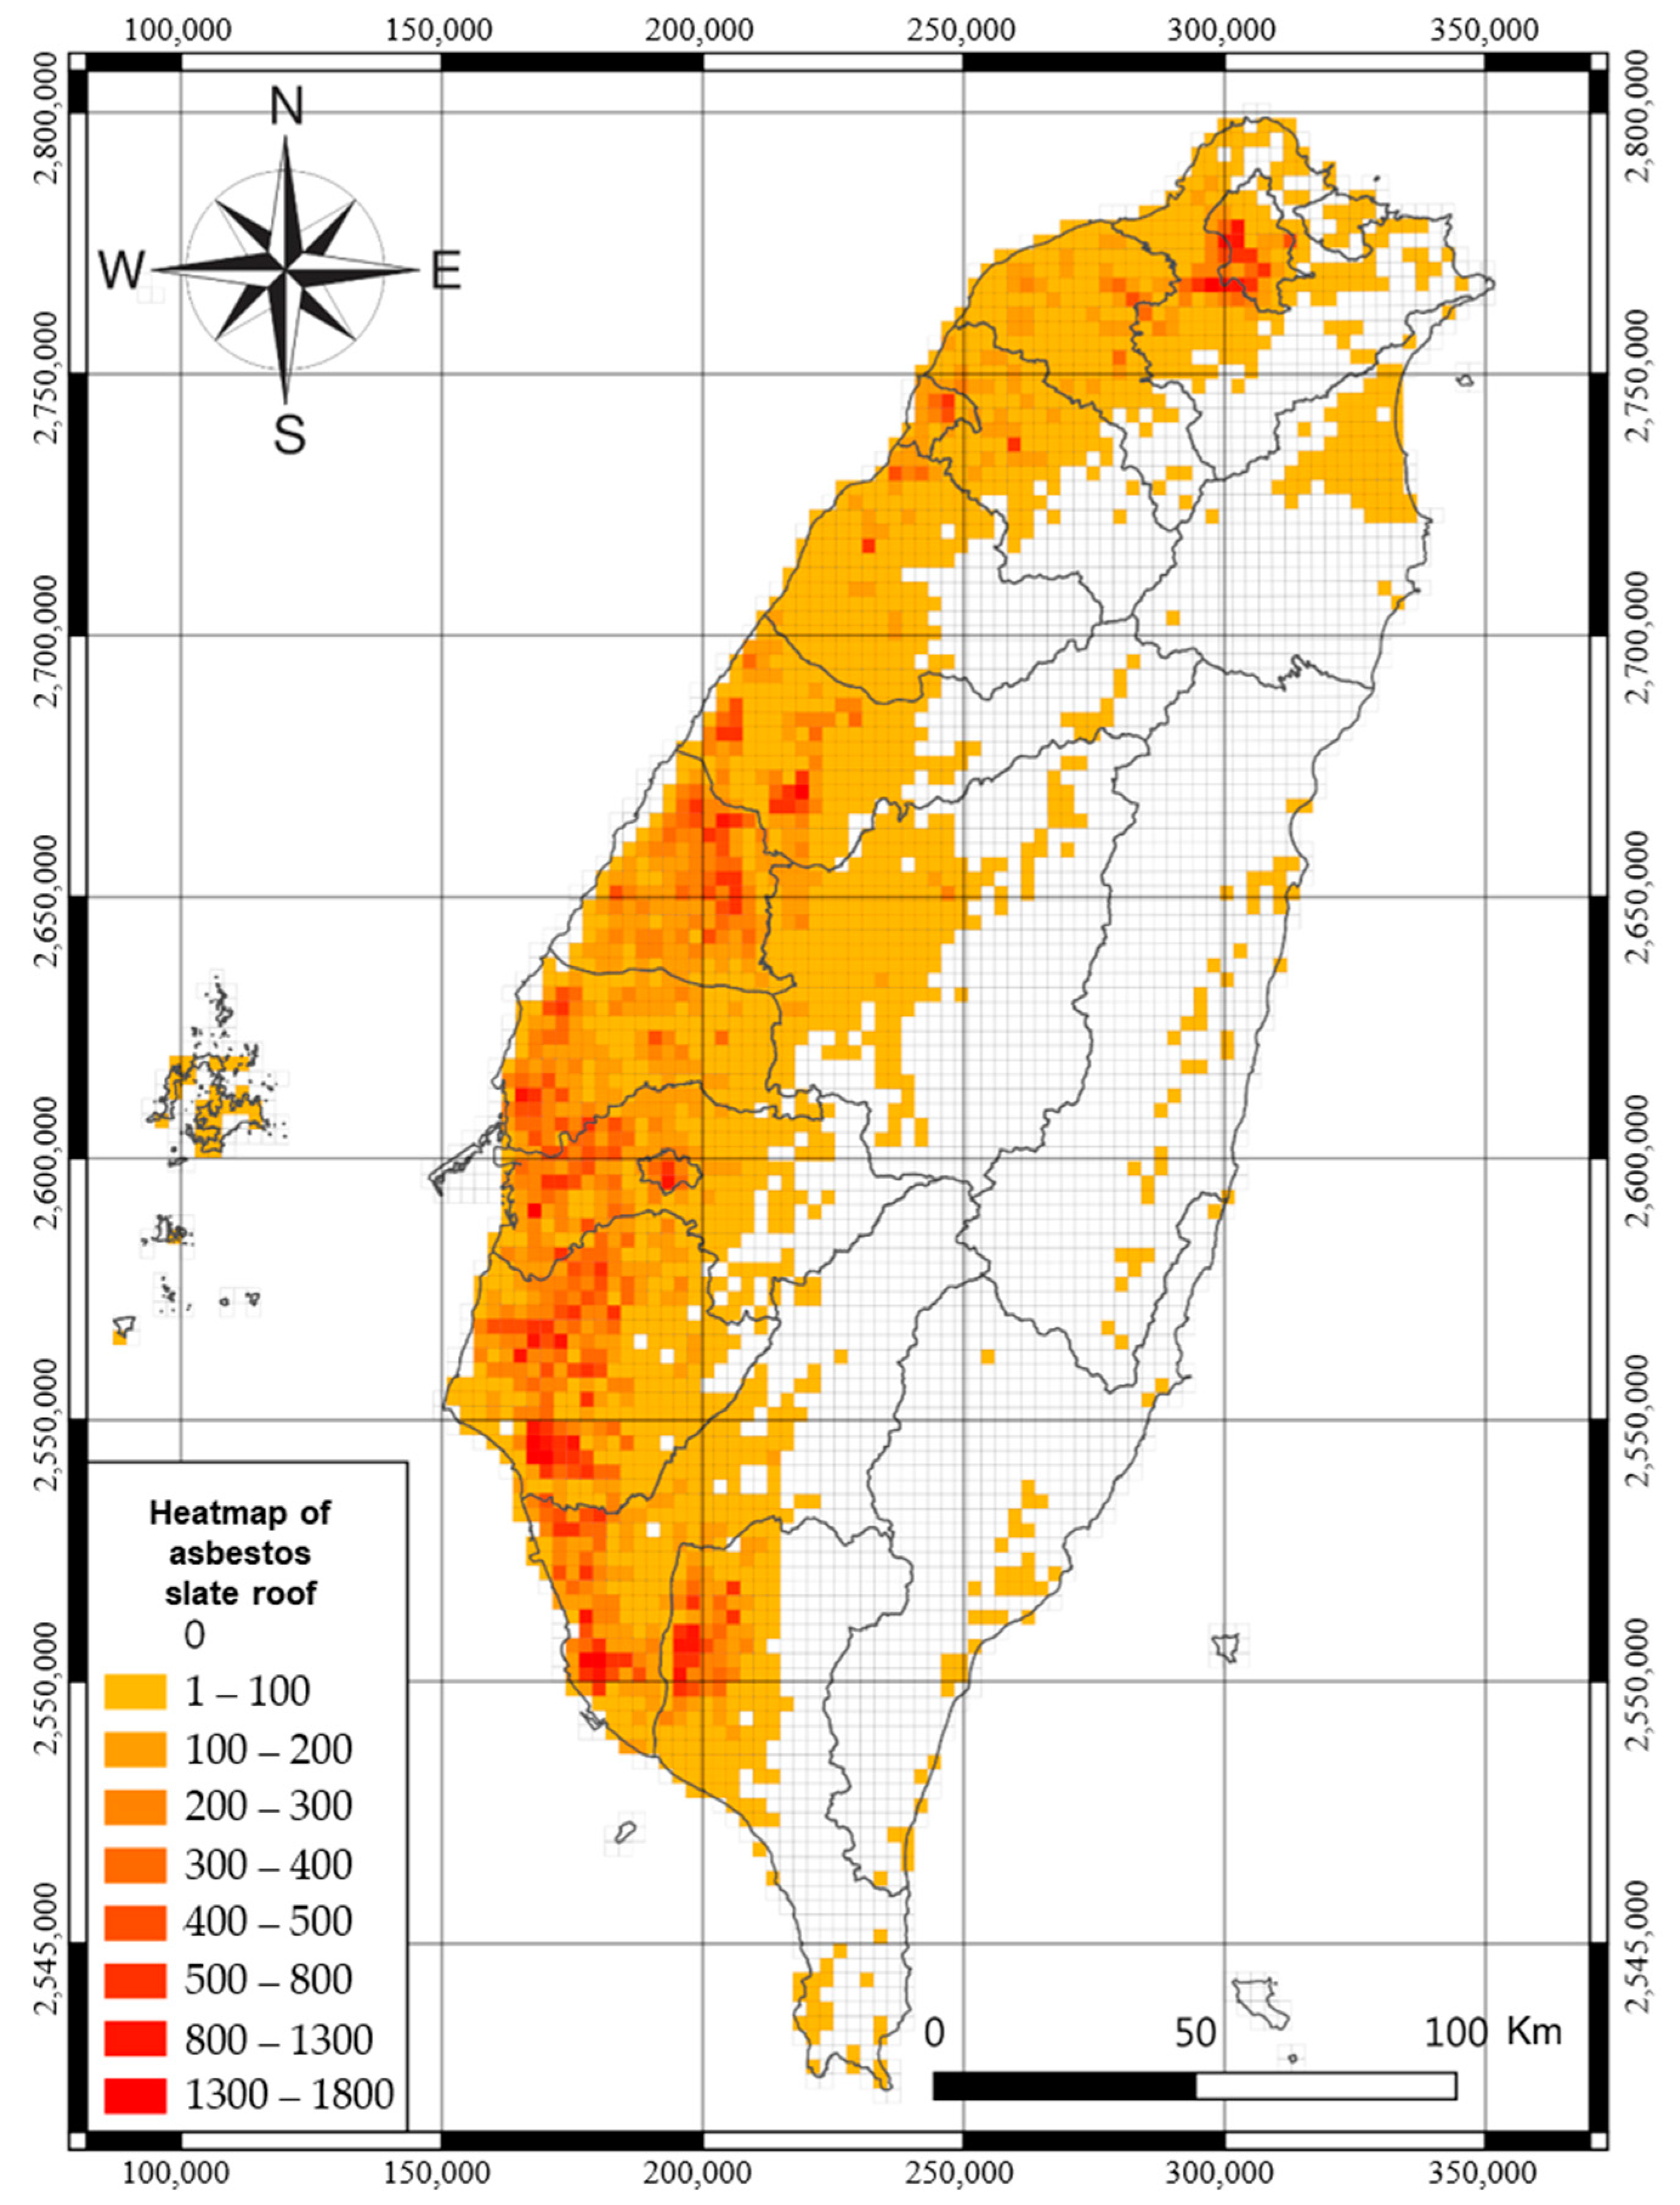
Precise and complete coverage of the ground truth database obtained by aerial hyperspectral scanning established the foundation for this work, with AI roof-type identification accuracy of over 85% via historical image cube in Taiwan. SVM had the highest classification accuracy for the aerial photos due to its high spatial resolution; meanwhile, CNN was able to automatically classify the joint historical aerial photos and Sentinel-2 images to acquire the up-to-date status of the asbestos-cement corrugated roofing tiles. Machine learning was used to stitch the historical but high-resolution aerial photos to the recently acquired satellite images and perform the loose target detection task, resulting in the identification of more than 230,000 asbestos-cement corrugated roofing tiles in Taiwan within 18 months. The locations and distribution of these tiles are shown in
Figure 10. Wherever an asbestos-cement corrugated roofing tile was larger than four pixels (50 × 50 cm) in an aerial photo, it was detectable by this approach. This study examined 120 randomly chosen points to ensure the accuracy of the resulting database, and found that 112 points were correctly classified, and eight points were misjudged. No cases of missed judgments were found. The 93% accuracy rate was higher than the kappa value derived from the confusion matrix, demonstrating the errors within the classification system were minor and not obvious.
This work demonstrated a possible solution to detecting features or characters from images with inadequate resolution and removing no-longer existing buildings by comparing two remote sensing datasets with machine learning. The coverage and completeness of the ground-truth database were the key issues in the successful classification of the large quantities of data, and aerial hyperspectral scanners were found to be a suitable tool to provide the significant bandwidth information needed to separate the asbestos-cement corrugated roofing tiles from cement roofing tiles. Although the WorldView or UAV images had sufficient resolution to perform the classification, these types of images are not always available for large areas, not to mention the difficulty of acquiring all the images within a short period of time. Traditional image classification only handles one type of image and then superposes various classified results pixel by pixel, which requires three working steps and long computer processing times. The machine learning algorithms developed in this work could handle only portions of the images, which reduced the need for computer memory and GPU loading. Since the ground-truth database was spread around the entire island of Taiwan and had complete coverage of various types of asbestos-cement corrugated roofing tiles, it could be used for universal training in the classifying tasks, meaning no extra model training was required when the data sources and target features had the same specification. This was the first study to locate and estimate the amount of asbestos-cement corrugated roofing tiles in a large area (more than 36,000 km
2) using cheaper historical and free satellite images, and the results could provide support for developing decision-making strategies and removal policies. For a 5 km
2 image set, it only took hours to run the SVM classification code with an entry-level 64 gigabytes GPU computer, which required about 1.5 times that time for running the corresponding CNN code. Both the SVM code and CNN code were downloaded and modified from an open-source website [
16,
17]; they are well-documented source codes and are available for Python or MATLAB. Aged asbestos-cement corrugated roofing tiles can have patches, water stains, or moss growing on top, which altered the features and caused misjudgments with this approach, accounting for around 6% of the entire database. In this study, nadiral or quasi-nadiral images were used, therefore the detection of asbestos-cement corrugated tiles on vertical walls, which are common in tropical regions, was not possible. Oblique photogrammetry with UAVs could obtain the inclination images and then go through the same machine learning processes to detect their existence; nevertheless, it would be a momentous task to gather images for large areas. The official image cube collects various types of images, and with proper indexing and geocoding, these data could be overlapped and analyzed to reveal the characters in each segment, both temporally and spatially.


