Article

Changes in Vegetation Greenness and Their Influencing Factors in Southern China

1
State Key Laboratory of Remote Sensing Science, Jointly Sponsored by Beijing Normal University and Aerospace Information Research Institute of Chinese Academy of Sciences, Faculty of Geospatial Science, Beijing Normal University, Beijing 100875, China
2
Faculty of Arts and Science, Beijing Normal University At Zhuhai, Zhuhai 519087, China
3
Beijing Engineering Research Center for Global Land Remote Sensing Products, Institute of Remote Sensing Science and Engineering, Faculty of Geographical Science, Beijing Normal University, Beijing 100875, China
*
Author to whom correspondence should be addressed.
Remote Sens. 2022, 14(14), 3291; https://doi.org/10.3390/rs14143291
Submission received: 26 May 2022 / Revised: 4 July 2022 / Accepted: 5 July 2022 / Published: 8 July 2022
(This article belongs to the Section Ecological Remote Sensing)

Abstract

:
Since the 21st century, China has experienced rapid development, and the spatial and temporal changes in vegetation cover have become increasingly significant. Southern China is a representative region for human activities, climate change, and vegetation change, but the current human understanding of the interactions between vegetation and its influencing factors is still very limited. In our study, we use NDVI as the vegetation greenness data, land cover data, temperature, precipitation, downgradient shortwave radiation, and CO 2 data to investigate the interrelationship among vegetation, climate change, and human activities in southern China. The changes and their consistency were studied by trend analysis and Hurst exponent analysis. Then, the contribution of each influencing factor from 2001 to 2020 was quantified by random forest. The results showed that the vegetation in southern China showed an overall rising trend, and areas with a continuous changing trend were concentrated in the Pearl River Delta, western Guangdong, and eastern Guangdong, with a growth rate of 0.02∼0.04%. The vegetation in northern Guangdong did not change significantly. The main factor of NDVI spatial variation in southern China is the land-use factor, accounting for 79.4% of the variation, while climate factors produce further differences. The contributions and lagged effects of NDVI factors on different land-use types and the lagged effects of different climate factors are different and are related to the climate and vegetation background in Sourthern China. Our study is useful in estimating the contribution of NDVI change by each considered factor and formulating environmentally friendly regional development strategies and promoting human–land harmony.

1. Introduction

Changes in vegetation greenness are important indicators of ecosystem stability and have far-reaching effects on socioeconomics, as well as agriculture [1]. As one of the most active parts of the surface system, vegetation is influenced by CO 2 , solar radiation, atmospheric circulation, human activities, and other factors [2]. The changes in the influencing factors are reflected not only in the vegetation greenness but also in the various indicators of vegetation change in different trends, such as the influence on the mesoscale atmospheric circulation in the local area through the evapotranspiration mechanism [2]. The influence on the local water cycle occurs through the interception of surface and subsurface runoff [3,4]. Some studies have shown that the recovery of spring temperature in the context of global warming enhances the intensity of soil moisture acquisition by vegetation, which might potentially cause more frequent seasonal droughts in the future [5]. The productivity changes in vegetation such as crops also play an important role in the stability of local agricultural activities; for example, it has been shown that the increase in temperature has a correlative effect on the reduction in crop yield in humid areas [6]. Therefore, the study of changes in vegetation greenness contributes to an in-depth understanding of the mechanisms of the action of phenological factors in the region.
A large number of studies have attributed and quantified the influencing factors of vegetation greenness and the intensity of influence, which are mainly classified into three types: natural factors, anthropogenic factors, and mixed natural and anthropogenic effects. Among the natural factors, the main research objects in recent years have been climate factors such as precipitation and sunshine duration [7] and vapor pressure deficit (VPD) [8]; research on the influence of anthropogenic factors focuses on the influence of governmental decisions related to vegetation cover in the study area [9]. Moreover, the integrated influence of anthropogenic and natural factors on vegetation growth is explored, especially focusing on the contribution of carbon emission behavior in the natural carbon cycle system, such as the different degrees of influence of human and natural factors on vegetation growth at different scales [10] and the importance of human ecological restoration measures in increasing the vegetation cover in climatic transition zones [11]. Several studies have also highlighted the effects of climate change and different land-use types on vegetation in more sparsely populated regions [12], providing insights to the relationship between vegetation and climate change. In the current studies on vegetation, research on the mechanism of compound influence is concentrated in agro-pastoral transition zones, as well as ecologically fragile zones, and the influence of human activities on vegetation, mainly in urban activities, is less studied.
With its complex land-use composition, southern China is a typical area to study the attribution of mixed natural and anthropogenic effects on changes in vegetation greenness. It is not only a representative region of highly urbanized and rapidly urbanizing clusters [13] but also a representative region of severe urbanization imbalance, and the development patterns of the western and eastern regions of southern China, such as population urbanization and social urbanization dominated by the northern regions, have certain impacts on the ecological landscape in their regions, such as the resource intensity in western Guangdong. The petrochemical industry in western Guangdong has caused atmospheric and soil pollution [14], and the extensive planting of fast-growing eucalyptus forests in eastern Guangdong has caused land degradation [15]. Previous studies have generally focused on the effects of intra-urban land-use changes on vegetation [16]. However, in terms of large developing countries such as China, much research has shown that land-use transition has an important contribution to vegetation greenness change [17,18], but at such a study scale, the effect of land-use conversion on changes in vegetation greenness is difficult to obtain [19]. Furthermore, urbanization characteristics in southern China are driven by its unique export-oriented economy, which leads to a more equal level of urbanization and more connectivity among cities, which makes regional holism non-negligible as well.
For all these reasons, we argue that the influencing factors of vegetation in areas of excessive urbanization and high-intensity human activities require further study. In this study, we aim to investigating the characteristics of the changes in vegetation greenness in southern China from 2001 to 2020. We expected to investigate the mechanism of human activities in the surface–atmosphere coupling system, the contribution of various influencing factors to vegetation production, and the difference in the contribution of various influencing factors in different regions. We also expected to provide multi-faceted suggestions for the future development and construction of new cities and the transition of urban governance and the improvement in ecological environment quality.

2. Materials and Methods
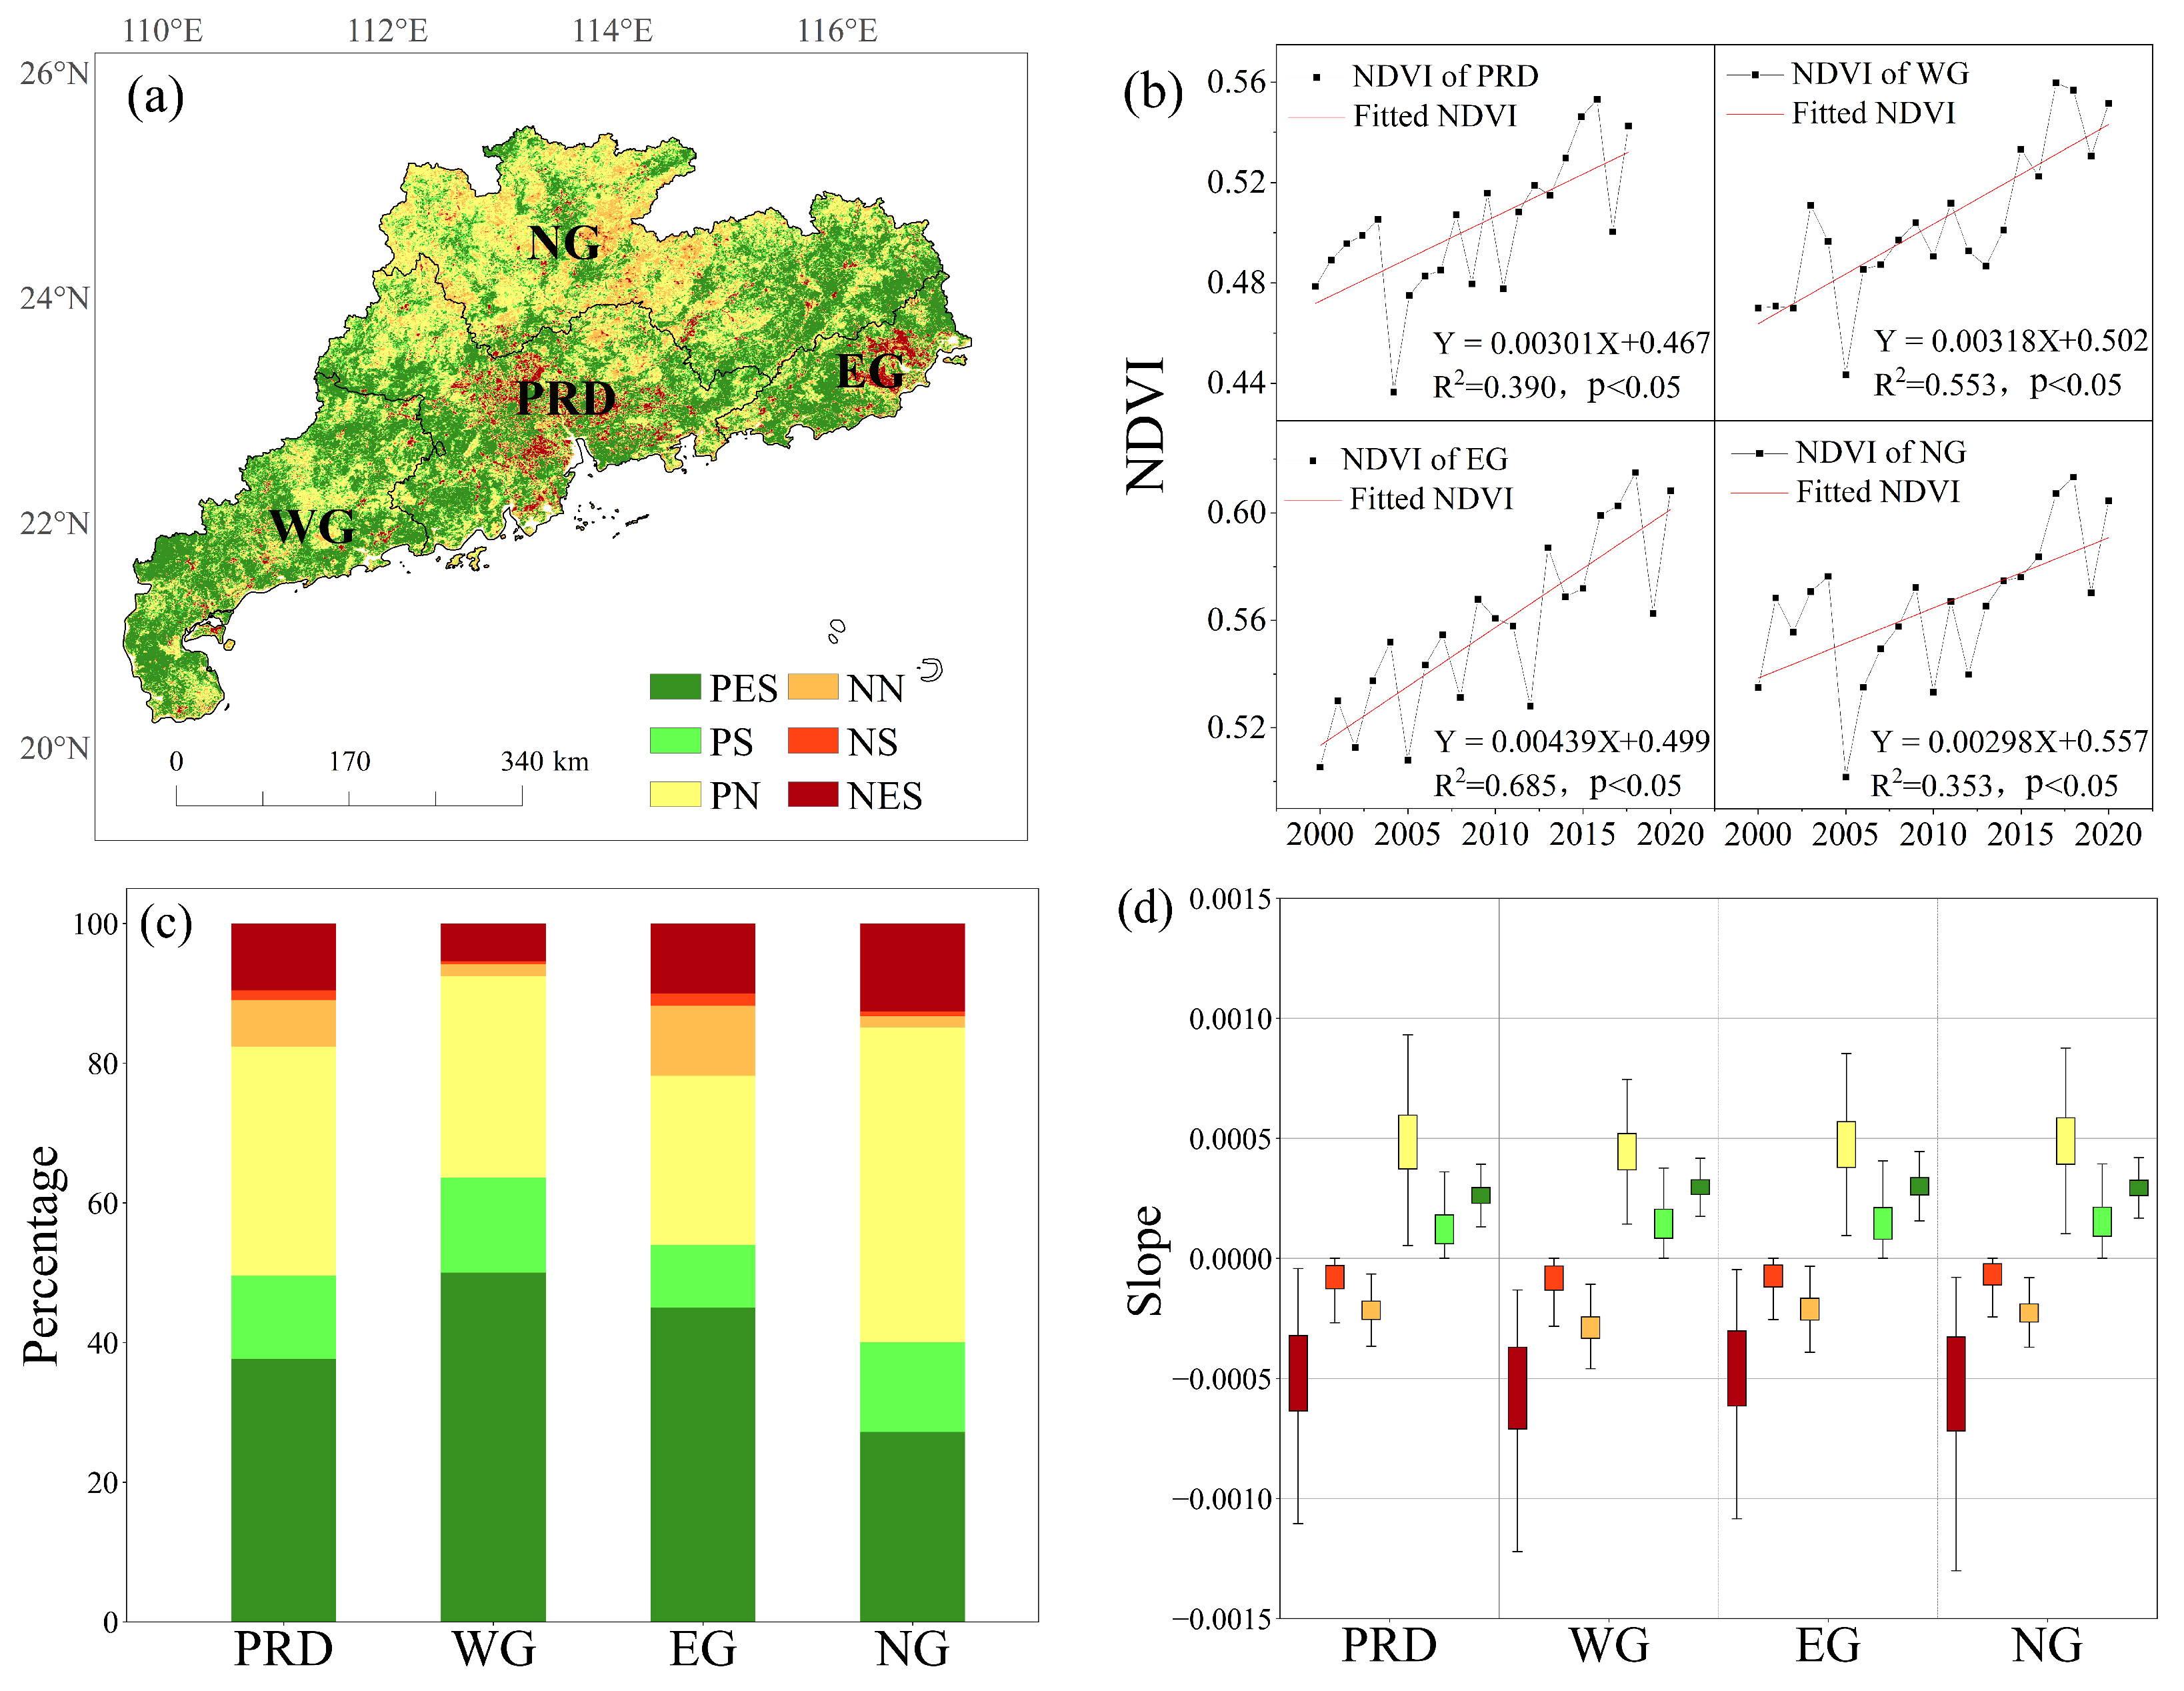
2.1. Study Area

In this study, we select Guangdong as our study area, which is located in southern China (Figure 1a) with contiguous territories extending from 109 26 E to 117 20 E and 20 07 N to 25 31 N, straddling the tropics and subtropics. Its climate is dominated by a subtropical monsoon climate with annual precipitation of 1500–2000 mm and a mean annual temperature of approximately 19–26 C. Its regional topography is dominated by the hills of northern Guangdong [20], yet its abundant water and thermal resources create a diverse vegetation type and high vegetation cover in its region [21]. The Pearl River Delta alluvial plain is located in the south, with an overall terrain pattern of stepped terrain with high elevation in the north and low elevation in the south. Guangdong Province has high level of economic and urbanization. It has Guangzhou and Shenzhen, both of which have more than 10 million people. Figure 1 shows the geographical location and the spatial distribution and area percentage of land-use in Guangdong Province.
According to Figure 1c, the main land-use types in Guangdong are evergreen broad-leaved forest (EBF, 18.3%), savanna (SA, 61.4%), croplands, cropland/natural vegetation mosaic (CN, 8.4%), and urban built-up areas (UB, 6.8%). UBs are mainly concentrated in PRD and parts of EG, while SAs are distributed in the periphery of the PRD, various ministries in WG, and northern Guangdong (NG). EBFs are distributed in the transition zone between the PRD, WG, and EG, most in NG and WG, and the distribution of crop land is more fragmented, with small areas distributed along the coast and various parts of NG. There is a wide distribution of secondary scrubs in WG and EG, caused by typhoon disasters and the poor water storage capacity of the soil [22]. Guangdong was split into the Tropical flora and the Pan-Arctic flora [23,24], while some other studies split Guangdong into the Paleotropic flora and the East Asiatic flora [25]. It seems that the vegetation in Guangdong shows obvious spatial variation due to the division of its flora.

2.2. Data Sources

The MOD13Q1 normalized difference vegetation index (NDVI) product of MODIS is used in this study as a measure of vegetation greenness in southern China. The advantages of NDVI include a precise description of vegetation growth status [26], a consistent correlation with vegetation biomass and dynamics in various ecosystems [27], and a high stability in supporting long time series analysis [28]. The platform for acquiring and preprocessing NDVI data is the Google Earth Engine (GEE), and the interactive function of this platform makes the acquisition of multitemporal images easier [29]. In this study, NDVI data products from March 2001 to 2020 were acquired, and to minimize the obscuration by clouds, the NDVI data were synthesized by taking the maximum value of each pixel in the study area within a month on a monthly scale. We use the MODIS quality control file to eliminate abnormal image values and select images with high quality. Then, we calculate a 16-day maximum-value composite (MVC) for better cloud-covered area reduction. To maintain consistency with the resolution of land-use data, NDVI data were eventually resampled to a resolution of 500 m using the nearest neighbor interpolation method [30].
The MCD12Q1 land-use product we used in this study is published by the MODIS Land Science team, which spans the period 2001–2020 with interannual temporal resolution and 500 m spatial resolution [31]. The IGBP classification scheme was chosen as the classification label for the features. MCD12Q1 has been widely used for evaluating the interaction between land-cover or land-use transitions and climate factors in China [32,33,34]. Furthermore, its consistency and stability in most common scenarios in urban areas have been proven in previous studies [35].
Precipitation, temperature, and radiation data were collected from the Terra Climate global climate dataset available in GEE [36], which was obtained by auxiliary interpolation based on WorldClimate and has a large improvement in the absolute level error of the overall mean compared to the original data. The spatial resolution of the dataset is 4 km, and the time range is from 1958 to 2021, with intermonth temporal accuracy. Considering the lag effect of meteorological conditions on vegetation growth, the precipitation, intermonth maximum temperature, intermonth minimum temperature, and monthly total radiation data provided by the dataset since October 2000 were obtained and used in this study.
The CO 2 data downloaded from WDCGG data center has been accessed at 22 January 2022 (https://gaw.kishou.go.jp/). The raw data include daily CO 2 observation data, monthly synthetic data, and annual synthetic data. Among the current CO 2 monitoring stations in China, only the data from the Waliguan site in Qinghai (WLG) cover the time period of 2001–2020, so the monthly synthetic CO 2 data from the WLG for the period 2001–2020 were used in this paper to represent the CO 2 content in Guangdong. To measure the difference in CO 2 between WLG, which is located in northwest China, and southern China, we also compare the CO 2 data between WLG and Lulin, Taiwan, from 2006 to 2020, with an average difference of 1.13%. Therefore, the CO 2 data from WLG are still highly representative of CO 2 in southern China.

2.3. Methods

2.3.1. Vegetation Greenness Changes

We used linear regression to analyze the trend of vegetation greenness. For each pixel of the NDVI image, its value reveals the growth of vegetation within the pixel. The specific calculation of the vegetation greenness estimator can be calculated as follows:
N D V I = a × Y e a r + b
where N D V I denotes the value in the image; a denotes the slope trend value of the fitted equation, which reflects the degree of the vegetation change trend over time; and b denotes the intercept of the fitted equation. Based on the basic principle of pixelwise regression, we used MATLAB to calculate the regression trend for the pixel value array obtained from the intermonth maximum synthetic NDVI images of southern China from 2000 to 2020. The raster image of the vegetation change trend value in the study area can reflect the spatial distribution characteristics of the vegetation change trend. We also calculated the p-value using the t-test method on each pixel to ensure that the NDVI changing trend was statistically significant. p 0.01, 0.01 < p≤ 0.05, and p > 0.05 indicate that the NDVI changing trend is extremely significant, significant, and insignificant, respectively. To show the overall differences, Guangdong Province was divided into four major regions: the Pearl River Delta (PRD), western Guangdong (WG), eastern Guangdong (EG), and northern Guangdong (NG).

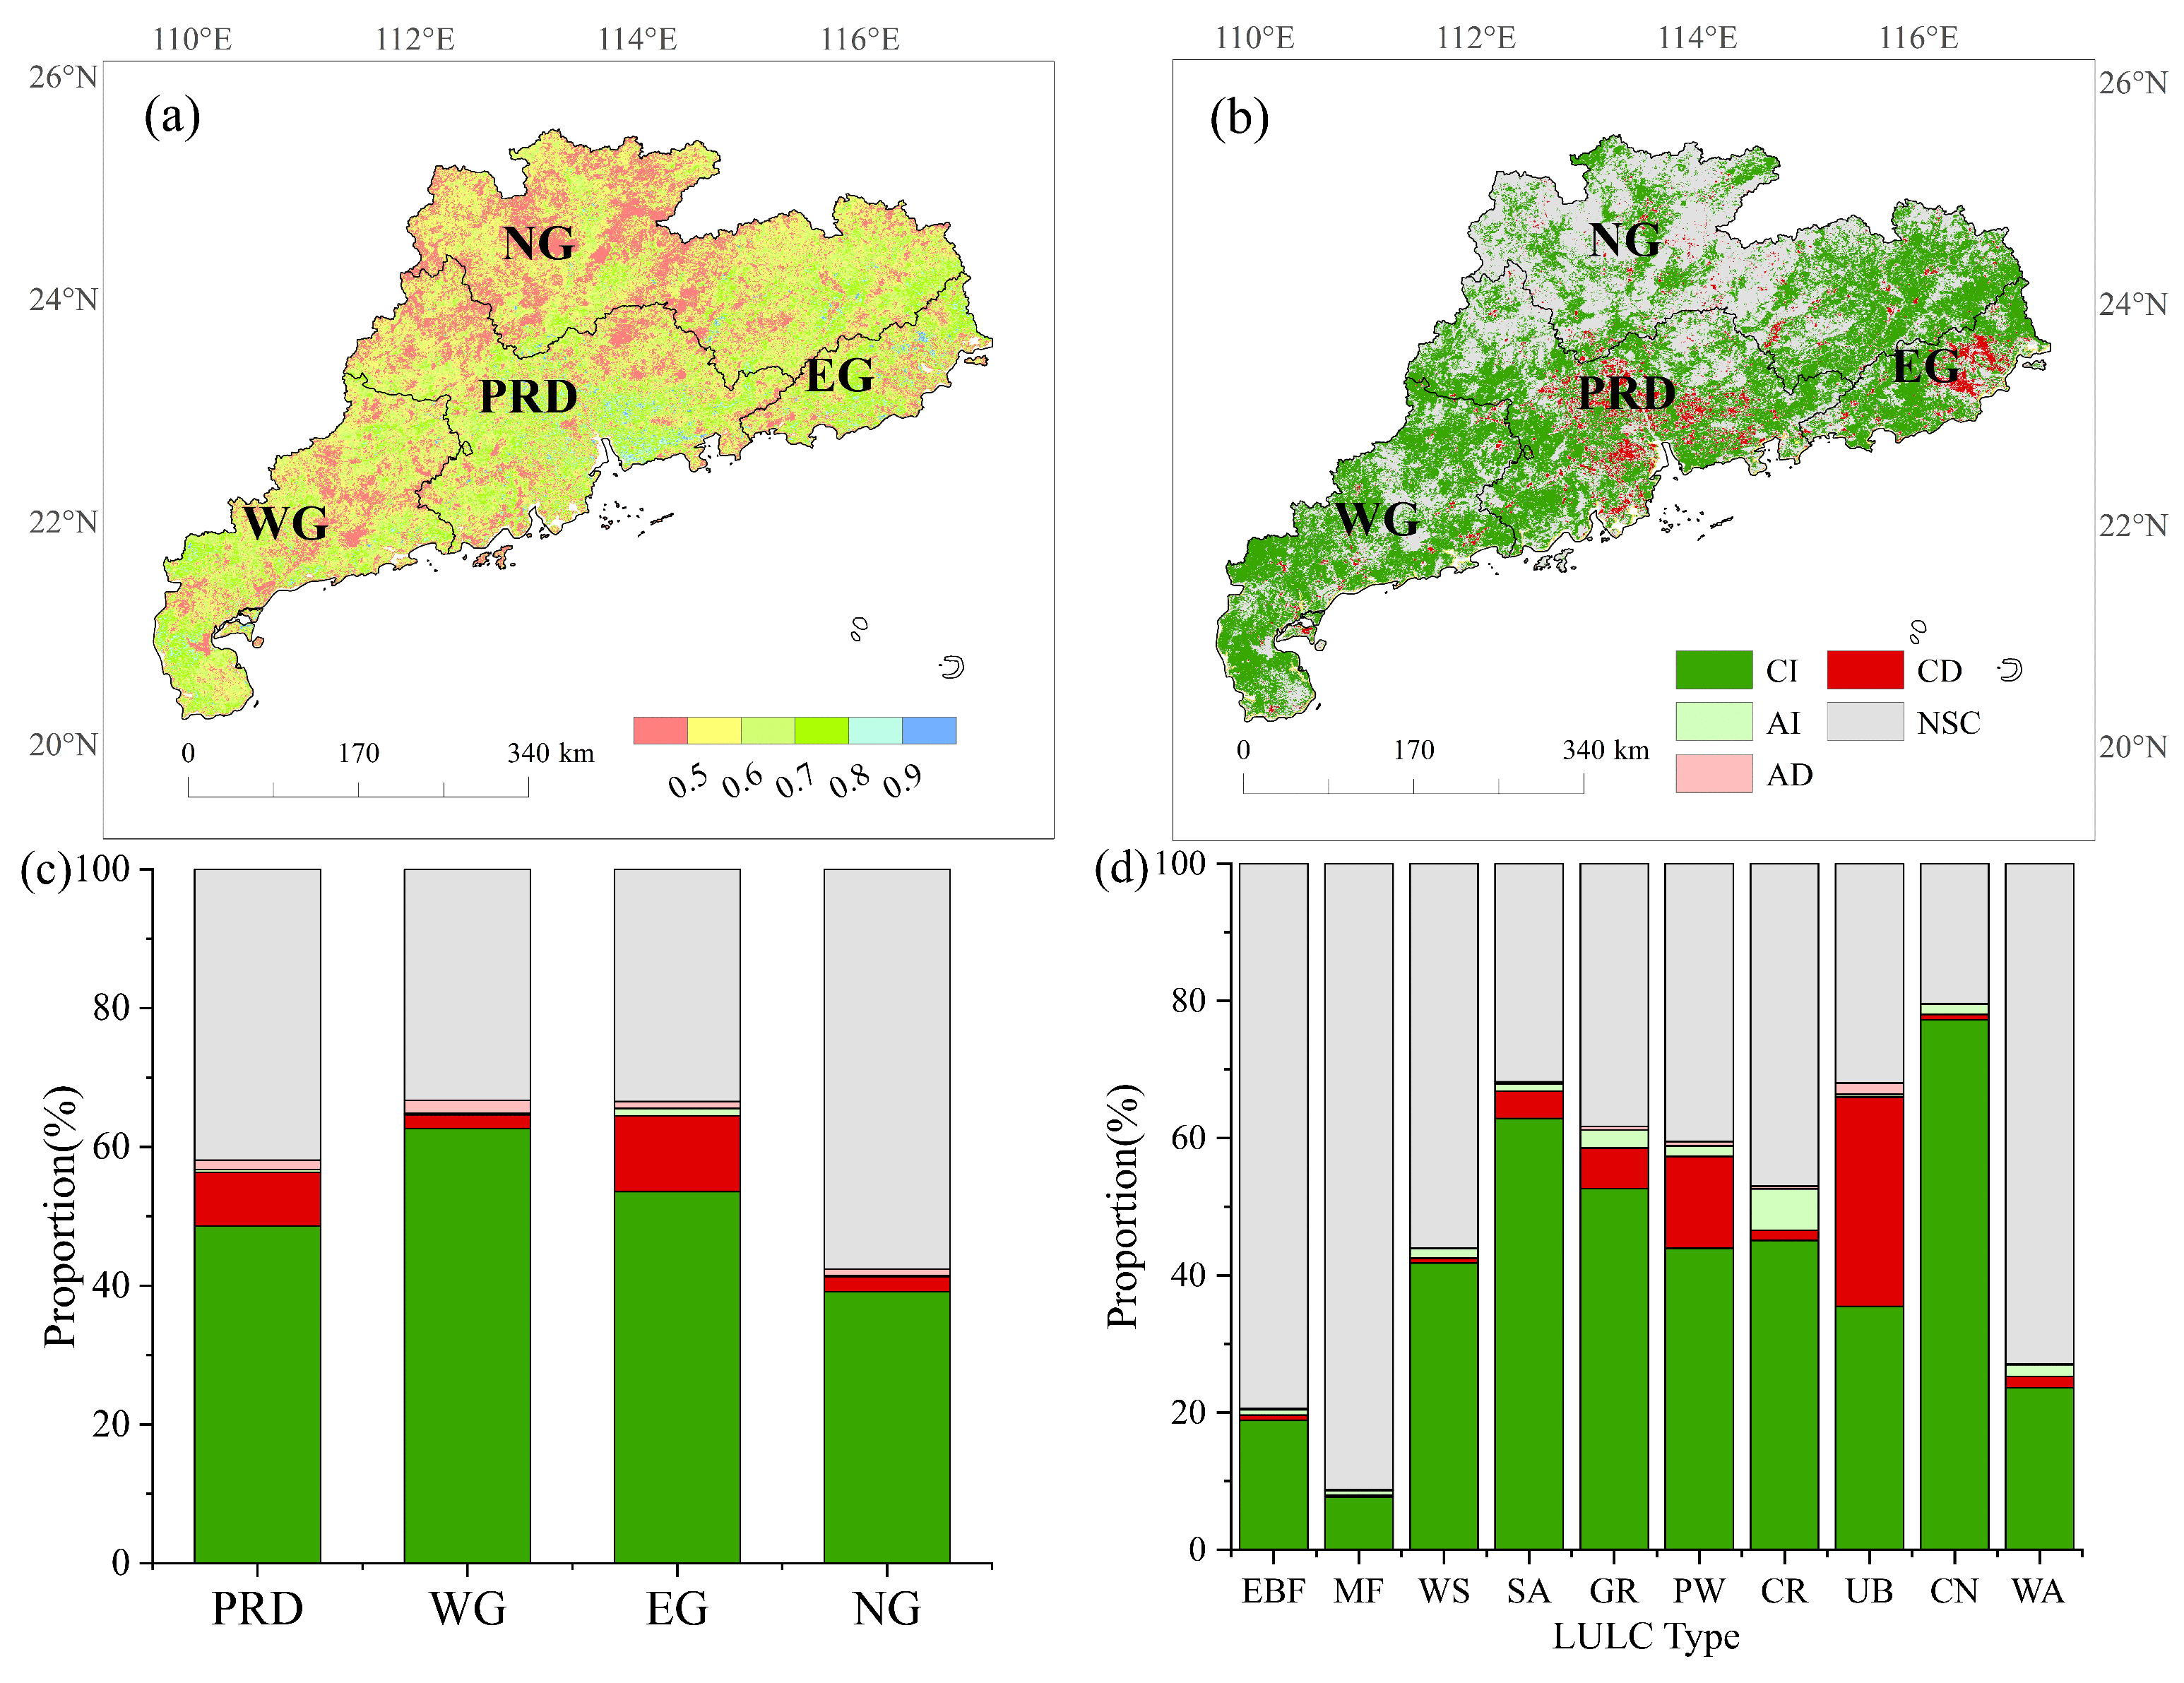
2.3.2. Vegetation Greenness Change Consistency

Although regression analysis can give a trend in vegetation change, the consistency of the trend is still unclear. The vegetation trend consistency indicates the potential vegetation growth patterns based on the fluctuation status of the existing time series. The Hurst exponent can quantitatively denote positive or negative consistency based on previous time series changes [37]. It has also been used for trend analysis of remote sensing inversion indices and has confirmed the effectiveness for portraying consistency of time series in vegetation indices such as NDVI [38,39]. R/S Analysis is the most typical method for measuring the Hurst Exponent. The main calculation is as follows [40]:
  • The time series of the image values of a single pixel, whose length is n, will be divided into several subseries X ( τ ) according to different lengths of sublists ( 1 , 2 , , τ ), where τ denotes the length of the sublist.
  • Calculate the mean value of each sublist in each subseries:
    X m e a n , τ = 1 τ i = 1 n X ( τ ) , τ = 1 , 2 , , n
  • Calculate the cumulative deviation of each subseries:
    D ( τ , t ) = i = 1 t X ( i ) X m e a n , t , 1 t τ
  • Calculate the standard deviation sequence of all sublists in each subseries:
    S ( τ ) = 1 τ i = 1 τ X ( i ) X m e a n , τ 2 , τ = 1 , 2 , , n
  • Compute the range sequence of each subseries:
    R = m a x ( 1 t τ ) D ( τ , t ) m i n ( 1 t τ ) D ( τ , t ) , τ = 1 , 2 , , n
  • Calculate the rescaled range of each subseries (R/S):
    R ( τ ) S ( τ ) = ( c τ ) H
  • Calculate the logarithm of Equation (6):
    ln R ( τ ) S ( τ ) = H ln τ + H ln c
We performed a linear regression analysis of Equation (7) using ln τ as the independent variable and ln R ( τ ) S ( τ ) as the dependent variable. The Hurst exponent is the slope of the regression with a range of 0 to 1. When it is less than 0.5, the changing trend of the series in the future is more likely to maintain the same trend as the current trend; when it is close to 0.5, the changing trend of the series in the future presents a random wandering state and does not show a significant trend in the same direction or the opposite direction; when it is greater than 0.5, the changing trend of the series in the future shows consistency with the current series.
We used MATLAB to calculate the pixel-by-image Hurst exponent for the pixel array obtained from the 20-year intermonth maximum synthetic NDVI raster image conversion of southern China. Combining the Hurst exponent analysis with the linear regression results, we were able to conclude the consistency of vegetation changes (Table 1).

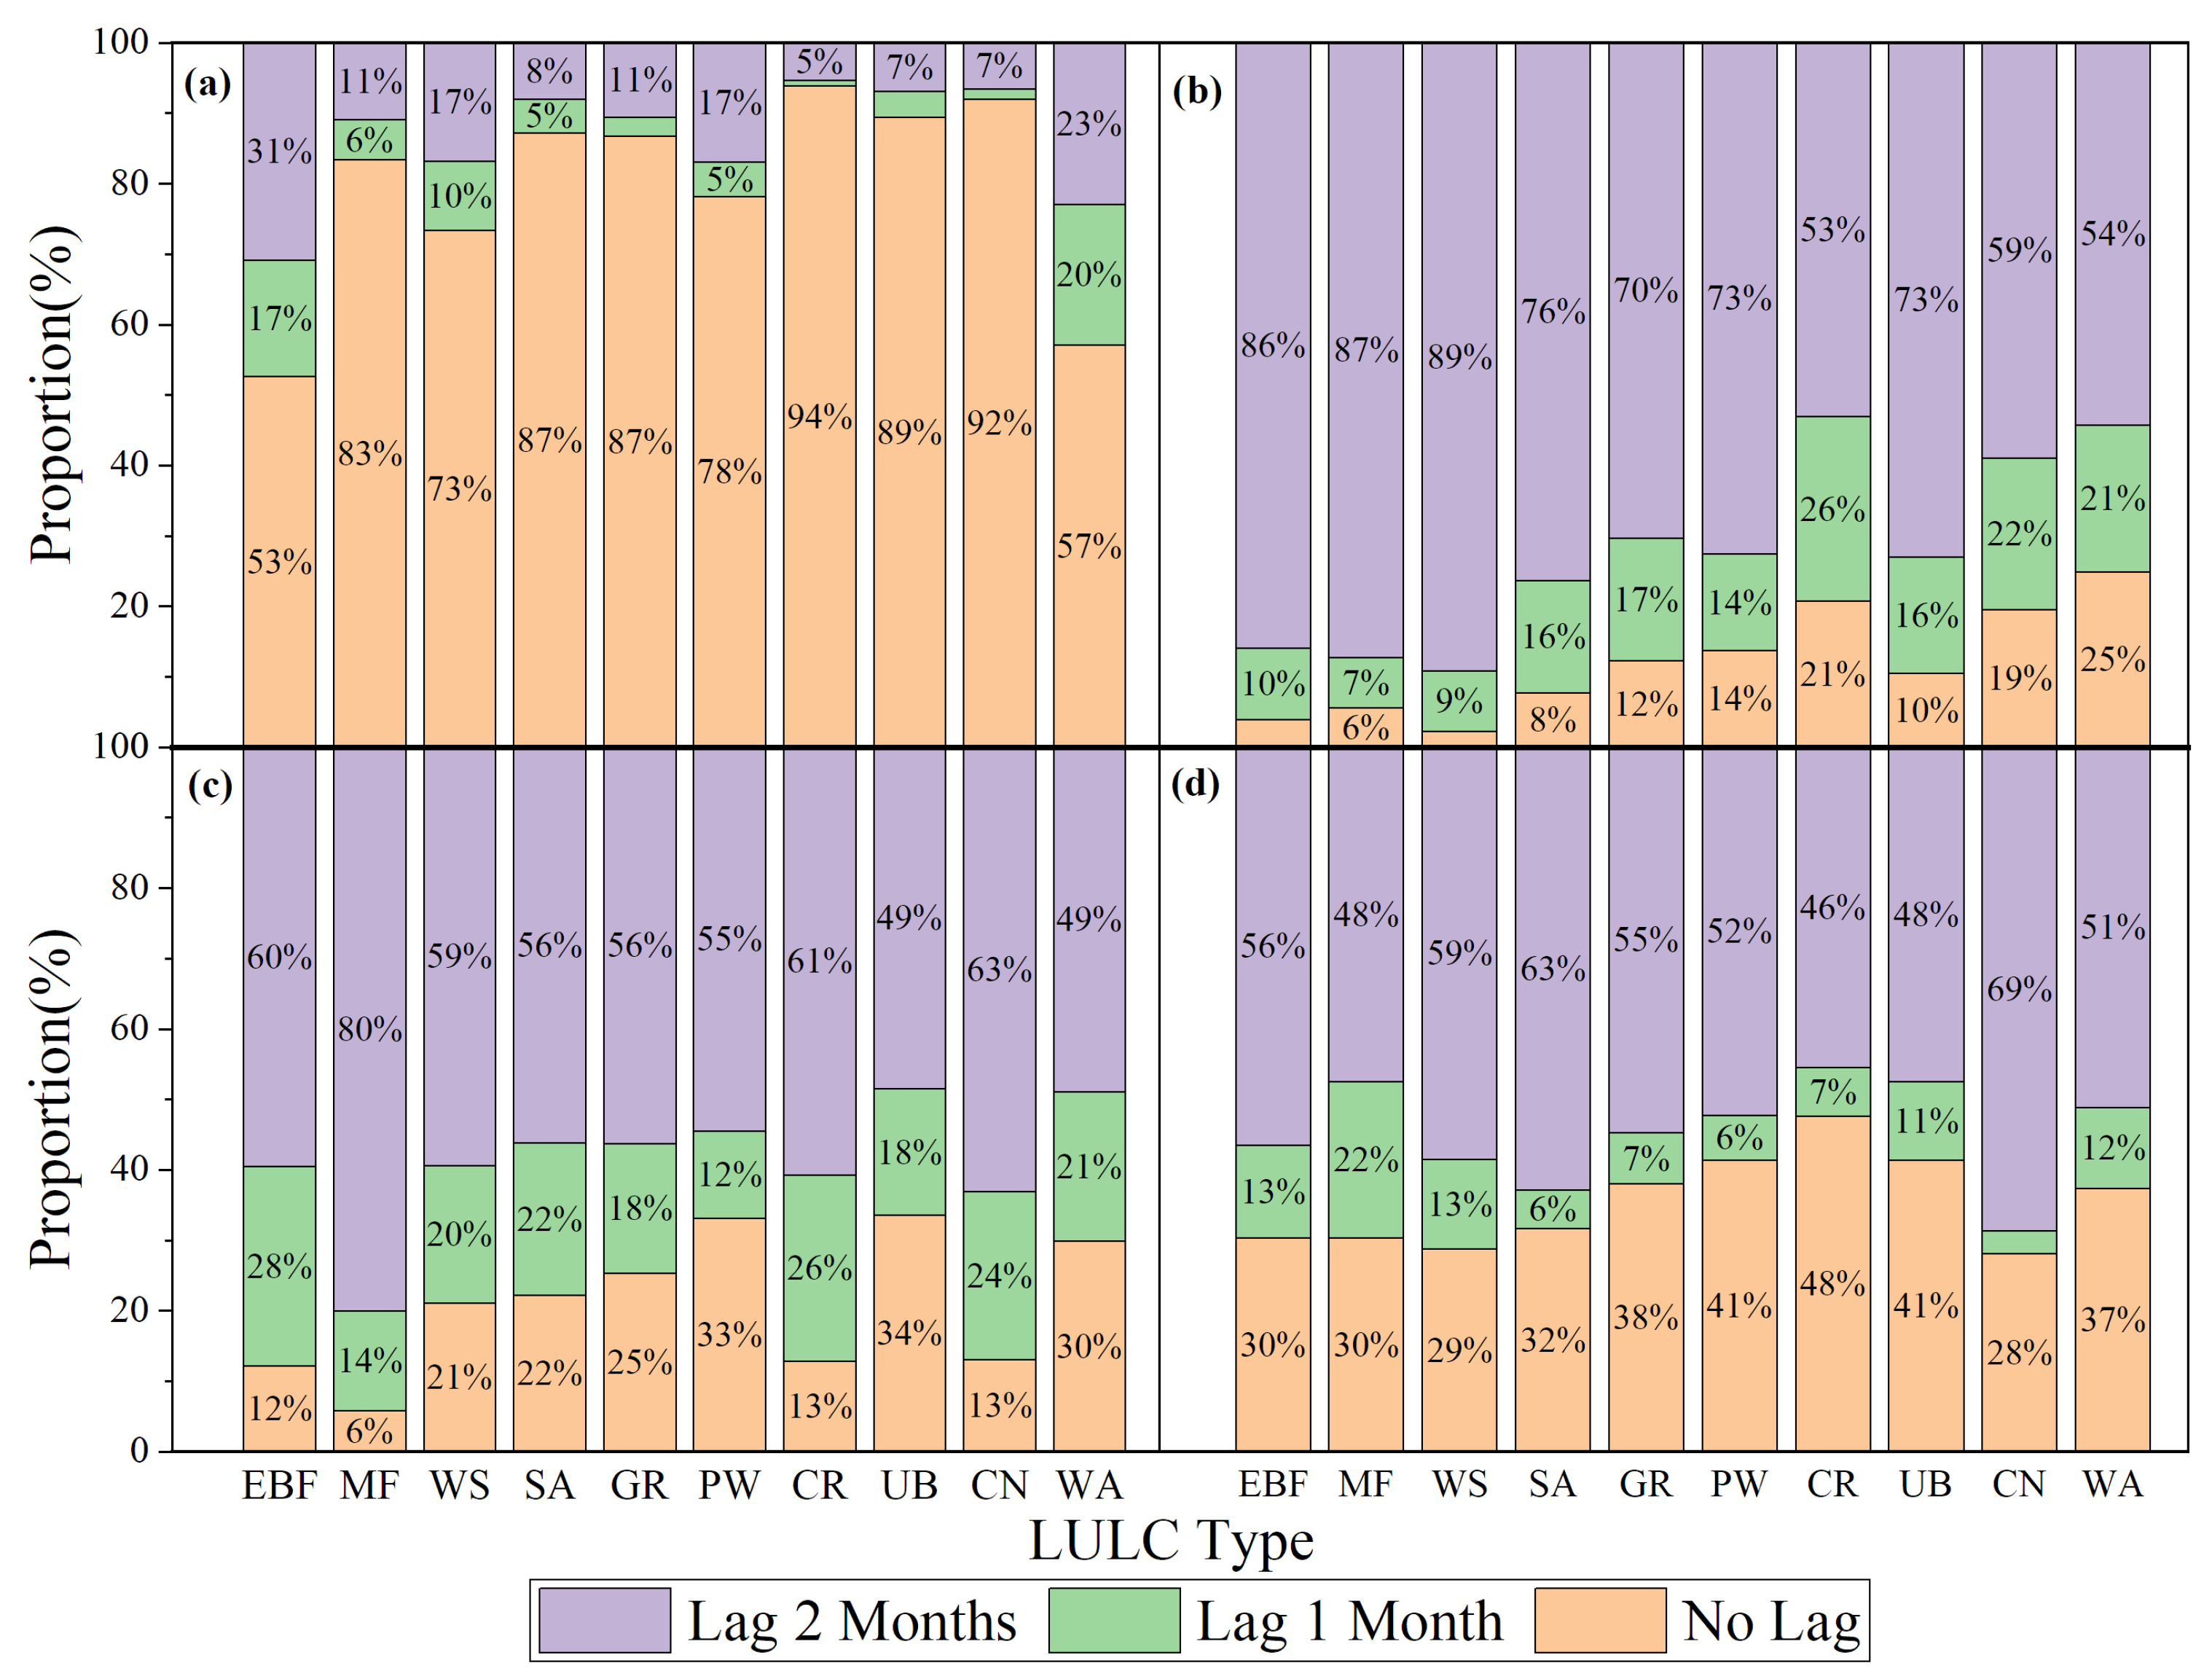
2.3.3. Contribution of Factors Affecting Vegetation Greenness and Their Time-Lag Effects

The vegetation ecosystem is a complex multi-factor system, and there are differences in the level of influence of each factor. Random forest is able to regress the complex non-linear system and assess the contribution of each factor. The NDVI’s influencing factors we selected, including land-use (LULC), monthly precipitation (PR), monthly downgradient shortwave radiation (SRAD), monthly maximum temperature (TMMX), and monthly minimum temperature (TMMN), and the NDVI was regressed by a random forest regressor (RFR) through the above factors.
Since vegetation is affected by climate factors with a time-lag effect, it should be considered when studying the climate–vegetation response relationship [41], which helps to improve the accuracy of the model [42]. Existing studies have shown that the time-lag effect of overall vegetation on the temperature in southern China is not significant [43], while the time-lag effect on precipitation is in the range of 32 to 80 days [41]. Since the average temperature of the coldest month in southern China is also above 10 C and the lower boundary of the effective cumulative temperature for vegetation growth in China is 10 C [44], it can be assumed that southern China has a growing season throughout the year. For the crop land in southern China, double-season rice is the main crop cultivated from early February to mid-late November [45], covering most of the year. Therefore, the overall growing season in southern China is basically year-round, and there is no need for temporal screening based on the growing season. Based on this, 240 (20 years × 12 months) samples can be presented on each pixel in Guangdong Province.
We use the random forest to regress the difference between NDVI and the average NDVI of the pixel’s LULC. The independent variables of the random forest include the CO 2 , PR, SRAD, TMMX, and TMMN within the last 3 months. We trained the random forest regressor and calculated its R 2 as R 0 2 .
We use the mean decrease accuracy (MDA) [46] to estimate the attribution of each factor. MDA is a widely accepted measure of factor attribution [47] and has been applied in several geoscientific fields [48,49]. The MDA method can be used for the evaluation of the factor attribution of pure RF, in addition to the evaluation of the factor attribution of other machine learning models [49].
For a regression model with multi-factors, the attribution of each factor can be calculated as:
V I j = R 0 2 R j 2 , 1 j n
where R j 2 is the R 2 calculated by modifying the i-th variable according to the original distribution and following the fitted regression model, and R 0 2 is the R 2 when the independent variable is not modified. Then, the attribution of each factor is:
IMP j = V I j i = 1 n V I i
where IMP j is the contribution of the factor j. In this way, the attribution can be calculated. In particular, since the temperature is divided into monthly maximum and minimum, we add the attribution of both as the attribution of temperature to NDVI.
In order to calculate the lag time of each factor on vegetation changes, we calculated the contribution of each factor to the current month and the previous two months of vegetation greenness and extracted the month with the maximum contribution. The difference between the month with the maximum contribution and the current month is the lag time.

3. Results

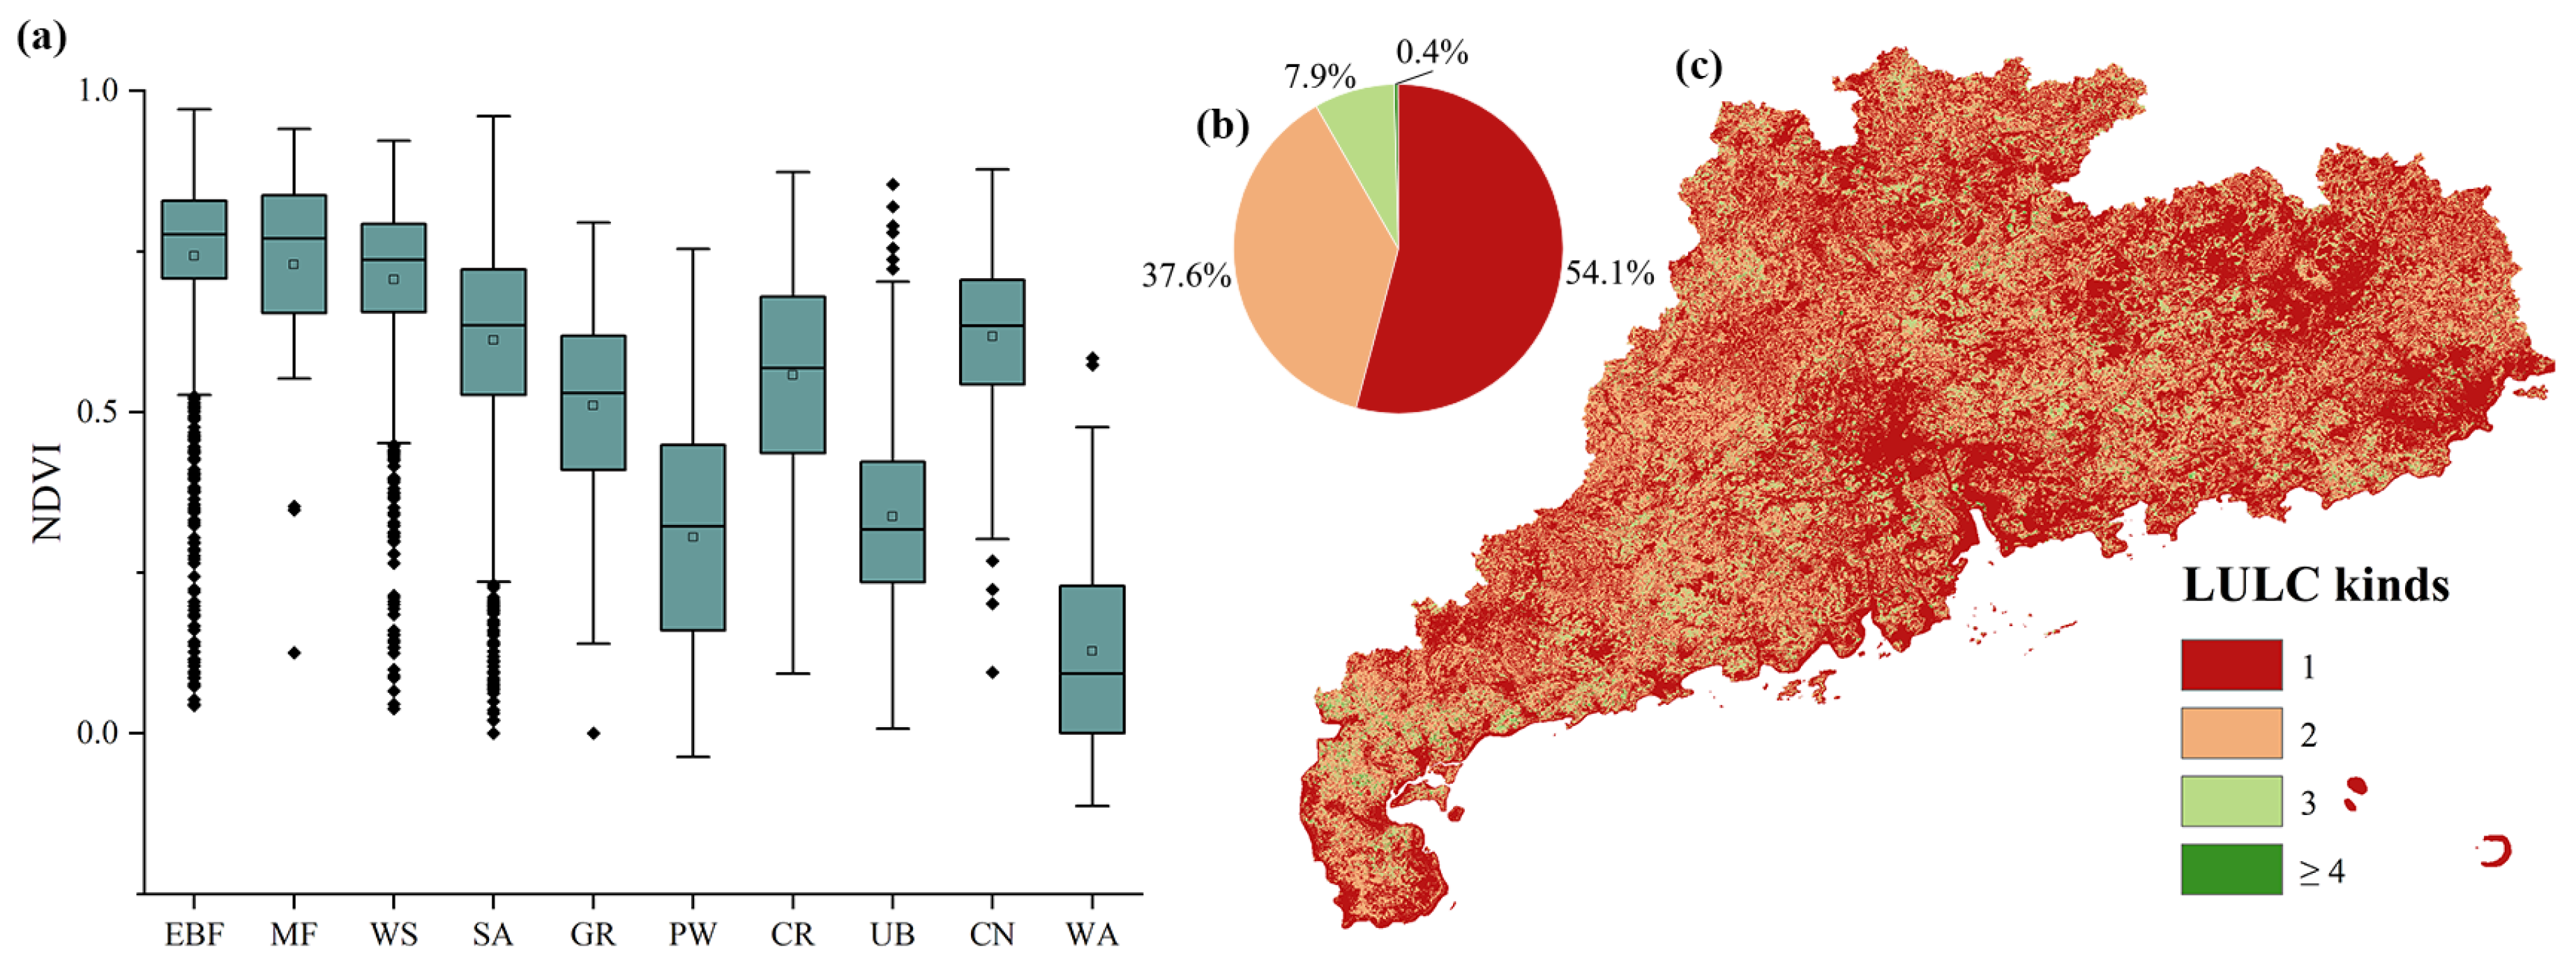
3.1. Dynamic Trend and Consistency of Vegetation Greenness

We first used linear regression and the Hurst exponent to quantify the spatial and temporal changes in vegetation greenness in southern China. The vegetation greenness trends were calculated separately in these four regions.
We found that the changes in vegetation greenness in southern China show a spatial heterogeneity. The increasing trend covered most of the built-up area and border areas between the two cities, and the decreasing trend tended to be distributed in the urban sprawl zone. An insignificant trend was found in NG, while the other three regions partly showed a significant trend (Figure 2a). From the temporal trend, the vegetation change in the four regions shows a slowly increasing trend, with growth rates of 0.03%/10a in the PRD and WG, 0.04%/10a in EG, and 0.04%/10a in NG. The growth rate of NG was 0.02%/10a (Figure 2b); the proportion of significantly increasing pixels in the PRD region was 49.6%; the proportion of significantly increasing pixels in WG was 63.65%; the proportion in EG was 53.95%; the proportion in NG was 40%; and the proportion in the PRD region and NG was smaller than that in WG and EG (Figure 2c).
The vegetation change in the PRD may be affected by the urban greening policy in recent years [50]. From the land-use pattern (Figure 1), we find that the proportion of secondary shrubs is significantly higher in the WG and EG than in the other two regions. This is presumably caused by the ecological restoration of degraded fast-growing eucalyptus forests carried out in recent years [51], which is consistent with the findings of a study about the change in vegetation greenness in southern China [1]. The built-up urban area in NG has a low proportion of significantly increasing pixels and is mainly covered by natural native vegetation, so the trend of change is mostly insignificant oscillation or slowly increasing change.
The slope values of each type of change in the four regions are basically the same, with a slightly larger increasing trend in PRD (Figure 2d), presumably due to the effect of afforestation and green conservation [50,52]. NG shows a slightly larger decreasing trend than other regions, which is consistent with the conclusion of Wu et al.’s study on forest destruction in the Guangdong Province region [53]. Presumably, the cause of this phenomenon is the short-term impact of natural disasters such as forest fires on high vegetation coverage areas. The difference in slope value types between significant and nonsignificant changes is not certain, and no significant values are higher in the positive trend but lower in the negative trend, so it is necessary to investigate the consistency of the vegetation greenness trend in the following sections.
The distribution of the Hurst exponent shows significant regional heterogeneity. The spatial distribution of the Hurst exponent less than 0.5 pixels has a high correlation with the topography, while the pixels with Hurst exponents greater than 0.5 are mainly distributed in the plains, with higher urbanization in the southv(Figure 3a). The consistency in the changing trend of vegetation in southern China can be categorized into five types according to the current trend types combined with the Hurst exponent values for categorizing consistency trends: continuous improvement (CI), continuous deterioration (CD), anti-continuous improvement (AI), anti-continuous deterioration (AD), and nonsignificant change (NSC). Because of the rare distribution of AI and AD types in southern China (less than 1%), the vegetation change trend did not shift on most of the pixels. The continuous trend of the NDVI in southern China was mainly agglomerated in the PRD, WG, and EG; NG mainly showed a stochastic trend (Figure 3b). The consistency of the vegetation greenness trend also shows a divergence between different regions and LULC types (Figure 3c,d). The LULC types that are similar to forests are mainly NSC, including EBF, MF, and WS. Pixels with types that are similar to scrub or grassland are mainly marked as CI, including SA, GR, and CN. UB, which is influenced by human activities, shows the highest proportion of CD. AI and AD occupy only a very small proportion, except for CR, for which AI has a higher proportion. Overall, CI and NSC were distributed within each region, with CD to a lesser extent, and AI and AD were rarely distributed. The proportion of CD in PRD and EG was much higher than that in WG and EG, while the proportion of NSC in NG was the highest in these regions.
In general, the consistency of the vegetation greenness trend in southern China shows some spatial divergence, with consistent trends mainly distributed in the central part of Guangdong south of approximately 24°N. The CD of vegetation is mainly distributed in densely distributed urban agglomerations such as the EG and PRD, where human activities are more frequent, and NSCs are mainly distributed in areas with fewer human activities and dominated by natural elements such as NG.

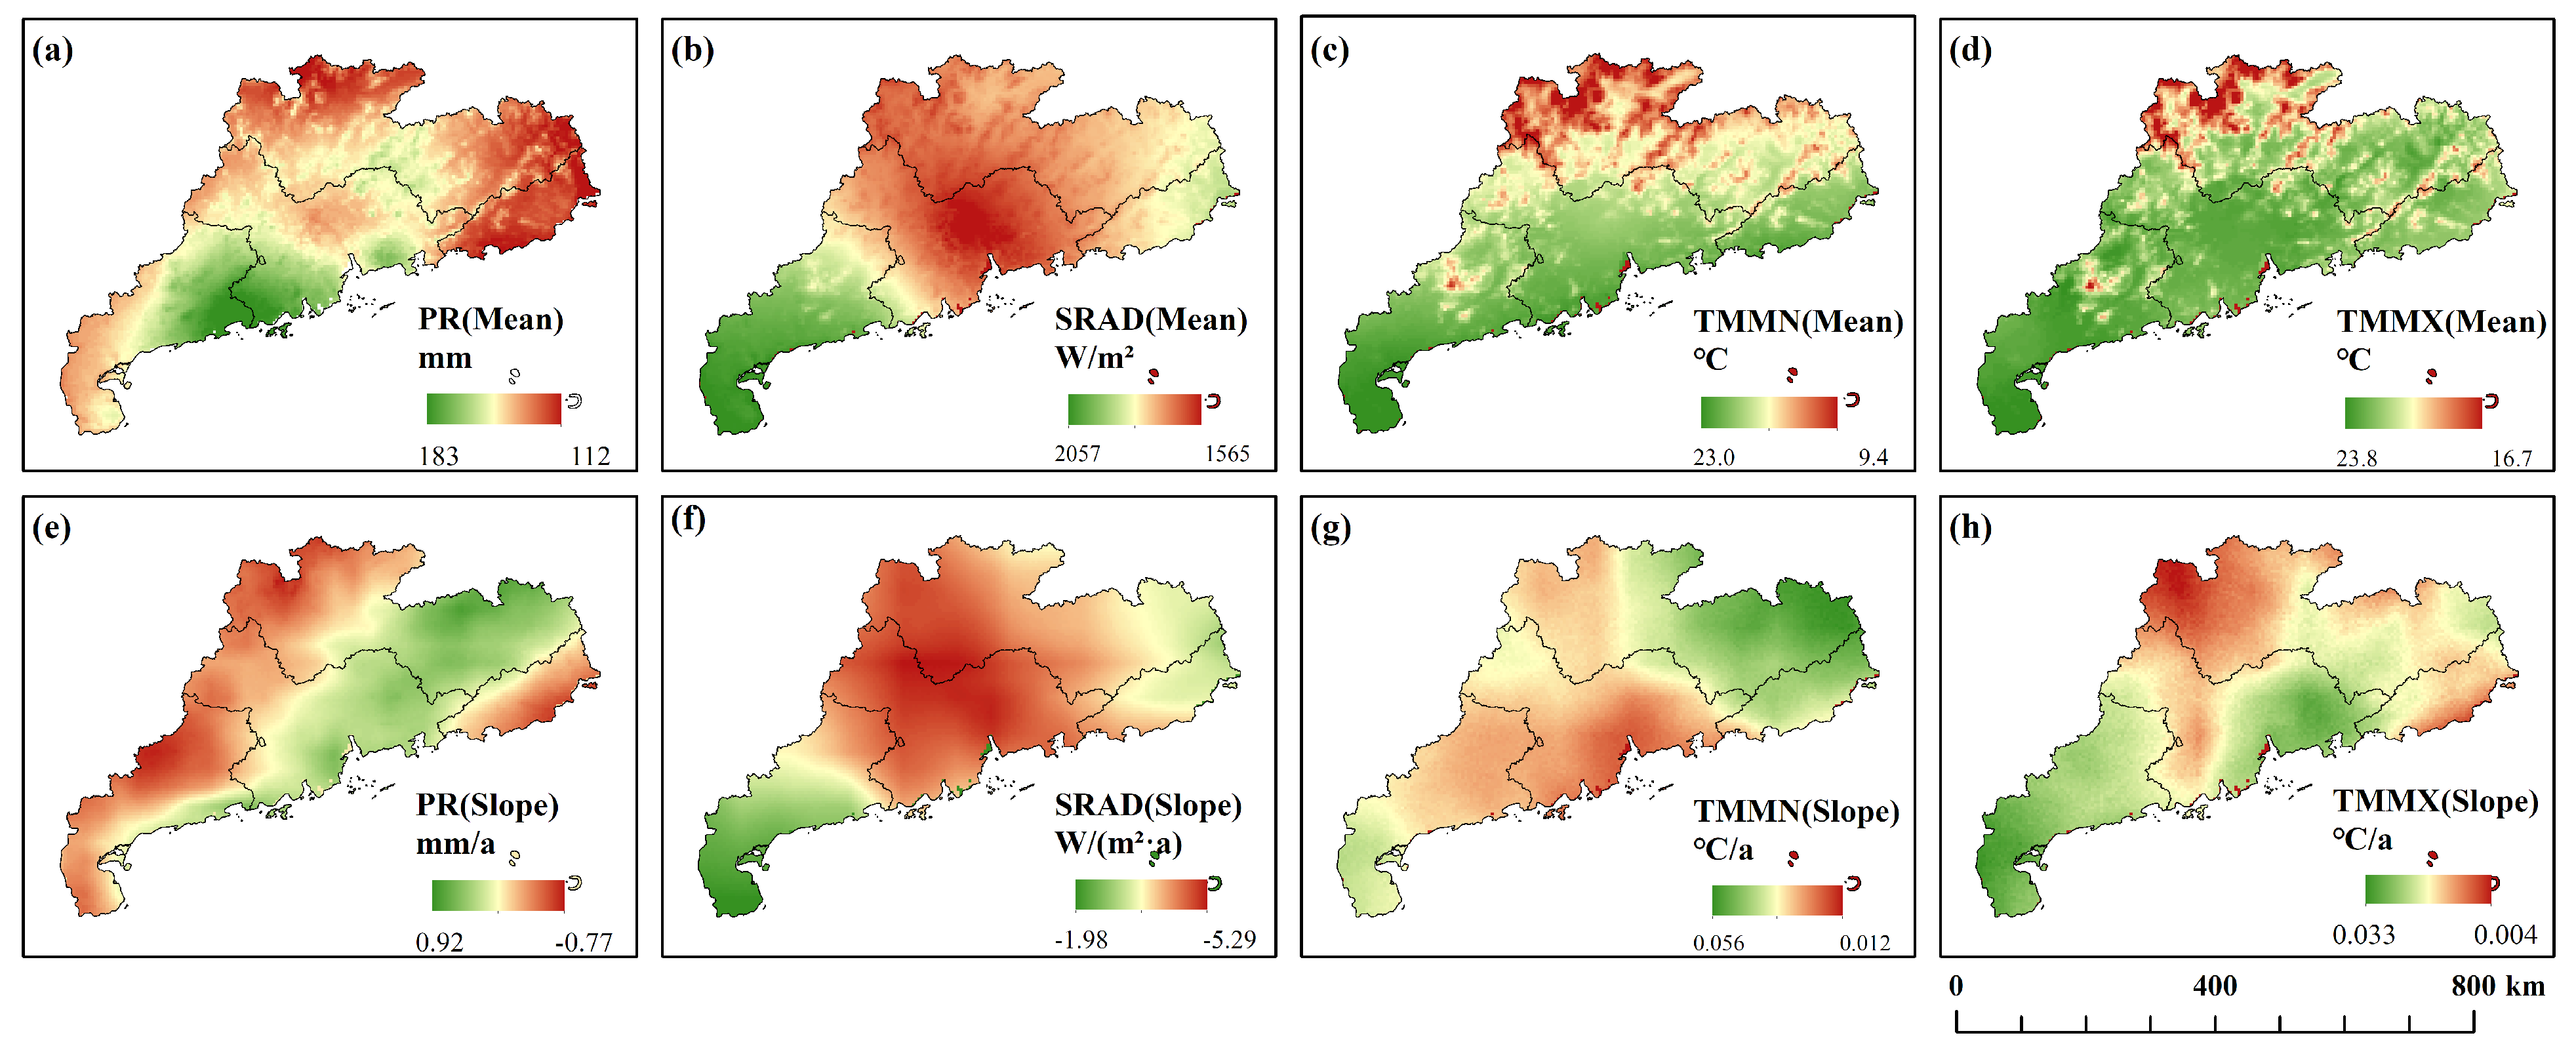
3.2. Spatial Distribution of Vegetation Influencing Factors and Its Lag Effect

We analyzed the mean values and trends of precipitation (PR), downgradient shortwave radiation (SRAD), monthly minimum temperature (TMMN), and monthly maximum temperature (TMMX) in southern China from 2001 to 2020, which are shown in Figure 4.
As shown in Figure 4, the PR decreases from the west coast of the Pearl River Delta to the surrounding area (Figure 4a), SRAD decreases from the Pearl River Delta city group to the surrounding area (Figure 4b), and temperature decreases from south to north (Figure 4c,d), showing a clear latitudinal zonality phenomenon.
The annual mean rates of change in the PR, SRAD, and TMMX are more similar to the annual mean distribution pattern (Figure 4e,f,h), while the trend of TMMN increases from the middle to both sides to some extent (Figure 4g). Numerically, the interannual variation in precipitation increases and decreases, and the downward shortwave radiation shows a decreasing trend in the province, while the temperature shows an increasing trend in the province.
As seen in Figure 4, there is obvious heterogeneity in the spatial distribution and temporal variation in climate factors in Guangdong Province, and the spatial differences in the factors influencing NDVI cannot be ignored.
We also estimated the time-lag effects on different LULC types, and the results are shown in Figure 5.
As shown in Figure 5, the results indicate that there are differences in the lag effect of different meteorological factors on different LULC types. Among them, there is a significant timely response phenomenon for temperature, while there is a significant time-lag effect for precipitation, which is more consistent with the findings of existing studies [41]. The time-lag effects differed only to a lesser extent for different LULC types. For TEMP, the most significant lag effect was observed for EBF, while a significant temporal response of NDVI was shown in all LULC types except WB. Existing studies have shown that the time-lag effects of temperature change are more pronounced in forests at lower elevations [54], so the lagging effect is more significant in EBF at lower elevations than in MF at higher elevations. There is a significant lag effect of precipitation overall except for the CR. The lag effect of SRAD and CO 2 was more uniform across LULC types, and only the lag effect of MF on radiation was more significant than that of other land-use types. This further demonstrates that the effects of climate factors on NDVI are different for different LULC types.

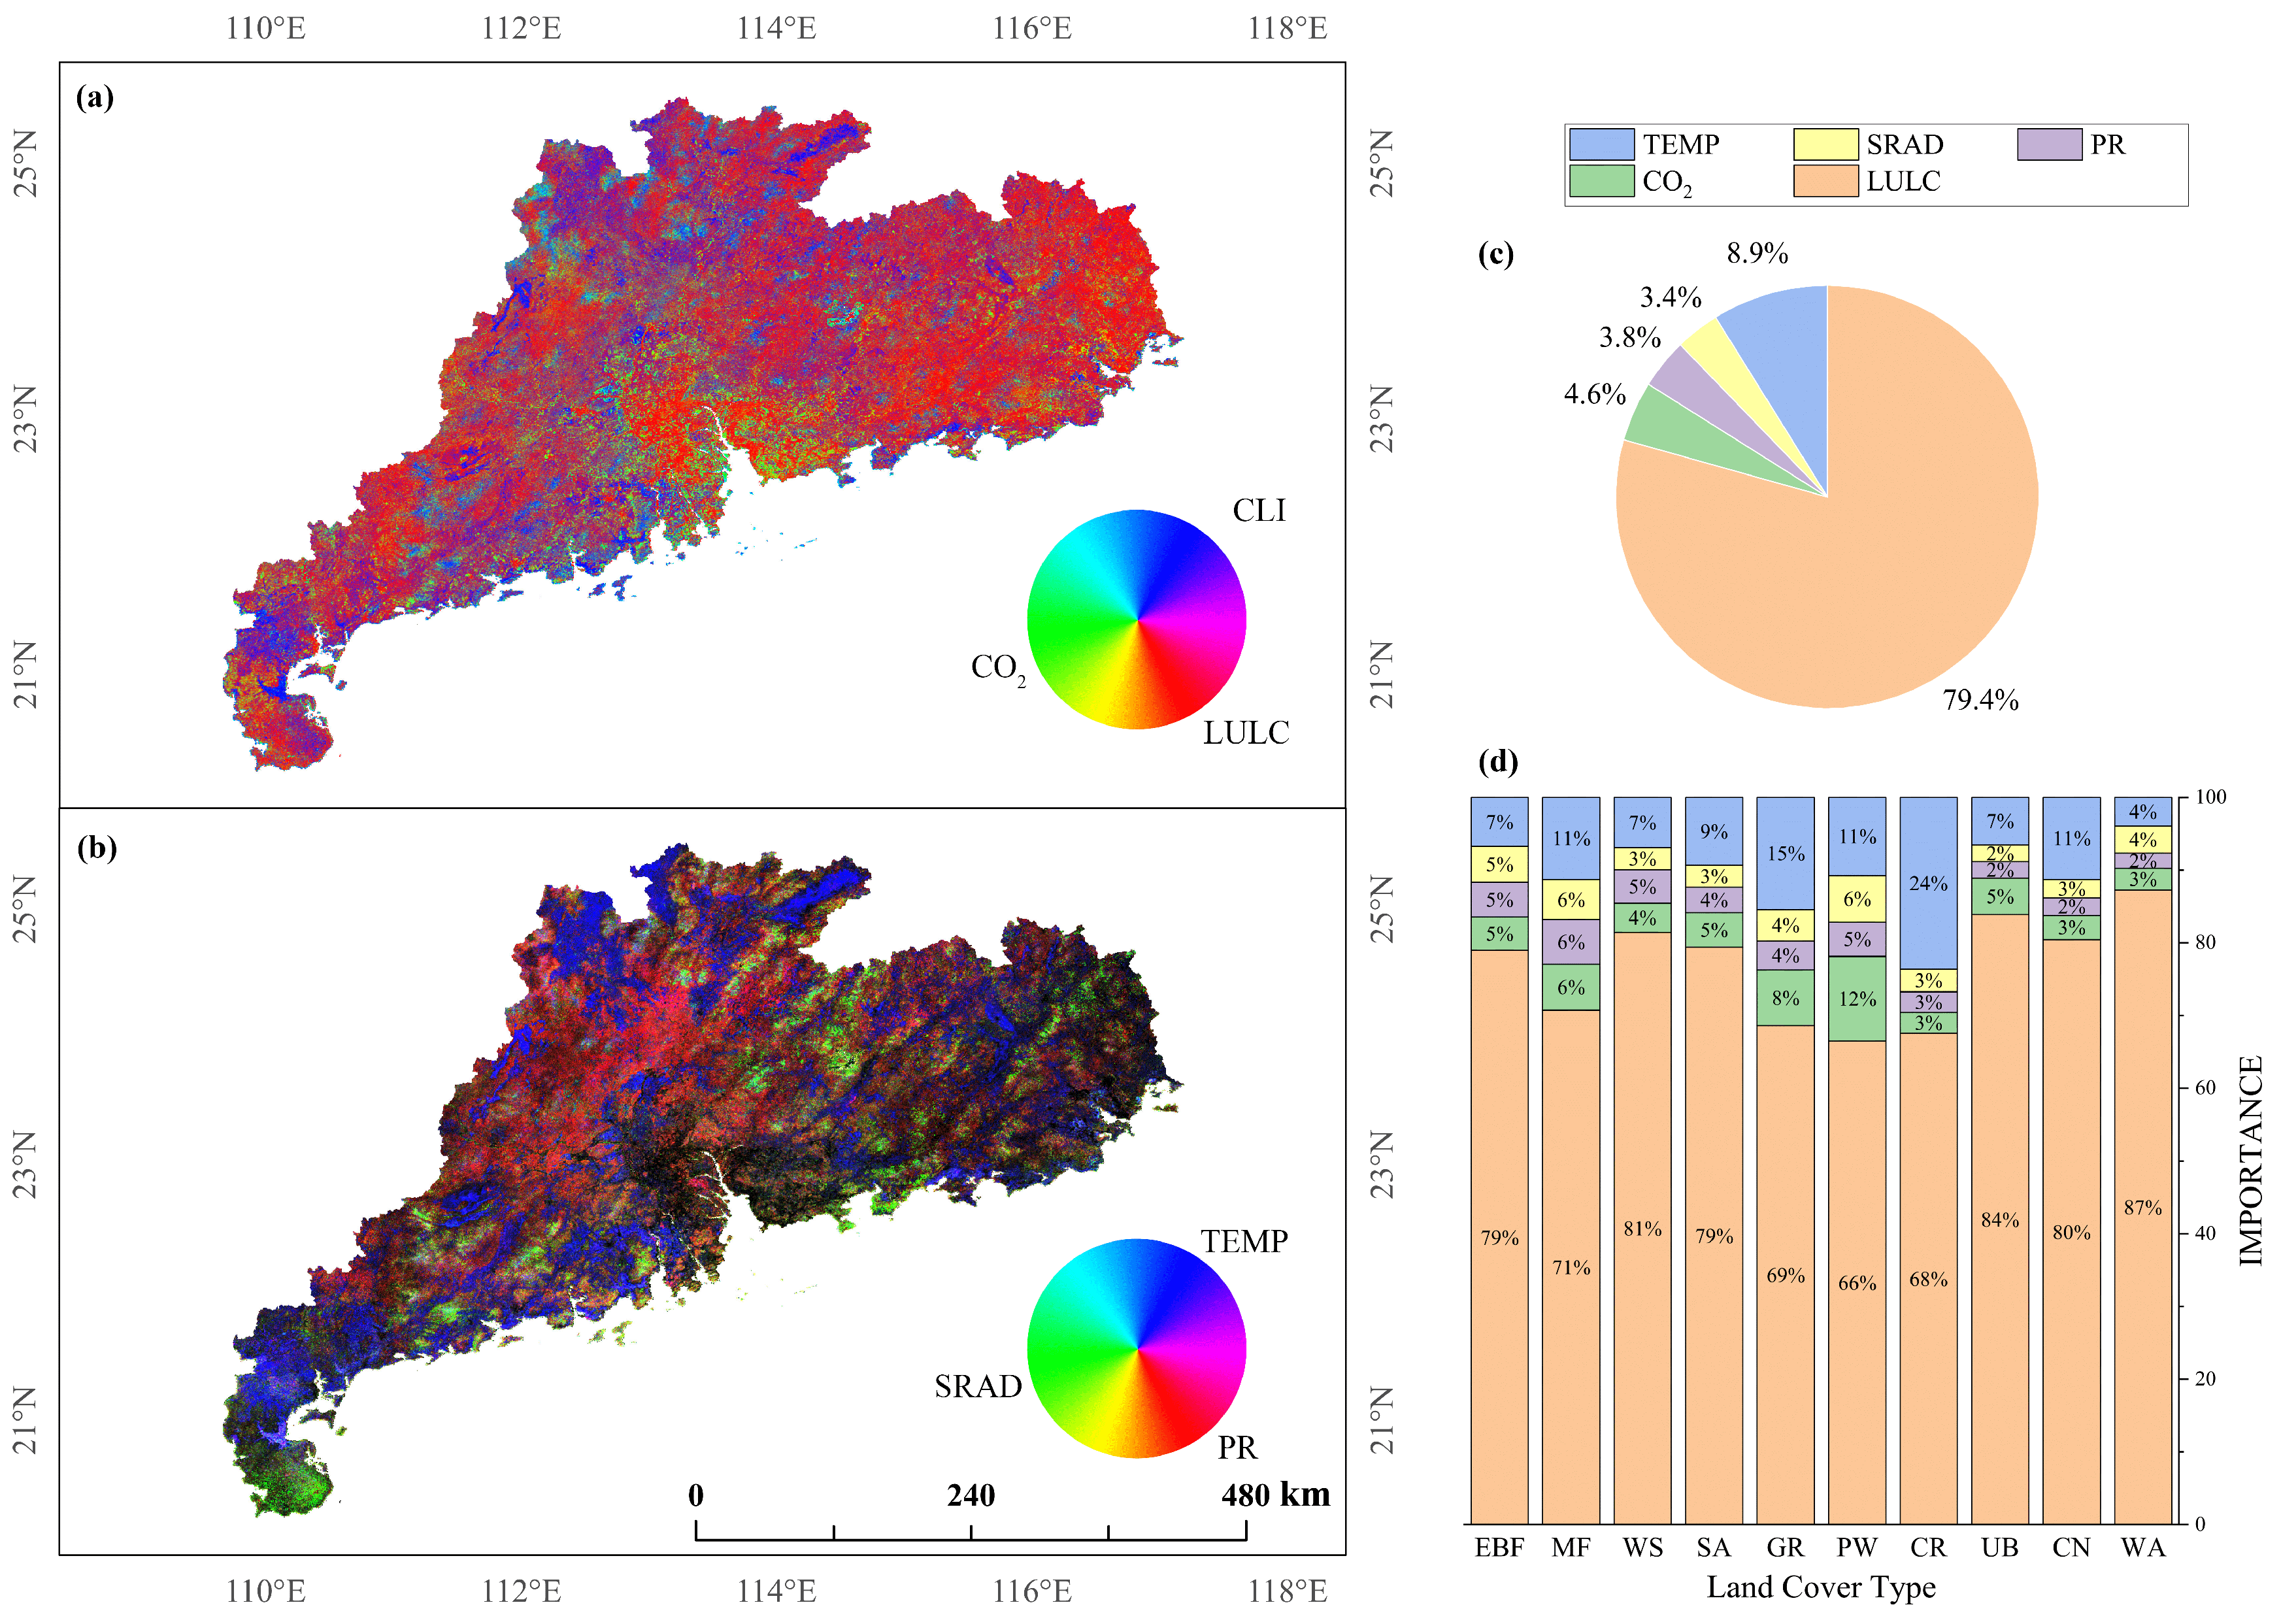
3.3. Attribution of the Variation in Vegetation Greenness

We regressed NDVI using the LULC factor and meteorological factors in southern China by RF and estimated the factor contribution by MDA. The results are shown in Figure 6.
As Figure 6a,c show, the LULC, which accounts for 79.4% of the total contribution, is the major factor affecting the NDVI. Figure 6a also shows that the influence of the climate factor is more significant in WG and NG, while the CO 2 factor is more significant in the city fringe area of the PRD. Specifically, for the three meteorological factors (Figure 6b), the regions dominated by temperature are striped, which is similar to the land-use type map (Figure 1b). The area dominated by precipitation is wider with an insignificant striped distribution, while the area dominated by radiation is small and fragmented. The temperature has obvious differences (4∼27%) in distinct LULC types, while the contributions of precipitation (2∼6%) and radiation (3∼12%) are more uniform in distinct LULC types.

4. Discussion

Studies show that global climate change is affecting the world’s vegetation [55], which has put vegetation at risk of unknown changes. Southern China is a key area of rapid urbanization in China [13] and a transition zone between two floras [23,24,25]. Changes in climate and vegetation here may cause heatwaves, haze, and the rapid spread of tropical diseases [56], threatening human production, health, and even life. Vegetation is more sensitive to the influence of temperature [57], and the increase in temperature may also affect vegetation changes through evapotranspiration [58]. Therefore, for the complex coupled system of meteorology–human activities–vegetation, a comprehensive analysis of multiple factors will help to improve our understanding of vegetation changes.
Our vegetation greenness change consistency analyses show that there has been a continuous greenness trend during 2001–2020 in most plain areas of southern China, which is probably contributed by the vegetation restoration and soil and water conservation policies [59,60]. Although the pattern of greenness change consistency is similar among different regions, NSC and CD still show significant regional variation. The proportion of CD is higher in PRD and EG, with a spatial distribution along the river, which indicates different urbanization modes and connectivity within southern China. The proportion of NSC was higher in NG, which was caused by the higher forest distribution in NG. The differences in the greenness change consistency on different land-use types are more significant. Land-use types that can maintain their NDVI show a high proportion of NSC in EBF, MF, and WS because they have reached their climax [61]. CD is mainly observed in urban areas because urban sprawl can lead to significant vegetation degradation [62]. The other land-use types have more shrubs and are continuing to succession to forest communities, and their NDVIs are mainly represented as CI. Additionally, the amount of anti-continuous pixels is much less than that of continuous pixels, which is probably due to anti-continuous change being more like “Mutation” in a short period, mainly caused by shifts land-use type, such as the expansion of urban fringes [63], while continuous change acts more steadily, mainly caused by activities without a shift in land-use type shift such as afforestation and agricultural-scale expansion of deforestation [17].
In terms of method selection, we regressed the anomaly between the NDVI and the corresponding land-use type rather than directly regressing the original value of the NDVI. The reason can be seen in Figure 7.
Figure 7a shows that there is NDVI divergence among the different LULC types. The forest-dominated LULC types EBF, MF, and WS had the highest NDVIs, followed by the grassland and cropland LULC types, SA, GR, CR, and CN, which were dominated by herbaceous plants. PW, UB, and WA, which were dominated by impervious surfaces and water bodies, had the lowest NDVIs. Thus, there is no doubt that the regional NDVI is mainly controlled by land-use types. As seen in Figure 7b, pixels with only two or fewer land-use types account for more than 90% of the province, and pixels with three or fewer land-use types account for 99.6% of the province. Moreover, 54.1% of the pixels do not undergo land-use type changes. Therefore, LULC can be approximated as constants. For the RFR, the MSE before and after partitioning with constants as features remains unchanged, so the random forest will almost never include LULC in the model, which also leads to the RF not learning the contribution of LULC correctly. In similar studies thus far, separating the NDVI influenced by climate factors from the land-use-influenced part from each other [64,65] and then using RF to regress the NDVI influenced by climate factors separately is a feasible solution, and the two parts of NDVI can be calculated by averaging [66]. In order to ensure the comparability of the contributions among those factors, we use the mean decrease accuracy method to estimate the contribution.
The most important factor influencing the distribution of NDVI was LULC, with a contribution of 79.4%. For vegetation distribution, LULC, as the most important influencing factor, has been confirmed by existing studies [67]. Different land-use patterns result in significant differences in the cover of surface vegetation and thus produce significant NDVI differences. Climate factors contributed to 20.6% of the variance in NDVI distribution. Influenced by factors such as latitude, sea–land location, and topography, meteorological factors differ spatially and directly influence the growth and development process of vegetation [68]. Among them, the temperature factor is the dominant factor, while precipitation and CO 2 are secondary factors [69]. The contribution of the radiation factor varies widely among studiess at different scales, especially at the Chinese scale [70] and the world scale [71], where solar radiation is considered to be the most dominant climate factor affecting the vegetation of southern China. At larger scales, the vegetation types in southern China are often considered to be evergreen broadleaf or mixed forests and ignore the less representative scrub vegetation, and the higher contribution of solar radiation to forest vegetation types is more consistent with the findings of our study. The conclusions of this study at a small scale have more details, which are important for the study conducted in southern China.
The environmental factors whose values are close to the tolerance limit are more important for vegetation [72]. Because the tolerance limit and ecological amplitude change with different vegetation types [73], the contribution of each factor to different LULCs also differs. For LULCs that are not controlled by climate, such as urban and water bodies, the impact of land-use is greater because climate change can barely affect areas where vegetation does not exist, and the NDVI is closer to the base NDVI that is only related to LULC. A similar phenomenon exists in croplands and natural vegetation mosaics [74], which may be because this type is mainly artificial fruit tree orchards, which are clearly subject to human care. For cropland, the increase in temperature will cause a significant yield reduction [75], so it has a significant effect on the NDVI. However, during the life cycle of double-season rice in Guangdong Province [45,74], the variation in CO 2 is very low, and the effect on the NDVI is not significant [76]. Precipitation in Guangdong Province is generally very abundant and does not easily affect the growth of crops, which makes the contribution of precipitation insignificant. Mixed forest is significantly more affected by temperature than evergreen broadleaf forest. While the vapor pressure deficit (VPD) is fully controlled by the temperature with abundant water resources [77], mixed forest, which is more affected by VPD [78], shows a stronger significant relation between temperature and NDVI than evergreen broadleaf forest. Woody savannas and savannas were more influenced by LULC and more influenced by temperature among the climate factors. Their vegetation is dominated by Baeckea frutescens scrub, which is a secondary scrub formed by the succession of subtropical native vegetation after repeated deforestation or fire damage [74], significantly affected by temperature and not significantly affected by precipitation [79].
Although the influencing factors of the NDVI in southern China were quantified in our study, there are still some deficiencies in this study. The pathways through which land-use affects NDVI are still controversial. LULC changes may lead to the destruction of vegetation, resulting in changes in NDVI, and LULC may cause changes in microclimate, which in turn affects NDVI [80]. Factors other than land-use and temperature, precipitation, downgradient shortwave radiation, and CO 2 are ignored in our study, but nitrogen deposition [81], topography [82], and forest fires [83] can also affect changes in vegetation. The temporal and spatial precision of the land-use data in our study is not high enough. This lack of precision makes it difficult for us to observe the urban edge expansion and the NDVI changes it brings. In addition, although the growing period of vegetation in southern China is considered to be year-round in our study, differences in different phenologies can also bring about differences in vegetation changes. In summary, the assessment of more influencing factors at finer temporal and spatial scales is the focus of future research work.

5. Conclusions

The ecosystem is a complex system influenced by many factors, including vegetation greenness. It is important to estimate the factors contributing to vegetation greenness for urban governance and the improvement of ecosystems, especially for complex areas with intertwined human–natural interactions. We quantitatively assessed the spatial and temporal trends of NDVI and the contributions of different climate factors to NDVI in southern China over 20 years using the Hurst exponent, random forest regression, and MDA contribution analysis and obtained the following conclusions:
In the past 20 years, the vegetation in Guangdong has generally shown a slow upward trend, and the growth rate is between 0.02% and 0.04%. The significant upward trend is concentrated in the Pearl River Delta, western Guangdong, and eastern Guangdong, and the upward trend in most areas in northern Guangdong is not significant. The analysis of the Hurst exponent shows that in the past 20 years, the Guangdong area has only shown the characteristics of parallel change. The pixels with continuous vegetation degradation and continuous improvement are concentrated in the Pearl River Delta, eastern Guangdong, and western Guangdong. The northern Guangdong area mainly presents nonsignificant random walks.
RFR is shown in this study as a useful method for assessing the contribution of factors (e.g., land-use, CO 2 , precipitation, radiation, temperature, etc.) affecting vegetation change. The most important factor for the NDVI in southern China is land-use, which accounts for approximately 79.4% of the total contribution. Climate factors further act on the basis of land-use factors, resulting in further differentiation of NDVI on the same land-use type. There are also differences in the contributions of climate factors to the NDVI on the basis of different land-use types. The cause of this phenomenon is mainly related to the climate and vegetation background of southern China.
Different climate factors show different degrees of lagging effects on the NDVI. Among them, the lag effect of temperature is the least significant, while the lag effect of precipitation is the most significant, and the lag effect of CO 2 and radiation is moderate. The lagged impacts on different land-use types differed to a lesser extent.

Author Contributions

Conceptualization, H.L. and X.Z.; formal analysis, H.L. and K.L.; funding acquisition, X.Z.; methodology, H.L.; software, H.L.; writing—original draft, H.L.; writing—review and editing, K.L., X.Z. and J.Z. All authors have read and agreed to the published version of the manuscript.

Funding

This research was funded by the National Natural Science Foundation of China (42090012): The National Key Research and Development Program of China (No. 2016YFB0501404 and No. 2016YFA0600103).

Data Availability Statement

The Yearly MODIS Land Cover Type Yearly Global 500m data are available at https://developers.google.com/earth-engine/datasets/catalog/MODIS_006_MCD12Q1, accessed on 22 January 2022. The MODIS Vegetation indices 16-Day Global 250m data are available at https://developers.google.com/earth-engine/datasets/catalog/MODIS_006_MOD13Q1, accessed on 22 January 2022. The TerraClimate data are available at https://developers.google.com/earth-engine/datasets/catalog/IDAHO_EPSCOR_TERRACLIMATE?hl=en, accessed on 22 January 2022.

Acknowledgments

We would like to thank the Google Earth Engine and TerraClimate for supporting the data availability of the NDVI, LULC, and climate data. We appreciate Guowei Lan for his insightful comments on the refinement of the earlier revision of this manuscript. We appreciate the valuable comments from two anonymous reviewers for improving this manuscript.

Conflicts of Interest

The authors declare no conflict of interest.

References

  1. Wu, Y.; Tang, G.; Gu, H.; Liu, Y.; Yang, M.; Sun, L. The Variation of Vegetation Greenness and Underlying Mechanisms in Guangdong Province of China during 2001–2013 Based on MODIS Data. Sci. Total. Environ. 2019, 653, 536–546. [Google Scholar] [CrossRef] [PubMed]
  2. Fensholt, R.; Langanke, T.; Rasmussen, K.; Reenberg, A.; Prince, S.D.; Tucker, C.; Scholes, R.J.; Le, Q.B.; Bondeau, A.; Eastman, R.; et al. Greenness in Semi-Arid Areas across the Globe 1981–2007—An Earth Observing Satellite Based Analysis of Trends and Drivers. Remote Sens. Environ. 2012, 121, 144–158. [Google Scholar] [CrossRef]
  3. Huntington, T.G. CO2-induced Suppression of Transpiration Cannot Explain Increasing Runoff. Hydrol. Process 2007, 22, 311–314. [Google Scholar] [CrossRef]
  4. Kim, J.H.; Hwang, T.; Yang, Y.; Schaaf, C.L.; Boose, E.; Munger, J.W. Warming-Induced Earlier Greenup Leads to Reduced Stream Discharge in a Temperate Mixed Forest Catchment. J. Geophys. Res. Biogeosci. 2018, 123, 1960–1975. [Google Scholar] [CrossRef]
  5. Stéfanon, M.; Drobinski, P.; D’Andrea, F.; de Noblet-Ducoudré, N. Effects of Interactive Vegetation Phenology on the 2003 Summer Heat Waves. J. Geophys. Res. Atmos. 2012, 117. [Google Scholar] [CrossRef] [Green Version]
  6. Ali, M.G.M.; Ibrahim, M.M.; El Baroudy, A.; Fullen, M.; Omar, E.S.H.; Ding, Z.; Kheir, A.M.S. Climate Change Impact and Adaptation on Wheat Yield, Water Use and Water Use Efficiency at North Nile Delta. Front. Earth Sci. 2020, 14, 522–536. [Google Scholar] [CrossRef]
  7. Tang, W.; Liu, S.; Kang, P.; Peng, X.; Li, Y.; Guo, R.; Jia, J.; Liu, M.; Zhu, L. Quantifying the Lagged Effects of Climate Factors on Vegetation Growth in 32 Major Cities of China. Ecol. Indic. 2021, 132, 108290. [Google Scholar] [CrossRef]
  8. Yuan, W.; Zheng, Y.; Piao, S.; Ciais, P.; Lombardozzi, D.; Wang, Y.; Ryu, Y.; Chen, G.; Dong, W.; Hu, Z.; et al. Increased Atmospheric Vapor Pressure Deficit Reduces Global Vegetation Growth. Sci. Adv. 2019, 5, eaax1396. [Google Scholar] [CrossRef] [Green Version]
  9. Zhou, H.; Van Rompaey, A.; Wang, J. Detecting the Impact of the “Grain for Green” Program on the Mean Annual Vegetation Cover in the Shaanxi Province, China Using SPOT-VGT NDVI Data. Land Use Policy 2009, 26, 954–960. [Google Scholar] [CrossRef]
  10. Ma, W.; Wang, X.; Zhou, N.; Jiao, L. Relative Importance of Climate Factors and Human Activities in Impacting Vegetation Dynamics during 2000–2015 in the Otindag Sandy Land, Northern China. J. Arid. Land 2017, 9, 558–567. [Google Scholar] [CrossRef]
  11. Yuan, W.; Wu, S.Y.; Hou, S.; Xu, Z.; Lu, H. Normalized Difference Vegetation Index-based Assessment of Climate Change Impact on Vegetation Growth in the Humid-Arid Transition Zone in Northern China during 1982–2013. Int. J. Climatol. 2019, 39, 5583–5598. [Google Scholar] [CrossRef]
  12. Xue, J.; Wang, Y.; Teng, H.; Wang, N.; Li, D.; Peng, J.; Biswas, A.; Shi, Z. Dynamics of Vegetation Greenness and Its Response to Climate Change in Xinjiang over the Past Two Decades. Remote Sens. 2021, 13, 4063. [Google Scholar] [CrossRef]
  13. Zhou, Y.; Shan, Y.; Liu, G.; Guan, D. Emissions and Low-Carbon Development in Guangdong-Hong Kong-Macao Greater Bay Area Cities and Their Surroundings. Appl. Energy 2018, 228, 1683–1692. [Google Scholar] [CrossRef] [Green Version]
  14. Kan, X.; Dong, Y.; Feng, L.; Zhou, M.; Hou, H. Contamination and Health Risk Assessment of Heavy Metals in China’s Lead-Zinc Mine Tailings: A Meta-Analysis. Chemosphere 2021, 267, 128909. [Google Scholar] [CrossRef]
  15. Wang, H.F.; Lencinas, M.V.; Ross Friedman, C.; Wang, X.K.; Qiu, J.X. Understory Plant Diversity Assessment of Eucalyptus Plantations over Three Vegetation Types in Yunnan, China. New For. 2011, 42, 101–116. [Google Scholar] [CrossRef]
  16. Huang, B.; Li, Z.; Dong, C.; Zhu, Z.; Zeng, H. The Effects of Urbanization on Vegetation Conditions in Coastal Zone of China. Prog. Phys. Geogr. Earth Environ. 2021, 45, 564–579. [Google Scholar] [CrossRef]
  17. Pandey, B.; Seto, K.C. Urbanization and Agricultural Land Loss in India: Comparing Satellite Estimates with Census Data. J. Environ. Manag. 2015, 148, 53–66. [Google Scholar] [CrossRef]
  18. Zhang, Q.; Wallace, J.; Deng, X.; Seto, K.C. Central versus Local States: Which Matters More in Affecting China’s Urban Growth? Land Use Policy 2014, 38, 487–496. [Google Scholar] [CrossRef]
  19. Gao, Q.; Yu, M.; Xu, H. Directional Climate Trend, Intensified Intraannual Variability, and Changes in Land Cover Drive the Dynamics of Vegetation Greenness in Peri-Urban China During 2001–2015. J. Geophys. Res. Biogeosci. 2020, 125, e2019JG005336. [Google Scholar] [CrossRef] [Green Version]
  20. Jin, Y.; Zhang, H.; Yan, Y.; Cong, P. A Semi-Parametric Geographically Weighted Regression Approach to Exploring Driving Factors of Fractional Vegetation Cover: A Case Study of Guangdong. Sustainability 2020, 12, 7512. [Google Scholar] [CrossRef]
  21. Peng, S.L.; Hou, Y.P.; Chen, B.M. Vegetation Restoration and Its Effects on Carbon Balance in Guangdong Province, China. Restor. Ecol. 2009, 17, 487–494. [Google Scholar] [CrossRef]
  22. Wu, J.; Liu, L.; Sun, C.; Su, Y.; Wang, C.; Yang, J.; Liao, J.; He, X.; Li, Q.; Zhang, C.; et al. Estimating Rainfall Interception of Vegetation Canopy from MODIS Imageries in Southern China. Remote Sens. 2019, 11, 2468. [Google Scholar] [CrossRef] [Green Version]
  23. Cheng-yih, W. The regionalization of chinese flora. Plant Divers. 1979, 1, 1. [Google Scholar]
  24. Takhtadzhian, A.L.; Takhtadzhian, L.A.; Takhtajan, A.; Crovello, T.J. Floristic Regions of the World; University of California Press: Oakland, CA, USA, 1986. [Google Scholar]
  25. Ye, J.; Lu, L.; Liu, B.; Yang, T.; Zhang, J.; Hu, H.; Li, R.; Lu, A.; Liu, H.; Mao, L.; et al. Phylogenetic Delineation of Regional Biota: A Case Study of the Chinese Flora. Mol. Phylogenetics Evol. 2019, 135, 222–229. [Google Scholar] [CrossRef]
  26. Pettorelli, N.; Vik, J.O.; Mysterud, A.; Gaillard, J.M.; Tucker, C.J.; Stenseth, N.C. Using the Satellite-Derived NDVI to Assess Ecological Responses to Environmental Change. Trends Ecol. Evol. 2005, 20, 503–510. [Google Scholar] [CrossRef]
  27. Achard, F.; Estreguil, C. Forest Classification of Southeast Asia Using NOAA AVHRR Data. Remote Sens. Environ. 1995, 54, 198–208. [Google Scholar] [CrossRef]
  28. Fensholt, R.; Rasmussen, K.; Nielsen, T.T.; Mbow, C. Evaluation of Earth Observation Based Long Term Vegetation Trends—Intercomparing NDVI Time Series Trend Analysis Consistency of Sahel from AVHRR GIMMS, Terra MODIS and SPOT VGT Data. Remote Sens. Environ. 2009, 113, 1886–1898. [Google Scholar] [CrossRef]
  29. Gorelick, N.; Hancher, M.; Dixon, M.; Ilyushchenko, S.; Thau, D.; Moore, R. Google Earth Engine: Planetary-scale Geospatial Analysis for Everyone. Remote Sens. Environ. 2017, 202, 18–27. [Google Scholar] [CrossRef]
  30. Didan, K.; Munoz, A.B.; Solano, R.; Huete, A. MODIS Vegetation Index User’s Guide (MOD13 Series); University of Arizona, Vegetation Index and Phenology Lab.: Tucson, AZ, USA, 2015. [Google Scholar]
  31. Sulla-Menashe, D.; Friedl, M.A. User Guide to Collection 6 MODIS Land Cover (MCD12Q1 and MCD12C1) Product; USGS: Reston, VA, USA, 2018; Volume 1, p. 18.
  32. Javed, T.; Yao, N.; Chen, X.; Suon, S.; Li, Y. Drought Evolution Indicated by Meteorological and Remote-Sensing Drought Indices under Different Land Cover Types in China. Environ. Sci. Pollut. Res. 2020, 27, 4258–4274. [Google Scholar] [CrossRef]
  33. Zhang, X.; Yamaguchi, Y.; Li, F.; He, B.; Chen, Y. Assessing the Impacts of the 2009/2010 Drought on Vegetation Indices, Normalized Difference Water Index, and Land Surface Temperature in Southwestern China. Adv. Meteorol. 2017, 2017, e6837493. [Google Scholar] [CrossRef]
  34. He, Y.; Lee, E.; Warner, T.A. Continuous Annual Land Use and Land Cover Mapping Using AVHRR GIMMS NDVI3g and MODIS MCD12Q1 Datasets over China from 1982 to 2012. In Proceedings of the 2016 IEEE International Geoscience and Remote Sensing Symposium (IGARSS), Beijing, China, 10–15 July 2016; pp. 5470–5472. [Google Scholar] [CrossRef]
  35. Liang, D.; Zuo, Y.; Huang, L.; Zhao, J.; Teng, L.; Yang, F. Evaluation of the Consistency of MODIS Land Cover Product (MCD12Q1) Based on Chinese 30 m Globel and 30 Datasets: A Case Study in Anhui Province, China. ISPRS Int. J.-Geo-Inf. 2015, 4, 2519–2541. [Google Scholar] [CrossRef] [Green Version]
  36. Abatzoglou, J.T.; Dobrowski, S.Z.; Parks, S.A.; Hegewisch, K.C. TerraClimate, a High-Resolution Global Dataset of Monthly Climate and Climatic Water Balance from 1958–2015. Sci. Data 2018, 5, 170191. [Google Scholar] [CrossRef] [PubMed] [Green Version]
  37. Mielniczuk, J.; Wojdyłło, P. Estimation of Hurst Exponent Revisited. Comput. Stat. Data Anal. 2007, 51, 4510–4525. [Google Scholar] [CrossRef]
  38. Tong, S.; Zhang, J.; Bao, Y.; Lai, Q.; Lian, X.; Li, N.; Bao, Y. Analyzing Vegetation Dynamic Trend on the Mongolian Plateau Based on the Hurst Exponent and Influencing Factors from 1982–2013. J. Geogr. Sci. 2018, 28, 595–610. [Google Scholar] [CrossRef] [Green Version]
  39. Peng, J.; Liu, Z.; Liu, Y.; Wu, J.; Han, Y. Trend Analysis of Vegetation Dynamics in Qinghai–Tibet Plateau Using Hurst Exponent. Ecol. Indic. 2012, 14, 28–39. [Google Scholar] [CrossRef]
  40. Li, S.; Yan, J.; Liu, X.; Wan, J. Response of Vegetation Restoration to Climate Change and Human Activities in Shaanxi-Gansu-Ningxia Region. J. Geogr. Sci. 2013, 23, 98–112. [Google Scholar] [CrossRef]
  41. Niu, J.; Chen, J.; Sun, L.; Sivakumar, B. Time-Lag Effects of Vegetation Responses to Soil Moisture Evolution: A Case Study in the Xijiang Basin in South China. Stoch. Environ. Res. Risk Assess. 2018, 32, 2423–2432. [Google Scholar] [CrossRef]
  42. Wu, D.; Zhao, X.; Liang, S.; Zhou, T.; Huang, K.; Tang, B.; Zhao, W. Time-Lag Effects of Global Vegetation Responses to Climate Change. Glob. Chang. Biol. 2015, 21, 3520–3531. [Google Scholar] [CrossRef]
  43. Wen, Y.; Liu, X.; Yang, J.; Lin, K.; Du, G. NDVI Indicated Inter-Seasonal Non-Uniform Time-Lag Responses of Terrestrial Vegetation Growth to Daily Maximum and Minimum Temperature. Glob. Planet. Chang. 2019, 177, 27–38. [Google Scholar] [CrossRef]
  44. Dai, S.; Li, H.; Luo, H.; Zhao, Y.; Zhang, K. Changes of Annual Accumulated Temperature over Southern China during 1960–2011. J. Geogr. Sci. 2015, 25, 1155–1172. [Google Scholar] [CrossRef]
  45. Zhang, D.; Pan, Y.; Zhang, J.; Hu, T.; Zhao, J.; Li, N.; Chen, Q. A Generalized Approach Based on Convolutional Neural Networks for Large Area Cropland Mapping at Very High Resolution. Remote Sens. Environ. 2020, 247, 111912. [Google Scholar] [CrossRef]
  46. Breiman, L. Random Forests. Mach. Learn. 2001, 45, 5–32. [Google Scholar] [CrossRef] [Green Version]
  47. Genuer, R.; Poggi, J.M.; Tuleau-Malot, C. Variable Selection Using Random Forests. Pattern Recognit. Lett. 2010, 31, 2225–2236. [Google Scholar] [CrossRef] [Green Version]
  48. Grabska, E.; Hostert, P.; Pflugmacher, D.; Ostapowicz, K. Forest Stand Species Mapping Using the Sentinel-2 Time Series. Remote Sens. 2019, 11, 1197. [Google Scholar] [CrossRef] [Green Version]
  49. Sobol, M.K.; Finkelstein, S.A. Predictive Pollen-Based Biome Modeling Using Machine Learning. PLoS ONE 2018, 13, e0202214. [Google Scholar] [CrossRef]
  50. Hu, M.; Xia, B. A Significant Increase in the Normalized Difference Vegetation Index during the Rapid Economic Development in the Pearl River Delta of China. Land Degrad. Dev. 2019, 30, 359–370. [Google Scholar] [CrossRef]
  51. Zhou, C.; Wei, X.; Zhou, G.; Yan, J.; Wang, X.; Wang, C.; Liu, H.; Tang, X.; Zhang, Q. Impacts of a Large-Scale Reforestation Program on Carbon Storage Dynamics in Guangdong, China. For. Ecol. Manag. 2008, 255, 847–854. [Google Scholar] [CrossRef]
  52. Liu, W.; Zhan, J.; Zhao, F.; Yan, H.; Zhang, F.; Wei, X. Impacts of Urbanization-Induced Land-Use Changes on Ecosystem Services: A Case Study of the Pearl River Delta Metropolitan Region, China. Ecol. Indic. 2019, 98, 228–238. [Google Scholar] [CrossRef]
  53. Wu, J.; Wang, T.; Pan, K.; Li, W.; Huang, X. Assessment of Forest Damage Caused by an Ice Storm Using Multi-Temporal Remote-Sensing Images: A Case Study from Guangdong Province. Int. J. Remote Sens. 2016, 37, 3125–3142. [Google Scholar] [CrossRef]
  54. Bertrand, R.; Lenoir, J.; Piedallu, C.; Riofrío-Dillon, G.; de Ruffray, P.; Vidal, C.; Pierrat, J.C.; Gégout, J.C. Changes in Plant Community Composition Lag behind Climate Warming in Lowland Forests. Nature 2011, 479, 517–520. [Google Scholar] [CrossRef]
  55. Afuye, G.A.; Kalumba, A.M.; Busayo, E.T.; Orimoloye, I.R. A Bibliometric Review of Vegetation Response to Climate Change. Environ. Sci. Pollut. Res. 2022, 29, 18578–18590. [Google Scholar] [CrossRef] [PubMed]
  56. Yao-Dong, D.; Xian-Wei, W.; Xiao-Feng, Y.; Wen-Jun, M.; Hui, A.; Xiao-Xuan, W. Impacts of Climate Change on Human Health and Adaptation Strategies in South China. Adv. Clim. Chang. Res. 2013, 4, 208–214. [Google Scholar] [CrossRef]
  57. Wang, H.; Li, Z.; Cao, L.; Feng, R.; Pan, Y. Response of NDVI of Natural Vegetation to Climate Changes and Drought in China. Land 2021, 10, 966. [Google Scholar] [CrossRef]
  58. Luo, H.; Dai, S.; Li, M.; Liu, E.; Li, Y.; Xie, Z. NDVI-Based Analysis of the Influence of Climate Changes and Human Activities on Vegetation Variation on Hainan Island. J. Indian Soc. Remote Sens. 2021, 49, 1755–1767. [Google Scholar] [CrossRef]
  59. Cai, R.; Xu, R.; Chen, Y.; Miao, L.; Wang, J. Analysis of Temporal-Spatial Characteristics of Vegetation NPP in Guangdong Province. J. Agric. Mech. Res. 2009, 31, 9–11. [Google Scholar]
  60. Wang, J.; Meng, J.; Cai, Y. Assessing Vegetation Dynamics Impacted by Climate Change in the Southwestern Karst Region of China with AVHRR NDVI and AVHRR NPP Time-Series. Environ. Geol. 2008, 54, 1185–1195. [Google Scholar] [CrossRef]
  61. Oosting, H.J. The Study of Plant Communities. An Introduction to Plant Ecology. Herb. Abstr. 1956, 22, 679. [Google Scholar]
  62. Cao, Y.; Wang, Y.; Li, G.; Fang, X. Vegetation Response to Urban Landscape Spatial Pattern Change in the Yangtze River Delta, China. Sustainability 2020, 12, 68. [Google Scholar] [CrossRef] [Green Version]
  63. Wu, Z.; Li, Z.; Zeng, H. Using Remote Sensing Data to Study the Coupling Relationship between Urbanization and Eco-Environment Change: A Case Study in the Guangdong-Hong Kong-Macao Greater Bay Area. Sustainability 2020, 12, 7875. [Google Scholar] [CrossRef]
  64. Liu, N.; Ding, Y.; Peng, S. Temporal Effects of Climate on Vegetation Trigger the Response Biases of Vegetation to Human Activities. Glob. Ecol. Conserv. 2021, 31, e01822. [Google Scholar] [CrossRef]
  65. Ren, Y.; Liu, J.; Liu, S.; Wang, Z.; Liu, T.; Shalamzari, M.J. Effects of Climate Change on Vegetation Growth in the Yellow River Basin from 2000 to 2019. Remote Sens. 2022, 14, 687. [Google Scholar] [CrossRef]
  66. Shi, Y.; Jin, N.; Ma, X.; Wu, B.; He, Q.; Yue, C.; Yu, Q. Attribution of Climate and Human Activities to Vegetation Change in China Using Machine Learning Techniques. Agric. For. Meteorol. 2020, 294, 108146. [Google Scholar] [CrossRef]
  67. Li, J.; Wang, J.; Zhang, J.; Liu, C.; He, S.; Liu, L. Growing-Season Vegetation Coverage Patterns and Driving Factors in the China-Myanmar Economic Corridor Based on Google Earth Engine and Geographic Detector. Ecol. Indic. 2022, 136, 108620. [Google Scholar] [CrossRef]
  68. der Maarel, E.V.; Franklin, J. Vegetation Ecology; John Wiley & Sons: Hoboken, NJ, USA, 2012. [Google Scholar]
  69. Gao, J.; Jiao, K.; Wu, S.; Ma, D.; Zhao, D.; Yin, Y.; Dai, E. Past and Future Effects of Climate Change on Spatially Heterogeneous Vegetation Activity in China. Earth Future 2017, 5, 679–692. [Google Scholar] [CrossRef] [Green Version]
  70. Ge, W.; Deng, L.; Wang, F.; Han, J. Quantifying the Contributions of Human Activities and Climate Change to Vegetation Net Primary Productivity Dynamics in China from 2001 to 2016. Sci. Total. Environ. 2021, 773, 145648. [Google Scholar] [CrossRef]
  71. Nemani, R.R.; Keeling, C.D.; Hashimoto, H.; Jolly, W.M.; Piper, S.C.; Tucker, C.J.; Myneni, R.B.; Running, S.W. Climate-Driven Increases in Global Terrestrial Net Primary Production from 1982 to 1999. Science 2003, 1982, 1560–1563. [Google Scholar] [CrossRef] [Green Version]
  72. Shelford, V.E. Some Concepts of Bioecology. Ecology 1931, 12, 455–467. [Google Scholar] [CrossRef]
  73. Erofeeva, E.A. Plant Hormesis and Shelford’s Tolerance Law Curve. J. For. Res. 2021, 32, 1789–1802. [Google Scholar] [CrossRef]
  74. Hou, X.Y. Vegetational Geography and Chemical Components of Dominant Plants in China; Science Press: Beijing, China, 1982. [Google Scholar]
  75. Song, Y.; Wang, C.; Linderholm, H.W.; Fu, Y.; Cai, W.; Xu, J.; Zhuang, L.; Wu, M.; Shi, Y.; Wang, G.; et al. The Negative Impact of Increasing Temperatures on Rice Yields in Southern China. Sci. Total. Environ. 2022, 820, 153262. [Google Scholar] [CrossRef]
  76. Ziska, L.H.; Bunce, J.A. Predicting the Impact of Changing CO2 on Crop Yields: Some Thoughts on Food. New Phytol. 2007, 175, 607–618. [Google Scholar] [CrossRef]
  77. Novick, K.A.; Ficklin, D.L.; Stoy, P.C.; Williams, C.A.; Bohrer, G.; Oishi, A.C.; Papuga, S.A.; Blanken, P.D.; Noormets, A.; Sulman, B.N.; et al. The Increasing Importance of Atmospheric Demand for Ecosystem Water and Carbon Fluxes. Nat. Clim. Chang. 2016, 6, 1023–1027. [Google Scholar] [CrossRef] [Green Version]
  78. Li, Y.; Zhou, L.; Wang, S.; Chi, Y.; Chen, J. Leaf Temperature and Vapour Pressure Deficit (VPD) Driving Stomatal Conductance and Biochemical Processes of Leaf Photosynthetic Rate in a Subtropical Evergreen Coniferous Plantation. Sustainability 2018, 10, 4063. [Google Scholar] [CrossRef] [Green Version]
  79. Xie, C.; Huang, B.; Jim, C.Y.; Han, W.; Liu, D. Predicting Differential Habitat Suitability of Rhodomyrtus Tomentosa under Current and Future Climate Scenarios in China. For. Ecol. Manag. 2021, 501, 119696. [Google Scholar] [CrossRef]
  80. Wang, R.; Gao, W.; Peng, W. Spatial Downscaling Method for Air Temperature through the Correlation between Land Use/Land Cover and Microclimate: A Case Study of the Greater Tokyo Area, Japan. Urban Clim. 2021, 40, 101003. [Google Scholar] [CrossRef]
  81. Gong, Y.; Wu, J. Vegetation Composition Modulates the Interaction of Climate Warming and Elevated Nitrogen Deposition on Nitrous Oxide Flux in a Boreal Peatland. Glob. Chang. Biol. 2021, 27, 5588–5598. [Google Scholar] [CrossRef]
  82. Tong, X.; Wang, K.; Yue, Y.; Liao, C. Trends in Vegetation Change under Different Karst Terrain Conditions, Southwest China. In Proceedings of the MIPPR 2013: Remote Sensing Image Processing, Geographic Information Systems, and Other Applications, Wuhan, China, 26–27 October 2013; Volume 8921, pp. 393–398. [Google Scholar] [CrossRef]
  83. Hilwan, I. Method of Estimating Forest Fire Impact on Vegetation. IOP Conf. Ser. Earth Environ. Sci. 2020, 504, 012004. [Google Scholar] [CrossRef]
Figure 1. Map of the geographical location of China and southern China: (a) China’s administrative divisions map. PRD, WG, EG, and NG denote the Pearl River Delta, western Guangdong, eastern Guangdong, and northern Guangdong, respectively; (b) spatial distribution of land-use pluralities in southern China from 2001 to 2020; (c) statistics on the number and percentage of plural land-use types of pixels.
Remotesensing 14 03291 g001
Figure 2. Spatial and temporal trends of the NDVI from 2000 to 2020 in southern China. (a) The spatial distribution of the NDVI trend in southern China from 2000 to 2020 monthly maxima. PES, PS, PN, NES, NS, and NN denote Positive Extremely Significant, Positive Significant, Positive None Significant, Negative Extremely Significant, Negative Significant, and Negative None Significant, respectively. (b) The fold line graph of the NDVI mean trend in major regions from 2000 to 2020 in southern China. (c) The stack bar of the trend grouped by types of significance in major regions. (d) The box graph of the NDVI trend slope in southern China from 2000 to 2020 grouped by trend significance type and region.
Remotesensing 14 03291 g002
Figure 3. Consistency of vegetation greenness in southern China. (a) The spatial distribution of the 2000–2020 NDVI monthly maximum Hurst exponent in southern China. (b) the spatial distribution of the NDVI change trend in Guangdong Province. CI, CD, AI, AD, and NSC denote continuous improvement, continuous deterioration, anti-continuous improvement, anti-continuous deterioration, and nonsignificant change, respectively. (c) The proportion of each greenness trend and consistency categories in each LULC types. (d) The categorized box graph of the 2000–2020 NDVI monthly maximum Hurst exponent in southern China by types of region and change trends.
Remotesensing 14 03291 g003
Figure 4. Twenty-year averages (ad) and annual mean change rates (eh) of precipitation, downgradient shortwave radiation, monthly minimum temperature, and monthly maximum temperature in southern China.
Remotesensing 14 03291 g004
Figure 5. Time-lag effect of NDVI impact factors for each LULC type in Guangdong Province: (a) for temperature, (b) for precipitation, (c) for shortwave downgradient radiation, and (d) for CO 2 .
Remotesensing 14 03291 g005
Figure 6. The contribution of each factor to NDVI given by random forest: (a) plotting the R, G, and B channels of LULC, CO 2 , and climate factors; (b) plots the R, G, and B channels of precipitation, shortwave radiation, and temperature; (c) shows the average of the contribution of each factor for each pixel; (d) shows the average contribution of each factor for each LULC type.
Remotesensing 14 03291 g006
Figure 7. The NDVI of different LULC and the number of LULC types that have occurred in 20 years in southern China. (a) The NDVI boxplot of each LULC type in southern China. (b) The proportion of the number of pixels in different LULC types during the 20 years. (c) The number of different LULC types during the 20 years in each pixel.
Remotesensing 14 03291 g007
Table 1. Assessment of vegetation greenness change persistence using linear regression results and the Hurst exponent.
Pixel Category Linear Regression Slope Hurst Exponent
Continuous Improvement (CI) >0, significant ≥0.5
Continuous Deterioration (CD) <0, significant ≥0.5
Anti-continuous Improvement (AI) >0, significant ≤0.5
Anti-continuous Deterioration (AD) <0, significant ≤0.5
No Significant Change (NSC) not significant Any
Publisher’s Note: MDPI stays neutral with regard to jurisdictional claims in published maps and institutional affiliations.

