
How to Include Crowd-Sourced Photogrammetry in a Geohazard Observatory—Case Study of the Giant’s Causeway Coastal Cliffs

 , and
, and
Abstract
:
1. Introduction
- (1)
- Collecting more data that are potentially more frequent or better distributed geographically and therefore make it possible to design a monitoring strategy that is better adapted to the spatial and temporal dynamics of the site.
- (2)
- Increasing awareness of citizens about their environment and contributing to stimulate scientific curiosity. This aspect is particularly interesting for environmental issues and risk prevention, but it is not addressed in the present study.
2. Methods
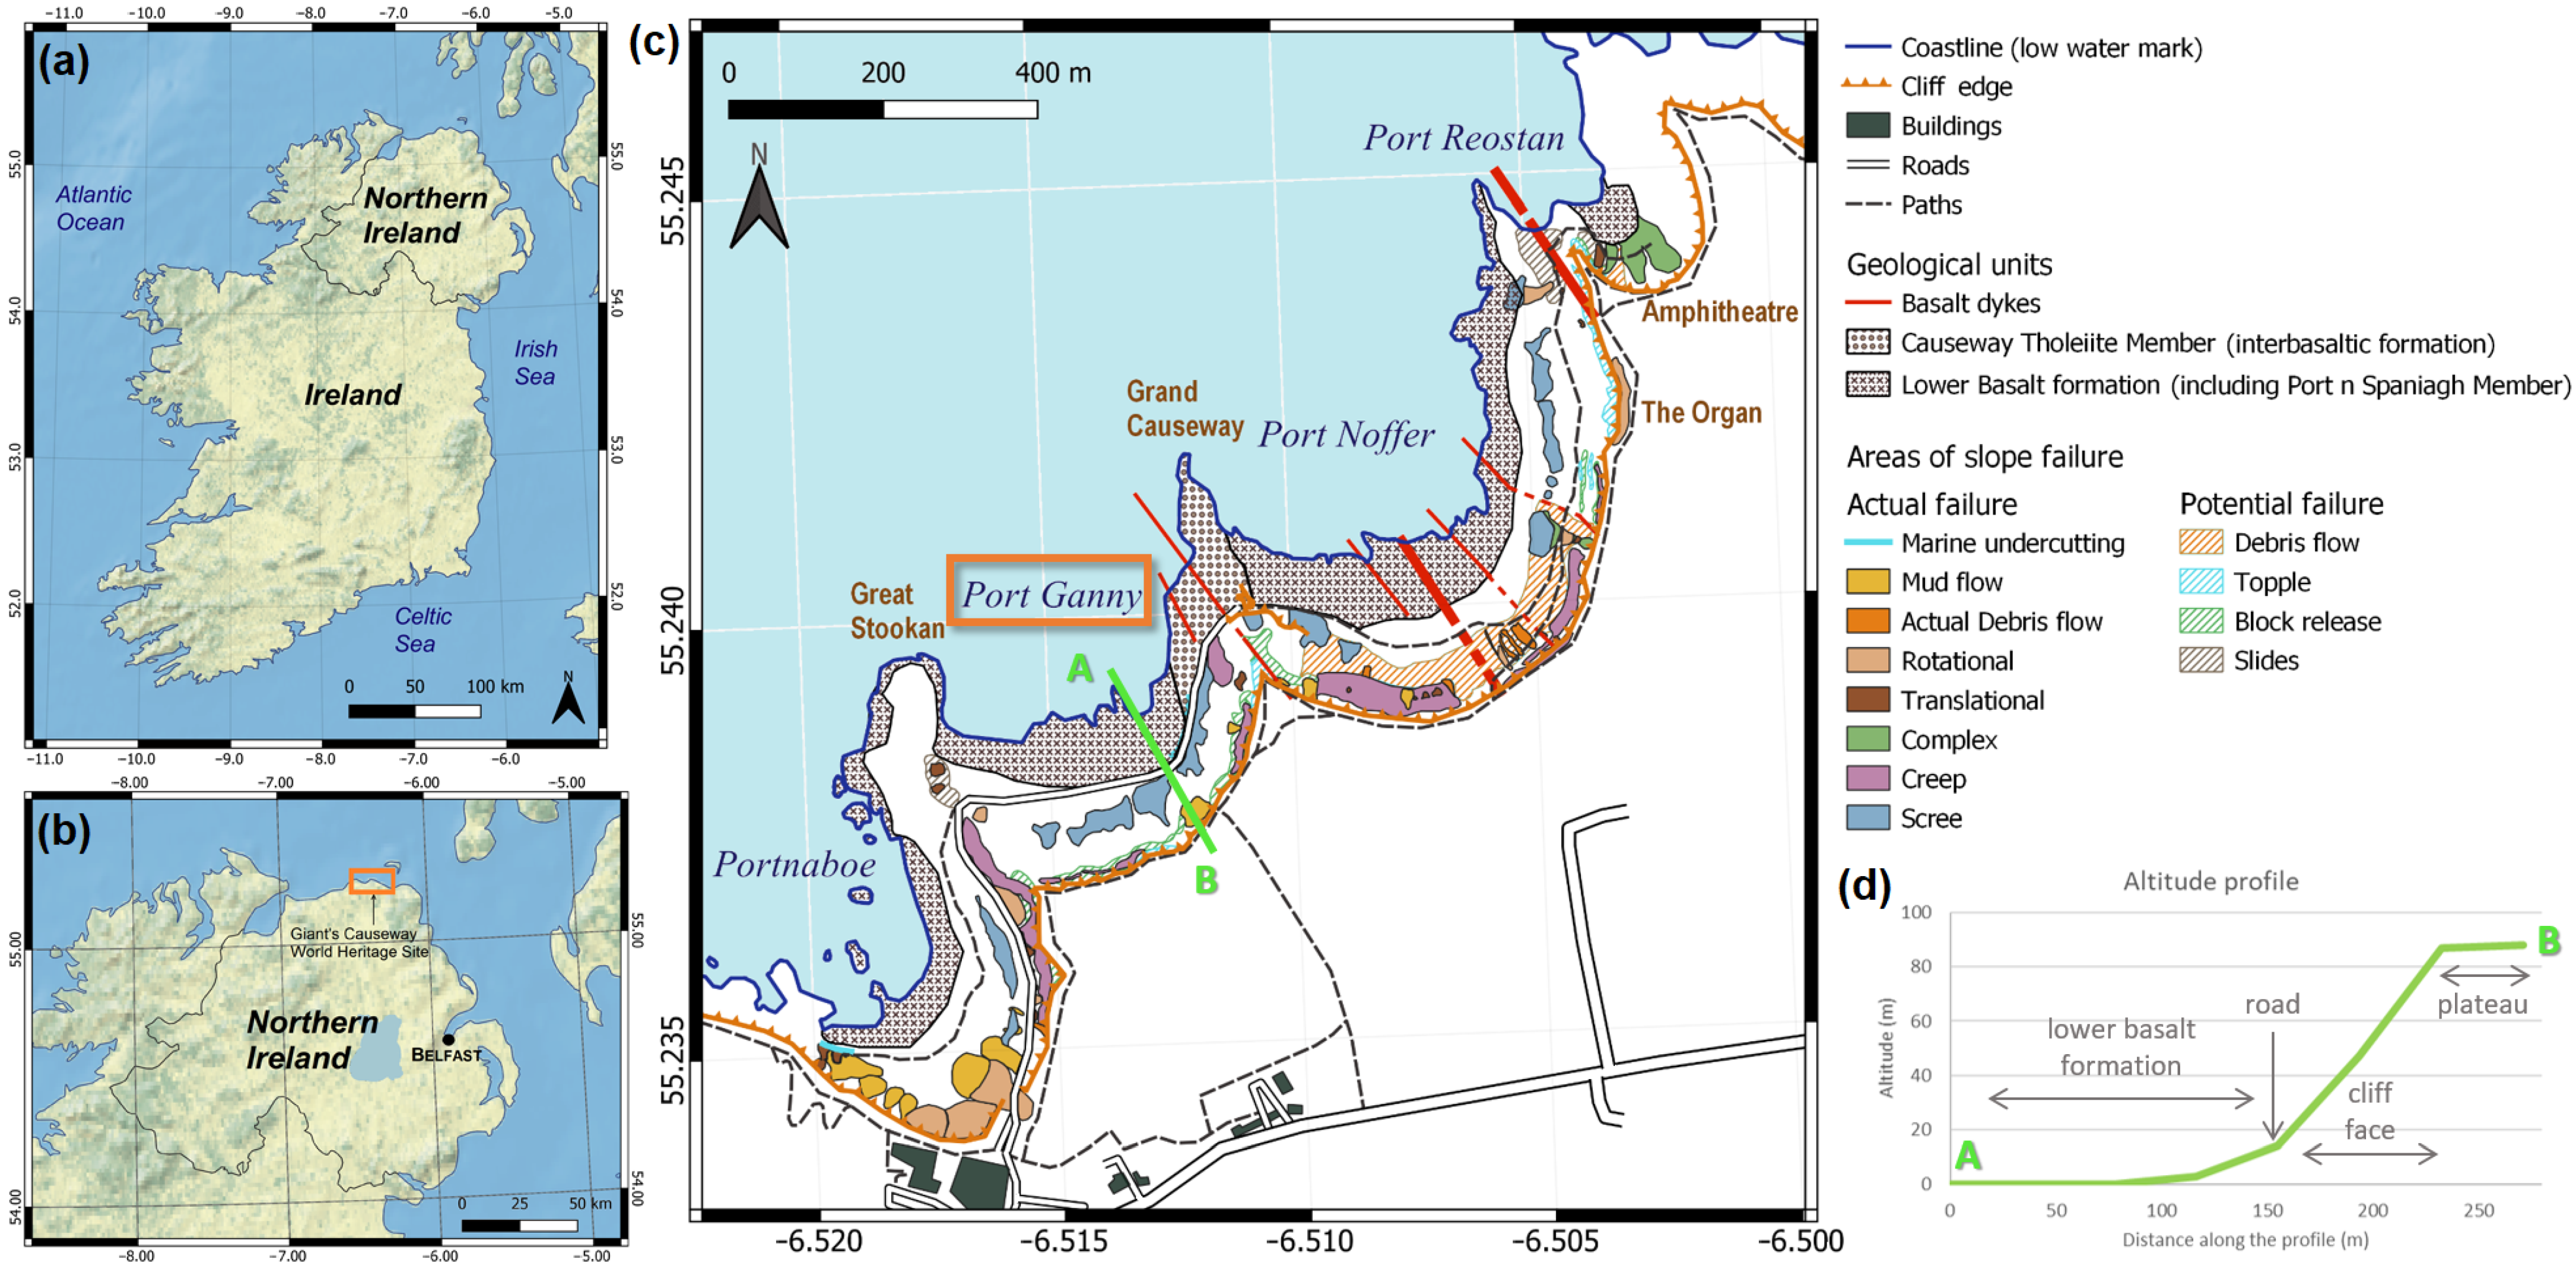
2.1. Study Area
2.1.1. Geological Setting
2.1.2. Site Management
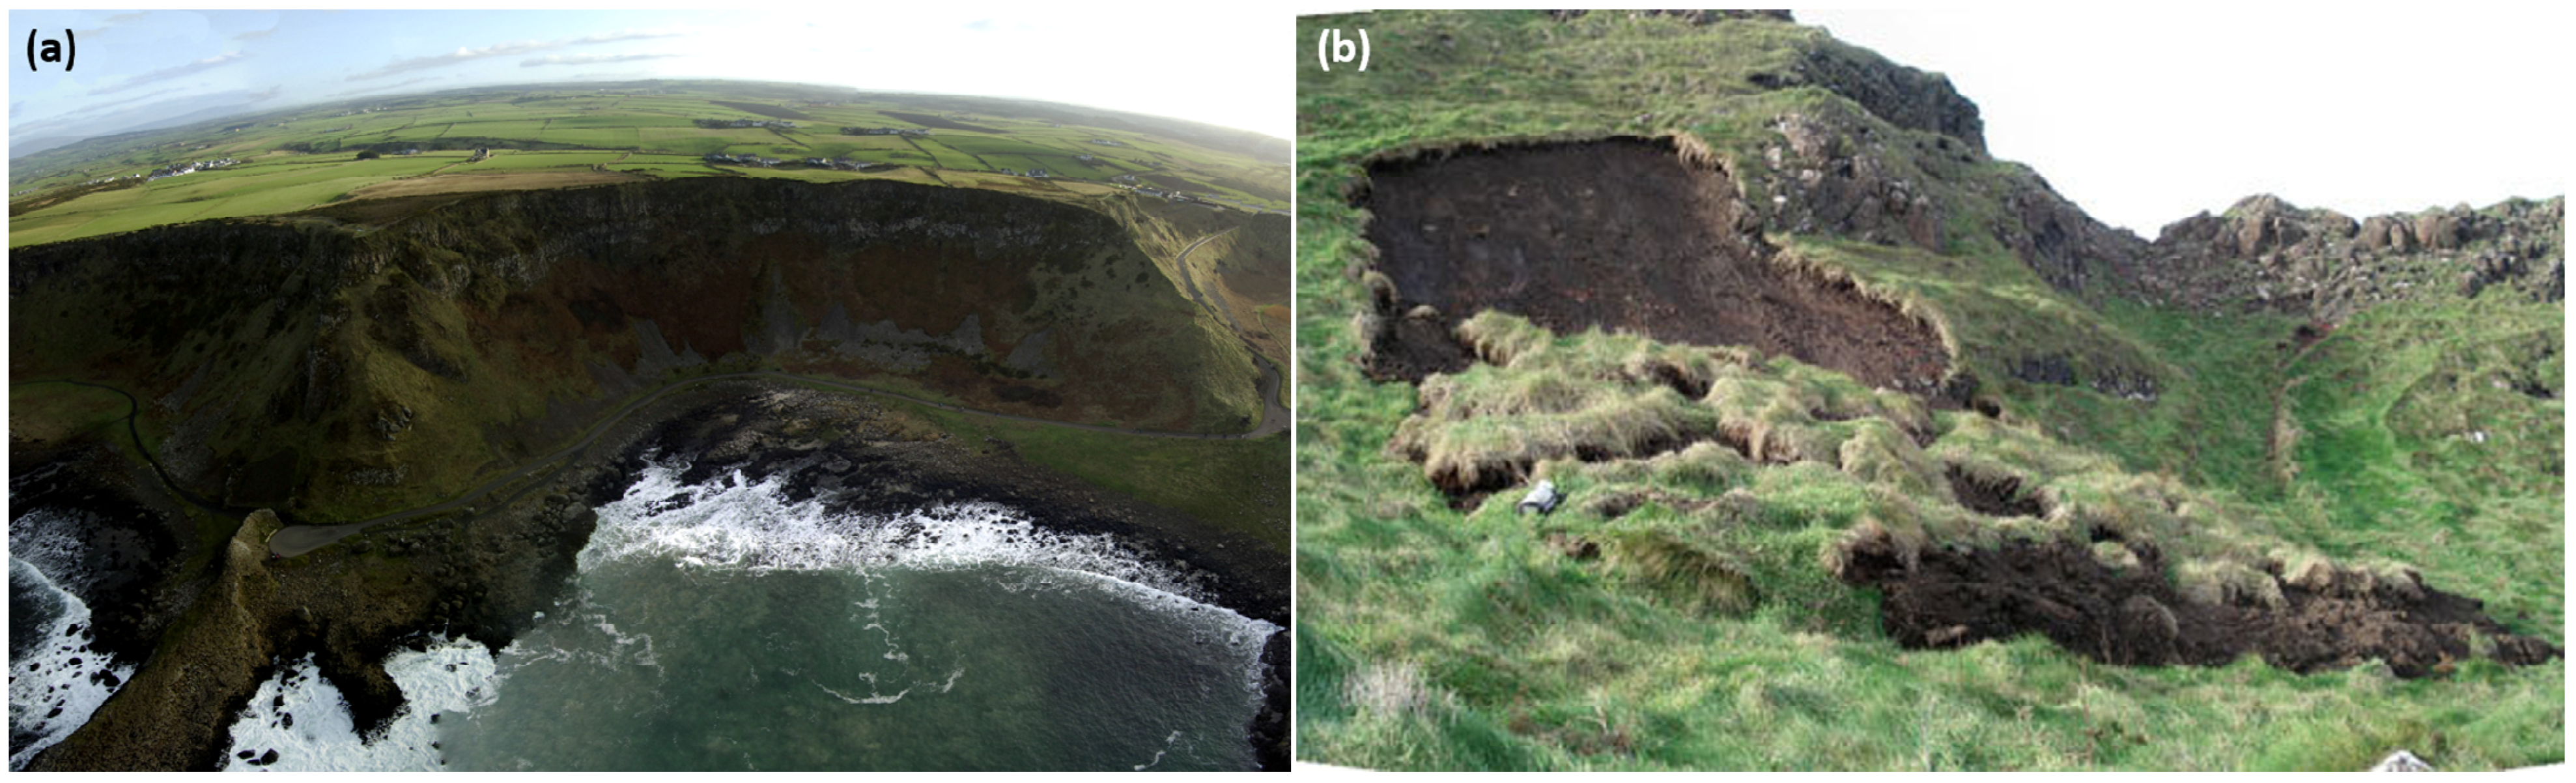
2.1.3. Geological Hazards
2.2. Site Monitoring by Terrestrial Photogrammetry
2.2.1. “Expert” Reference Dataset
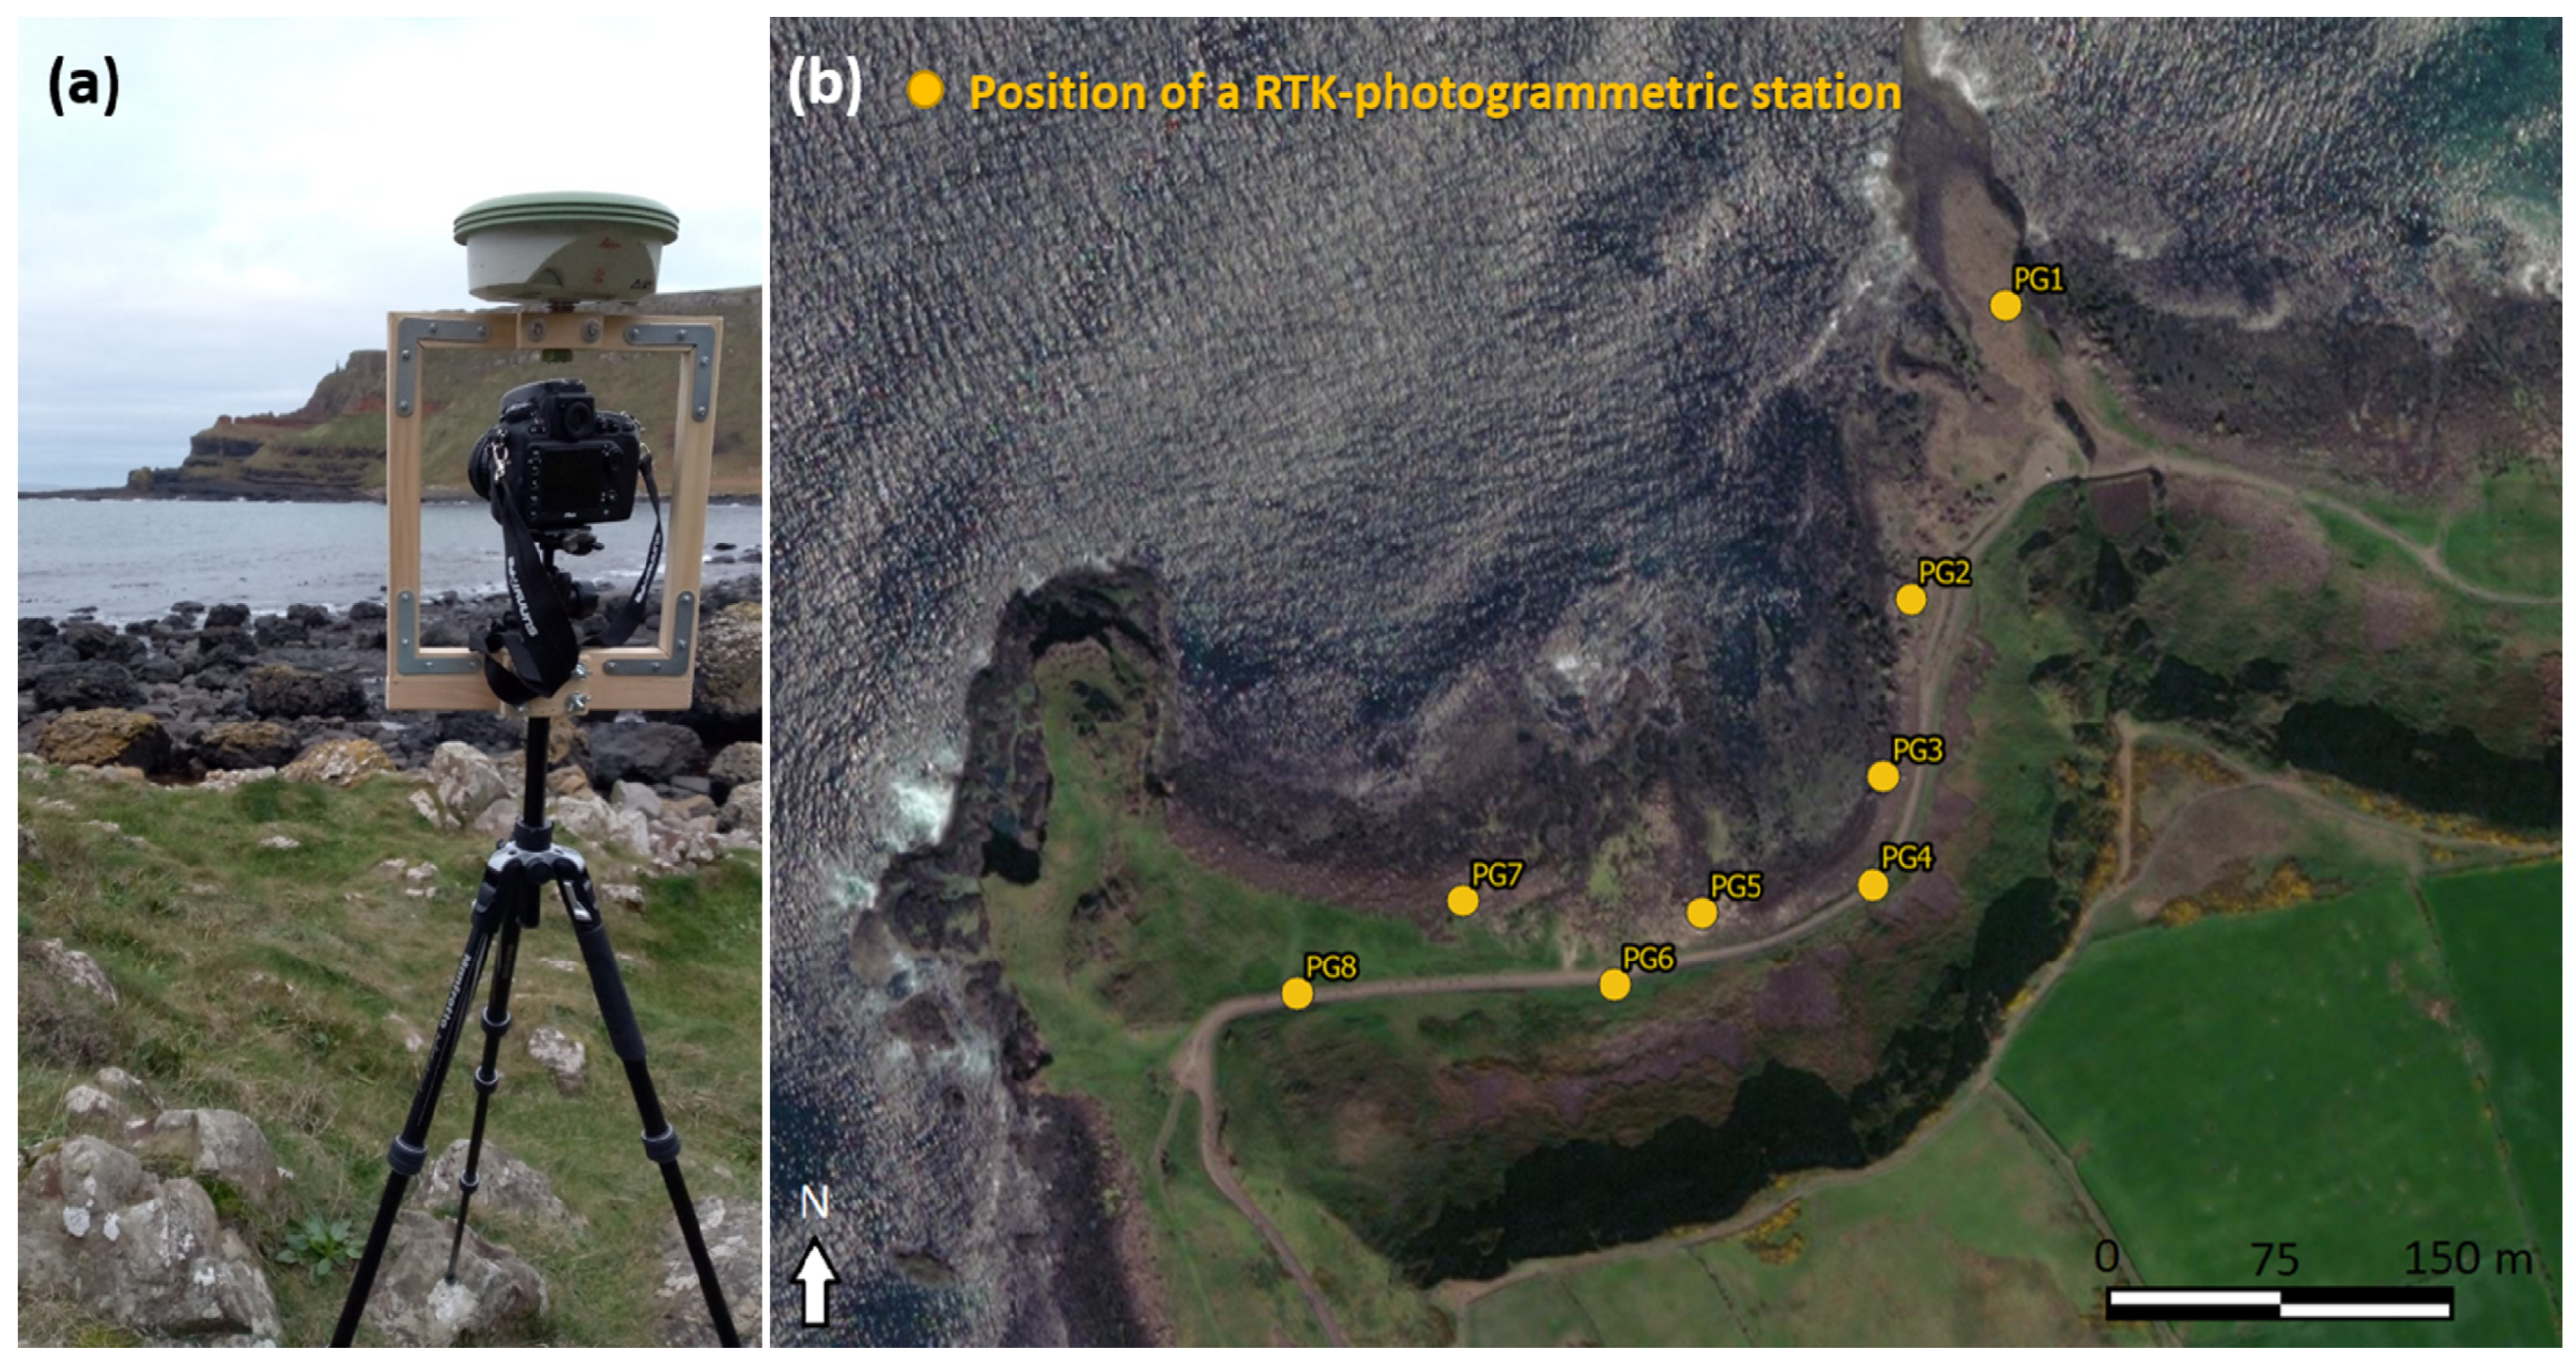
Survey Settings
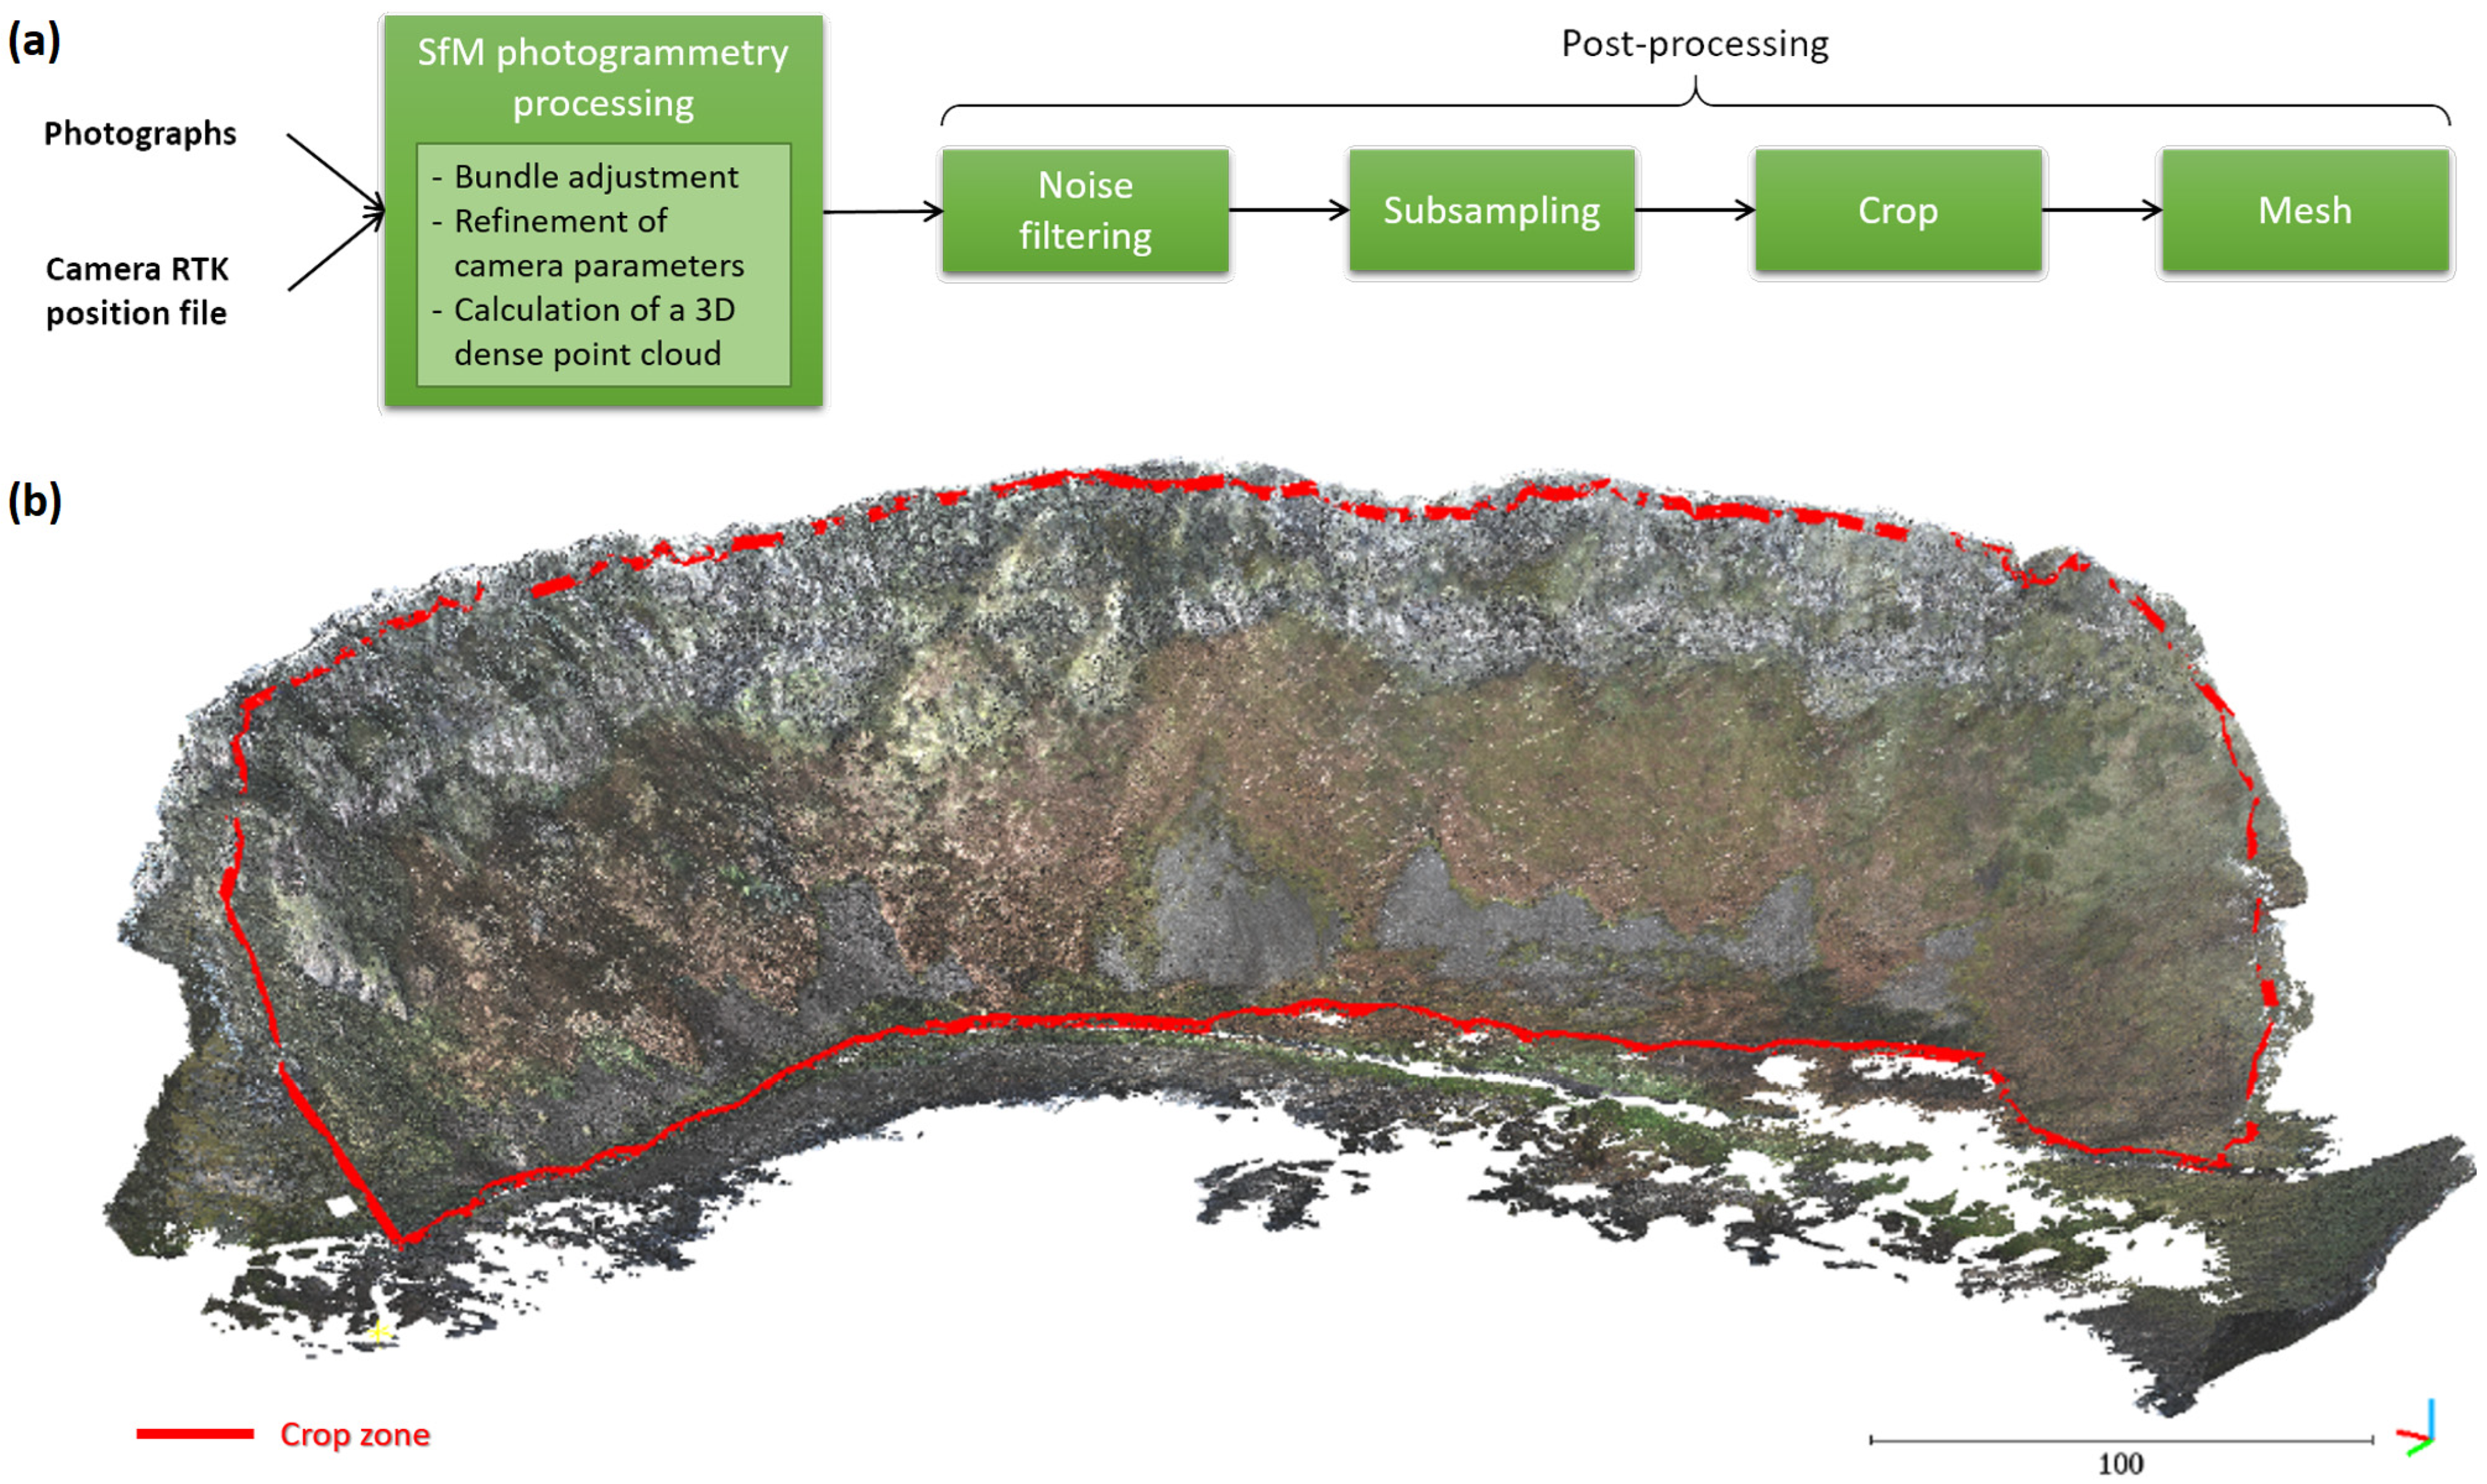
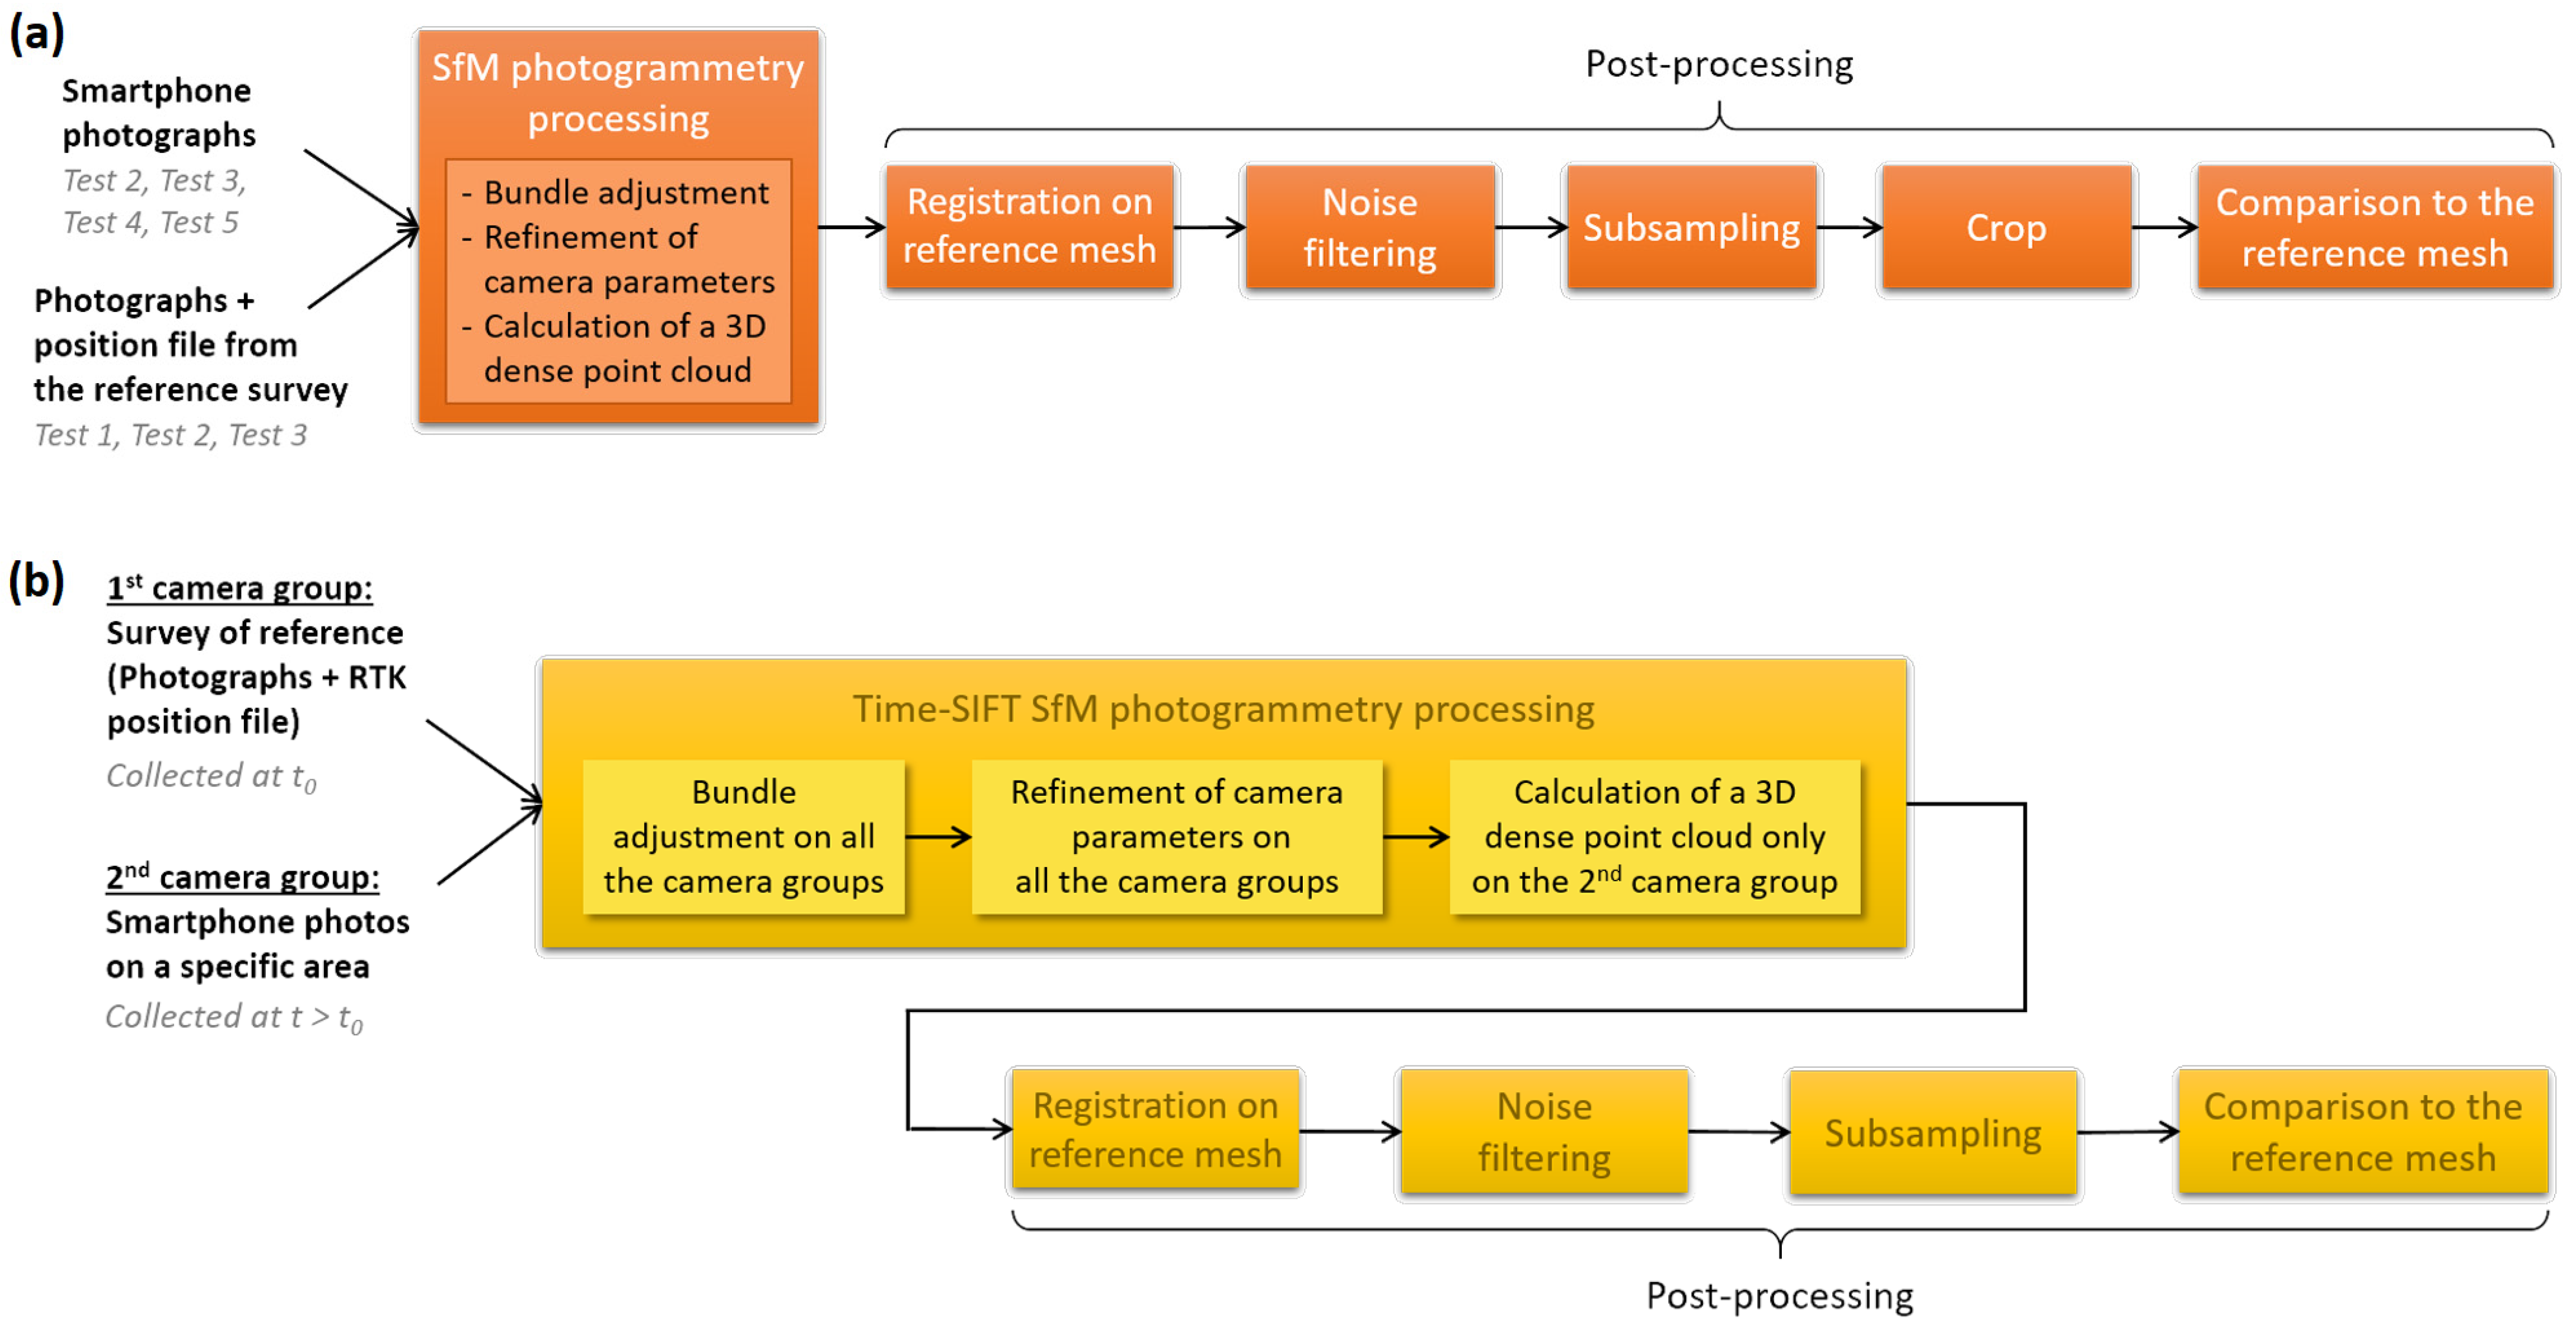
Data Processing
- -
- Creation and formatting of a camera position file compatible with Agisoft Metashape®;
- -
- Image orientation by bundle adjustment (detection and matching of homologous key points in overlapping photographs). This step allows us to compute the extrinsic parameters of each camera.
- -
- Refinement of camera calibration parameters (intrinsic parameters) by optimization, using the redundancy of information on pixels observed in several images and the RTK-georeferenced camera positions. The RTK GNSS–measured positions are taken as initial values, and their variations are constrained here in a radius of 10 cm.
- -
- Dense image matching to produce a dense point cloud by using the estimated extrinsic and intrinsic camera parameters.
2.2.2. Use of Crowd-Sourced Images
Survey Settings
Data Processing at a Given Date
- -
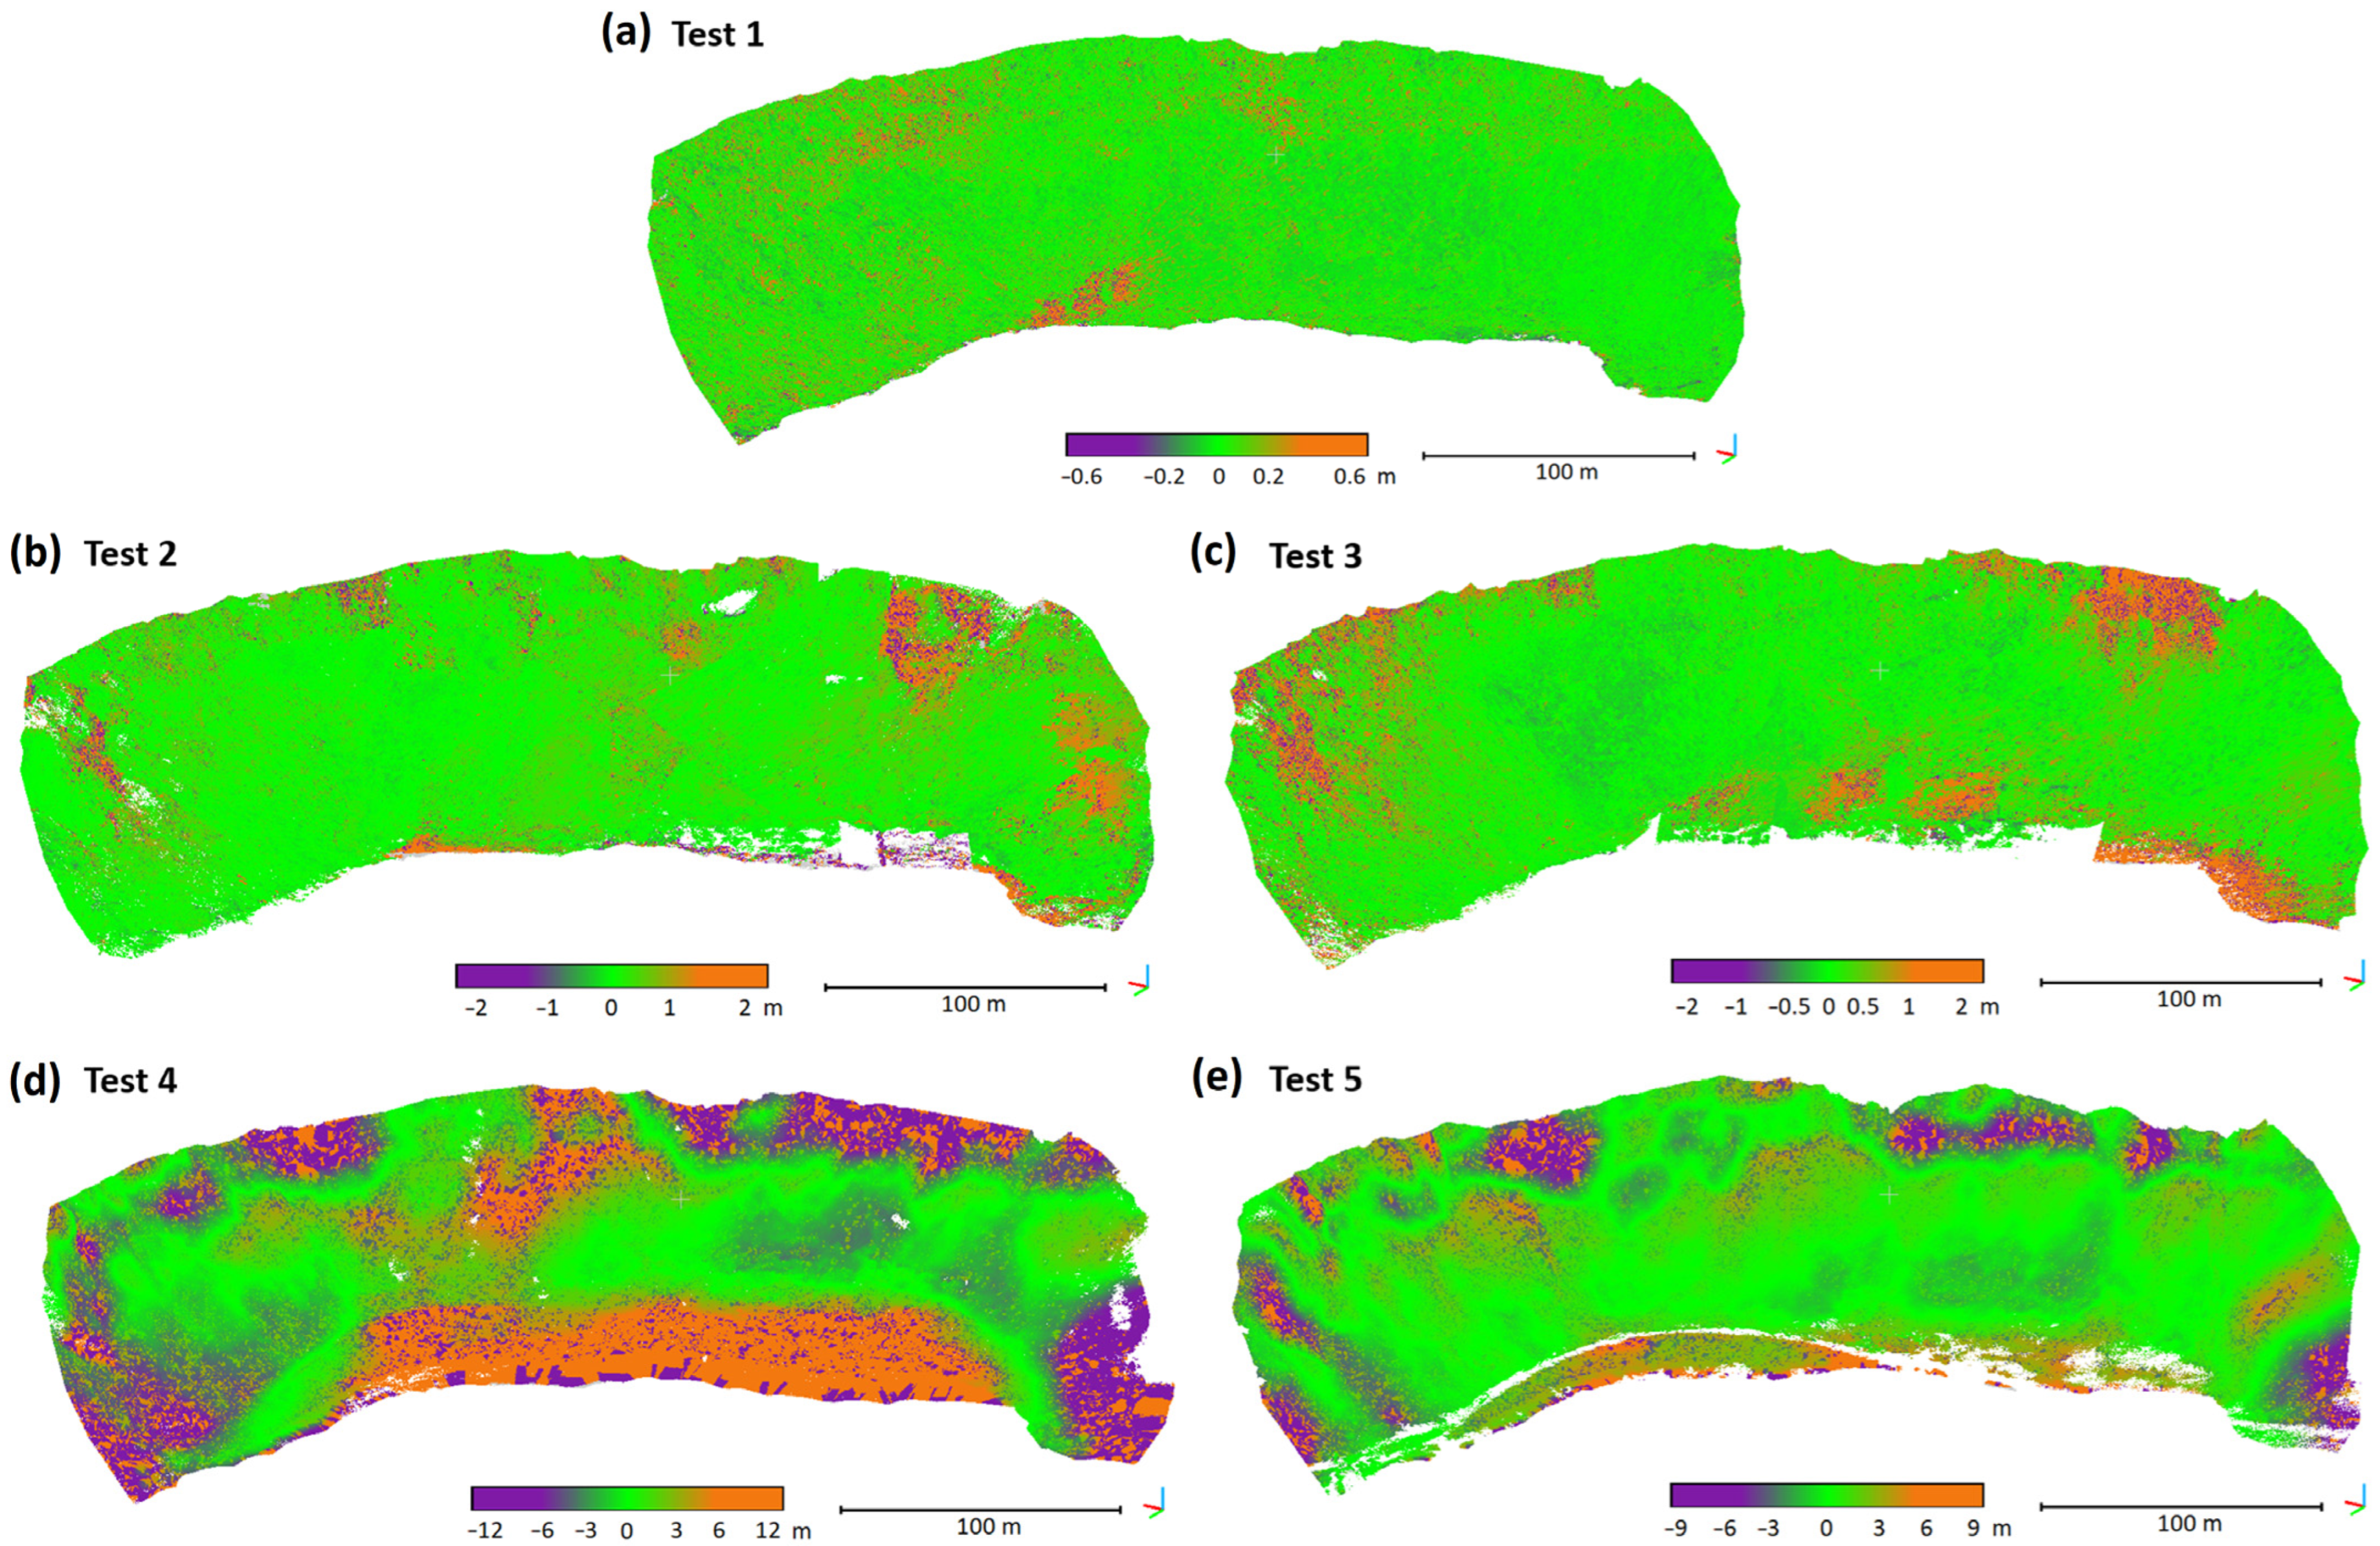
- Test 1: The dataset consists of a subset of the reference dataset, including some georeferenced and all non-georeferenced photos. The number of RTK stations is limited here to 5 (PG1, PG2, PG4, PG5, and PG8 stations on Figure 3b).
- -
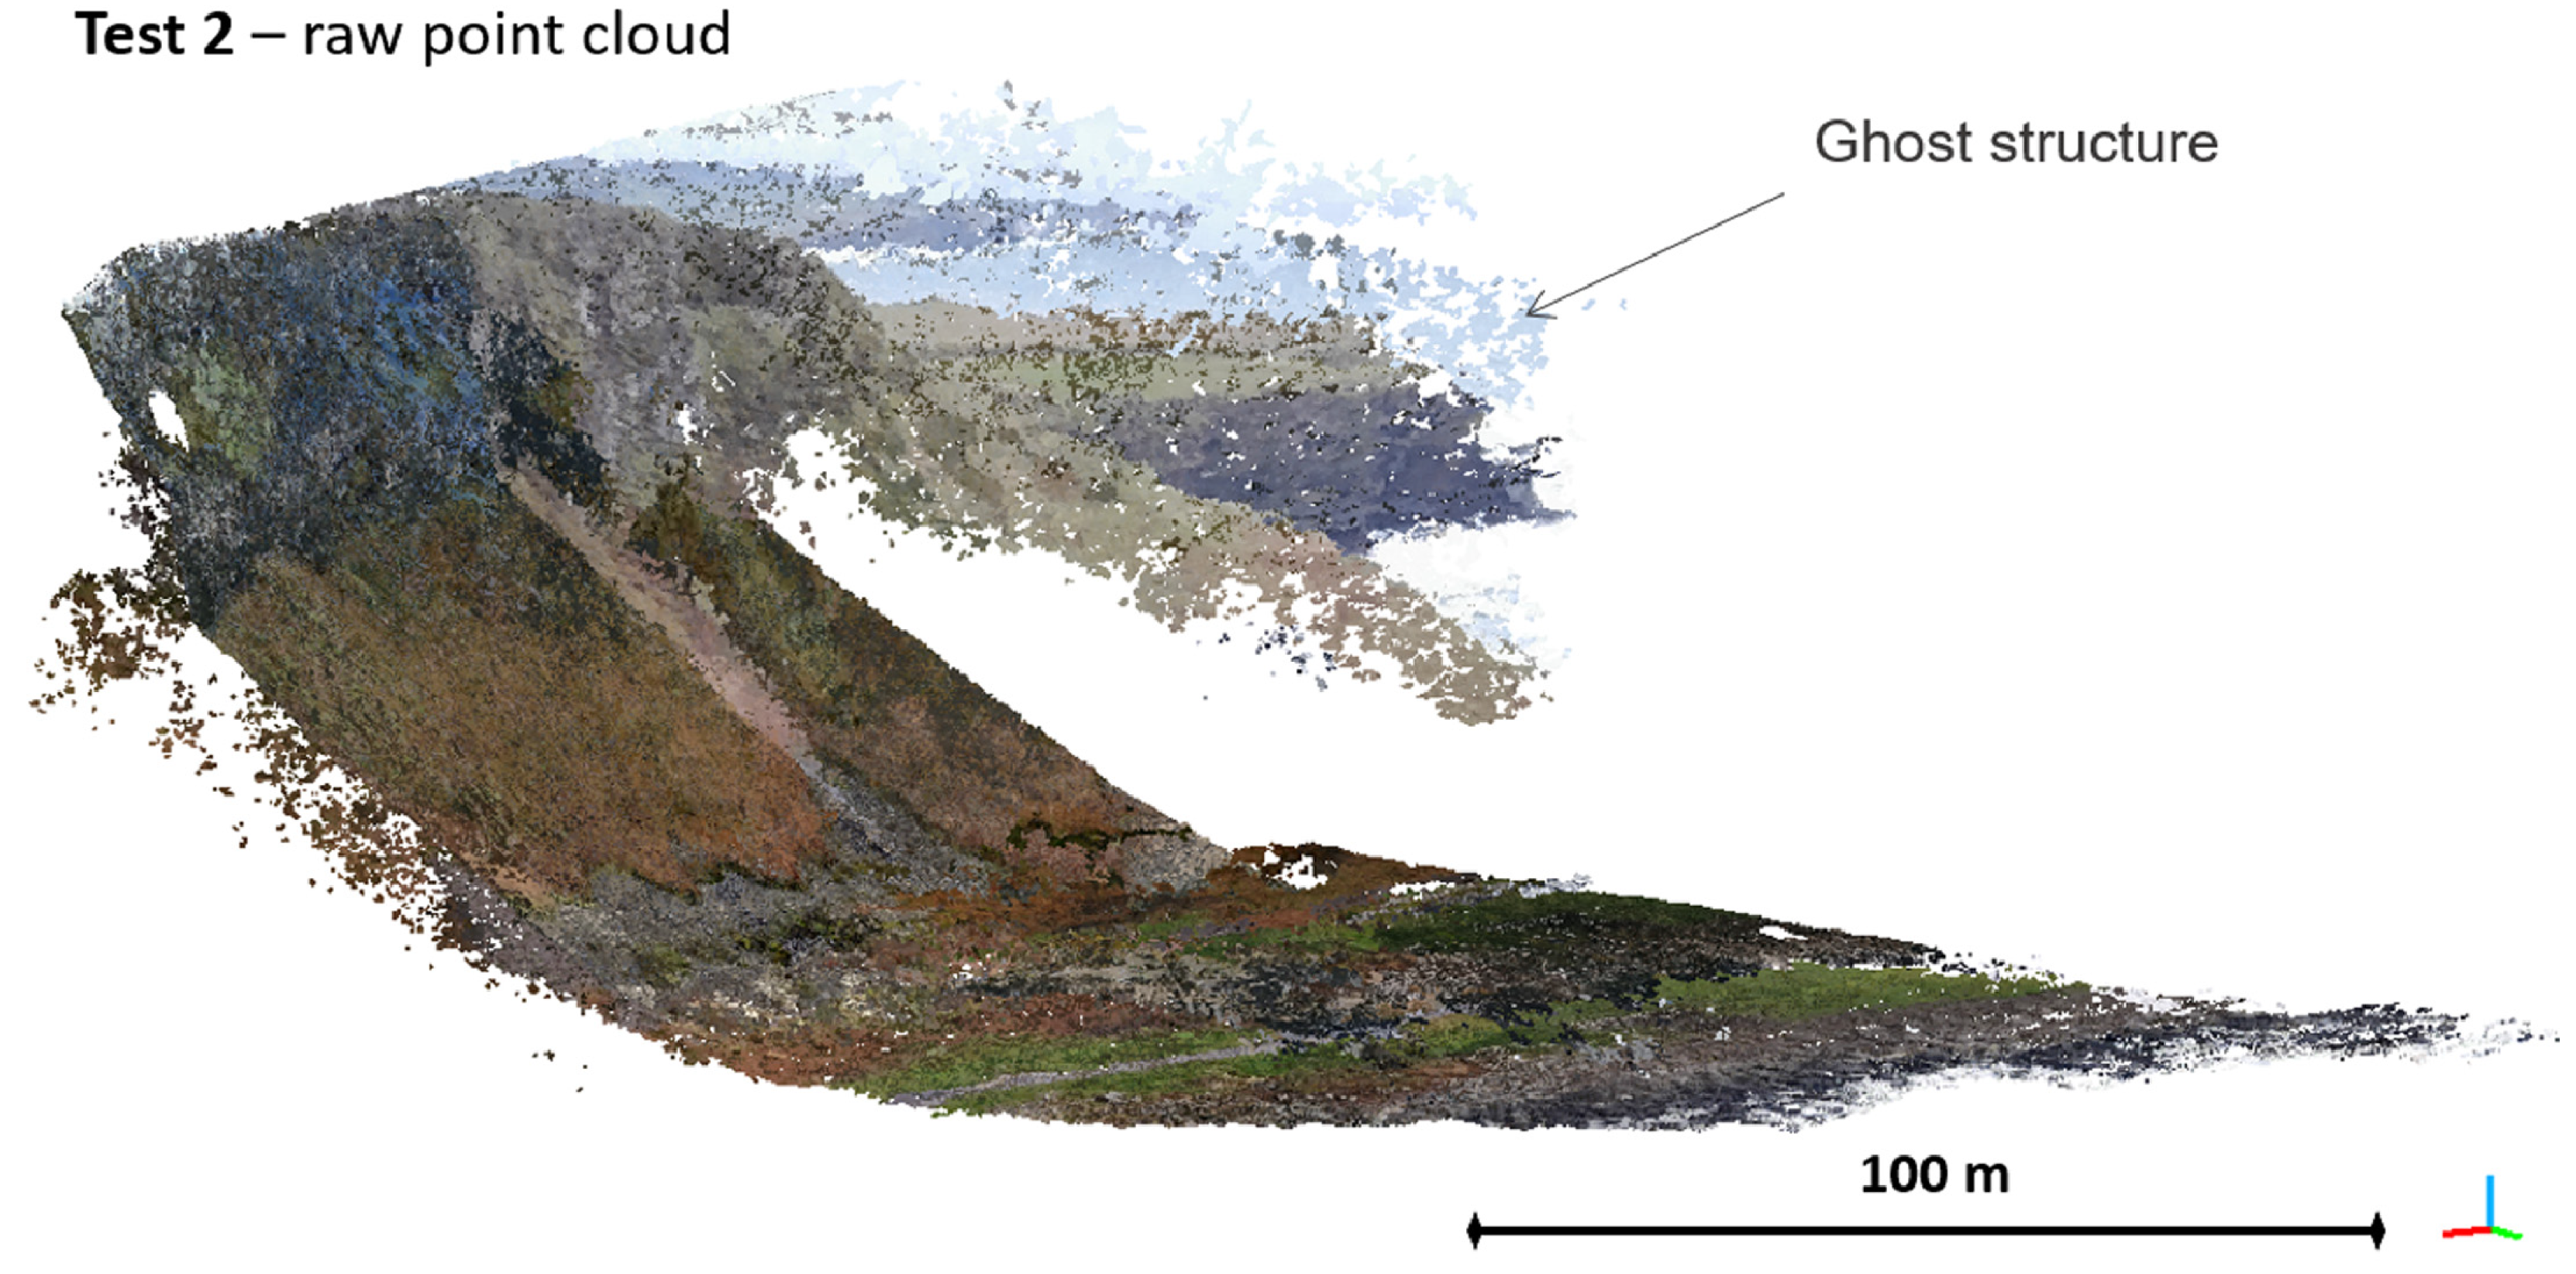
- Test 2: The dataset is composed of the georeferenced Nikon camera photos acquired from the same 5 RTK stations of Test 1 and all the smartphone photos acquired with the 7 different cameras, both from the foot of the cliff and from the top of the cliff.
- -
- Test 3: The dataset is once again composed of the georeferenced Nikon-camera photos acquired from the same 5 RTK stations of Test 1 and all the photos acquired with the 7 smartphone cameras, but applying a filter on the smartphone photos after the “Bundle adjustment” step. With this filter, we deactivated the photos whose alignment error was greater than twice the standard deviation and re-ran the SfM processing chain.
- -
- Test 4: For this scenario, only Smartphone photographs are used. All 684 smartphone photos are used, whether geotagged or not, acquired on different dates (22 November 2021 and 25 November 2021) or acquired from the cliff foot or the cliff top.
- -
- Test 5: The dataset is, again, composed only of smartphone photographs, geotagged or not, acquired at different dates, but only those acquired from the cliff foot (the cliff top being potentially dangerous for citizens).
Data Processing Using the Time-SIFT Method
- -
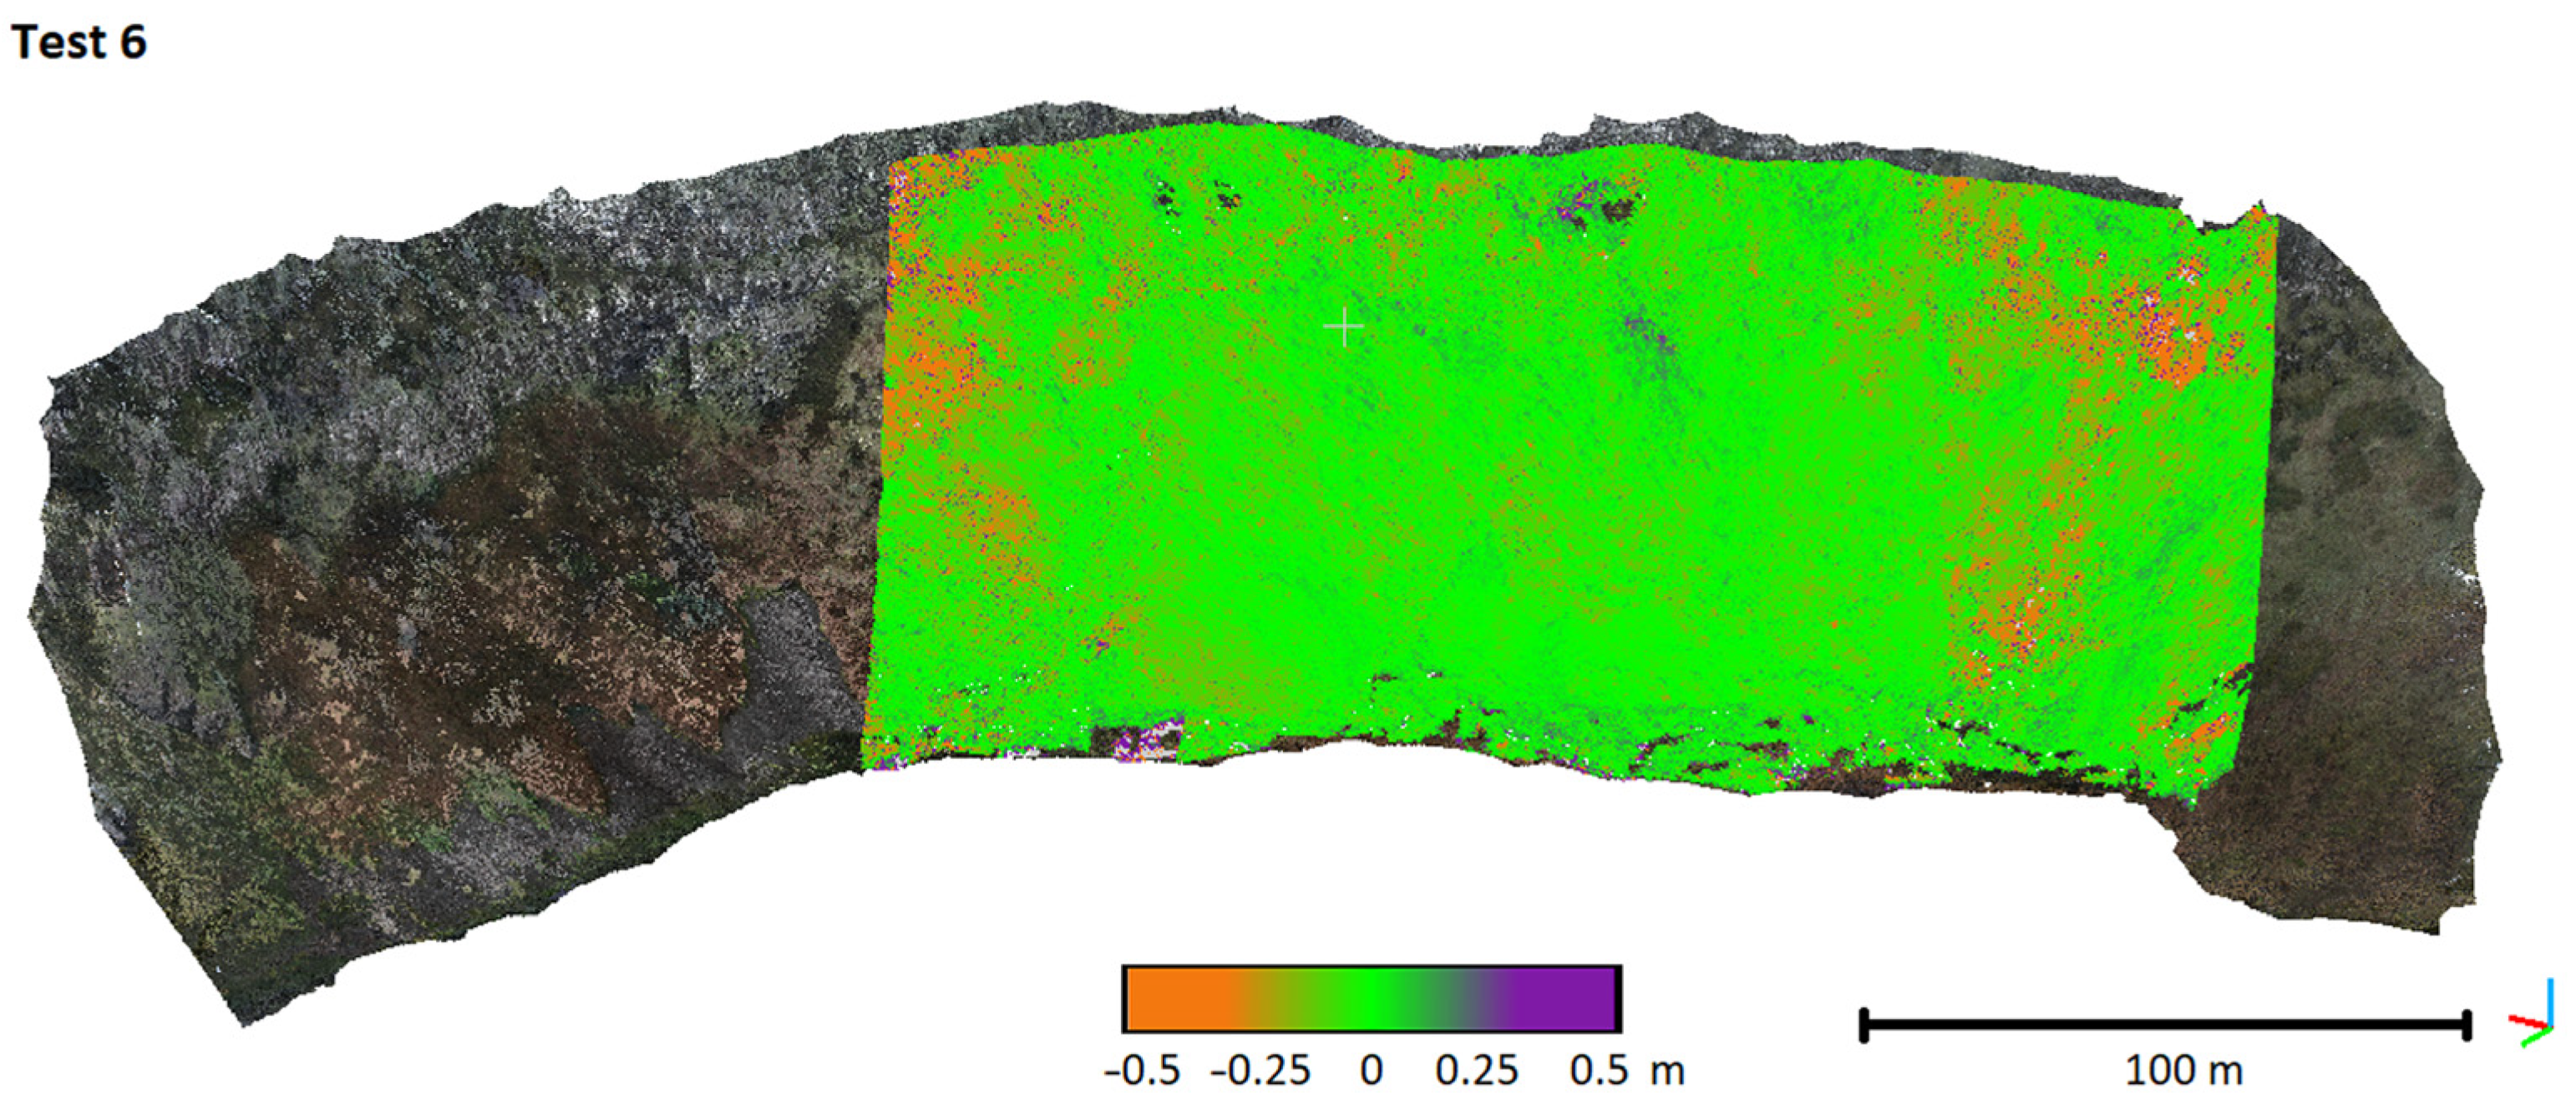
- Test 6: For this test, we are working on a focused area (the screes SW of Port Ganny; see Figure 4b). The aim is to reconstruct this area by using 330 smartphone photos, geotagged or not, collected from the foot of the cliff on 25 November 2021. For processing in Time-SIFT mode (Figure 5b), these smartphone photos are aligned, during the bundle adjustment, with 205 additional photos acquired on 22 November 2021, using the Nikon D800 camera with RTK georeferencing.
3. Results
4. Discussion
4.1. Data Quality in Citizen Science
4.2. Technical Suggestions for Improving the Method
4.3. Interactions with Citizens
4.4. Integration of These Results into an Observatory Strategy
5. Conclusions
Author Contributions
Funding
Data Availability Statement
Acknowledgments
Conflicts of Interest
References
- Simpson, R.; Page, K.R.; De Roure, D. Zooniverse: Observing the world’s largest citizen science platform. In Proceedings of the 23rd International Conference on World Wide Web, ACM, Seoul, Korea, 7–11 April 2014. [Google Scholar] [CrossRef]
- Stewart, C.; Labrèche, G.; González, D.L. A Pilot Study on Remote Sensing and Citizen Science for Archaeological Prospection. Remote Sens. 2020, 12, 2795. [Google Scholar] [CrossRef]
- Langenkämper, D.; Simon-Lledó, E.; Hosking, B.; Jones, D.O.B.; Nattkemper, T.W. On the impact of Citizen Science-derived data quality on deep learning based classification in marine images. PLoS ONE 2019, 14, e0218086. [Google Scholar] [CrossRef] [Green Version]
- Papakonstantinou, A.; Batsaris, M.; Spondylidis, S.; Topouzelis, K. A Citizen Science Unmanned Aerial System Data Acquisition Protocol and Deep Learning Techniques for the Automatic Detection and Mapping of Marine Litter Concentrations in the Coastal Zone. Drones 2021, 5, 6. [Google Scholar] [CrossRef]
- Dickinson, J.L.; Shirk, J.; Bonter, D.; Bonney, R.; Crain, R.L.; Martin, J.; Phillips, T.; Purcell, K. The current state of citizen science as a tool for ecological research and public engagement. Front. Ecol. Evol. 2012, 10, 291–297. [Google Scholar] [CrossRef] [Green Version]
- Joly, A.; Bonnet, P.; Goëau, H.; Barbe, J.; Selmi, S.; Champ, J.; Dufour-Kowalski, S.; Affouard, A.; Carré, J.; Molino, J.-F.; et al. A look inside the Pl@ntNet experience: The good, the bias and the hope. Multimed. Syst. 2016, 22, 751–766. [Google Scholar] [CrossRef] [Green Version]
- Bond, C.E.; Howell, J.; Butler, R. Public engagement in 3D flood modelling through integrating crowd sourced imagery with UAV photogrammetry to create a 3D flood hydrograph. In Proceedings of the AGU Fall Meeting, San Francisco, CA, USA, 12–16 December 2016. [Google Scholar]
- Boger, R.; Low, R.; Nelson, P. Identifying Hurricane Impacts on Barbuda Using Citizen Science Ground Observations, Drone Photography and Satellite Imagery. Int. Arch. Photogramm. Remote Sens. Spatial Inf. Sci. 2020, XLII-3/W11, 23–28. [Google Scholar] [CrossRef] [Green Version]
- Kocaman, S.; Gokceoglu, C. Possible Contributions of citizen science for landslide hazard assessment. Int. Arch. Photogramm. Remote Sens. Spatial Inf. Sci. 2018, XLII-3/W4, 295–300. [Google Scholar] [CrossRef] [Green Version]
- Harley, M.D.; Kinsela, M.A.; Sánchez-García, E.; Vos, K. Shoreline change mapping using crowd-sourced smartphone images. Coast. Eng. 2019, 150, 175–189. [Google Scholar] [CrossRef]
- Jaud, M.; Kervot, M.; Delacourt, C.; Bertin, S. Potential of Smartphone SfM Photogrammetry to Measure Coastal Morphodynamics. Remote Sens. 2019, 11, 2242. [Google Scholar] [CrossRef] [Green Version]
- Vincent, M.L.; Gutierrez, M.F.; Coughenour, C.; Manuel, V.; Bendicho, L.-M.; Remondino, F.; Fritsch, D. Crowd-sourcing the 3D digital reconstructions of lost cultural heritage. In Proceedings of the Digital Heritage IEEE Conference, Granada, Spain, 28 September–2 October 2015. [Google Scholar] [CrossRef]
- Griffiths, S.; Edwards, B.; Wilson, A.; Karl, R.; Labrosse, F.; LaTrobe-Bateman, E.; Miles, H.; Moeller, K.; Roberts, J.; Tiddeman, B. Small Works, Big Stories—Methodological approaches to photogrammetry through crowd-sourcing experiences. Internet Archaeol. 2015, 40. [Google Scholar] [CrossRef]
- James, M.R.; Robson, S. Straightforward reconstruction of 3D surfaces and topography with a camera: Accuracy and geoscience application. J. Geophys. Res. 2012, 117, F03017. [Google Scholar] [CrossRef] [Green Version]
- Tonkin, T.; Midgley, N. Ground-Control Networks for Image Based Surface Reconstruction: An Investigation of Optimum Survey Designs Using UAV Derived Imagery and Structure-from-Motion Photogrammetry. Remote Sens. 2016, 8, 786. [Google Scholar] [CrossRef] [Green Version]
- Jaud, M.; Passot, S.; Allemand, P.; Le Dantec, N.; Grandjean, P.; Delacourt, C. Suggestions to Limit Geometric Distortions in the Reconstruction of Linear Coastal Landforms by SfM Photogrammetry with PhotoScan® and MicMac® for UAV Surveys with Restricted GCPs Pattern. Drones 2019, 3, 2. [Google Scholar] [CrossRef] [Green Version]
- Monkman, G.G.; Hyder, K.; Kaiser, M.J.; Vidal, F.P. Accurate estimation of fish length in single camera photogrammetry with a fiducial marker. ICES J. Mar. Sci. 2020, 77, 2245–2254. [Google Scholar] [CrossRef]
- Jaud, M.; Bertin, S.; Beauverger, M.; Augereau, E.; Delacourt, C. RTK GNSS-Assisted Terrestrial SfM Photogrammetry without GCP: Application to Coastal Morphodynamics Monitoring. Remote Sens. 2020, 12, 1889. [Google Scholar] [CrossRef]
- Hartmann, W.; Havlena, M.; Schindler, K. Towards complete, geo-referenced 3D models from crowd-sourced amateur images. ISPRS Ann. Photogramm. Remote Sens. Spat. Inf. Sci. 2016, III–3, 51–58. [Google Scholar] [CrossRef] [Green Version]
- Wu, J.; Mao, J.; Chen, S.; Zhuoma, G.; Cheng, L.; Zhang, R. Building Facade Reconstruction Using Crowd- Sourced Photos and Two-Dimensional Maps. Photogramm. Eng. Remote Sens. 2020, 86, 677–694. [Google Scholar] [CrossRef]
- Smith, B.J.; Pellitero Ondicol, R.; Alexander, G. Mapping Slope Instability at the Giant’s Causeway and Causeway Coast World Heritage Site: Implications for Site Management. Geoheritage 2011, 3, 253–266. [Google Scholar] [CrossRef]
- Mitchell, W. The Geology of Northern Ireland: Our Natural Foundation, 1st ed.; Geological Survey of Northern Ireland: Belfast, Northern Ireland, 2004.
- Simms, M.J. Subsidence, not erosion: Revisiting the emplacement environment of the Giant’s Causeway, Northern Ireland. Proc. Geol. Assoc. 2021, 132, 537–548. [Google Scholar] [CrossRef]
- NISRA. Northern Ireland Visitor Attraction 2019 Survey Report. 2020. Available online: https://www.nisra.gov.uk/sites/nisra.gov.uk/files/publications/NI-tourism-publication-Visitor-Attraction-Survey-2019-Report.pdf (accessed on 9 March 2022).
- Higgs, B.; Wyse-Jackson, P.N. The role of women in the history of geological studies in Ireland. Geol. Soc. Lond. Spec. Publ. 2007, 281, 137–153. [Google Scholar] [CrossRef]
- Feurer, D.; Vinatier, F. Joining multi-epoch archival aerial images in a single SfM block allows 3-D change detection with almost exclusively image information. ISPRS J. Photogramm. Remote Sens. 2018, 146, 495–506. [Google Scholar] [CrossRef] [Green Version]
- Lowe, D.G. Distinctive image features from scale-invariant keypoints. Int. J. Comput. Vis. 2004, 60, 91–110. [Google Scholar] [CrossRef]
- Lukyanenko, R.; Parsons, J.; Wiersma, Y.F. Emerging problems of data quality in citizen science: Editorial. Biol. Conserv. 2016, 30, 447–449. [Google Scholar] [CrossRef] [Green Version]
- Kosmala, M.; Wiggins, A.; Swanson, A.; Simmons, B. Assessing data quality in citizen science. Front. Ecol. Environ. 2016, 14, 551–560. [Google Scholar] [CrossRef] [Green Version]
- Balázs, B.; Mooney, P.; Nováková, E.; Bastin, L.; Jokar Arsanjani, J. Data Quality in Citizen Science. In The Science of Citizen Science, 1st ed.; Vohland, K., Land-Zandstra, A., Ceccaroni, L., Lemmens, R., Perelló, J., Ponti, M., Samson, R., Wagenknecht, K., Eds.; Springer International Publishing: Cham, Switzerland, 2021; pp. 139–157. [Google Scholar] [CrossRef]
- Ratner, J.J.; Sury, J.J.; James, M.R.; Mather, T.A.; Pyle, D.M. Crowd-sourcing structure-from-motion data for terrain modelling in a real-world disaster scenario: A proof of concept. Prog. Phys. Geogr. Earth Environ. 2019, 43, 236–259. [Google Scholar] [CrossRef] [Green Version]
- Miles, H.C.; Wilson, A.T.; Labrosse, F.; Tiddeman, B.; Griffiths, S.; Edwards, B.; Ritsos, P.D.; Mearman, J.W.; Möller, K.; Karl, R.; et al. Alternative Representations of 3D-Reconstructed Heritage Data. J. Comput. Cult. Herit. 2016, 9, 1–18. [Google Scholar] [CrossRef] [Green Version]
- Kotovirta, V.; Toivanen, T.; Tergujeff, R.; Häme, T.; Molinier, M. Citizen Science for Earth Observation: Applications in environmental moitoring and disaster response. Int. Arch. Photogramm. Remote Sens. Spat. Inf. Sci. 2015, XL-7/W3, 1221–1226. [Google Scholar] [CrossRef] [Green Version]
- Scicchitano, G.; Scardino, G.; Tarascio, S.; Monaco, C.; Barracane, G.; Locuratolo, G.; Milella, M.; Piscitelli, A.; Mazza, G.; Mastronuzzi, G. The First Video Witness of Coastal Boulder Displacements Recorded during the Impact of Medicane “Zorbas” on Southeastern Sicily. Water 2020, 12, 1497. [Google Scholar] [CrossRef]
- Guenzi, D.; Godone, D.; Allasia, P.; Fazio, N.L.; Perrotti, M.; Lollino, P. Brief communication: Monitoring a soft-rock coastal cliff using webcams and strain sensors. Nat. Hazards Earth Syst. Sci. 2022, 22, 207–212. [Google Scholar] [CrossRef]
- Soloy, A.; Turki, I.; Lecoq, N.; Gutiérrez Barceló, Á.D.; Costa, S.; Laignel, B.; Bazin, B.; Soufflet, Y.; Le Louargant, L.; Maquaire, O. A fully automated method for monitoring the intertidal topography using Video Monitoring Systems. Coast. Eng. 2021, 167, 103894. [Google Scholar] [CrossRef]

| Devices | Focal Length (mm) | Image Size |
|---|---|---|
| CrossCall Core-X4 (Croscall, Aix-en-Provence, France) | 4.71 | 4000 × 3000 |
| Wiko Y80 V680 (Wiko SAS, Marseille, France) | 3.6 | 4096 × 2304 |
| Huawei POT-LX1 (Huawei Technologies Co., Ltd., Shenzhen, China) | 3.6 | 4160 × 3120 |
| Samsung SM-A125 (Samsung electronics, Seoul, Korea) | 4.6 | 4000 × 3000 |
| Samsung SM-A127 (Samsung electronics, Seoul, Korea) | 5.0 | 4000 × 3000 |
| iPhone XR (Apple, Cupertino (Californie), USA) | 4.25 | 4032 × 3024 |
| iPhone 5s (Apple, Cupertino (Californie), USA) | 4.0 | 3264 × 2448 |
| Processing Scenario | Sets of Photographs Used |
|---|---|
| Expert reference dataset | Georeferenced Nikon D800 photographs (from 8 georeferenced stations) + non-georeferenced Nikon D800 photographs |
| Test 1 | Georeferenced Nikon D800 photographs (from 5 georeferenced stations) + non-georeferenced Nikon D800 photographs |
| Test 2 | Georeferenced Nikon D800 photographs (from 5 georeferenced stations) + all smartphone photographs |
| Test 3 | Georeferenced Nikon D800 photographs (from 5 georeferenced stations) + smartphone photographs filtered by alignment quality after bundle adjustment |
| Test 4 | All smartphone photographs |
| Test 5 | Smartphone photographs collected from cliff foot |
| Test 6 (Time-SIFT method) | Smartphone photographs at t1 + dataset of reference at t0 for bundle adjustment step (here, georeferenced Nikon D800 photographs from 5 georeferenced stations) |
| Test 1 | Test 2 | Test 3 | Test 4 | Test 5 | Test 6 | |
|---|---|---|---|---|---|---|
| Mean error | −0.5 cm | −0.8 cm | 0.2 cm | 1.7 cm | 1.2 cm | 0.0 cm |
| Std. deviation | 4.6 cm | 32.1 cm | 16.9 cm | 3.92 m | 2.06 m | 8.6 cm |
Publisher’s Note: MDPI stays neutral with regard to jurisdictional claims in published maps and institutional affiliations. |
© 2022 by the authors. Licensee MDPI, Basel, Switzerland. This article is an open access article distributed under the terms and conditions of the Creative Commons Attribution (CC BY) license (https://creativecommons.org/licenses/by/4.0/).
Share and Cite
Jaud, M.; Le Dantec, N.; Parker, K.; Lemon, K.; Lendre, S.; Delacourt, C.; Gomes, R.C. How to Include Crowd-Sourced Photogrammetry in a Geohazard Observatory—Case Study of the Giant’s Causeway Coastal Cliffs. Remote Sens. 2022, 14, 3243. https://doi.org/10.3390/rs14143243
Jaud M, Le Dantec N, Parker K, Lemon K, Lendre S, Delacourt C, Gomes RC. How to Include Crowd-Sourced Photogrammetry in a Geohazard Observatory—Case Study of the Giant’s Causeway Coastal Cliffs. Remote Sensing. 2022; 14(14):3243. https://doi.org/10.3390/rs14143243
Chicago/Turabian StyleJaud, Marion, Nicolas Le Dantec, Kieran Parker, Kirstin Lemon, Sylvain Lendre, Christophe Delacourt, and Rui C. Gomes. 2022. "How to Include Crowd-Sourced Photogrammetry in a Geohazard Observatory—Case Study of the Giant’s Causeway Coastal Cliffs" Remote Sensing 14, no. 14: 3243. https://doi.org/10.3390/rs14143243
APA StyleJaud, M., Le Dantec, N., Parker, K., Lemon, K., Lendre, S., Delacourt, C., & Gomes, R. C. (2022). How to Include Crowd-Sourced Photogrammetry in a Geohazard Observatory—Case Study of the Giant’s Causeway Coastal Cliffs. Remote Sensing, 14(14), 3243. https://doi.org/10.3390/rs14143243