Article

Analyzing the Dynamic Spatiotemporal Changes in Urban Extension across Zhejiang Province Using NPP-VIIRS Nighttime Light Data

Institute of Remote Sensing and Earth Sciences, College of Information science and technology, Hangzhou Normal University, Hangzhou 311121, China
*
Author to whom correspondence should be addressed.
Remote Sens. 2022, 14(13), 3212; https://doi.org/10.3390/rs14133212
Submission received: 9 June 2022 / Revised: 28 June 2022 / Accepted: 30 June 2022 / Published: 4 July 2022
(This article belongs to the Section Urban Remote Sensing)

Abstract

:
Nighttime light remote sensing technologies provide methods for studying spatiotemporal changes in urban areas. In this research, we study the changes in the urban zone in Zhejiang Province based on NPP/VIIRS nighttime light data. Moreover, we propose a methodology to extract urban zones through a buffer threshold analysis method and apply the standard deviation ellipse, urban scale increment, “dual-core” primacy and urban-scale Gini index to uncover the evolution of urban dynamics in Zhejiang Province. The results show that the highest overall urban area extraction accuracy was 95.9%; the highest Kappa coefficient was 91%. The nighttime light intensity changes observed in most cities in Zhejiang Province reflected three periods: “high-speed growth” from 2012–2014, “low-speed growth” from 2014–2018 and “high-speed growth” from 2019–2020. The growth rates observed during the 2019–2020 “high-speed growth” period exceeded those of the 2012–2014 period. Over nine years, the growth rates of the total nighttime light values in all cities ranged from 40% to 319%. Third-tier cities such as Quzhou and Lishui showed significant increases. Second-tier cities, such as Jinhua, Huzhou and Taizhou, had growth rates over 100%. From 2012–2014, the development rates increased in cities in southern Zhejiang Province, such as in Wenzhou and Taizhou, thus promoting a southward shift in the center of gravity. After 2014, the development rates increased in cities in northern Zhejiang Province, such as Hangzhou, Ningbo and Jiaxing, thus promoting a northward shift in the center of gravity, with the center stabilizing in the Keqiao District-Yuecheng District of Shaoxing. According to the changes observed in the “dual-core” primacy and urban-scale Gini index results derived from 2012 to 2020, the development of cities in Zhejiang Province has become more balanced over the past nine years.

1. Introduction

Since the creation of the 18th National Congress of the Chinese Communist Party, the government has expended increased efforts to implement new urbanization strategies and promote high-speed, high-level and high-quality urbanization [1]. This requires the development of urbanization to achieve a high rate and also to maintain an average annual growth rate of 0.6 to 0.8 percentage points [2]. Meanwhile, this type of development is not only about the extent of the urban area of the city, but also about the increase in the intensity of socio-economic activity. After the release of the Outline of the 13th Five-Year Plan for Economic and Social Development of the People’s Republic of China, the implementation of a new urbanization strategy in Zhejiang Province deepened [3]. In 2012, Zhejiang Province ranked second in the nation in terms of urbanization. Its permanent resident population reached 72.17%, ranking third in the nation. In addition, the national average urbanization rate was 60.6% at this time [3].
Although the level of urbanization development in Zhejiang Province is at the national forefront, the urbanization process in this province still suffers from inadequacies, imbalances and low-quality [3] concerns compared to the standards of the provinces pioneering socialist modernization and the construction requirements in commonwealth demonstration areas [3]. In 2020, the urbanization rate in the U.S. reached 82.664%; in Japan it reached 91.782%; and in the U.K. it reached 83.903% [4]. Furthermore, the urbanization rate in Shanghai reached 89.3% in 2021. Compared to these countries and cities, Zhejiang Province still needs to improve its urbanization rate. Moreover, urbanization in Zhejiang Province exhibits an uneven development phenomenon [3]. Urbanization varies significantly among regions and cities in Zhejiang Province. The cities in northeastern Zhejiang Province and in the coastal areas of Wenzhou and Taizhou are economically developed, and their urbanization level is significantly higher than those of the cities in the mountainous areas in western Wenzhou and Taizhou and in the mountainous areas in southwestern Zhejiang, which exhibit lagging economic development. In addition, the quality of urbanization in Zhejiang Province needs to be improved. Urban development is related to balance the speed and quality of development [5,6]. It reflected not only in an increased urbanization rate, but also in the progress of economic factors, the social activity intensity and living standards.
The basic methods, by which town development plans can be scientifically formulated and the town development quality can be improved, involve analyzing the spatiotemporal patterns of urban areas. The development of satellite-based remote sensing technologies can make up for the inadequacies of traditional statistical techniques due to advantages such as timeliness, objectivity, and directness [7]. It should be pointed out that an “urban area” refers not only to anthropogenic construction lands, but also to areas in which human beings congregate and participate in intensive activities [8]. Remote sensing monitoring based on visible light and microwaves can easily obtain the physical attributes of urban areas. However, it is difficult to represent the socioeconomic attributes of human activity intensities in urban areas.
Nighttime light remote sensing data are significantly correlated with the intensity of human activities [9]. These data can be applied to perform socioeconomic parameter estimations [10], regional development research [11], energy consumption research [12], urban land expansion work [13], urban area extraction research [14,15,16], and urban spatial structure characterizations [17,18,19]. Li et al. (2017) used changes in the nighttime light value to assess the spatiotemporal development of cities in the “The Belt and Road Initiative” region and considered that nighttime light data play an important role in the evolution of urban dynamics [20]. Xu et al. (2021) used nighttime light images to explore the expansion rate, urban center of gravity and areal changes of 338 cities in China from 1993 to 2012 [21]. Zheng et al. (2021) used National Polar-orbiting Partnership/Visible Infrared Imaging Radiometer Suite (NPP/VIIRS) data to evaluate changes in the spatial structure and changes of urbanization in the Mid-Yangtze River City Group [22]. To date, two nighttime light products have been commonly used: the Defense Meteorological Satellite Program/Operational Linescan System (DMSP/OLS) and NPP/VIIRS products. The DMSP/OLS product has a spatial resolution of 1000 m, while the NPP/VIIRS product has a spatial resolution of 500 m. Shi et al. (2014) evaluated the potential of using NPP/VIIRS nighttime light synthesis data to extract urban areas. By comparing NPP/VIIRS data representing 12 cities with DMSP/OLS data, the authors confirmed that the results extracted from the NPP/VIIRS produced were more accurate than those obtained from the DMSP/OLS product [23]. Ma et al. (2014) used NPP/VIIRS data to quantitatively analyze socioeconomic activities in cities and airports, concluding that NPP/VIIRS data could improve the spatial accuracy of the study results and be used to evaluate the dynamic relationships between nighttime light and socioeconomic factors [24]. Therefore, as a new generation of nighttime light data, the NPP/VIIRS product can compensate for the relatively low spatial resolution of the DMSP/OLS product and is suitable for performing research on urban areas.
Based on the foregoing information in this research, we used the NPP/VIIRS annual lighting dataset collected from 2012 to 2020 to monitor the spatiotemporal changes in the urban areas in Zhejiang Province, including an increase in nighttime light values and an expansion of the distribution, to reveal the evolution characteristics of the urban scale and structure in this province. Moreover, we used the nighttime light scale index to characterize the urban development and selected the “dual-core” primacy, urban-scale Gini index, and standard deviation ellipse to assess the development and quality of cities in Zhejiang Province. The purposes of this work were to provide a basis for urban planning, management and development in Zhejiang Province and to make reasonable suggestions for comprehensively improving Zhejiang Province to form a high-quality national model of new urbanization.

2. Study Area and Data
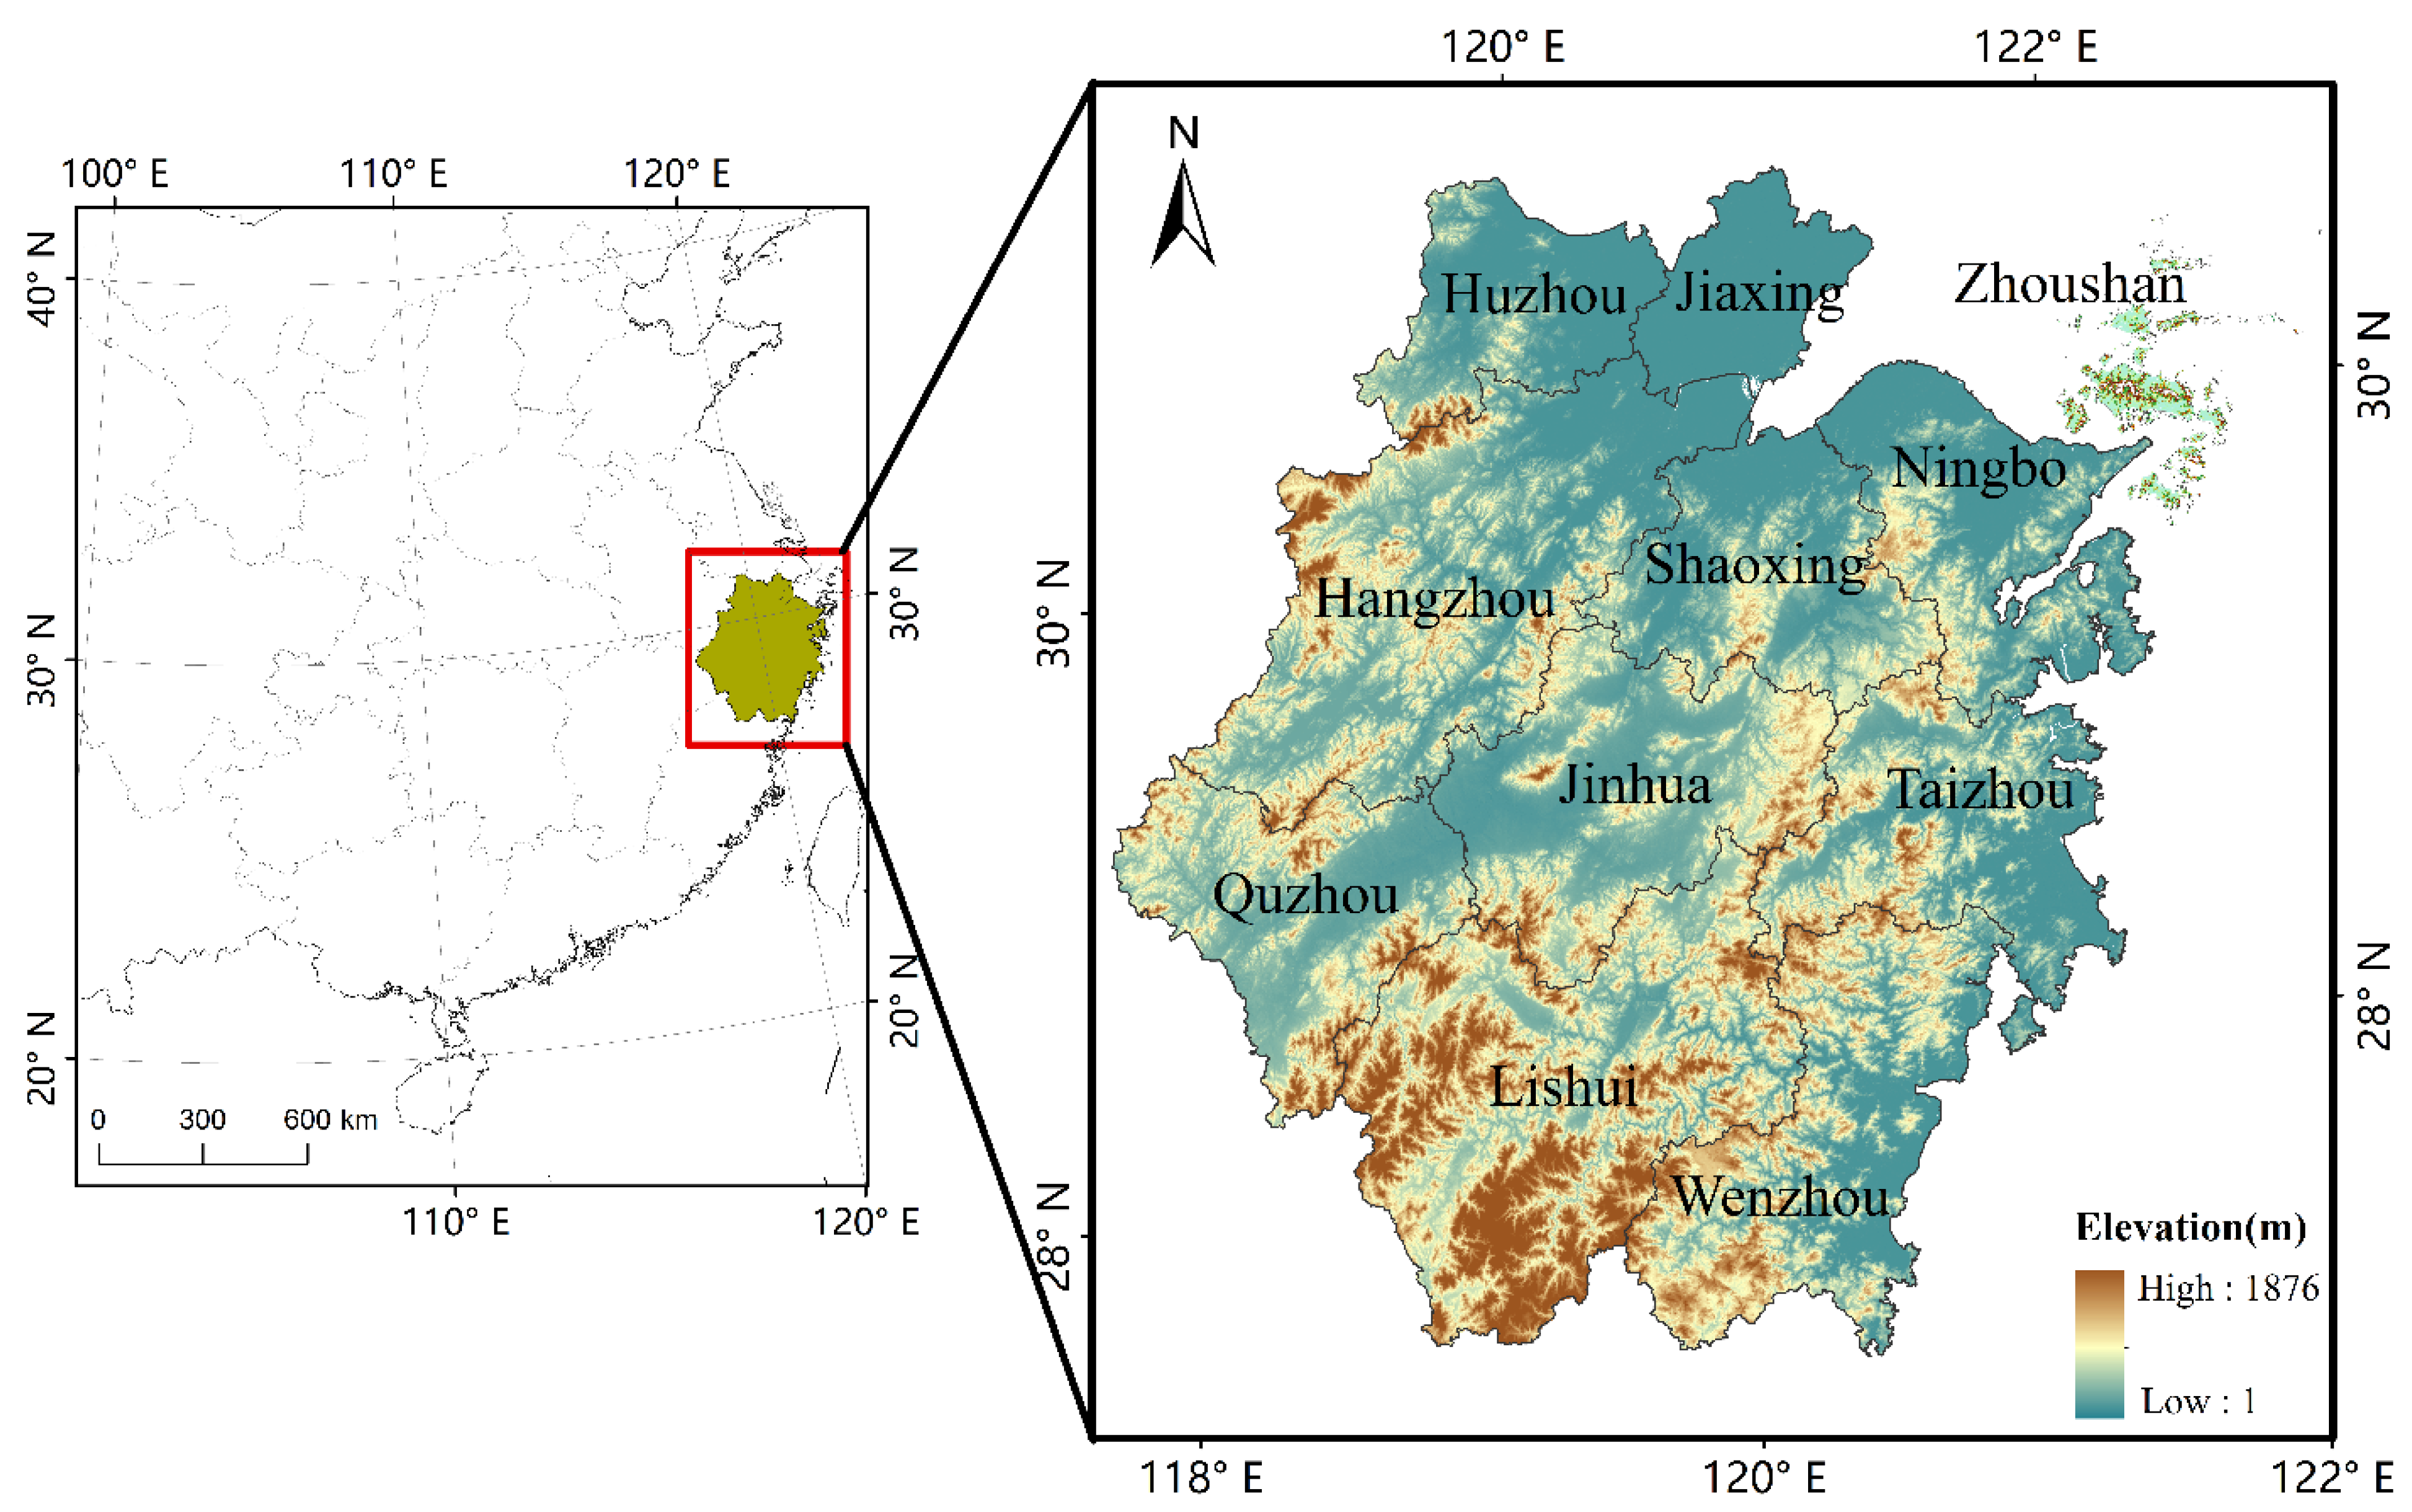
2.1. Study Area

Zhejiang Province is located on the southeastern coast of China, between 118°01′ and 123°10′ east longitude lines and between 27°02′ and 31°11′ north latitude lines; the province has an area of approximately 105,500 square kilometers, occupying 1.1% of the total area of China (Figure 1). Zhejiang Province contains 11 cities, including Hangzhou, Ningbo, Wenzhou, Shaoxing, Huzhou, Jiaxing, Jinhua, Quzhou, Zhoushan, Taizhou and Lishui, and can be divided into 90 county-level administrative regions, including 36 municipal districts, 20 county-level cities and 34 counties (including one autonomous county). In 2020, the urbanization rate reached 72% in Zhejiang Province, making this province one of the most rapidly urbanizing and economically active provinces in China.

2.2. Data Source

The nighttime light data used in this study were obtained from a global annual light dataset collected from 2012 to 2020 based on NPP/VIIRS nighttime light data. The auxiliary data included the lobal urban boundaries derived from GAIA data, Google Earth image data and Zhejiang administrative division data.
(1)
Nighttime light data
The NPP/VIIRS data were provided by the National Oceanic and Atmospheric Administration (NOAA) and included cloud mask processing data (the VIIRS Cloud Mask Configuration (VCMCFG) product) and stray-light-corrected cloud mask data (the VIIRS Cloud Mask Stray-Light-Corrected Configuration (VCMSLCFG) product). The Earth Observations Group (EOG) produces a suite of average radiation composite images using nighttime data in the day/night band from derived from VIIRS (https://eogdata.mines.edu/products/vnl/ (accessed on 7 November 2021)); these images are divided into monthly and annual portfolio products. In 2021, EOG produced the second version of the 2012–2020 global annual light dataset (Annual VIIRS Nighttime Lights (VNL) V2) based on the monthly VIIRS data. In these data, stray light, lightning, lunar illumination and cloud coverage were eliminated, and irrelevant features such as biomass combustion, auroras and background noises were filtered out [25]. The spatial resolution of these data is approximately 500 m, and the radiation resolution is 10 bits [26].
(2)
Global urban boundaries derived from GAIA data
The global urban boundary dynamic data product (http://data.ess.tsinghua.edu.cn/ (accessed on 13 November 2021)) produced by Prof. Peng Gong’s research group in the Department of Earth System Science at Tsinghua University is based on long-time-series Landsat optical images and ancillary data (i.e., nighttime light data and Sentinel−1 radar data).
(3)
Google Earth data
Google Earth image data of Zhejiang Province were used herein as the ground truth data. It was used to determine the correctness of the checkpoints in the accuracy assessment of the urban extraction results.
(4)
Administrative division data
The administrative division data used in this study were obtained from the National Geographic Information Center (https://www.webmap.cn/main.do?method=index (accessed on 6 October 2021)), including data at both the provincial and municipal scales.

2.3. Data Preprocessing

The NPP/VIIRS data representing the Zhejiang Province area were clipped using a vector map of China with the World Geodetic System (WGS)−84 geographic coordinate system and transformed into the Asia_Lambert_Conformal_Conic plane-projection coordinate system with the spatial resolution set to 500 m.
To standardize the magnitudes of the nighttime light image data collected in different years to allow comparisons among the data representing different years, in this research, we refer to the pseudoiinvariance feature method in relative radiation normalization to unify the nighttime light image data [27]. Taking the 2020 nighttime light image as the reference image, 150 feature points with less trivial nighttime light fluctuations in the reference image and the image to be normalized were selected, and the nighttime light values corresponding to the no-change points were extracted. Linear regression was performed on these nighttime light values in two years to obtain a line regression equation, and linear regression was then used for the normalization task. The scatter diagram is shown in Figure 2. Based on the results of the regression analysis, linear regression equations representing each year of study were constructed separately. Figure 3 shows the normalized NPP/VIIRS nighttime light images of Zhejiang Province from 2012 to 2020.

3. Methodology

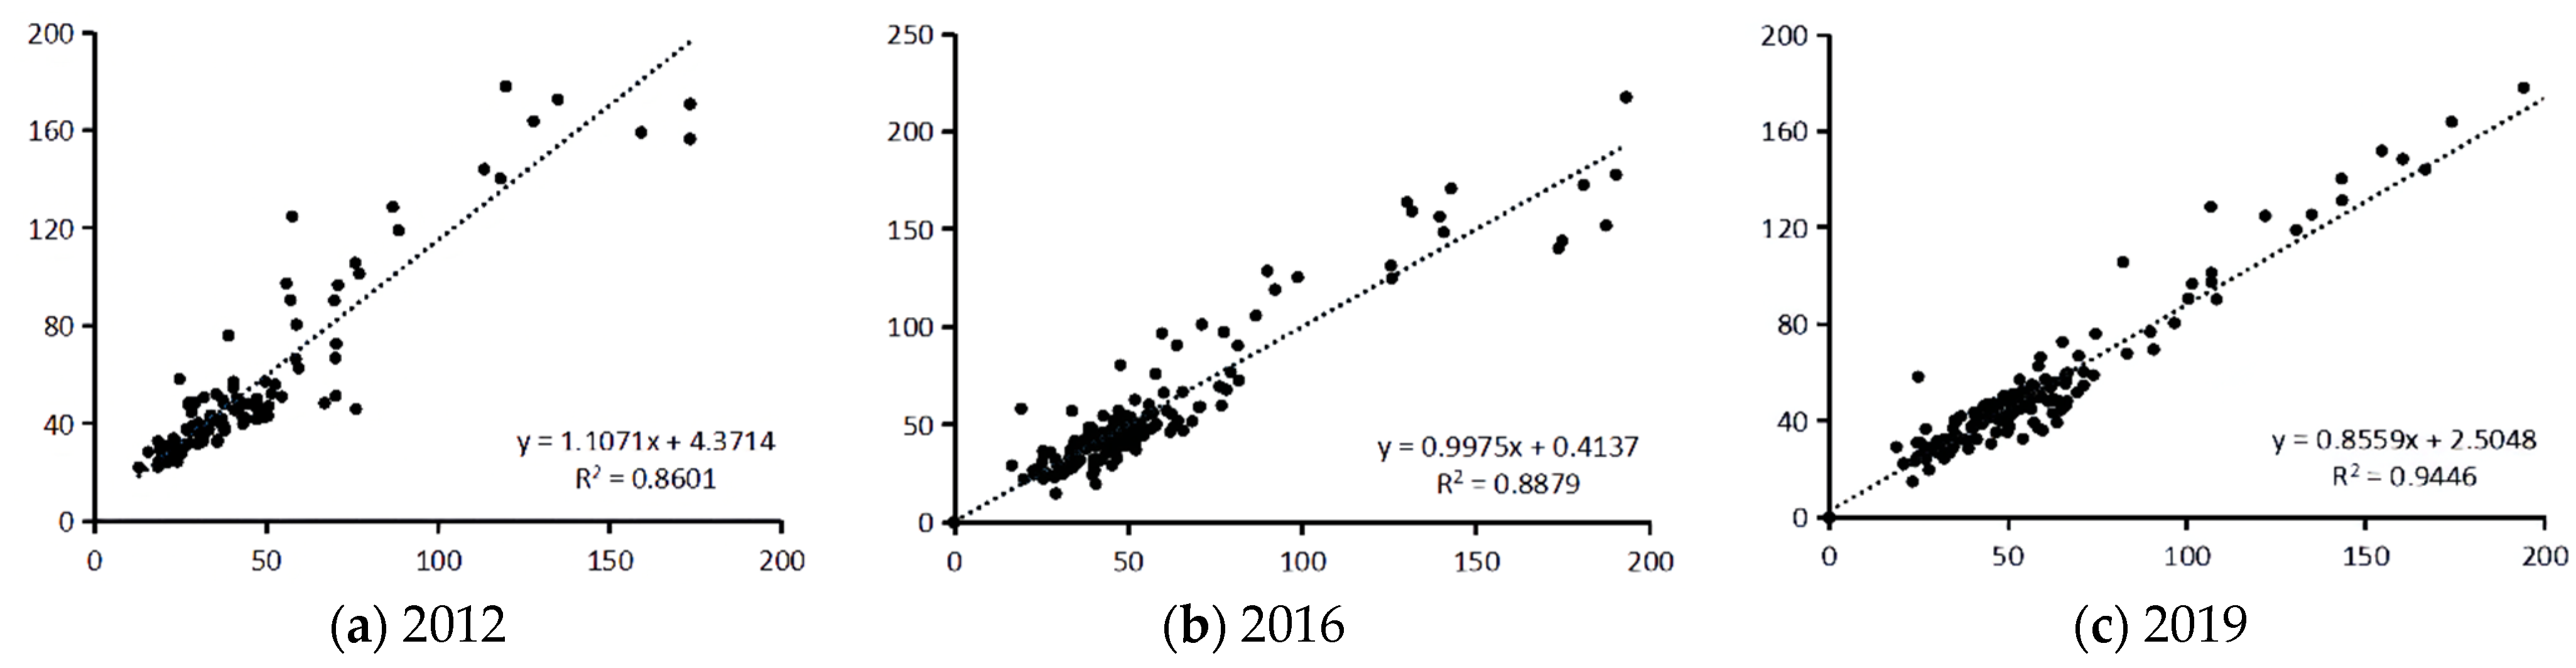
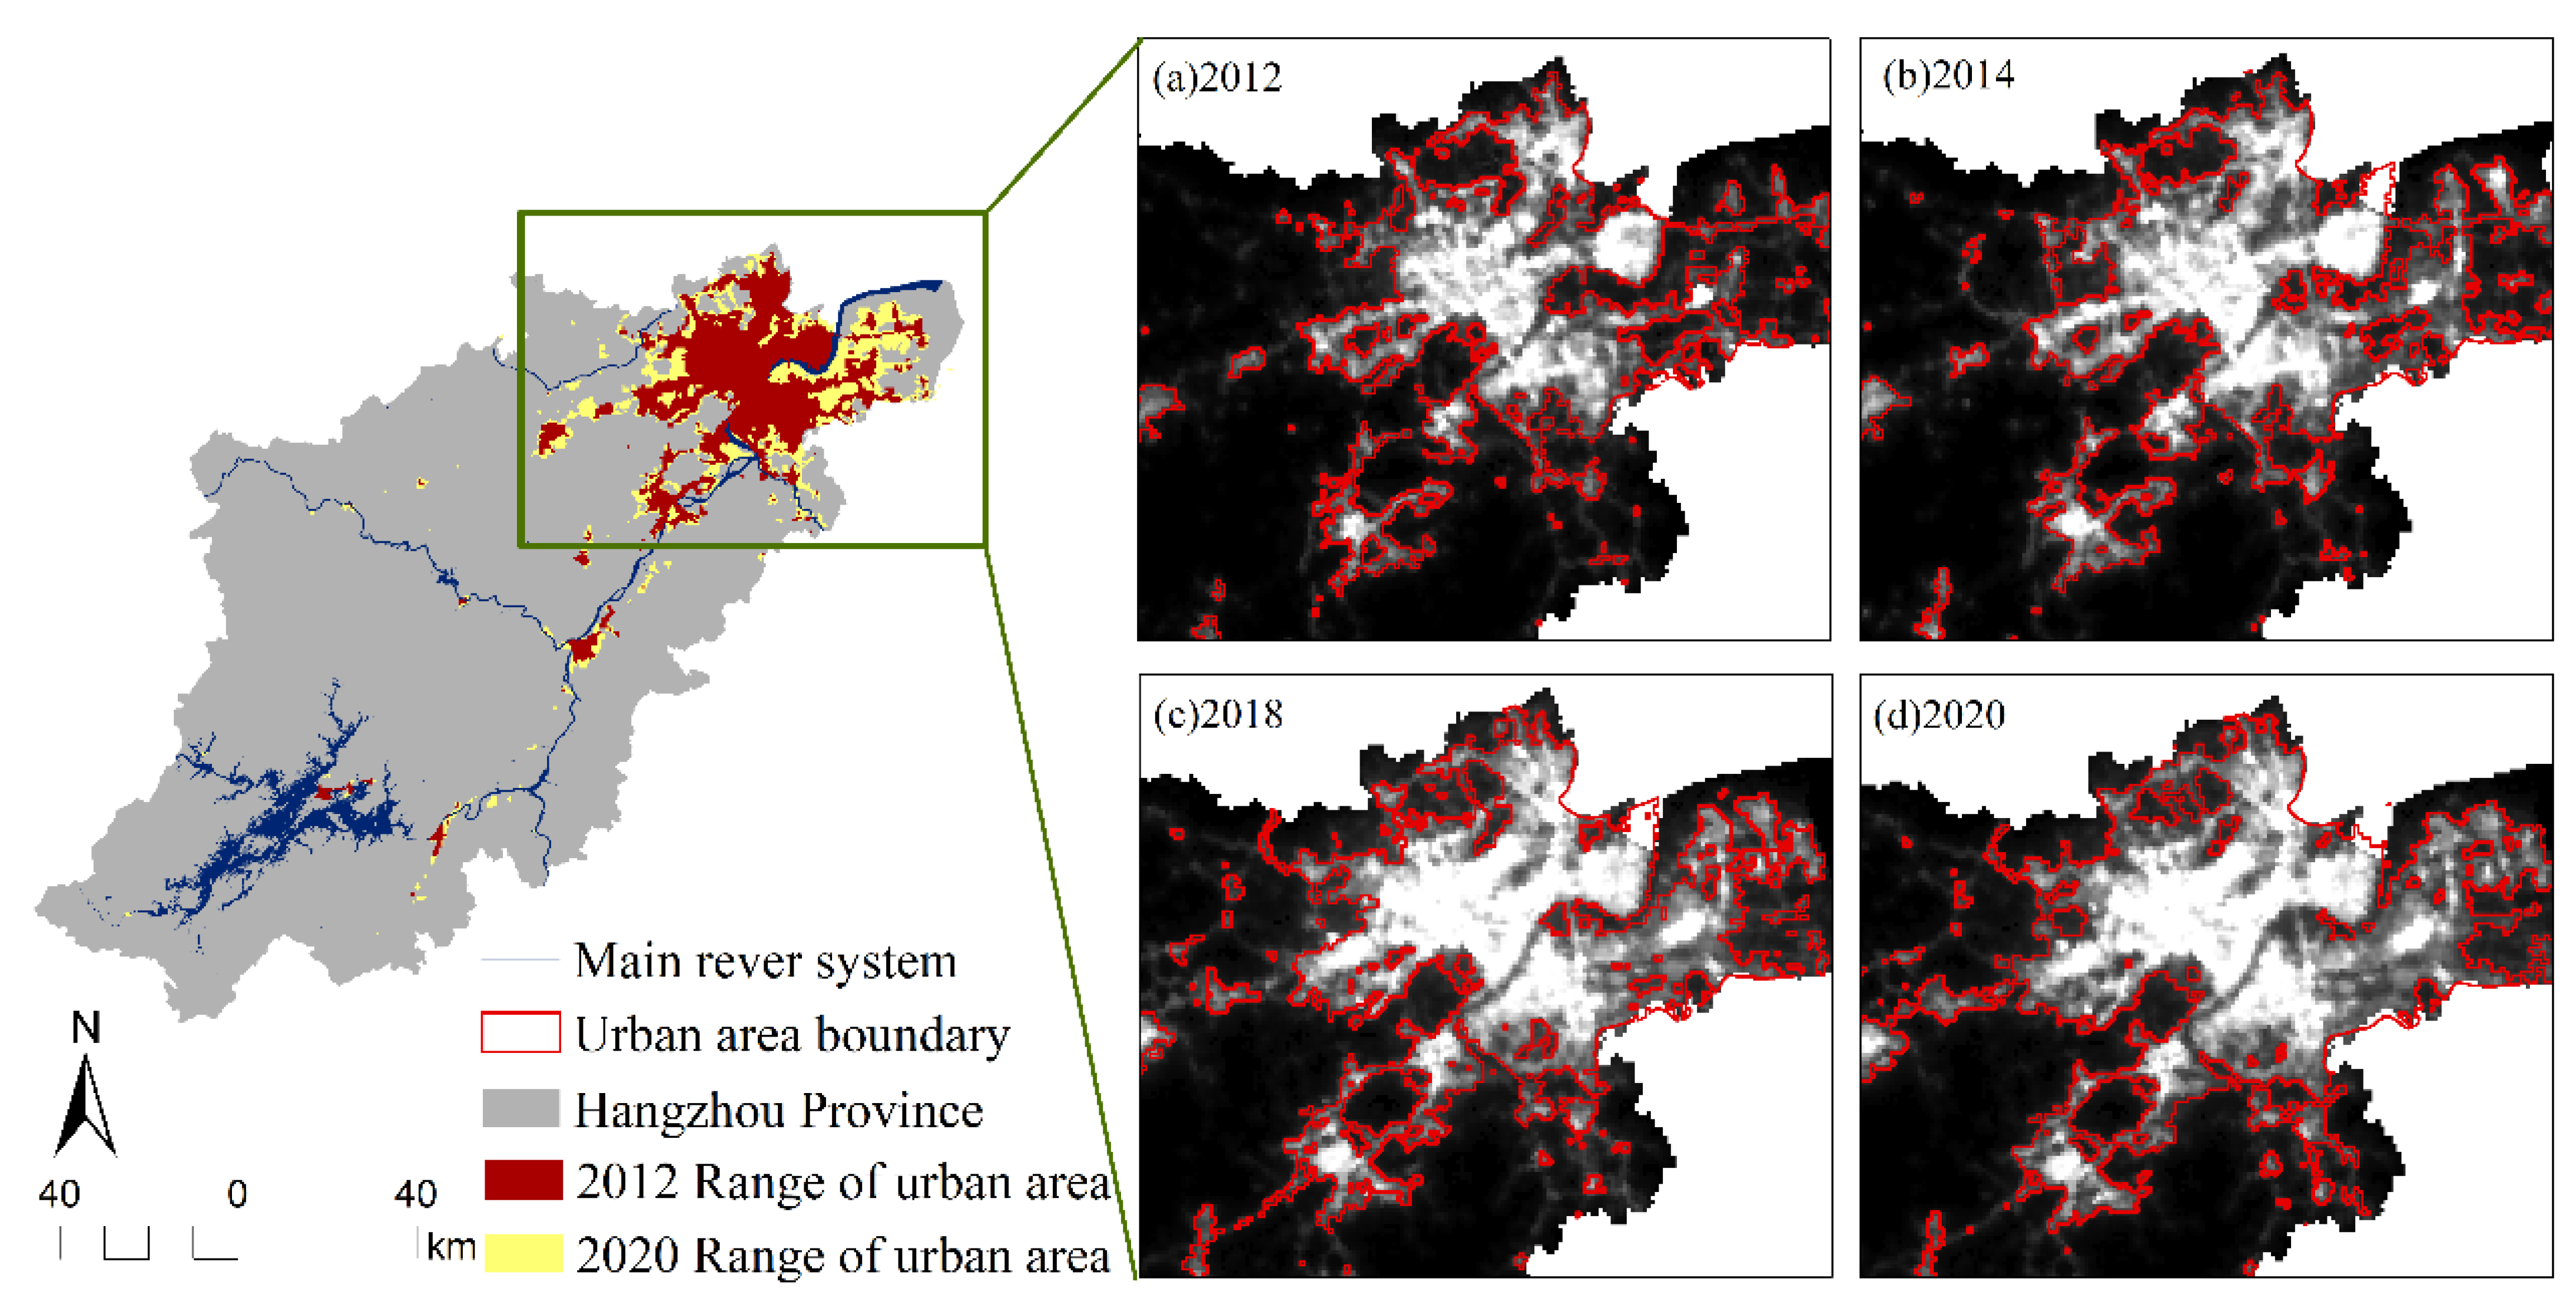
3.1. Urban Area Extraction Based on Buffer Threshold Analysis

In this research, we used a GIS method of spatial analysis. We used the global urban boundaries derived from GAIA data to select the urban areas in Zhejiang Province using the thresholds obtained from the nighttime light images. A buffer zone of five pixels areas was generated both inside and outside each urban boundary line (Figure 4). The buffer zone located outside each boundary was considered the nonurban zone, while the buffer zone located inside the boundary was considered the urban zone. Two hundred checkpoints were generated in a hierarchical random manner in each buffer zone, including 100 checkpoints in the urban zone and 100 checkpoints in the nonurban zone. Different thresholds were set through an iterative process, and Google Earth images were used to determine the accuracy of the checkpoints. Herein, we utilized the Kappa coefficient and the overall accuracy index to evaluate the accuracy of the urban area extraction results. Kappa coefficient is a discrete multivariate accuracy assessment method, which measures the chance agreement in classification [28]. The threshold corresponding to the highest accuracy was used to extract of urban areas in the nighttime light images of Zhejiang Province. The DN value threshold for nighttime light was set to 53. Table 1 shows the accuracy test results obtained for each year; we found that the overall accuracy in all years was higher than 90% and that the corresponding Kappa coefficients were higher than 80%.

3.2. Urban Scale and Morphology Indicators

In this study, we used the total nighttime light value, the area of the standard deviation ellipse, and the change in the center of gravity to reflect the dynamic urban scale and morphology changes in Zhejiang Province.
(1)
Total nighttime light value
The nighttime light intensity can reflect the intensity of human socioeconomic activities; the total nighttime light value is the cumulative sum of the nighttime light intensity and can be used to describe an overall change in urban scale, i.e., the area of the urban region [20]. The utilized calculation formula can be expressed as follows:
N L t o t a l = i = 1 n N L i
where N L t o t a l is the total nighttime light value in Zhejiang Province and N L i is the DN value of the i th image element.
(2)
Standard deviation ellipse
The standard deviation ellipse can be used to quantitatively interpret spatial morphological characteristics such as the directionality, spreading, and centrality of the distribution of geographical elements from a global space [21]. Referring to the study of Deren Li et al. [20], two indicators, the change in the areal size of the standard deviation ellipse and the migration distance of the center of gravity, were introduced herein to analyze the spatial extension direction and concentration degree of the luminous urban agglomeration scale in Zhejiang Province. The migration of the center of gravity of the development of the urban-cluster nighttime light scale and the area and the long and short axes of the ellipse can be used to interpret information such as whether urban nighttime light is expanding or contracting spatially and to determine the size and direction of the expansion or contraction amount. The corresponding calculation formula is expressed as follows:
G X = i = 1 n w i x i i = 1 n w i       G Y = i = 1 n w i y i i = 1 n w i
tan α = ( i = 1 n w i 2 x i 2 i = 1 n w i 2 y i 2 ) + ( i = 1 n w i 2 x i 2 i = 1 n w i 2 y i 2 ) 2 + 4 i = 1 n w i 2 x i 2 y i 2 2 i = 1 n w i 2 x i 2 y i 2
α x = i = 1 n ( w i x i ¯ cos α - w i x i ¯ sin α ) 2 i = 1 n w i 2
α y = i = 1 n ( w i x i ¯ s i n α - w i x i ¯ c o s α ) 2 i = 1 n w i 2
where ( G X , G Y ) is the center of gravity of the ellipse, w i is the weight (the gray value of the image element), x i is the latitude of image element I, y i is the standard deviation of the long axis of the ellipse, α x is the standard deviation of the long axis of the ellipse, α y is the standard deviation of the short axis of the ellipse, and α is the azimuthal angle.

3.3. Indicators of Urban Structure Characteristics

The characteristic urban structure index was used herein to characterize the balance of urban development within the studied region. Commonly used urban structure characteristic indicators include the three-city index, four-city index, centrality, sprawl, primacy, and urban-scale Gini index. In this study, we used the primacy and urban-scale Gini index indicators to derive the characteristics of cities in Zhejiang Province.
(1)
Dual-core primacy
The Law of the Primate City was first proposed by Jefferson in 1939 and later optimized by scholars as an index to make comparisons between two cities. In this law, the ratio of the population between the first-ranked city and the second-ranked city in a given province is obtained, as this ratio can reasonably represent the concentration of urban development factors in the largest city in the urban system to a certain extent [29]. Since the development of the first city is the top priority of overall urban progression, the concept of the first degree is often used in research and analyses regarding internal provincial structures [30]. As Hangzhou and Ningbo are the two key sub-provincial cities in Zhejiang Province, these cities have similar development levels and highly correlated development trends; thus, the result of the size ratio between the first-ranked city, Hangzhou, and the second-ranked city, Ningbo, cannot reflect the urban development concentration in Zhejiang Province. To conform to this unique “double-core-driven” development model of Zhejiang Province, in this study, we proposed the “dual-core” primacy index. After performing a gradient division of the nighttime light scales of cities in the first tier, the average value of the nighttime light scale of cities in the second tier was calculated. The formula used to calculate the “dual-core” primacy index can be expressed as follows:
P r = i = 1 n 1 U i n 1 / t = 1 n 2 U t n 2
where P r is the “dual-core” primacy, U i is the total nighttime light value of the first-tier cities, U t is the total nighttime light value of the second-tier cities, n 1 is the number of the first-tier cities, n 2 is the number of the second-tier cities.
(2)
Urban-scale Gini index
The urban-scale Gini index was originally used as an indicator to characterize the income gaps among residents [31]. The concept of the urban-scale Gini index was first proposed for research on the development of cities of different scales by Professor J. U. Marshall of the Department of the Geography of York University, Canada [32]. In this study, the total nighttime light value data were selected to represent the urban structure characteristics in place of urban population parameters. The formula used to calculate the urban-scale Gini index can be expressed as follows:
G = D 2 T ( N 1 )
where G is the urban-scale Gini index, D is the sum of the absolute value of the difference between the total nighttime light value in the analyzed cities, N is the number of cities in the province, and T is the total nighttime light value in the region. According to the original definition of the urban-scale Gini index, the distribution range of the value is 0~1. If G tends toward one, the urban development trend concentrated on the core cities, reflecting obvious urban scale differences; if G tends toward zero, the urban development scale is scattered, that is, the scale of each city is close to the average; if G is below 0.2, the urban scales are largely average; if G falls between 0.2 and 0.3, the urban scales are relatively average; if G falls between 0.3 and 0.4, the scale structure is reasonable; and if G is greater than 0.4, a large scale difference exists.

4. Results and Discussion

4.1. Changes Detection in the Total Nighttime Light Value

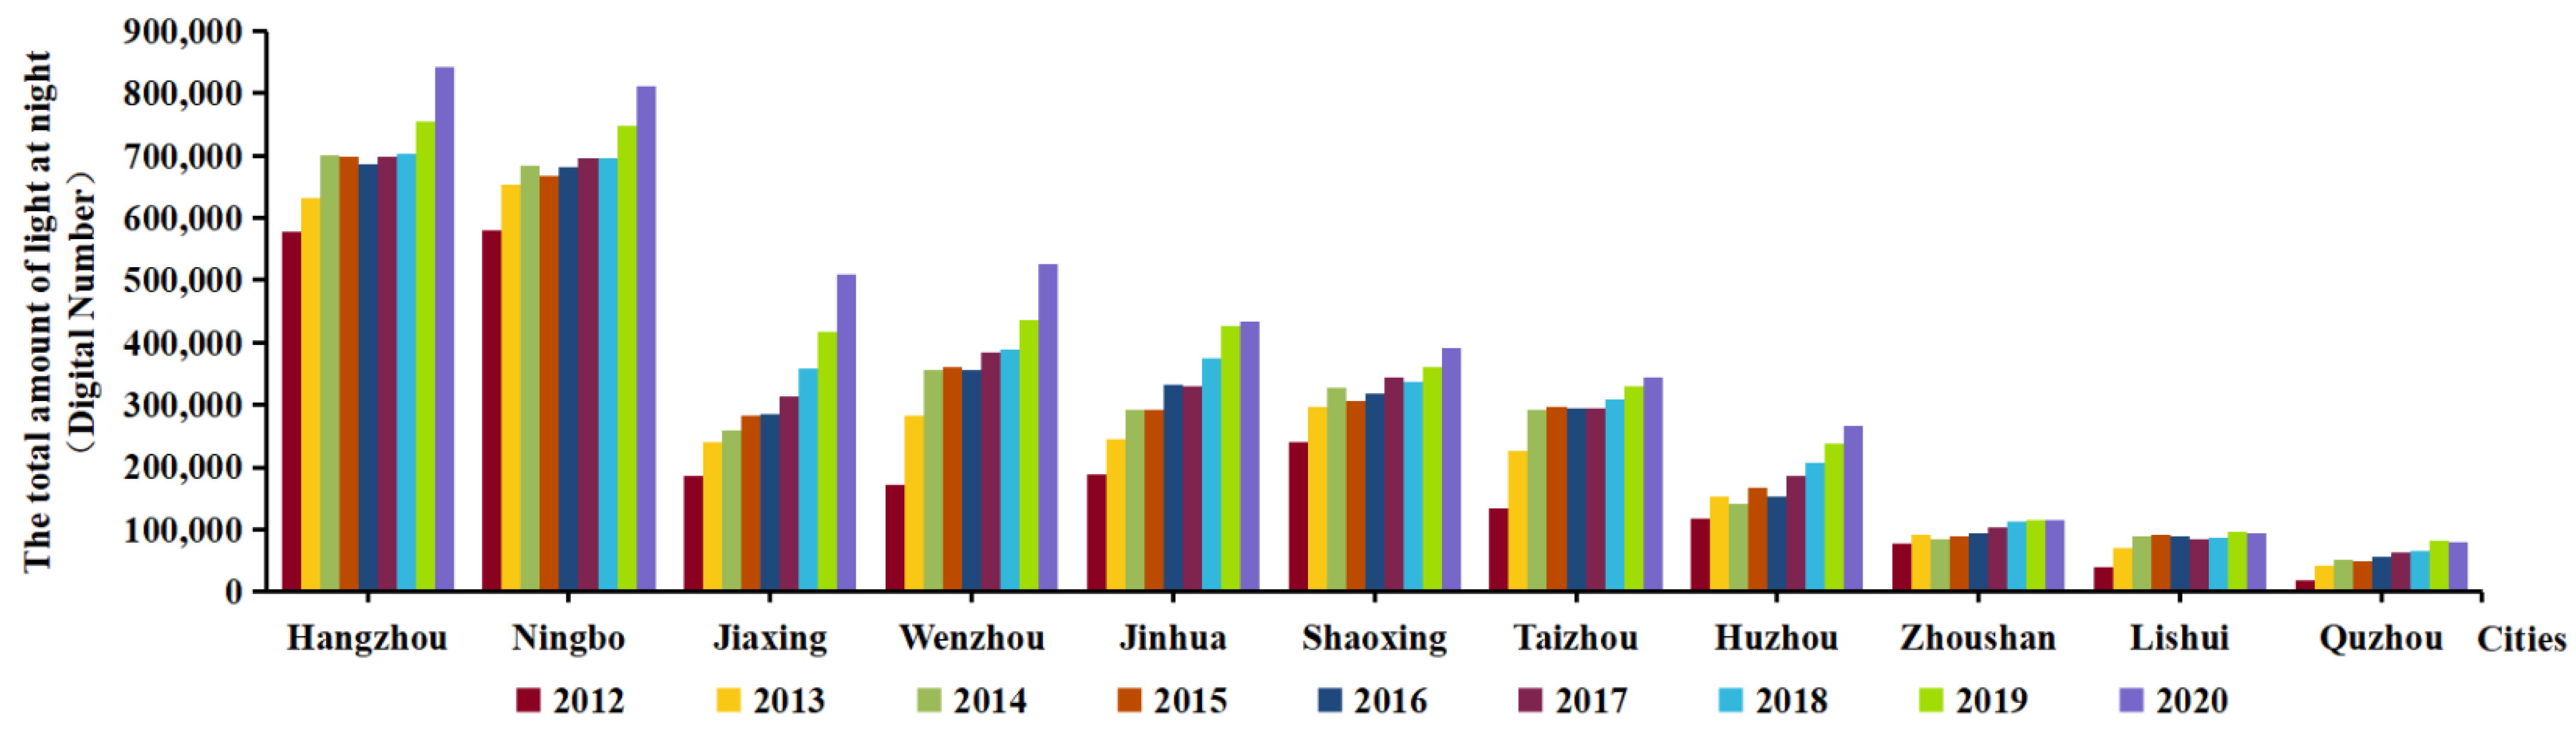
4.1.1. Interannual Variations in the Total Nighttime Light Value Zhejiang Province Cities

The total nighttime light values corresponding to cities in Zhejiang Province from 2012 to 2020 (Figure 5) can be divided into three tiers. The first-tier cities have DN values between 500,000 and 900,000, including Hangzhou and Ningbo. The DN values of these two cities are significantly higher than the DN values of other cities. The second-tier cities include Jinhua, Shaoxing, Wenzhou, Jiaxing, Taizhou and Huzhou, with DN values between 150,000 and 500,000. The third-tier cities, including Lishui, Quzhou and Zhoushan. The topography of these cities limits the development of urban zones, with total DN values generally lower than 150,000. According to the results of the study by Xu et al. [33,34], the nighttime light values in Hangzhou, Ningbo, Jiaxing, Huzhou, Jinhua and the coastal cities (such as Wenzhou, Taizhou) is higher than other cities. It indicates that the general pattern of urbanization in Zhejiang Province did not change significantly during the period 1992–2020.
The research shows that from 2012 to 2020, the total nighttime light values in the first-tier cities increased from values below 60,000 to 800,000, showing an increment of 200,000. Hangzhou exhibited 46% growth, while Ningbo underwent 40% growth. Among the second-tier cities, the DN values of Jiaxing and Wenzhou increased from nearly 200,000 to values above 500,000, exhibiting increments of 300,000 and growth rates above 100%; the DN value of Shaoxing increased from 250,000 to 400,000, exhibiting 60% growth. Among the third-tier cities, Quzhou had a significant DN value increment from 2012–2014, and its growth reached 319%; Lishui underwent growth of 145%; Zhoushan exhibited an nonsignificant increment, with an DN value increase of only 30,000 over nine years, corresponding to 49% growth.
Figure 5 also shows that the nighttime light value changes in Zhejiang Province reflected three different periods. From 2012 to 2014, all the cities showed significant increases, especially the cities in southern Zhejiang Province. Quzhou underwent growth of 162%, Lishui grew by 132%, Taizhou grew by 118%, and Wenzhou grew by 107%. From 2014 to 2018, the growth of most cities decelerated, except in Jiaxing, Jinhua and Huzhou. From 2018 to 2020, most cities exhibited a new round of growth, with increments higher than those observed in the 2012–2014 period. During this new growth period, Hangzhou, Ningbo, Jiaxing, Wenzhou and Huzhou showed significant DN value increases.

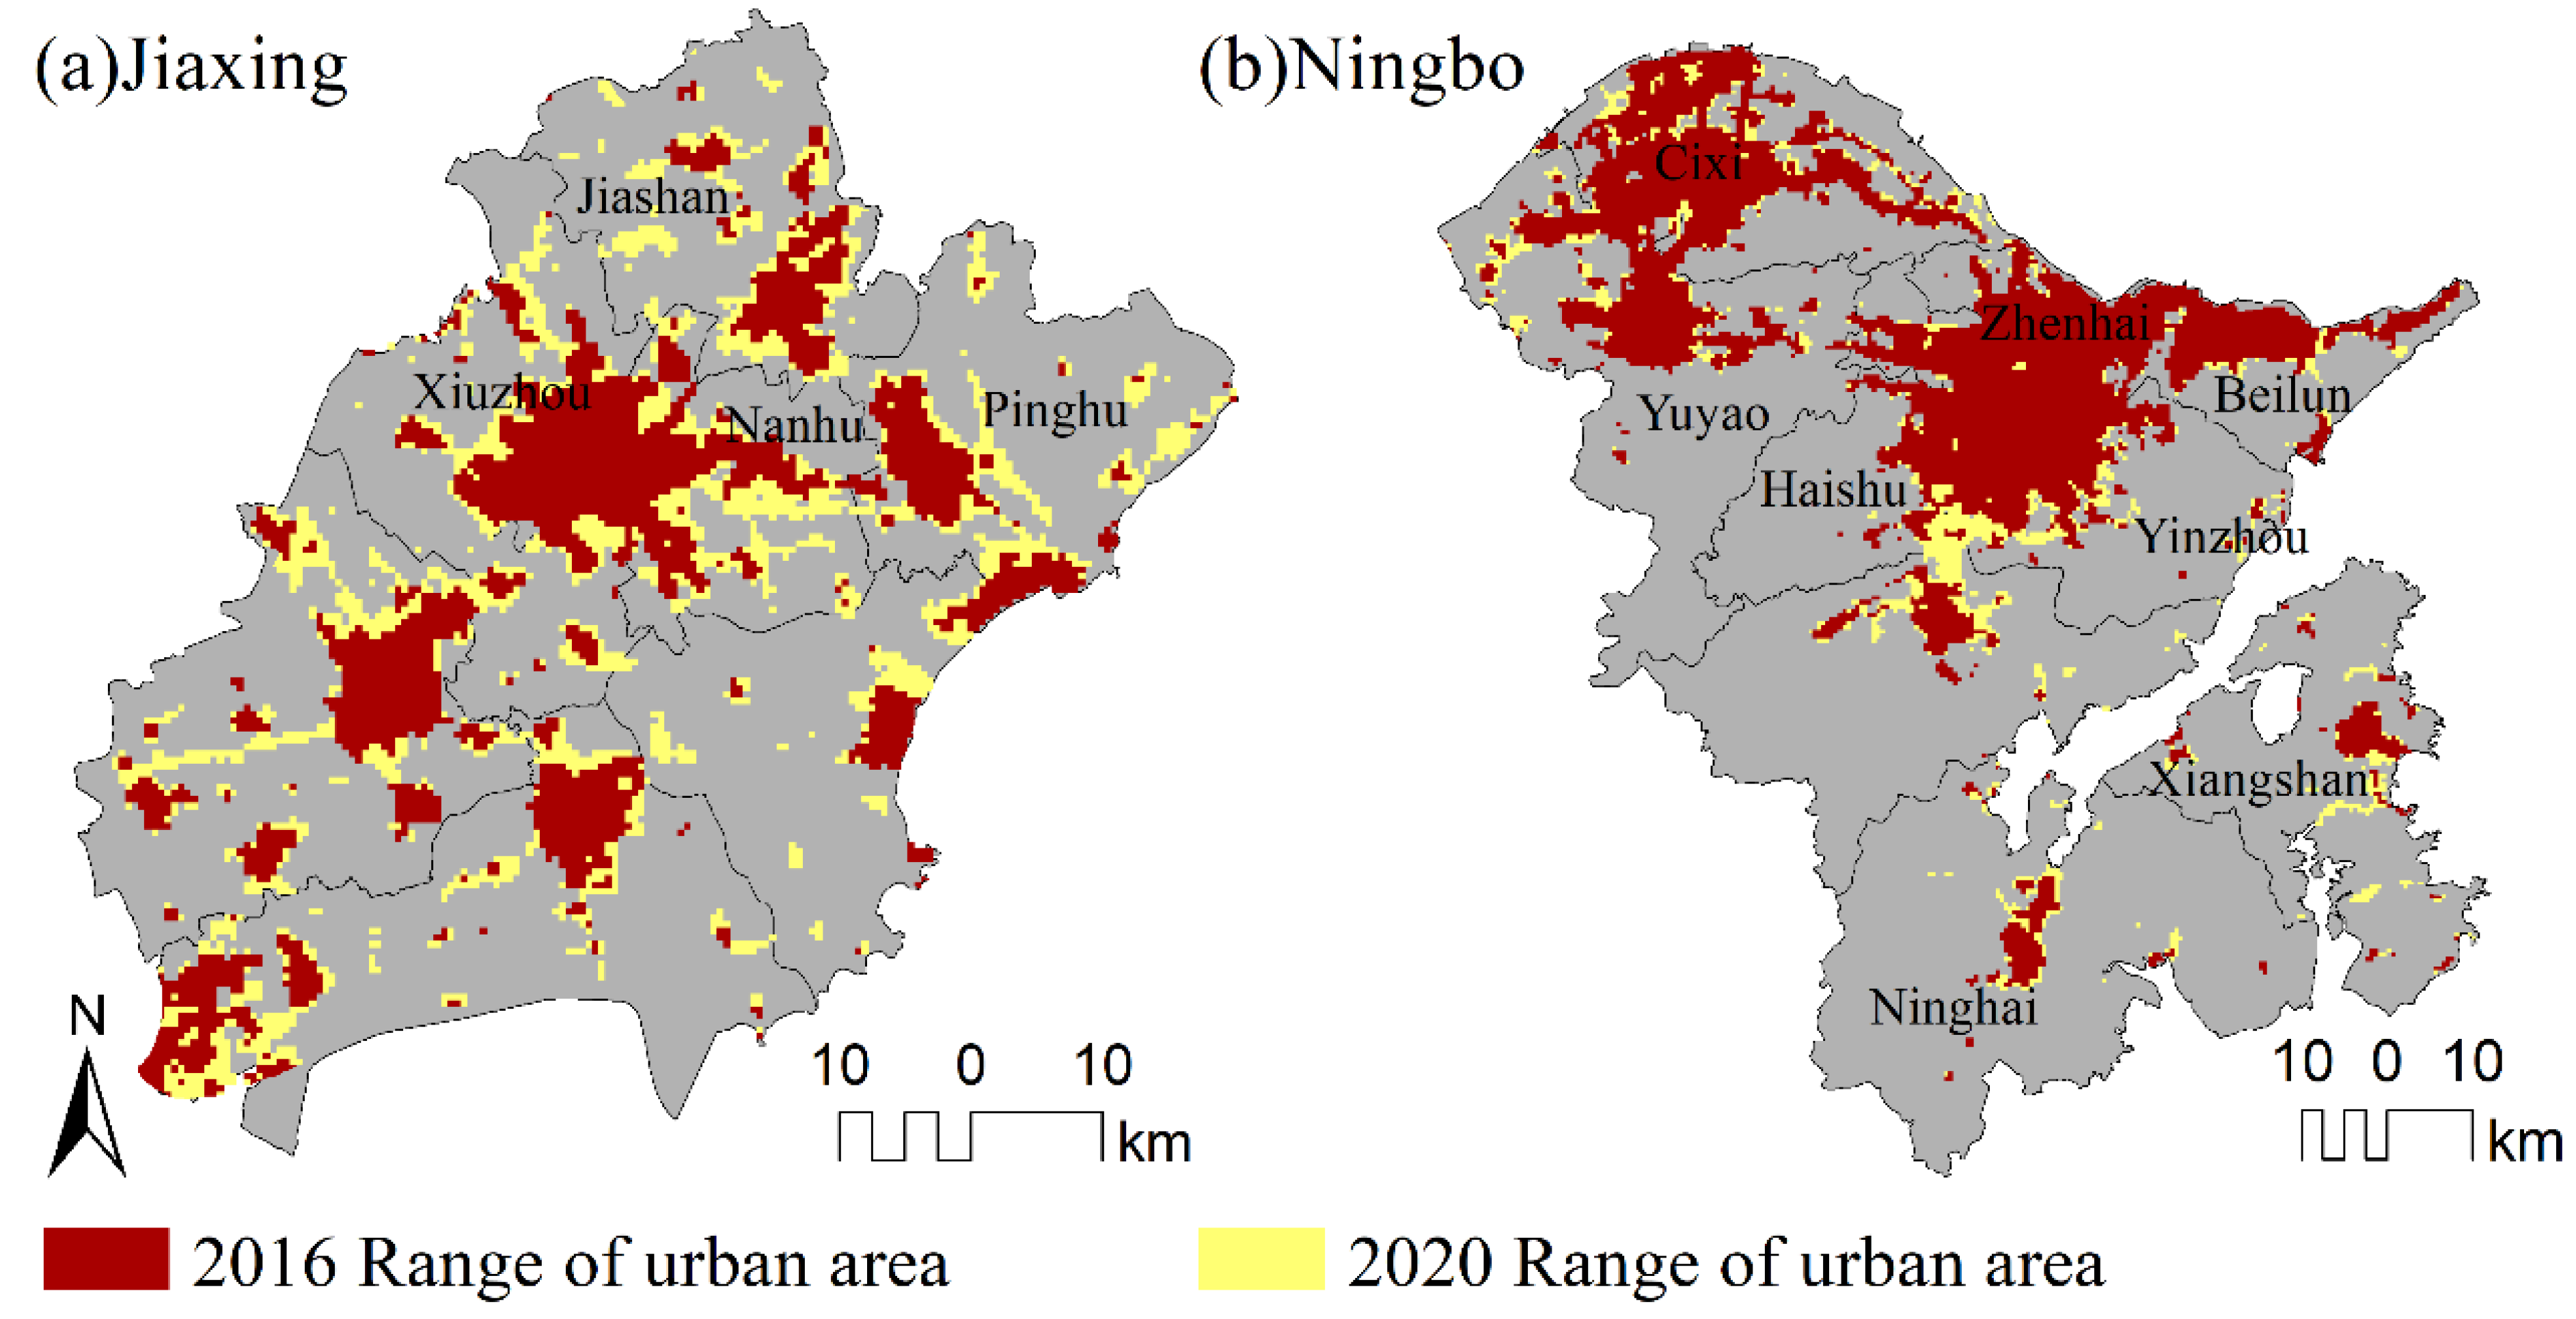
4.1.2. Spatial Variations in Nighttime Light in Zhejiang Province

(1)
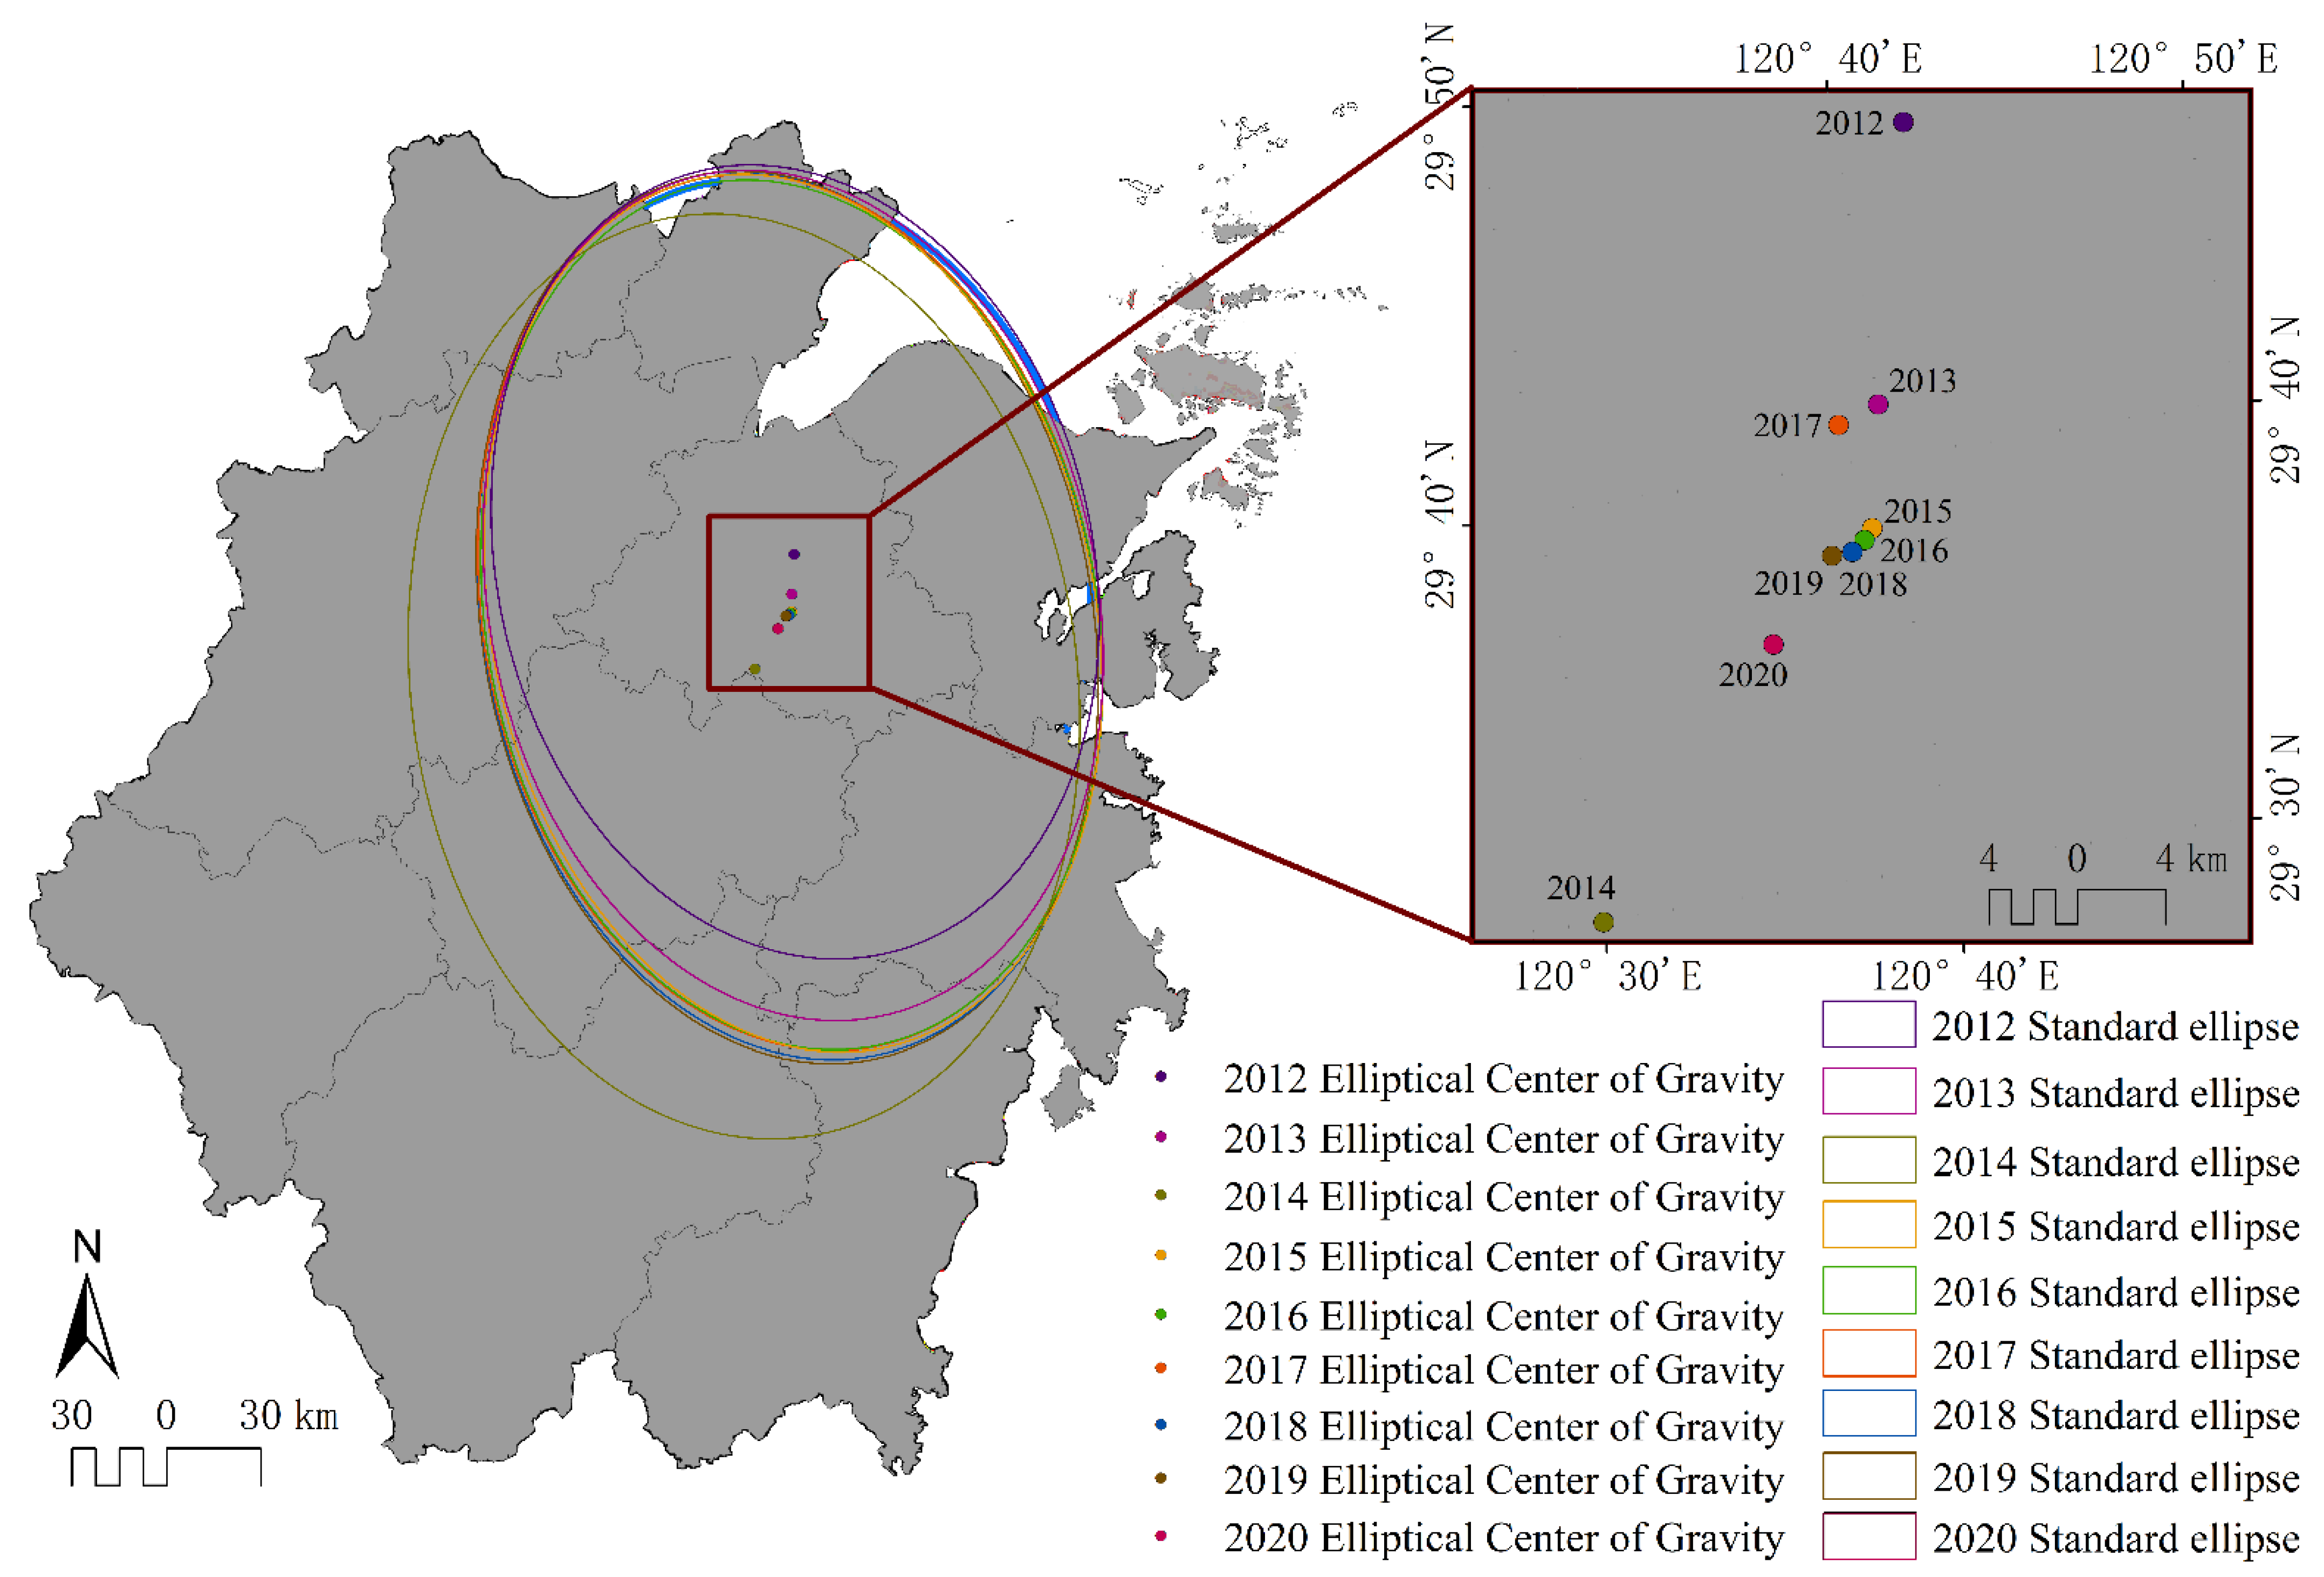
Standard deviation ellipse and change in the center of gravity of nighttime light
To understand the spatial changes in the nighttime light scale in Zhejiang Province, in this research, we constructed standard deviation ellipses (Figure 6). According to the observed changes in the ellipse area, the long axis of the ellipse is distributed in the north-south direction, while the center of gravity moved in the north-south direction in Zhejiang Province from 2012 to 2020. These results indicate that changes in the total nighttime light value in Zhejiang cities occurred mainly in the north-south direction, while the east-west direction was relatively balanced. The trajectory of this center-of-gravity migration shows that, from 2012–2013, the center of gravity shifted 12.7 km southward; from 2013–2014, the center of gravity shifted 26.5 km southward. After 2014, the center of gravity shifted northward between Keqiao District and Yueqiao District, reflecting a small change in location. The stability of the center of gravity indicates a stable development rate of the urban zones in each region of Zhejiang Province, so a smaller displacement of the center of gravity reflecting a more balanced development of Zhejiang Province.
(2)
Spatial and temporal nighttime light variations in major cities
Figure 7 shows the increases in the total nighttime light values observed in Wenzhou and Taizhou from 2012 to 2014. Since the western part of Wenzhou has a large area of mountains, the urban areas of Wenzhou are mainly located in the coastal area, including Lucheng, Ouhai, and Yueqing on the northeastern coast and Pingcang on the southeastern coast. From 2012 to 2013, the intensity of nighttime light in Wenzhou increased by 180,000, and nighttime light appeared to expand on the periphery of the original light areas. This finding indicates that expanded urban areas mainly appear on the peripheries of original urban areas, such as Lucheng, Ouhai, and Ruian. At the same time, the nighttime light intensity in Taizhou increased by 157,000 over the same period. These nighttime light expansions appeared in the central and southern parts of Taizhou, especially in the central urban area, in Wenling, and in the central regions of Linhai. In addition, the connections among the three major subdistricts of Taizhou (Huangyan District, Jiaojiang District, and Luqiao District) also reflect significant nighttime light increments.
From 2014 to 2020, Jiaxing, located in the northern part of Zhejiang Province, underwent a significant increase in nighttime lights. Jiaxing exhibited a 27,400 increment from 2014–2016 and a 224,188 increment from 2014–2016. According to Figure 8a, the new urban areas in Jiaxing mainly grew in an enclosed area outside the periphery of the original urban areas after 2016. Jiashan, Xiuzhou, Nanhu and Pinghu exhibited significant increments. Jiaxing is located in the northern part of Zhejiang Province and is one of the cities belonging to the Yangtze River Delta city cluster. The northeastern part of Jiaxing is located close to Shanghai, the leading city of the Yangtze River Delta, so the cities in the northern part of Jiaxing are growing relatively rapidly.
Ningbo, a subprovincial city in Zhejiang Province, is located in the northern part of the province. After 2016, the nighttime light intensity increased by 130,000, and the nighttime light expanded southward, indicating that the new urban areas were expanding southward at this time (Figure 8b). The core urban area of Ningbo located in a flat terrain area and can be divided into Sanjiang, Beilun and Zhenhai. The urban areas in Sanjiang developed along the river, reflecting high lighttime light intensity and density characteristics. The south region of Sanjiang was the main area undergoing urban expansion at this time. The urban areas in Beilun and Zhenhai developed along the coastline. After 2016, the urban areas in Yuci-Qianwan showed significant growth. The intensity and density of nighttime light in these areas increased, indicating the accelerated development of urban construction and socioeconomic activities in this sub-city. The nighttime light growth observed in the southern part of Ningbo was mainly concentrated in the Ninghai-Xiangshan region. These nighttime light spatial distribution and expansion characteristics in Ningbo demonstrate the “one core, two wings” [35] strategy adopted in this region.
Hangzhou showed significant nighttime light increases from 2012–2014 and from 2018–2020 (Figure 9). The latter period reflected more obvious growth than the former, and the nighttime light intensity increased by 140,000 in this latter period. According to the spatial distribution of nighttime light, nighttime light expansions mainly appeared in the Qiantang and Yuhang regions. The core urban areas of Hangzhou reflected high nighttime light intensities and densities, while these values were low in the other areas. Moreover, the core urban areas exhibited significantly higher increases compared to other regions, indicating that the core urban area of Hangzhou developed rapidly after 2014. The increases in the intensity and density of nighttime light in Hangzhou reflect the enhanced socioeconomic activities within the city of Hangzhou during the period of study.

4.2. Urban Structure Analysis Based on the Total Nighttime Light Value

4.2.1. “Dual-Core” Primacy

From 2012 to 2020, the “dual-core” primacy values of Hangzhou and Ningbo were greater than two (Table 2), indicating the leading positions of these two cities. The effect of the “double-core-driven” strategy is significant. It is worth noting that the decrease in the “dual-core” primacy reflects that the cities in the second-tier have developed rapidly in recent years, including Jiaxing, Wenzhou, Huzhou, Jinhua and Taizhou (as shown in Section 4.1). According to the study of the primacy of the primate city in Asian countries by Yi [36], although first-tier cities can strengthen their leading roles, they can also exacerbate development imbalances if the high development aggregation level continues over a long period. The continuous declining trend of “dual-core” primacy indicates that urban development in Zhejiang Province has gradually become balanced.

4.2.2. Urban-Scale Gini Index

With the exceptions of 2012 and 2013, the urban-scale Gini index of nighttime light in Zhejiang cities remained at the low level of 0.2 throughout the study period (Table 2). The results can thus be classified as either “relatively average” (for which the urban-scale Gini index ranges from 0.2 to 0.29) or “highly average” (for which the urban-scale Gini index is less than 0.2). The declining trend of the urban-scale Gini index. The positive correlations between nighttime light and the urbanization level and between nighttime light and socioeconomic activities show that the changes in urban zones in Zhejiang Province are related to the measures of exploring and solving regional development imbalances.
The results of the “Dual-core” primacy and the urban-scale Gini index reflect that urban development in Zhejiang Province has gradually become balanced in 2012–2020. The results of the study on Yangtze River Delta, in which Zhejiang Province is located, also indicate that the development pattern shifted from core cities impetus patterns to scattered urban development patterns, in Li et al. [37].
For the purpose of energetic conservation and the protection of nature, such as nocturnal species, several developed and developing countries are making efforts to use efficient light sources, a better orientation toward the ground and to spill less light upward in the direction of the satellite in 2018. Consequently, measures of nighttime light may result in lower unit nighttime light values, which means a unit night light value can reflect a higher economic level. China issued the “Standard for lighting design of buildings” as a national standard in 2013. Since then, the unit nighttime light value may reflect a higher socio-economic level in the new and renovated urban areas of Zhejiang Province after 2014. However, it is not yet possible to do a quantitative study on the above situation. Several limitations of our work should be addressed for future research avenues.

5. Conclusions

This research was based on NPP/VIIRS data collected from 2012 to 2020 by normalizing the nighttime light images obtained in different years by the relative radiometric normalization method. Through mathematical-statistical analyses involving the standard deviation ellipse, dual-core primacy, and urban-scale Gini index, in this research, we analyzed the scale of the available nighttime light data and its spatial distribution in Zhejiang Province. The following conclusions were obtained.
(1) We achieved good results when extracting urban zones from nighttime light images using the buffer threshold analysis method. The accuracy verification results indicated that the overall accuracy was higher than 90% and that the Kappa coefficient was higher than 80% in all years of study. In 2020, the overall accuracy reached 95.5% and the Kappa coefficient reached 91%.
(2) The analyses of the total nighttime light value and the standard deviation ellipse of cities in Zhejiang Province indicated that the nighttime light conditions in all the cities in Zhejiang Province have shown annually increasing trends, especially from 2012–2014 and from 2018–2020. Affected by the rapid development of cities in southern Zhejiang Province, such as Lishui, Wenzhou and Taizhou, the center of gravity shifted southward significantly from 2012 to 2014. After 2014, the development of cities in northern Zhejiang Province, such as Hangzhou, Ningbo, Jiaxing and Huzhou, promoted a northward shift in the center of gravity, with the center of gravity stabilizing in the Keqiao District-Yuecheng District of Shaoxing.
(3) The results of the “dual-core” primacy analysis showed that Hangzhou and Ningbo occupied an obvious leading position in the development of urban in Zhejiang Province. However, the observed decrease in the “dual-core” primacy reflected the rapid development of the cities in the second tier. The urban-scale Gini index results confirmed that the urban development differences in Zhejiang Province are narrowing and showing a trend of equalization.
(4) In recent years, the differences in the development of urban zones and the intensities of economic and social activities in urban areas in Zhejiang Province have gradually narrowed. That is due to the cities with relatively high urbanization levels driving development in cities with relatively low urbanization levels. Moreover, more attention should be given to building a regional demonstration of common prosperity in the overall urban development model. This phenomenon may be caused by the political measure of the common prosperity in Zhejiang Province.

Author Contributions

Conceptualization, Y.Y. and B.Z.; methodology, Y.Y. and B.Z.; software, Y.Y.; validation, Y.C.; formal analysis, Y.Y.; investigation, Y.Y.; resources, B.Z.; data curation, Y.Y.; writing-original draft preparation, Y.Y.; writing—review and editing, B.Z. and H.L.; visualization, Y.Y.; supervision, B.Z.; project administration, B.Z.; funding acquisition, Y.Y., B.Z., H.L. and Y.C. All authors have read and agreed to the published version of the manuscript.

Funding

This study is supported by the National Key Research and Development Program of China (Grant Number 2016YFC1400906), the Hangzhou Social Development Self-declaration Project (Grant Number 20160533B80), the Hangzhou Normal University Undergraduate Innovation Capacity Enhancement Project (the “Starlight” Project).

Data Availability Statement

The data that support the findings of this study are available from the author upon reasonable request.

Acknowledgments

The authors appreciate the editors and anonymous reviewers for their valuable comments and suggestions.

Conflicts of Interest

The authors declare no conflict of interest.

References

  1. Hu, J. Firmly march on the path of socialism with Chinese characteristics and strive to complete the building of a moderately prosperous society in all respects–Report to the 18th National Congress of the Chinese Communist Party. Qiushi 2012, 22, 3–25. [Google Scholar]
  2. Fang, C. Basic rules and key paths for high-quality development of the new urbanization in China. Geogr. Res. 2019, 38, 13–22. [Google Scholar]
  3. Zhejiang Provincial Development and Reform Commission and Ministry of Housing and Urban-Rural Development of Zhejiang Province. The 14th Five-Year Plan for New Urbanization Development of Zhejiang; Zhejiang Provincial Development and Reform Commission and Ministry of Housing and Urban-Rural Development of Zhejiang Province: Zhejiang, China, 2021. (In Chinese)
  4. World Urbanization Prospects: 2018 Revision. United Nations Population Division. Available online: https://data.worldbank.org/indicator/SP.URB.TOTL.IN.ZS (accessed on 6 January 2022).
  5. Ye, L. Evaluation of urban development quality based on the connotation of high-quality development: A case study of guangdong province. J. Landsc. Res. 2019, 11, 83–89. [Google Scholar]
  6. Zhu, B.; Zhang, M.; Zhou, Y.; Wang, P.; Sheng, J.; He, K.; Wei, Y.-M.; Xie, R. Exploring the effect of industrial structure ad-justment on interprovincial green development efficiency in China: A novel integrated approach. Energy Policy 2019, 134, 110946. [Google Scholar] [CrossRef]
  7. Mei, A. An Introduction to Remote Sensing; Higher Education Press: Beijing, China, 2001. [Google Scholar]
  8. Carter, H. The Study of Urban Geography; A Hodder Arnold Publication: London, UK, 1995. [Google Scholar]
  9. Chen, Z. A Multiscale Analysis on Urban Area and Spatial Structure Based on Nighttime Light Data. Ph.D. Thesis, East China Normal University, Shanghai, China, 2017. [Google Scholar]
  10. Liu, Y.; Jieyong, W.; Zhiwei, W. Simulation of the Spatial Pattern of Population of Urban and Rural Residents in Huang-Huai-Hai Area Based on NPP/VIIRS Nighttime Lights. Areal Res. Dev. 2019, 38, 176–180. [Google Scholar]
  11. Zhu, Z.; Xiang, X.; Shuangshuang, L. Evolution process and characteristics of spatial structure of urban agglomeration in the middle reaches of the Yangtze River. Acta Geogr. Sin. 2021, 76, 799–817. [Google Scholar]
  12. He, Q. Research on Digital Observation and Spatial Model Construction of Multi-Dimensional Urban Nighttime Light Environment. Master’s Thesis, Dalian University of Technology, Dalian, China, 2019. [Google Scholar]
  13. Xu, M.; He, C.; Liu, Z.; Dou, Y. How did urban land expand in china between 1992 and 2015? A multi-scalelandscape analysis. PLoS ONE 2016, 11, e0154839. [Google Scholar]
  14. Waluda, C.M.; Griffiths, H.J.; Rodhouse, P.G. Remotely sensed spatial dynamics of the Illex argentinus fishery, Southwest Atlantic. Fish. Res. 2008, 91, 196–202. [Google Scholar] [CrossRef]
  15. Imhoff, M.L.; Lawrence, W.T.; Stutzer, D.C.; Elvidge, C.D. A technique for using composite DMSP/OLS ‘City lights’ satellite data to map urban area. Remote Sens. Environ. 1997, 61, 361–370. [Google Scholar] [CrossRef]
  16. Li, Y.; Song, Z.; Wu, B.; Yu, B.; Wu, Q.; Hong, Y.; Liu, S.; Wu, J. Evaluating the Ability of NOAA-20 Monthly Composite Data for Socioeconomic Indicators Estimation and Urban Area Extraction. IEEE J. Sel. Top. Appl. Earth Obs. Remote Sens. 2022, 15, 1837–1845. [Google Scholar] [CrossRef]
  17. Zhou, Y.; Smith, S.J.; Elvidge, C.D.; Zhao, K.; Thomson, A.; Imhoff, M. A cluster-based method to map urban area from DMSP/OLS nightlights. Remote Sens. Environ. 2014, 147, 173–185. [Google Scholar] [CrossRef]
  18. Chen, Z.; Yu, B.; Song, W.; Liu, H.; Wu, Q.; Shi, K.; Wu, J. A New Approach for Detecting Urban Centers and Their Spatial Structure With Nighttime Light Remote Sensing. IEEE Trans. Geosci. Remote Sens. 2017, 55, 6305–6319. [Google Scholar] [CrossRef]
  19. Wu, B.; Yu, B.; Yao, S.; Wu, Q.; Chen, Z.; Wu, J. A surface network based method for studying urban hierarchies by night time light remote sensing data. Int. J. Geogr. Inf. Sci. 2019, 33, 1377–1398. [Google Scholar] [CrossRef]
  20. Li, D.; Yu, H.; Li, X. The Spatial-Temporal Pattern Analysis of City Development in Countries along the Belt and Road Initiative Based on Nighttime Light Data. Geomat. Inf. Sci. Wuhan Univ. 2017, 42, 711–720. [Google Scholar]
  21. Xu, H.; Hu, S. Chinese City Size Evolution Under Perspective of Nighttime Light Remote Sensing. Geomat. Inf. Sci. Wuhan Univ. 2021, 46, 40–49. [Google Scholar]
  22. Zheng, W.; Kuang, A.; Liu, Z.; Wang, X. Analysing the spatial structure of urban growth across the Yangtze River Middle reaches urban agglomeration in China using NPP-VIIRS night-time lights data. Geo J. 2021, 1–18. [Google Scholar] [CrossRef]
  23. Shi, K.; Huang, C.; Yu, B.; Yin, B.; Huang, Y.; Wu, J. Evaluation of NPP-VIIRS night-time light composite data for extracting built-up urban areas. Remote Sens. Lett. 2014, 5, 358–366. [Google Scholar] [CrossRef]
  24. Ma, T.; Zhou, C.; Pei, T.; Haynie, S.; Fan, J. Responses of Suomi-NPP VIIRS-derived nighttime lights to socioeconomic activity in China’s cities. Remote Sens. Lett. 2014, 5, 165–174. [Google Scholar] [CrossRef]
  25. Elvidge, C.D.; Zhizhin, M.; Ghosh, T.; Hsu, F.-C.; Taneja, J. Annual Time Series of Global VIIRS Nighttime Lights Derived from Monthly Averages: 2012 to 2019. Remote Sens. 2021, 13, 922. [Google Scholar] [CrossRef]
  26. Elvidge, C.D.; Baugh, K.; Zhizhin, M.; Hsu, F.C.; Ghosh, T. VIIRS night-time lights. Int. J. Remote Sens. 2017, 38, 5860–5879. [Google Scholar] [CrossRef]
  27. Xie, Y.; Weng, Q. Updating urban extents with nighttime light imagery by using an object-based thresholding method. Remote Sens. Environ. 2016, 187, 1–13. [Google Scholar] [CrossRef]
  28. Srivastava, A.; Bharadwaj, S.; Dubey, R.; Sharma, V.B.; Biswas, S. Mapping Vegetation and Measuring the Performance of Machine Learning Algorithm in Lulc Classification in the Large Area Using Sentinel-2 and Landsat-8 Datasets of Dehradun as a Test Case. Int. Arch. Photogramm. Remote Sens. Spat. Inf. Sci. 2022, 43, 529–535. [Google Scholar] [CrossRef]
  29. Jefferson, M. The Law of the Primate City. Geogr. Rev. 1939, 29, 226–232. [Google Scholar] [CrossRef]
  30. He, C.; Shi, P.; Li, J.; Chen, J.; Pan, Y.; Li, J.; Zhuo, L.; Ichinose, T. Spatial Reconstruction of Urbanization Processes in Mainland China in the 1990s Based on DMSP/OLS Nighttime Lighting Data and Statistics. Chin. Sci. Bull. 2006, 7, 856–861. [Google Scholar]
  31. Chen, X.; Li, X.; Qiu, Z.; Jiang, D. A Gini Coefficient -Based Equilibrium Study for the Distribution of City Size. Stat. Decis. 2017, 1, 93–97. [Google Scholar]
  32. Zhang, H.; Ye, Y.; Chen, S. The changes of population size hierarchy of the urban group of pearl river delta and its spatial character since 20 years ago. Econ. Geograpgy 2006, 26, 806–809. [Google Scholar]
  33. Xu, P.; Jin, P.; Yang, Y.; Wang, Q. Evaluating Urbanization and Spatial-Temporal Pattern Using the DMSP/OLS Nighttime Light Data: A Case Study in Zhejiang Province. Math. Probl. Eng. 2016, 2016, 9850890. [Google Scholar] [CrossRef] [Green Version]
  34. Xu, P.; Jin, P.; Cheng, Q. Monitoring Regional Urban Dynamics Using DMSP/OLS Nighttime Light Data in Zhejiang Province. Math. Probl. Eng. 2020, 2020, 9652808. [Google Scholar] [CrossRef]
  35. Ningbo Municipal Bureau of Natural Resources and Planning. The Ningbo Urban Master Plan for 2006–2020 (2015 Revision); Ningbo Municipal Bureau of Natural Resources and Planning: Zhejiang, China, 2015. (In Chinese)
  36. Yi, J. Asian cities: Spatial dynamics and driving forces. Ann. Reg. Sci. 2021, 66, 609–654. [Google Scholar]
  37. Li, Y.; Ye, H.; Gao, X.; Sun, D.; Li, Z.; Zhang, N.; Leng, X.; Meng, D.; Zheng, J. Spatiotemporal Patterns of Urbanization in the Three Most Developed Urban Agglomerations in China Based on Continuous Nighttime Light Data (2000–2018). Remote Sens. 2021, 13, 2245. [Google Scholar] [CrossRef]
Figure 1. The location and elevation from the ASTER Global Digital Elevation Model (ASTER GDEM 30M) of the study area.
Remotesensing 14 03212 g001
Figure 2. Normalization processing model of the utilized nighttime light data in (a) 2012, (b) 2016, (c) 2019 of study.
Remotesensing 14 03212 g002
Figure 3. Results of the NPP/VIIRS nighttime light image normalization in Zhejiang Province from 2012 to 2020 (with the year 2020 used as a benchmark).
Remotesensing 14 03212 g003
Figure 4. Buffer threshold analysis results obtained for the nighttime light-extracted urban areas in Zhejiang Province: (a) the location of the No.21 urban checkpoint in Google Earth; (b) the location of the No.44 non-urban checkpoint in Google Earth.
Remotesensing 14 03212 g004
Figure 5. Total nighttime light values in the urban areas of cities in Zhejiang Province from 2012 to 2020.
Remotesensing 14 03212 g005
Figure 6. Standard deviation ellipse and center of gravity changes corresponding to the total nighttime light values in Zhejiang Province from 2012 to 2020.
Remotesensing 14 03212 g006
Figure 7. Nighttime light growth trends in Wenzhou and Taizhou from 2012 to 2014.
Remotesensing 14 03212 g007
Figure 8. Nighttime light growth trends in Jiaxing and Ningbo from 2016 to 2020.
Remotesensing 14 03212 g008
Figure 9. Total nighttime light value in Hangzhou from 2012 to 2020.
Remotesensing 14 03212 g009
Table 1. Accuracy test results of the extracted urban areas in Zhejiang Province.
YearUrban ZoneNon-Urban ZoneOverall AccuracyKappa Coefficient
TrueFalseTrueFalse
2012928881290.0%80.0%
2013881293790.5%81.0%
2014901094692.0%84.0%
2015901091990.5%81.0%
2016982841691.0%82.0%
201796495595.5%91.0%
2018891191990.0%80.0%
2019955901092.5%85.0%
2020901092891.0%82.0%
Table 2. “Dual-core” primacy and urban-scale Gini index results obtained for the total nighttime light values in Zhejiang Province from 2012 to 2020.
Year201220132014201520162017201820192020
Pr
(“Dual-core” Primacy)
3.352.672.492.402.362.262.122.042.01
G
(Urban-scale Gini index)
0.240.280.210.200.200.200.190.180.21
Publisher’s Note: MDPI stays neutral with regard to jurisdictional claims in published maps and institutional affiliations.

