Article

Regional Contributions and Climate Attributions to Interannual Variation of Global Net Ecosystems Production by an ECOSYSTEM Processed Model Driven by Remote Sensing Data over the Past 35 Years

1
Institute of Digital Agriculture, Fujian Academy of Agricultural Sciences, Fuzhou 350003, China
2
Key Laboratory of Ecosystem Network Observation and Modeling, Institute of Geographic Sciences and Natural Resources Research, Chinese Academy of Sciences, Beijing 100101, China
3
School of Geography and Information Engineering, China University of Geosciences, Wuhan 430074, China
4
College of Resources and Environment, University of Chinese Academy of Sciences, Beijing 100049, China
*
Author to whom correspondence should be addressed.
Remote Sens. 2022, 14(13), 3208; https://doi.org/10.3390/rs14133208
Submission received: 26 April 2022 / Revised: 1 July 2022 / Accepted: 2 July 2022 / Published: 4 July 2022

Abstract

:
Global climate change has significantly affected terrestrial carbon sinks. Net ecosystem production (NEP) plays a critical role in the global carbon cycle. However, interannual variability (IAV) of the NEP and its regional contributions and climate attributions are not well-understood on a global scale. This study used a diagnostic model driven by remote sensing leaf area index (LAI) to investigate the NEP IAV and analyze regional and climate contributions on a global scale from 1982 to 2016. We found large NEP IAV during the study period, with the NEP detrended anomaly ranging from −2.3 Pg C in 1998 to 1.6 Pg C in 2013 at a global scale. Furthermore, 63.7% and 34.1% of the areas showed positive and negative contributions to NEP IAVs globally, respectively. Evergreen broadleaf forest (EBF) contributed the most (31.1%) to NEP IAV, followed by cropland (21.7%) and grassland (20.8%). Temperature played the most critical roles in the global NEP IAV, with a contribution of 45.5%. However, the partial correlation between NEP and temperature was negative, and the correlation with precipitation was positive in most areas of the globe, indicating that global warming is not conducive to the global carbon sink, but abundant rainfall is important for the global carbon cycle. This study suggests that, to increase the global carbon sink, we should pay more attention to tropical forests (EBFs) and highlight the importance of water availability.

Graphical Abstract

1. Introduction

Increased atmospheric CO2 concentration since 1850 has enhanced plant growth, and global terrestrial ecosystems have functioned as a strong carbon sink since the 1960s [1]. On average, the global terrestrial ecosystem could remove around a quarter of anthropogenic CO2 emissions per year, substantially mitigating global climate change [2]. As the difference between gross primary production (GPP) and ecosystem respiration (Re), net ecosystem production (NEP) represents net carbon uptake by terrestrial ecosystems. Thus, positive NEP indicates that the terrestrial ecosystem is a carbon sink, while negative NEP means it is a carbon source [3]. The interannual variability (IAV) in NEP reflects year-to-year variations in ecosystem carbon budgets, which determine the strength of the carbon sink or source [4,5]. Hence, the IAV of NEP plays a critical role in regulating the global carbon cycle [6,7,8].
Global land carbon sink has had a significant upward trend over recent decades, but shows large IAV [1,9]. Global climate change and climate variability could influence related physiological and biogeochemical processes and significantly affect the IAV of global NEP [10,11,12]. For example, warmer temperatures could promote plant growth and thus could be regarded as one main reason for enhanced vegetation productivity over northern higher latitudes [13,14]. Photosynthesis could sharply drop off when an ecosystem becomes water-limited [15]. However, there is still a lack of studies on the climate factors’ attribution on the IAV of NEP at a global scale. For mitigating global warming, regions dominating the global NEP are more effective for carbon uptake on a long-time scale [16]. Investigating the IAV of global NEP and exploring regional contributions are of great significance for ecosystem management and climate policymaking [17].
Studying global and regional IAV of NEP relies on ecosystem models. Terrestrial biosphere models can be classified into two main types depending on how leaf area index (LAI) is obtained: diagnostic and prognostic models [18]. Prognostic models use climatic and edaphic conditions to simulate vegetation structure and the carbon cycle [1]. However, the simulated results have varied in prognostic models [19]. The biggest uncertainty of the prognostic models is in simulating temporal variations in vegetation structural parameters such as LAI. Compared to simulating LAI by the prognostic model, LAI based on satellite observations can better reflect the changes in vegetation growth. Diagnostic models that use remotely sensed LAI are effective tools to simulate the global historic carbon dynamics [20]. The Boreal Ecosystem Productivity Simulator (BEPS) is a diagnostic model driven by remote sensing LAI, and could perform better than the prognostic model in simulating the carbon sink for long-time series and large regional scale in the past [20]. The BEPS model has been adopted for all ecosystems over the globe [21,22].
Here, we used the BEPS model to simulate spatiotemporal variations in global terrestrial ecosystems’ NEP and investigate their regional contributions and climate attributions during 1982–2016. Our main objectives are: (1) exploring the IAV of NEP and identifying regional contributions to IAV of NEP globally; (2) understanding the dominant climatic drivers of interannual variations of global NEP. This study could enhance our understanding of the global carbon budget and its control mechanisms.

2. Materials and Methods

2.1. Model Description

The BEPS model adopts the Farquhar model [23] and the ‘Jarvis’ model to simulate photosynthesis and stomatal conductance in the canopy, which was divided into sunlit and shaded leaves. Furthermore, a modified version of the CENTURY model [24] was adopted by the BEPS model to simulate the decomposition of soil organic matter. Soil heterotrophic respiration was expressed as a function of soil carbon mass, decomposition rate, and respiration efficiency of four soil carbon pools and five litter carbon pools. The details of the BEPS model can be found in Chen et al. [20].

2.2. Datasets

2.2.1. The Global NEP Dataset

To analyze the IAV of NEP and its attributions, we collected monthly NEP simulation results by the BEPS model from Chen et al. [20] during 1982–2016. The NEP dataset had been compared with the global residual land sink (RLS) reported by the Global Carbon Project (GCP) [1]. The results indicated that the NEP from the BEPS model closely follows the trend and interannual variability of the residual land carbon sink [20].

2.2.2. Climate Datasets

The climate datasets used in this study include monthly temperature (TAVG), precipitation (PRCP), and solar radiation (RAD) during 1982–2016. We acquired the climate datasets from the Modern-Era Retrospective analysis for Research and Applications, version 2 (MERRA-2) data, which is a good-quality reanalysis dataset with improvements over MERRA [25]. All the climate data were resampled to 0.5° × 0.5° resolution.

2.2.3. Vegetation Distribution Map

This study used the global MODIS International Geosphere-Biosphere Projects (IGBP) majority land-cover classification at 0.5° × 0.5° to identify global vegetated areas and vegetation classes (Figure 1). We reclassified the plant function types into eight categories: evergreen needle-leaf forest (ENF), evergreen broad-leaf forest (EBF), deciduous needle-leaf forest (DNF), deciduous broad-leaf forest (DBF), mixed forest (MF), grassland (GRA), cropland (CRO), and shrub (SHR).

2.3. Analysis Method

To compare the different seasonal contributions, we divided the year into four seasons: MAM (March, April, and May), JJA (June, July, and August), SON (September, October, and November), and DJF (December, January, and February). The flowchart for this study is shown in Figure 2.

2.3.1. Contribution Index

To explore the contribution of the holistic global NEP IAV, we used the contribution index (fj) to calculate the contribution of the individual grid cell to global NEP IAV. The contribution index (fj) is expressed as the following equation [26]:
f j = t = 1 N x j t | X t | X t t = 1 N | X t |
where x j t is the annual NEP flux anomaly for grid cell j at year t, and X t is the NEP detrend anomaly of the globe. f j is the average relative anomaly for grid cell j, weighted with the absolute anomaly | X t | in the globe. A positive value represents positive contributions, and a negative value represents negative contributions. f j ranges from −1 to 1.
To estimate the contributions of climate factors to the global IAV of NEP, the responses of the NEP to climate variables were firstly calculated in grid cells globally for different seasons using a multiple regression approach [27].
y i = a i X i T + b i X i P + c i X i R + ε i
where y i denotes NEP detrended anomalies in the season i. X i T , X i P , and X i R are the detrended anomalies of temperature, precipitation, and solar radiation in the season i. The regression coefficients a i , b i , and c i are the sensitivities of NEP to temperature, precipitation, and solar radiation in the season i. ε i is the residual error. Then, we used Equation (1) to estimate the contribution of the climate factors to the global NEP IAV.

2.3.2. Partial Correlation between NEP IAV and Climatic Variables

We adopted a partial correlation method to analyze the correlations between IAV of NEP and climatic variables. The analysis could enable an investigation of the correlation between NEP and individual climate variables while eliminating the influence of other climate variables. However, before conducting the partial correlation analysis, NEP and climatic variables were detrended [2,28].

3. Results

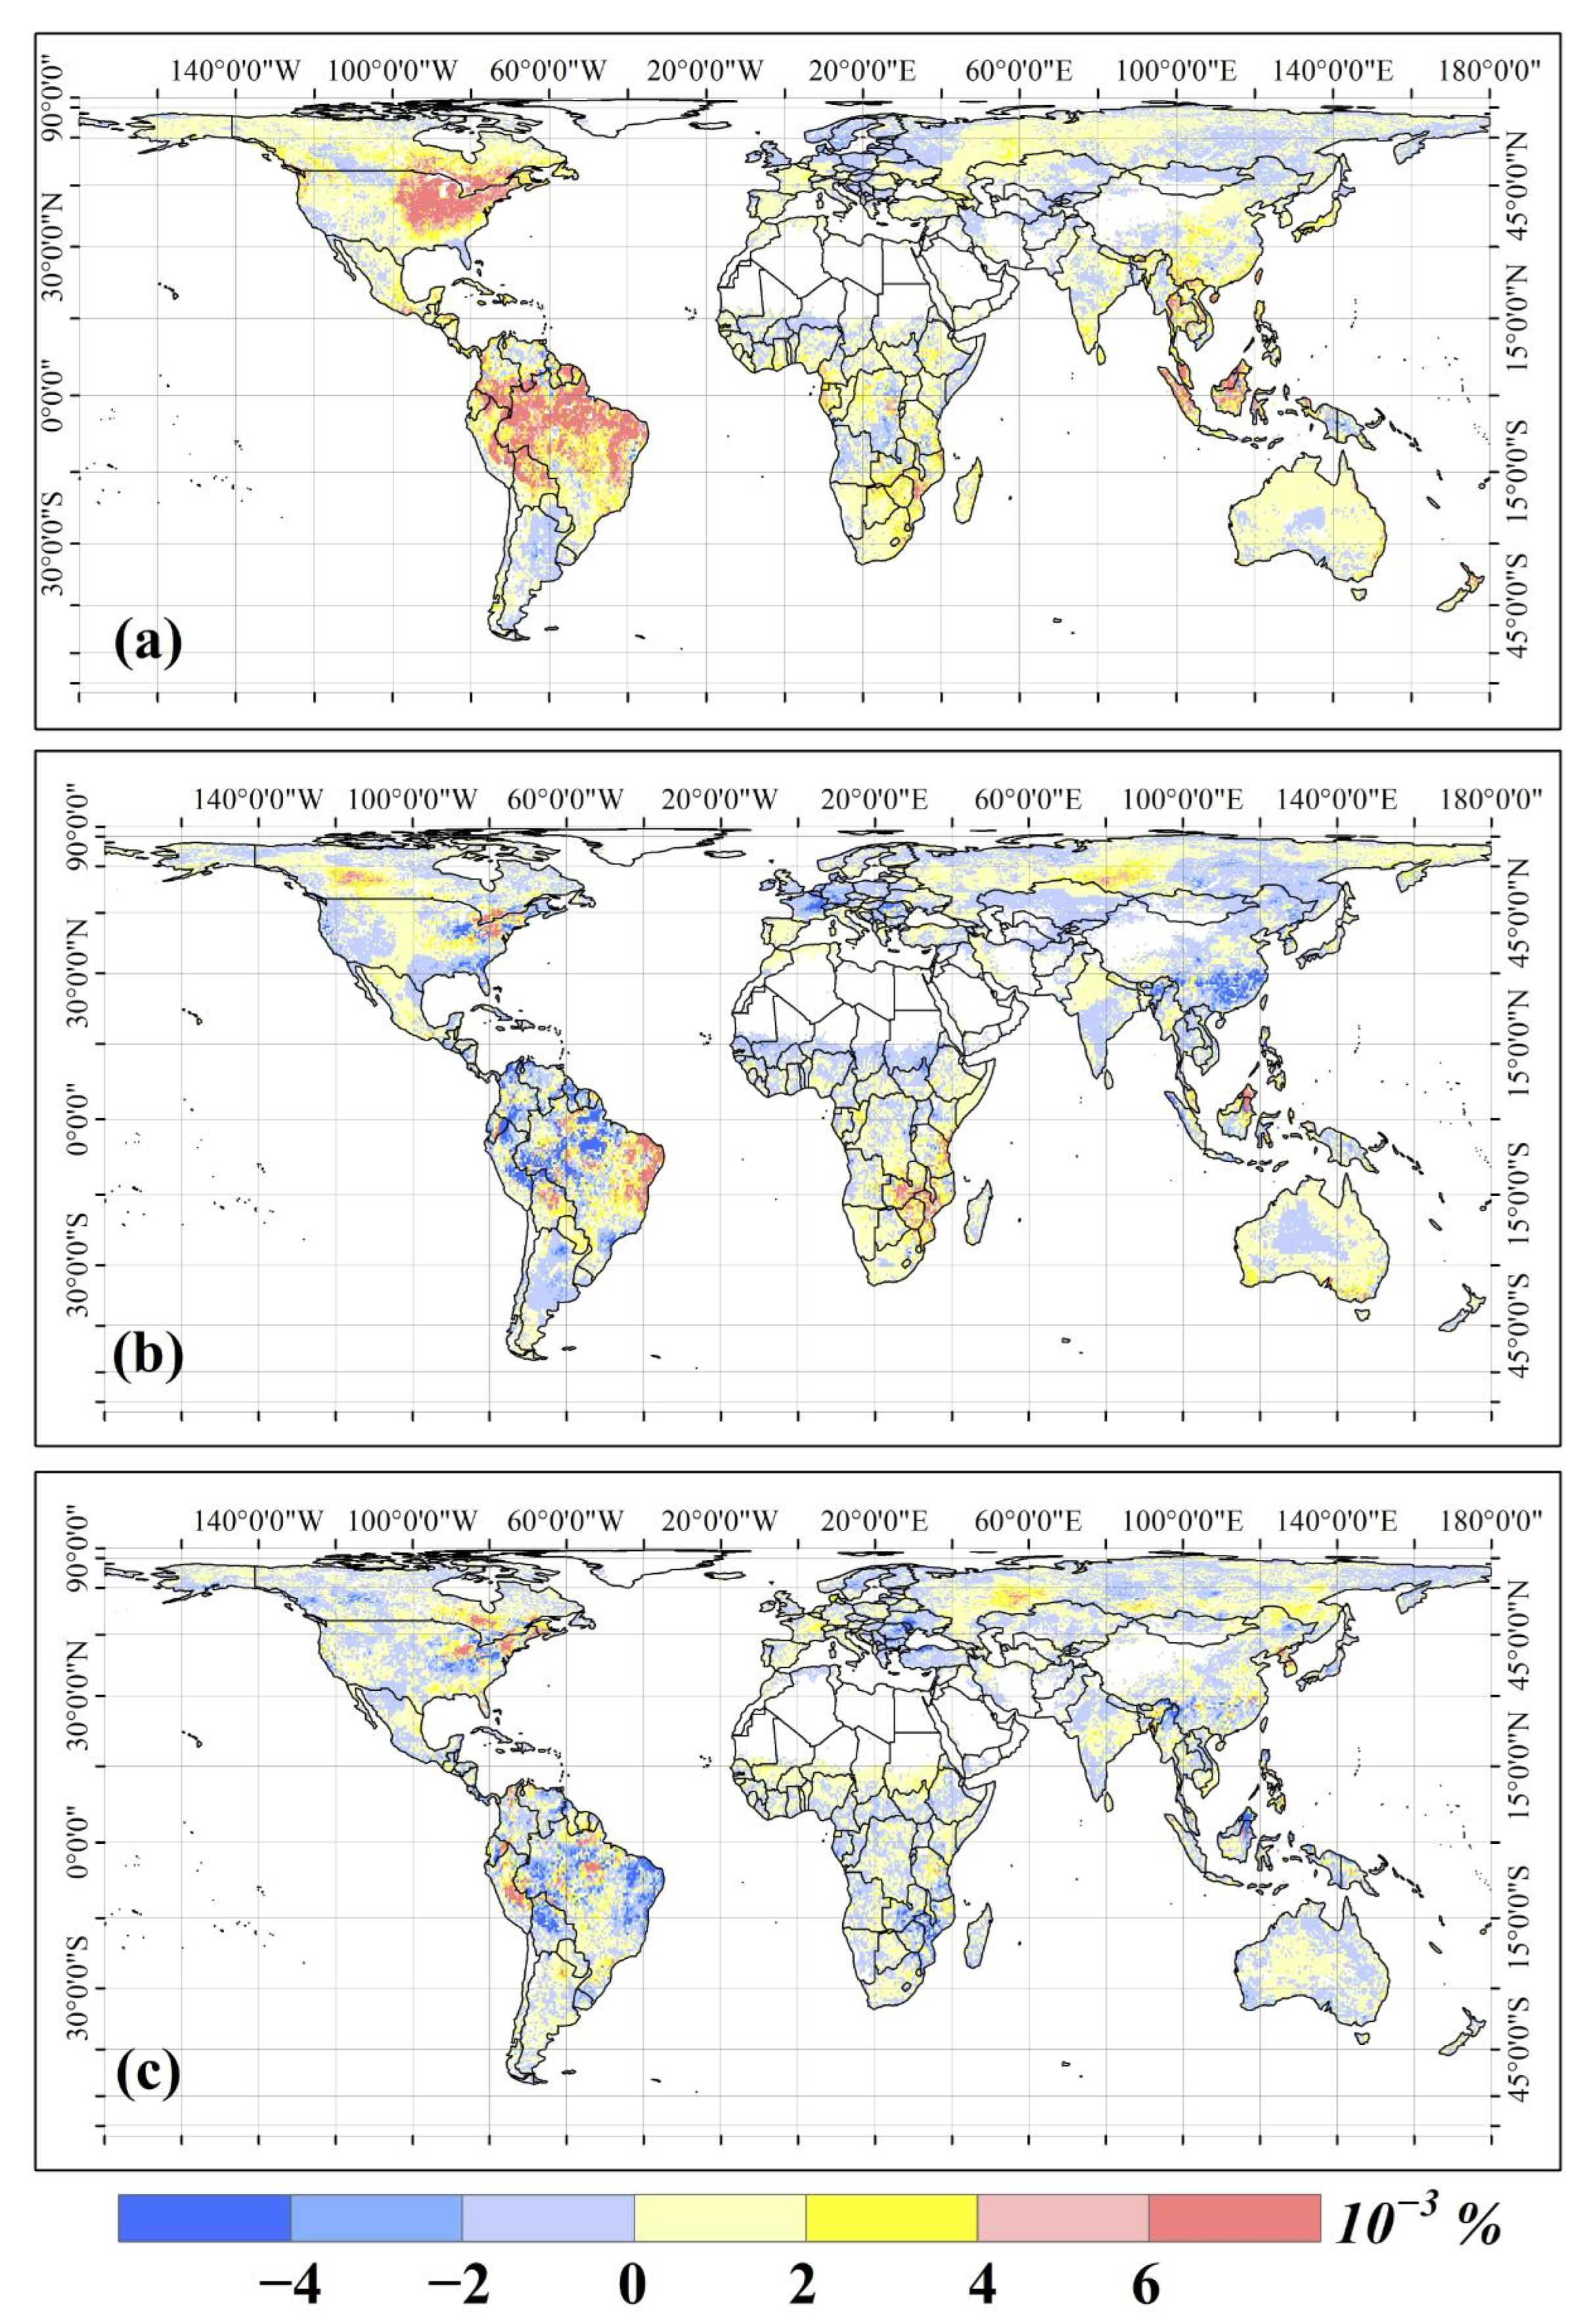
3.1. Spatio-Temporal Distributions of Global NEP IAV

According to the BEPS model simulation results, the global NEP showed an uptrend of 0.04 Pg C yr−2 and large interannual variability during 1982–2016 (Figure 3a). The mean annual NEP was 2.6 Pg C yr−1, which indicated that the global terrestrial ecosystem was a carbon sink during the study period. The NEP detrended anomalies ranged from −2.32 Pg C in 1998 to 1.62 Pg C in 2013, with the mean annual absolute difference being 0.9 Pg C yr−1 (Figure 3a).
The spatial pattern of the mean annual NEP showed obvious geographical heterogeneity (Figure 3b). The tropical region, especially in EBF area, was the largest carbon sink, with annual mean NEP values larger than 50 g C m−2 yr−1. At high latitudes of the Northern Hemisphere, the NEP value was larger than 10 g C m−2 yr−1 and smaller than 25 g C m−2 yr−1. However, in most areas of Oceania and some areas of the southwest, the NEP values were smaller than 10 g C m−2 yr−1 (Figure 3b).
The spatial pattern of the absolute NEP differences (Figure 4a) was similar to the spatial pattern of the annual mean NEP (Figure 3b) across the globe during the period from 1982 to 2016. Mean absolute annual NEP difference ranged from 0 to 150 g C m−2 yr−1. The larger absolute NEP differences occurred in some regions of southeast North America, Europe, and South America, with values larger than 70 g C m−2 yr−1. The absolute NEP differences were larger than 50 g C m−2 yr−1 in the EBF of the tropical regions. Furthermore, a small absolute NEP difference occurred in Oceania, most areas of Africa, and southwestern North America, with the mean difference less than 30 g C m−2 yr−1. These results suggest that ecosystems with larger productivity had larger NEP IAV globally.
We compared the different vegetation types on the absolute NEP difference (Figure 4b). The results indicated that the forests, including ENF, EBF, DBF, and MF have a similar mean absolute NEP difference, with the absolute mean difference being around 76.8 g C m−2 yr−1. This was followed by CRO, for which the mean absolute NEP difference was 62.8 g C m−2 yr−1. The mean absolute NEP difference in SHR was the smallest, with the value being less than 15.2 g C m−2 yr−1. The results indicate that forests have larger interannual variabilities compared to other vegetation types on a global scale.

3.2. The Regional and Seasonal Contribution to the Global NEP IAV

3.2.1. Regional Contributions

We adopted the contribution index to quantify the contributions to the NEP IAV over the globe at the grid-cell scale (Figure 5). The results indicated that 63.7% and 34.1% of the areas showed positive and negative contributions to NEP IAV over the globe, respectively. Furthermore, the remaining 2.3% of global areas contributed zero to the global NEP IAV. The grid cells with high positive contributions were mostly located in some regions of eastern North America, northern South America, and central Africa, where the contribution values were larger than 0.01%. However, the grid cells with negative contributions were mostly located in southeast Asia, the south of the Sahara Desert, and some areas of Australia, with contributions less than zero.
We counted the mean absolute NEP difference by latitudes (Figure 6a) and different vegetation types (Figure 6b) to explore their contributions to the global NEP interannual variability. The results show that the largest contributions occurred in tropical regions, with contributions larger than 0.005%. Furthermore, the smallest contributions occurred in the latitude around 30°N, 10°N, and 30°S, where the contributions were smaller than 0.002% (Figure 6a). These results suggested that the contribution to global NEP IAV decreased from the equator to the poles. We also analyzed the contributions of different vegetation types to global NEP IAV (Figure 6b). The results showed that EBF contributed most (31.1%) to NEP IAV, followed by CRO (21.7%) and GRA (20.8%). Deciduous forests (DNF and DBF) contributed the smallest to NEP IAV at a global scale. These results suggested that EBF played a vital role in regulating the global NEP IAV.

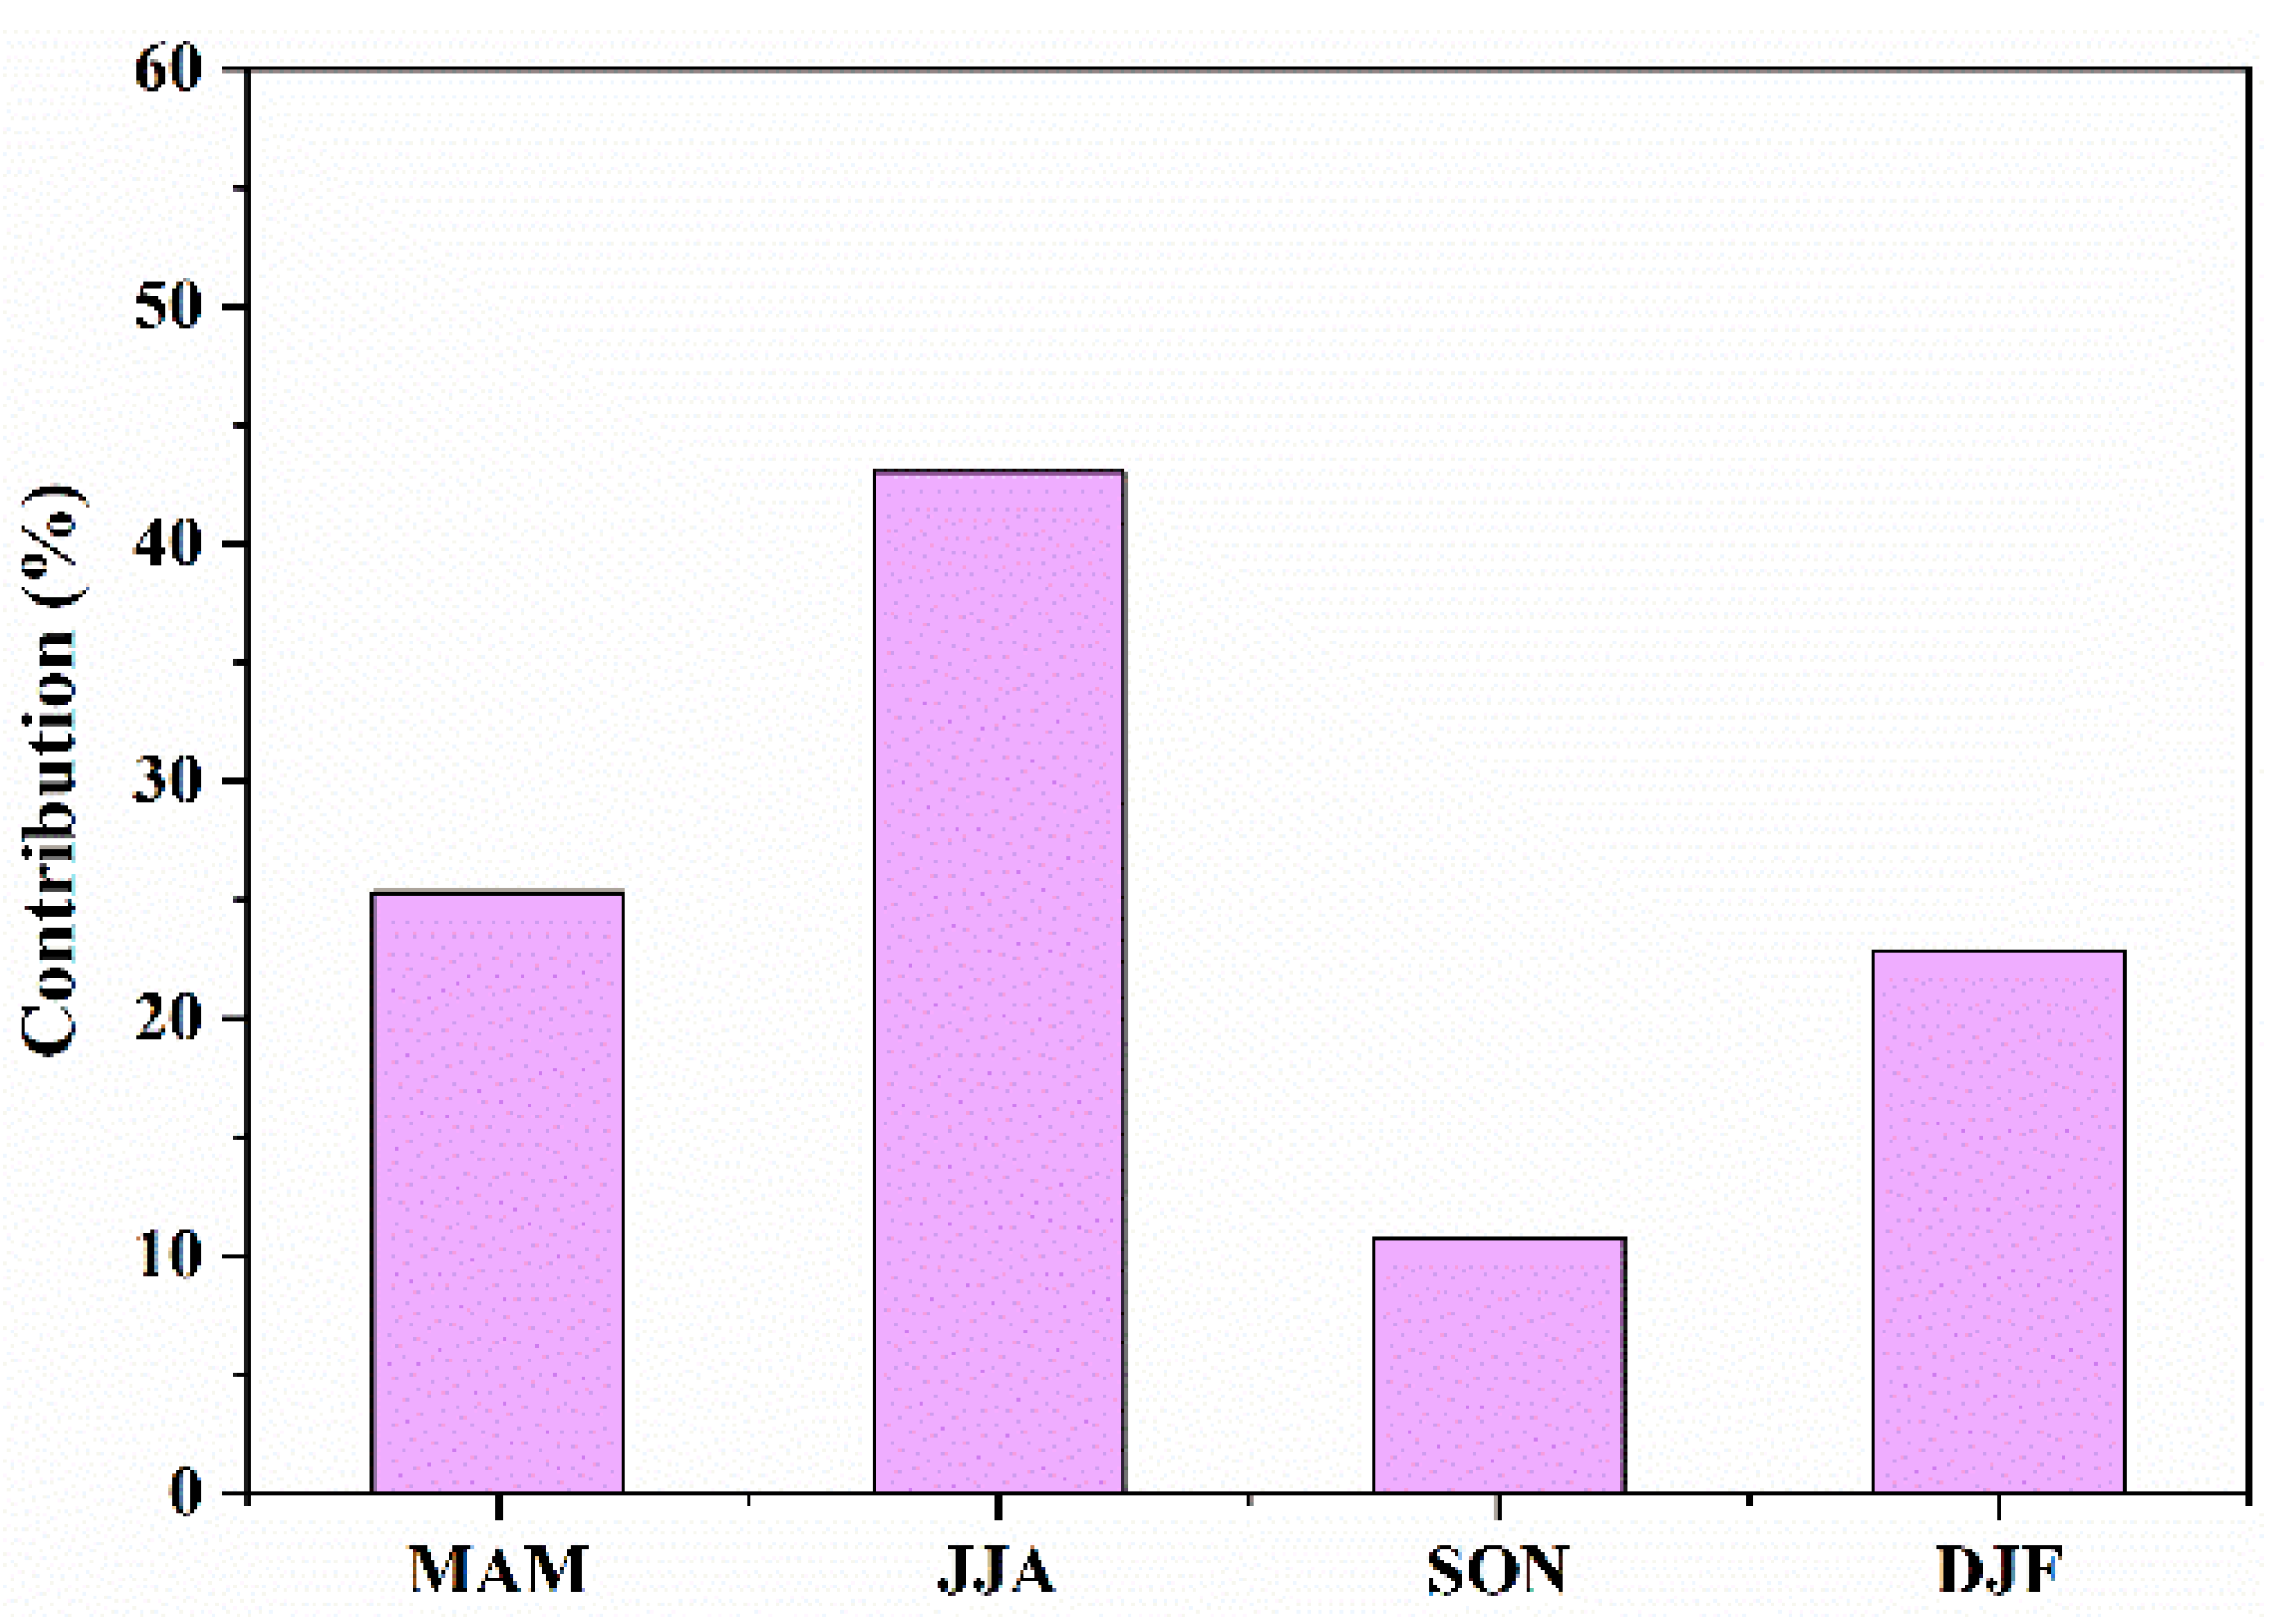
3.2.2. Seasonal Contributions to IAV of NEP

The contribution to NEP IAV varied between seasons (Figure 7). In MAM, some regions around the equator contributed the most to NEP IAV, with contributions larger than 0.006% to global NEP IAV at grid-cell scale. There were negative contributions to global NEP IAV in some southwestern North America, Asia, and Oceania regions. In JJA, the contribution in the Northern Hemisphere was larger than in the Southern Hemisphere. In some areas of North America and Europe, the contributions to IAV NEP were larger than 0.01%. However, in most areas of the Southern Hemisphere, the contributions were less than 0.001%. In SON, the contributions were the smallest, and the contribution was smaller than 0.001% in most regions over the globe. In DJF, the contribution in the Southern Hemisphere was larger than in the Northern Hemisphere, especially in most areas of South America and Africa, where the contributions were larger than zero. However, in the Northern Hemisphere, most contributions were less than zero.
We counted the seasons’ contributions to the IAV of NEP. The results showed that JJA contributed most (43.1%) to global NEP IAV, followed by MAM (25.33%) and DJF (22.89%). Furthermore, SON contributed the least to the global NEP IAV compared to other seasons (Figure 8). These results indicated that JJA played a vital role in regulating the global NEP IAV.

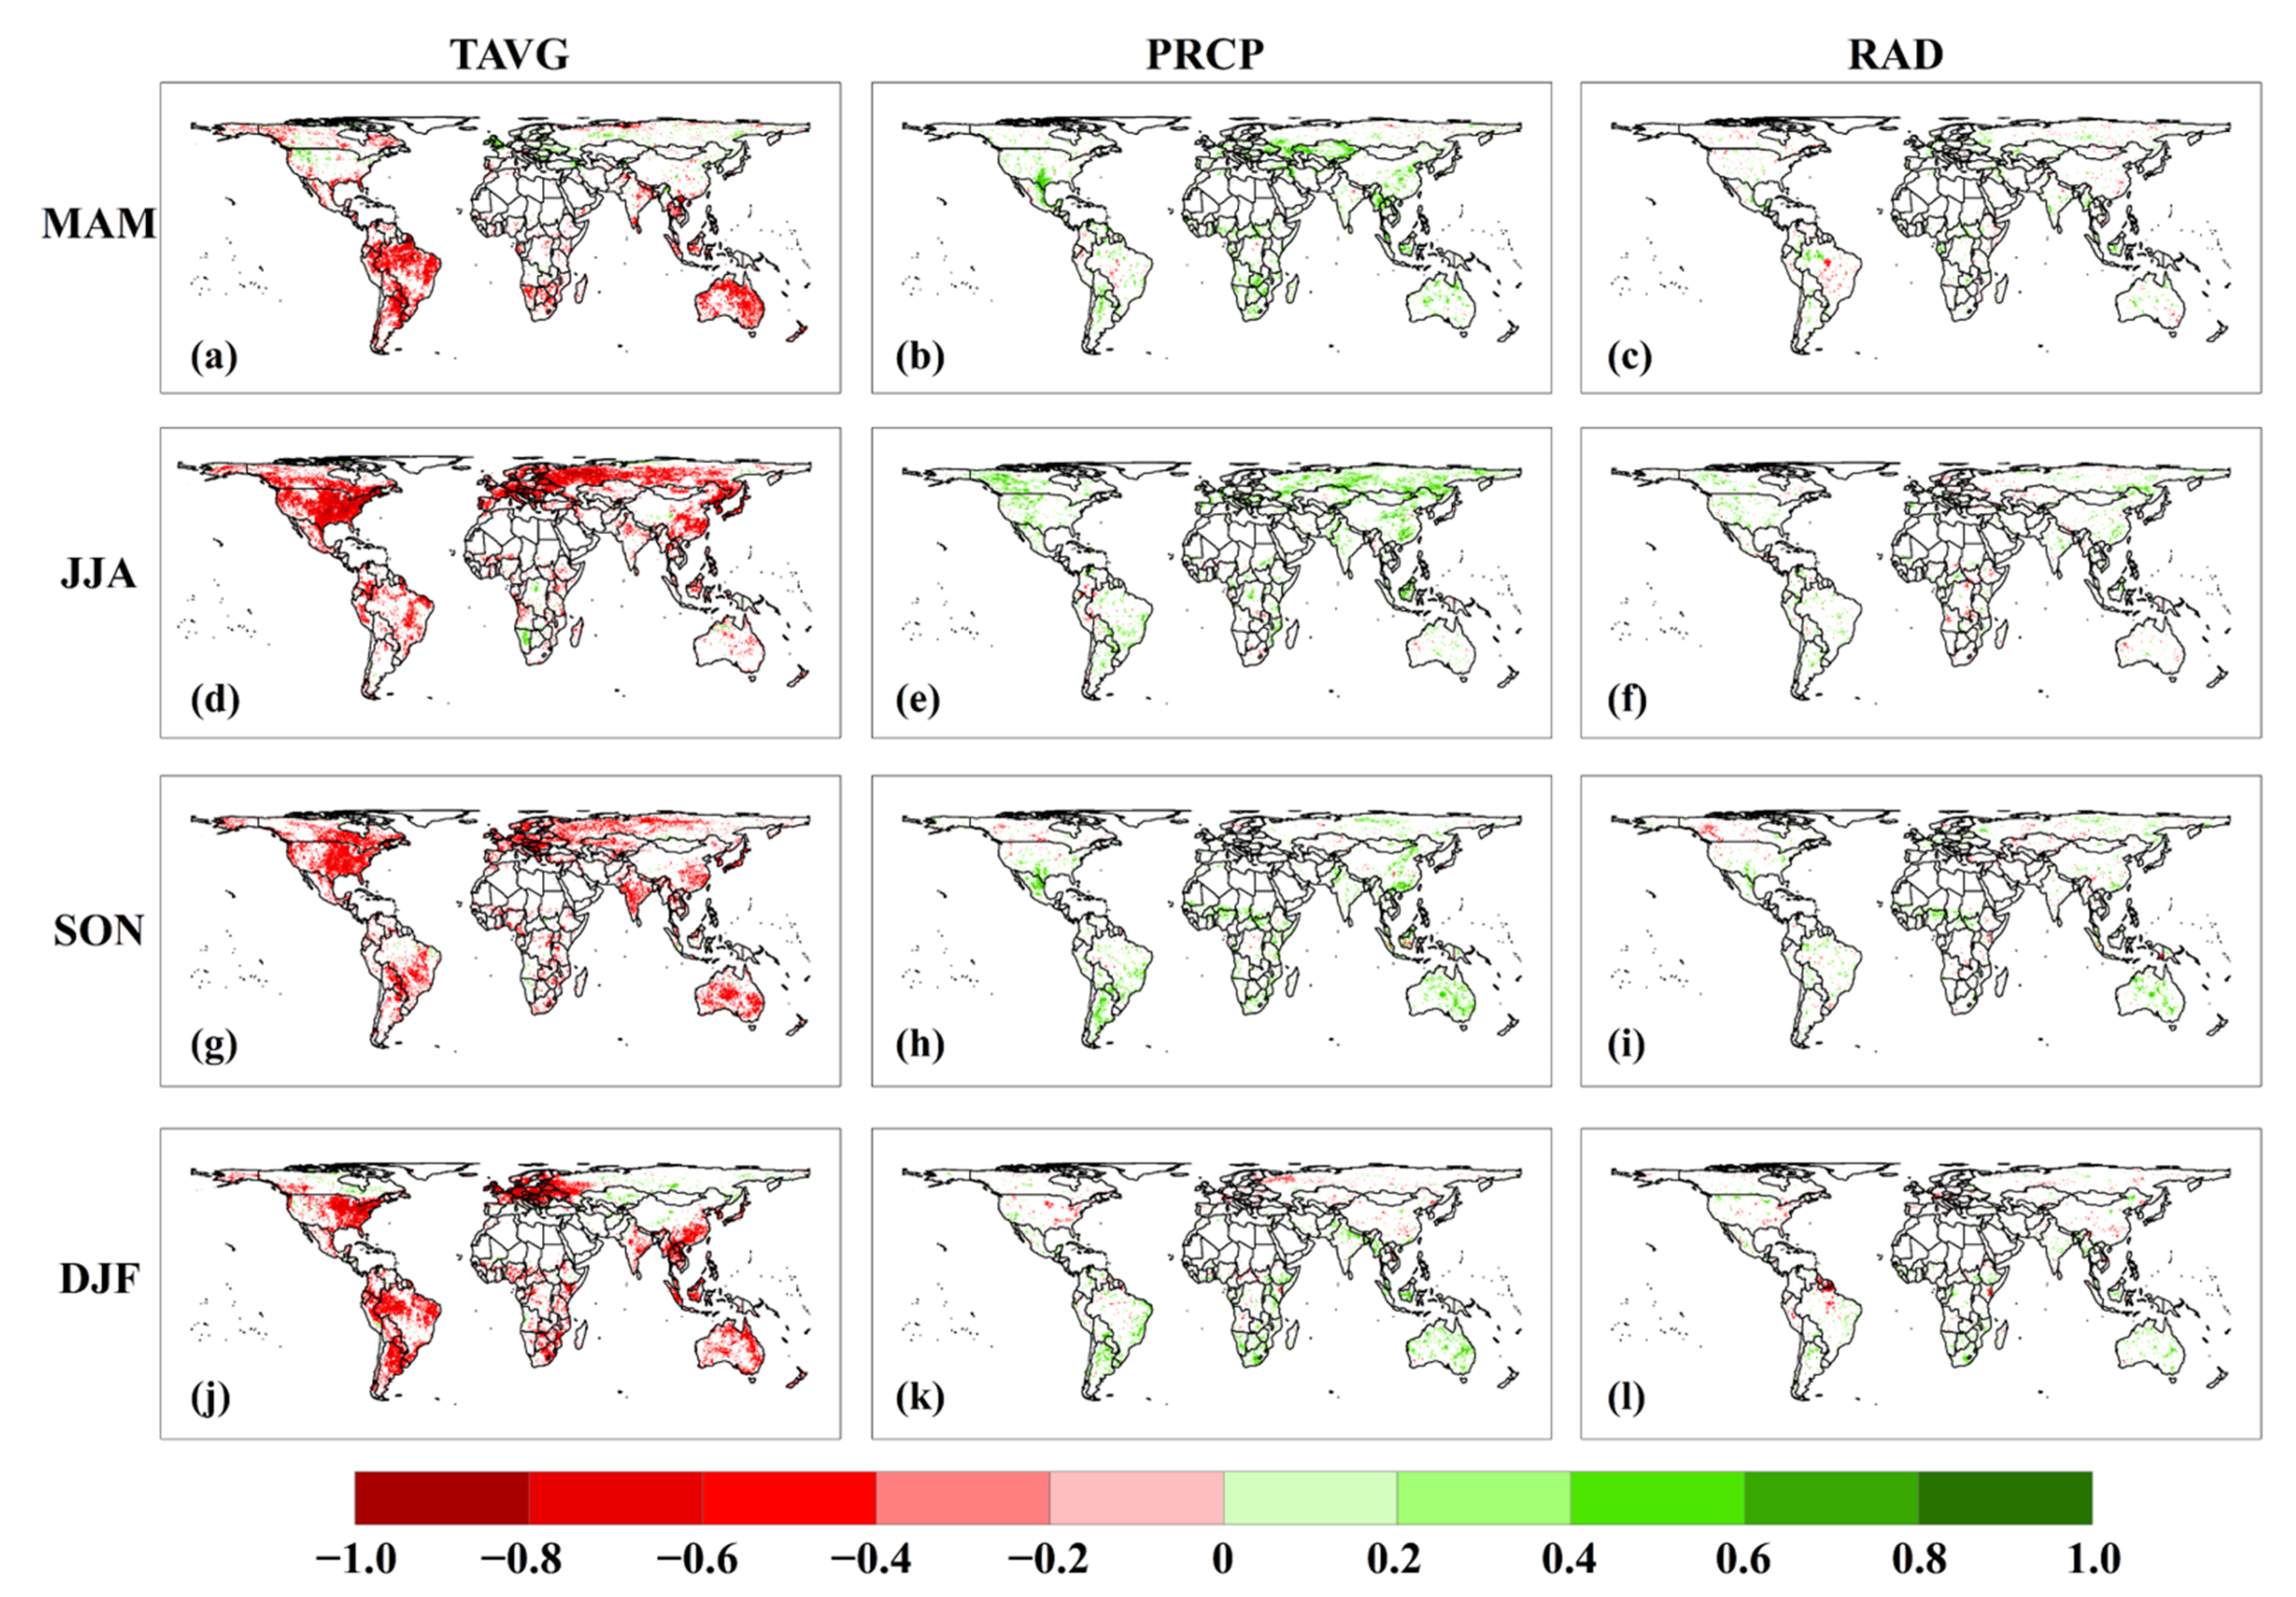
3.3. Attribution of Climatic Factors to Global NEP IAV

The spatial pattern of the contributions of climate variables to global NEP IAV is shown in Figure 8. The result indicated that the temperature contributed more than precipitation and solar radiation at the global scale. In southeast North America and northern South America, the contributions of the temperature were larger than 0.006%. In Europe and some areas of Asia, the contribution values were smaller than −0.002% (Figure 9a). Compared to temperature, precipitation (Figure 9b) and solar radiation (Figure 9c) played negative roles in global NEP IAV in most areas of global.
We counted the contributions by climate factors (Figure 10a). The results indicate that temperature contributed the most to the global IAV of NEP, with the contribution being 45.5%, followed by precipitation (4.8%) and solar radiation (2.4%). These results indicated that temperature played a major role in regulating the global IAV of NEP.
We also counted the contributions by climate factors at different seasons (Figure 10b). The temperature contributions to IAV of NEP were 28.5%, 66.2%, 28.3%, and 69.4% in MAM, JJA, SON, and DJF, respectively. The contributions of precipitation to IAV of NEP were 13.5%, 8.4%, 7.2%, and 2.3% in MAM, JJA, SON, and DJF, respectively. Finally, the contributions of solar radiation to IAV of NEP were 3.8%, −0.3%, 3.4%, and 7.9% in MAM, JJA, SON, and DJF, respectively. These results suggested that temperature contributed the most to NEP IAV in any season.
The climatic control on the IAV of NEP is substantially different across regions and seasons (Figure 11). Temperature played a negative role in the global IAV of NEP. There were 21.3%, 33.0%, 30.5%, and 30.0% of pixels that showed significant negative correlations with temperature for MAM, JJA, SON, and DJF, respectively. Precipitation played significant positive roles in NEP IAV over globe. There were 12.4%, 14.3%, 10.9%, and 8.0% of pixels that showed significant positive correlations with precipitation for MAM, JJA, SON, and DJF, respectively. In a comparison of the temperature and precipitation, most areas of global showed less correlation with solar radiation. There were only 6.6%, 7.6%, 8.2%, and 7.1% of pixels in the globe which expressed significant correlations with solar radiation for MAM, JJA, SON, and DJF, respectively. These results indicate that global warming is not conducive to the formation of a global carbon sink, and abundant precipitation could facilitate the formation of a carbon sink in global terrestrial ecosystems.

4. Discussion

4.1. The Choice of the BEPS Model

This study used the results of the BEPS model to analyze global NEP IAV and its regional and climate attributions. This choice is because the BEPS model has been demonstrated as a reliable model to simulate the global carbon sink in the past [20]. The BEPS model had been compared with TRENDY models [1] and it had been suggested that land sinks simulated by the BEPS model are close to the global residual land sink [20]. Therefore, they concluded that the BEPS could perform better than the TRENDY models in simulating the global carbon sink in the past [20]. Furthermore, the light-use efficiency (LUE) models estimate photosynthesis based on prescribed LUE functions [19]. Compared to the LUE models, the BEPS model also simulates the dynamics of carbon pools beyond GPP and uses a spin-up procedure to prescribe soil carbon pools for simulating heterotrophic respiration and autotrophic respiration [29]. These characteristics make the BEPS model more suitable than LUE models for analyzing the global carbon sink and its regional and climate attributions. Therefore, when detecting the relative contribution of multiple variables, the BEPS model could be a good choice.

4.2. Forests Contributed Most to the Global NEP IAV

Our estimated NEP showed an increasing trend from 1982 to 2016, which was also illustrated by previous studies [9,30]. Large interannual variability was found from 1982 to 2016, with the largest negative NEP anomaly being −2.32 Pg C in 1998 when the Northern Hemisphere suffered a widespread drought [31]. Furthermore, the largest positive NEP occurred in 2013, with a NEP anomaly of 1.62 Pg C when the climate condition was suitable for plant growth [28].
Our study also indicated that forests have larger NEP IAV than other vegetation types. This finding is consistent with the results that NEP IAV can be mainly attributed to ecosystems with larger productivity [2], and the global terrestrial carbon sink is mainly controlled by highly productive lands [26,32]. The carbon cycle through Earth’s forests is about 69 Gt each year [33,34].
The study illustrated that the contribution to global NEP IAV decreased from the equator to the poles and the tropics region, and EBF especially plays a vital role in regulating the global NEP IAV. The finding agrees with the previous finding that tropical forests dominate the variability of land carbon uptake [16,35]. The tropics are the dominant term in the exchange of CO2 between the land and the atmosphere, and tropical forests account for 70% of the gross carbon sink in world forests on average [36]. This result emphasizes the important role of the tropics, especially EBF, in regulating the magnitude of the global carbon sink and playing a dominant role in the global NEP IAV. Therefore, preserving tropical ecosystems should be a global priority to mitigate anthropogenic CO2 emissions [37]. This suggests that more action should be taken with tropical forests, especially EBF conservation, for climate mitigation in the future.

4.3. Temperature Played a Vital Role in Regulating the Global NEP IAV

Temperature, precipitation, and solar radiation have been reported as the most important climate factors in regulating the IAV of the carbon cycle in the different ecosystems [11,38]. Water availability and temperature are strong drivers of photosynthesis and ecosystem respiration of global terrestrial ecosystems [39,40]. In this study, the climate attribution result indicated that temperature contributed more than precipitation and solar radiation, consistent with temporal NEE variability being mainly driven by temperature fluctuations [11].
In this study, we used the partial correlation method to analyze the correlations between NEP and one of the three climate variables (TAVG, PRCP, and RAD) while avoiding the influence of the other two variables [28]. The partial correlation showed that temperature played a negative role in the global IAV of NEP, indicating that increased temperature has a negative influence on NEP increasing. This finding is also consistent with the sensitivities of NEP to temperature being −0.9 ± 0.4 Pg C °C−1 and a greater stimulation of Re than photosynthesis by higher temperatures [10]. This is mainly because increasing temperatures can also induce heatwaves and drier conditions, which may decrease GPP and increase Re [41]. The observed positive correlation between mean tropical land temperature and CO2 growth rate implies smaller land carbon uptake and enhanced atmospheric CO2 growth during warmer years [37]. In the tropical region, the increasing temperature may result in GPP decreases, mainly due to the photosynthesis thermal optimum exceeding, whereas Re increases with temperature. Thus, increasing temperatures in the tropics decrease NEP by reducing GPP and increasing Re.
Our analysis shows that the contributions of the precipitation were smaller than temperature but played significant positive roles in the carbon sink in some areas of the globe. These findings are also consistent with previous studies, which have shown that the IAV of NPP or NEP exhibits a positive correlation with temporal variability in precipitation in monsoon areas such as China [42], India [43], and Australia [44]. This finding agrees with the understanding that carbon uptake could be mostly regulated by water availability, since the temperature is not a limiting factor [45]. This finding is also consistent with studies that emphasize the role of water-limited ecosystems on the global IAV of NEP [46].

4.4. Uncertainties Analysis

In this study, we only used the BEPS model to conduct the analysis. Although many studies have demonstrated the satisfactory performance of the BEPS model in simulating the global carbon sink, the model still results in some uncertainties due to some parameters and imperfect model structure. Besides, we only consider the climate attributions to NEP IAV. However, other environmental factors such as atmospheric CO2 concentration and nitrogen deposition also influence the IAV of NEP globally. The rising CO2 concentration can promote plant photosynthesis by accelerating the carboxylation rate over recent decades [47,48]. The enhanced nitrogen deposition significantly increased plant foliar N concentration, which can stimulate photosynthesis rate and promote the uptake of atmospheric CO2 [49]. Moreover, some disturbances can also influence the regional contributions to the global NEP IAV. For example, agricultural activities (e.g., fertilization and irrigation) could significantly impact carbon pool and carbon uptake by fertilization and irrigation [50]. Land-use change can also alter the ecosystem’s carbon sink [51]. However, the influence of the land-use change on carbon uptake is minor [28]. In addition, some disturbances, such as fires and insect outbreaks, can rapidly cause severe damage to regional ecosystems and plant productivity [52], which may also cause some uncertainties.

5. Conclusions

This study used a diagnostic model, BEPS, to simulate global NEP during 1982–2016, and combined climate data and contribution index to explore the regional contribution and the role of climate variables in regulating the NEP IAV of the global terrestrial ecosystem. We found that forests have the largest IAV compared to other vegetation types on a global scale. Furthermore, the EBF contributed the most to global NEP IAV, suggesting EBF not only plays a vital role in the global carbon sink but also plays a critical role in regulating global NEP IAV. In addition, this study indicated that the contributions of temperature to the global terrestrial NEP IAV were larger than precipitation and solar radiation. However, the correlation between NEP and temperature was negative, and the correlation with precipitation was positive, indicating that global warming is not conducive to forming a global carbon sink, and abundant rainfall could facilitate the formation of a carbon sink in global terrestrial ecosystems. Therefore, we suggest that we need to pay more attention to the tropics, especially EBF, and focus on temperature and precipitation anomalies in projecting global carbon cycle feedback on future climate change.

Author Contributions

Conceptualization, M.W. and J.Z.; methodology, S.W.; validation, B.C.; formal analysis, M.W.; resources, S.W.; data curation, B.C.; writing—original draft preparation, M.W.; writing—review and editing, J.Z. and S.W.; supervision, J.Z.; project administration, J.Z.; funding acquisition, S.W. All authors have read and agreed to the published version of the manuscript.

Funding

This research was funded by Collaborative Innovation Project of High-Quality Development of Agriculture in Fujian Province, grant number XTCXGC2021015 and XTCXGC2021021, Natural Science Foundation of Fujian Province, grant number 2021J01502, and Fujian Intelligent Agricultural Science and Technology Innovation Team (CXTD2021013-1).

Data Availability Statement

Not applicable.

Acknowledgments

We greatly appreciate Weimin Ju of Nanjing University for providing the monthly global NEP datasets.

Conflicts of Interest

The authors declare no conflict of interest.

References

  1. Le Quéré, C.; Andrew, R.M.; Friedlingstein, P.; Sitch, S.; Pongratz, J.; Manning, A.C.; Korsbakken, J.I.; Peters, G.P.; Canadell, J.G.; Jackson, R.B.; et al. Global Carbon Budget 2017. Earth Syst. Sci. Data 2018, 10, 405–448. [Google Scholar] [CrossRef] [Green Version]
  2. Zhang, L.; Ren, X.; Wang, J.; He, H.; Wang, S.; Wang, M.; Piao, S.; Yan, H.; Ju, W.; Gu, F. Interannual variability of terrestrial net ecosystem productivity over China: Regional contributions and climate attribution. Environ. Res. Lett. 2019, 14, 014003. [Google Scholar] [CrossRef]
  3. Fatichi, S.; Pappas, C.; Zscheischler, J.; Leuzinger, S. Modelling carbon sources and sinks in terrestrial vegetation. New Phytol. 2018, 221, 652–668. [Google Scholar] [CrossRef] [PubMed] [Green Version]
  4. Musavi, T.; Migliavacca, M.; Reichstein, M.; Kattge, J.; Wirth, C.; Black, T.A.; Janssens, I.; Knohl, A.; Loustau, D.; Roupsard, O.; et al. Stand age and species richness dampen interannual variation of ecosystem-level photosynthetic capacity. Nat. Ecol. Evol. 2017, 1, 48. [Google Scholar] [CrossRef] [Green Version]
  5. Niu, X.; Wang, S.; Tang, J.; Lee, D.-K.; Gutowski, W.; Dairaku, K.; McGregor, J.; Katzfey, J.; Gao, X.; Wu, J.; et al. Ensemble evaluation and projection of climate extremes in China using RMIP models. Int. J. Clim. 2017, 38, 2039–2055. [Google Scholar] [CrossRef]
  6. Li, H.; Wu, Y.; Chen, J.; Zhao, F.; Wang, F.; Sun, Y.; Zhang, G.; Qiu, L. Responses of soil organic carbon to climate change in the Qilian Mountains and its future projection. J. Hydrol. 2021, 596, 126110. [Google Scholar] [CrossRef]
  7. Rollinson, C.R.; Liu, Y.; Raiho, A.; Moore, D.J.P.; McLachlan, J.; Bishop, D.A.; Dye, A.; Matthes, J.H.; Hessl, A.; Hickler, T.; et al. Emergent climate and CO2 sensitivities of net primary productivity in ecosystem models do not agree with empirical data in temperate forests of eastern North America. Glob. Change Biol. 2017, 23, 2755–2767. [Google Scholar] [CrossRef] [PubMed] [Green Version]
  8. Wang, J.; Feng, L.; Palmer, P.I.; Liu, Y.; Fang, S.; Bösch, H.; O’Dell, C.W.; Tang, X.; Yang, D.; Liu, L.; et al. Large Chinese land carbon sink estimated from atmospheric carbon dioxide data. Nature 2020, 586, 720–723. [Google Scholar] [CrossRef]
  9. Ballantyne, A.; Smith, W.; Anderegg, W.; Kauppi, P.; Sarmiento, J.; Tans, P.; Shevliakova, E.; Pan, Y.; Poulter, B.; Anav, A.; et al. Accelerating net terrestrial carbon uptake during the warming hiatus due to reduced respiration. Nat. Clim. Change 2017, 7, 148–152. [Google Scholar] [CrossRef]
  10. He, H.; Wang, S.; Zhang, L.; Wang, J.; Ren, X.; Zhou, L.; Piao, S.; Yan, H.; Junbang, W.; Gu, F.; et al. Altered trends in carbon uptake in China’s terrestrial ecosystems under the enhanced summer monsoon and warming hiatus. Natl. Sci. Rev. 2019, 6, 505–514. [Google Scholar] [CrossRef] [Green Version]
  11. Jung, M.; Reichstein, M.; Schwalm, C.; Huntingford, C.; Sitch, S.; Ahlström, A.; Arneth, A.; Camps-Valls, G.; Ciais, P.; Friedlingstein, P.; et al. Compensatory water effects link yearly global land CO2 sink changes to temperature. Nature 2017, 541, 516–520. [Google Scholar] [CrossRef] [PubMed] [Green Version]
  12. Yao, Y.; Wang, X.; Li, Y.; Wang, T.; Shen, M.; Du, M.; He, H.; Li, Y.; Luo, W.; Ma, M.; et al. Spatiotemporal pattern of gross primary productivity and its covariation with climate in China over the last thirty years. Glob. Change Biol. 2017, 24, 184–196. [Google Scholar] [CrossRef] [PubMed]
  13. Piao, S.; Friedlingstein, P.; Ciais, P.; Viovy, N.; Demarty, J. Growing season extension and its impact on terrestrial carbon cycle in the Northern Hemisphere over the past 2 decades. Glob. Biogeochem. Cycles 2007, 21, 1–11. [Google Scholar] [CrossRef]
  14. Zhao, M.; Running, S.W. Drought-Induced Reduction in Global Terrestrial Net Primary Production from 2000 Through 2009. Science 2010, 329, 940–943. [Google Scholar] [CrossRef] [Green Version]
  15. Green, J.K.; Seneviratne, S.I.; Berg, A.M.; Findell, K.L.; Hagemann, S.; Lawrence, D.M.; Gentine, P. Large influence of soil moisture on long-term terrestrial carbon uptake. Nature 2019, 565, 476–479. [Google Scholar] [CrossRef]
  16. Zhang, X.; Wang, Y.; Peng, S.; Rayner, P.J.; Ciais, P.; Silver, J.D.; Piao, S.; Zhu, Z.; Lu, X.; Zheng, X. Dominant regions and drivers of the variability of the global land carbon sink across timescales. Glob. Change Biol. 2018, 24, 3954–3968. [Google Scholar] [CrossRef]
  17. Shiga, Y.P.; Michalak, A.M.; Fang, Y.; Schaefer, K.; Andrews, E.A.; Huntzinger, D.H.; Schwalm, C.R.; Thoning, K.; Wei, Y. Forests dominate the interannual variability of the North American carbon sink. Environ. Res. Lett. 2018, 13, 084015. [Google Scholar] [CrossRef]
  18. Wang, M.; Chen, J.M.; Wang, S. Reconstructing the Seasonality and Trend in Global Leaf Area Index During 2001–2017 for Prognostic Modeling. J. Geophys. Res. Biogeosci. 2020, 125. [Google Scholar] [CrossRef]
  19. Smith, W.; Reed, S.; Cleveland, C.C.; Ballantyne, A.P.; Anderegg, W.R.L.; Wieder, W.; Liu, Y.Y.; Running, S.W. Large divergence of satellite and Earth system model estimates of global terrestrial CO2 fertilization. Nat. Clim. Change 2015, 6, 306–310. [Google Scholar] [CrossRef]
  20. Chen, J.M.; Ju, W.; Ciais, P.; Viovy, N.; Liu, R.; Liu, Y.; Lu, X. Vegetation structural change since 1981 significantly enhanced the terrestrial carbon sink. Nat. Commun. 2019, 10, 4259. [Google Scholar] [CrossRef]
  21. Liu, J.; Chen, J.M.; Cihlar, J.; Park, W.M. A process-based boreal ecosystem productivity simulator using remote sensing inputs. Remote. Sens. Environ. 1997, 62, 158–175. [Google Scholar] [CrossRef]
  22. Chen, J.M.; Mo, G.; Pisek, J.; Liu, J.; Deng, F.; Ishizawa, M.; Chan, D. Effects of foliage clumping on the estimation of global terrestrial gross primary productivity. Glob. Biogeochem. Cycles 2012, 26. [Google Scholar] [CrossRef]
  23. Farquhar, G.D.; Caemmerer, S.V.; Berry, J.A. A Biochemical-Model of Photosynthetic CO2 Assimilation in Leaves of C-3 Spe-cies. Planta 1980, 149, 78–90. [Google Scholar] [CrossRef] [PubMed] [Green Version]
  24. Parton, W.J.; Scurlock, J.M.O.; Ojima, D.S.; Gilmanov, T.G.; Scholes, R.J.; Schimel, D.S.; Kirchner, T.; Menaut, J.-C.; Seastedt, T.; Garcia-Moya, E.; et al. Observations and modeling of biomass and soil organic matter dynamics for the grassland biome worldwide. Glob. Biogeochem. Cycles 1993, 7, 785–809. [Google Scholar] [CrossRef] [Green Version]
  25. Rienecker, M.M.; Suarez, M.J.; Gelaro, R.; Todling, R.; Bacmeister, J.; Liu, E.; Bosilovich, M.G.; Schubert, S.D.; Takacs, L.; Kim, G.-K.; et al. MERRA: NASA’s Modern-Era Retrospective Analysis for Research and Applications. J. Clim. 2011, 24, 3624–3648. [Google Scholar] [CrossRef]
  26. Ahlström, A.; Raupach, M.R.; Schurgers, G.; Smith, B.; Arneth, A.; Jung, M.; Reichstein, M.; Canadell, J.G.; Friedlingstein, P.; Jain, A.K.; et al. The dominant role of semi-arid ecosystems in the trend and variability of the land CO2 sink. Science 2015, 348, 895–899. [Google Scholar] [CrossRef] [Green Version]
  27. Piao, S.; Sitch, S.; Ciais, P.; Friedlingstein, P.; Peylin, P.; Wang, X.; Ahlström, A.; Anav, A.; Canadell, J.G.; Cong, N.; et al. Evaluation of terrestrial carbon cycle models for their response to climate variability and to CO2 trends. Glob. Change Biol. 2013, 19, 2117–2132. [Google Scholar] [CrossRef] [Green Version]
  28. Wang, M.; Wang, S.; Wang, J.; Yan, H.; Mickler, R.A.; Shi, H.; He, H.; Huang, M.; Zhou, L. Detection of Positive Gross Primary Production Extremes in Terrestrial Ecosystems of China During 1982-2015 and Analysis of Climate Contribution. J. Geophys. Res. Biogeosci. 2018, 123, 2807–2823. [Google Scholar] [CrossRef]
  29. Wang, M.; Wang, S.; Zhao, J.; Ju, W.; Hao, Z. Global positive gross primary productivity extremes and climate contributions during 1982–2016. Sci. Total Environ. 2021, 774, 145703. [Google Scholar] [CrossRef]
  30. Keenan, T.F.; Prentice, I.C.; Canadell, J.; Williams, C.A.; Wang, H.; Raupach, M.; Collatz, G.J. Recent pause in the growth rate of atmospheric CO2 due to enhanced terrestrial carbon uptake. Nat. Commun. 2016, 7, 13428. [Google Scholar] [CrossRef] [Green Version]
  31. Zeng, N.; Mariotti, A.; Wetzel, P. Terrestrial mechanisms of interannual CO2 variability. Glob. Biogeochem. Cycles 2005, 19, 1–23. [Google Scholar] [CrossRef]
  32. Fan, L.; Wigneron, J.-P.; Ciais, P.; Chave, J.; Brandt, M.; Fensholt, R.; Saatchi, S.S.; Bastos, A.; Al-Yaari, A.; Hufkens, K.; et al. Satellite-observed pantropical carbon dynamics. Nat. Plants 2019, 5, 944–951. [Google Scholar] [CrossRef] [PubMed]
  33. Badgley, G.; Anderegg, L.D.; Berry, J.A.; Field, C.B. Terrestrial gross primary production: Using NIRV to scale from site to globe. Glob. Change Biol. 2019, 25, 3731–3740. [Google Scholar] [CrossRef] [PubMed]
  34. Morgan, R.B.; Herrmann, V.; Kunert, N.; Bond-Lamberty, B.; Muller-Landau, H.C.; Anderson-Teixeira, K.J. Global patterns of forest autotrophic carbon fluxes. Glob. Change Biol. 2021, 27, 2840–2855. [Google Scholar] [CrossRef]
  35. Liu, X.; Chen, X.; Li, R.; Long, F.; Zhang, L.; Zhang, Q.; Li, J. Water-use efficiency of an old-growth forest in lower subtropical China. Sci. Rep. 2017, 7, 42761. [Google Scholar] [CrossRef] [Green Version]
  36. Pan, Y.; Birdsey, R.A.; Fang, J.; Houghton, R.; Kauppi, P.E.; Kurz, W.A.; Phillips, O.L.; Shvidenko, A.; Lewis, S.L.; Canadell, J.G.; et al. A Large and Persistent Carbon Sink in the World’s Forests. Science 2011, 333, 988–993. [Google Scholar] [CrossRef] [Green Version]
  37. Fernández-Martínez, M.; Sardans, J.; Chevallier, F.; Ciais, P.; Obersteiner, M.; Vicca, S.; Canadell, J.G.; Bastos, A.; Friedlingstein, P.; Sitch, S.; et al. Global trends in carbon sinks and their relationships with CO2 and temperature. Nat. Clim. Change 2018, 9, 73–79. [Google Scholar] [CrossRef] [Green Version]
  38. Fu, Z.; Stoy, P.C.; Poulter, B.; Gerken, T.; Zhang, Z.; Wakbulcho, G.; Niu, S. Maximum carbon uptake rate dominates the interannual variability of global net ecosystem exchange. Glob. Change Biol. 2019, 25, 3381–3394. [Google Scholar] [CrossRef] [Green Version]
  39. Beer, C.; Reichstein, M.; Tomelleri, E.; Ciais, P.; Jung, M.; Carvalhais, N.; Rödenbeck, C.; Arain, M.A.; Baldocchi, D.; Bonan, G.B.; et al. Terrestrial gross carbon dioxide uptake: Global distribution and covariation with climate. Science 2010, 329, 834–838. [Google Scholar] [CrossRef] [Green Version]
  40. Fernandez-Martinez, M.; Vicca, S.; Janssens, I.A.; Sardans, J.; Luyssaert, S.; Campioli, M.; Chapin, F.S., III; Ciais, P.; Malhi, Y.; Obersteiner, M.; et al. Nutrient availability as the key regulator of global forest carbon balance. Nat. Clim. Change 2014, 4, 471–476. [Google Scholar] [CrossRef] [Green Version]
  41. Wu, Z.; Dijkstra, P.; Koch, G.W.; Peñuelas, J.; Hungate, B.A. Responses of terrestrial ecosystems to temperature and precipitation change: A meta-analysis of experimental manipulation. Glob. Change Biol. 2011, 17, 927–942. [Google Scholar] [CrossRef] [Green Version]
  42. Fang, J.; Piao, S.; Tang, Z.; Peng, C.; Ji, W. Interannual Variability in Net Primary Production and Precipitation. Science 2001, 293, 1723. [Google Scholar] [CrossRef] [PubMed] [Green Version]
  43. Nayak, R.K.; Patel, N.R.; Dadhwal, V.K. Inter-annual variability and climate control of terrestrial net primary productivity over India. Int. J. Clim. 2012, 33, 132–142. [Google Scholar] [CrossRef]
  44. Trudinger, C.M.; Haverd, V.; Briggs, P.R.; Canadell, J.G. Interannual variability in Australia’s terrestrial carbon cycle constrained by multiple observation types. Biogeosciences 2016, 13, 6363–6383. [Google Scholar] [CrossRef] [Green Version]
  45. Fung, E.; Imbach, P.; Corrales, L.; Vilchez, S.; Zamora, N.; Argotty, F.; Hannah, L.; Ramos, Z. Mapping conservation priorities and connectivity pathways under climate change for tropical ecosystems. Clim. Change 2016, 141, 77–92. [Google Scholar] [CrossRef]
  46. Poulter, B.; Frank, D.; Ciais, P.; Myneni, R.B.; Andela, N.; Bi, J.; Broquet, G.; Canadell, J.G.; Chevallier, F.; Liu, Y.Y.; et al. Contribution of semi-arid ecosystems to interannual variability of the global carbon cycle. Nature 2014, 509, 600–603. [Google Scholar] [CrossRef] [Green Version]
  47. Friend, A.D.; Lucht, W.; Rademacher, T.T.; Keribin, R.; Betts, R.; Cadule, P.; Ciais, P.; Clark, D.B.; Dankers, R.; Falloon, P.D.; et al. Carbon residence time dominates uncertainty in terrestrial vegetation responses to future climate and atmospheric CO2. Proc. Natl. Acad. Sci. USA 2014, 111, 3280–3285. [Google Scholar] [CrossRef] [Green Version]
  48. Piao, S.; Wang, X.; Park, T.; Chen, C.; Lian, X.; He, Y.; Bjerke, J.; Chen, A.; Ciais, P.; Tømmervik, H.; et al. Characteristics, drivers and feedbacks of global greening. Nat. Rev. Earth Environ. 2019, 1, 14–27. [Google Scholar] [CrossRef]
  49. Liu, G.; Liu, H.; Yin, Y. Global patterns of NDVI-indicated vegetation extremes and their sensitivity to climate extremes. Environ. Res. Lett. 2013, 8, 025009. [Google Scholar] [CrossRef] [Green Version]
  50. Huang, K.; Xia, J.; Wang, Y.; Ahlström, A.; Chen, J.; Cook, R.B.; Cui, E.; Fang, Y.; Fisher, J.B.; Huntzinger, D.N.; et al. Enhanced peak growth of global vegetation and its key mechanisms. Nat. Ecol. Evol. 2018, 2, 1897–1905. [Google Scholar] [CrossRef]
  51. Xiao, J. Satellite evidence for significant biophysical consequences of the “Grain for Green” Program on the Loess Plateau in China. J. Geophys. Res. Biogeosci. 2014, 119, 2261–2275. [Google Scholar] [CrossRef] [Green Version]
  52. Lu, W.; Xiao, J.; Cui, X.; Xu, F.; Lin, G.; Lin, G. Insect outbreaks have transient effects on carbon fluxes and vegetative growth but longer-term impacts on reproductive growth in a mangrove forest. Agric. For. Meteorol. 2019, 279, 107747. [Google Scholar] [CrossRef]
Figure 1. The spatial pattern of the global land cover map.
Remotesensing 14 03208 g001
Figure 2. The flowchart of the study.
Remotesensing 14 03208 g002
Figure 3. (a) Time series of NEP and NEP detrended anomalies, (b) the spatial distribution of annual mean NEP during 1982–2016.
Remotesensing 14 03208 g003
Figure 4. The spatial pattern of (a) the mean absolute NEP difference and (b) counted by different vegetation types during the study period.
Remotesensing 14 03208 g004
Figure 5. The spatial patterns of contribution to NEP IAV.
Remotesensing 14 03208 g005
Figure 6. Contribution to global NEP IAV counted by (a) latitudes and (b) different vegetation types. Positive latitudes represent the Northern Hemisphere and negative latitudes represent the Southern Hemisphere.
Remotesensing 14 03208 g006
Figure 7. The spatial pattern of the contribution to IAV NEP in different seasons.
Remotesensing 14 03208 g007
Figure 8. Seasonal contributions to global IAV of NEP.
Remotesensing 14 03208 g008
Figure 9. The contributions of (a) temperature, (b) precipitation, and (c) solar radiation to global IAV of NEP.
Remotesensing 14 03208 g009
Figure 10. The contributions of climate variables to IAV of NEP in (a) annual and (b) seasonal timescales.
Remotesensing 14 03208 g010
Figure 11. The partial correlation between anomalies of detrended NEP and TAVG, PRCP, and RAD in (ac) MAM, (df) JJA, (gi) SON, and (jl) DJF. Shown are significant correlation regions (p < 0.01).
Remotesensing 14 03208 g011
Publisher’s Note: MDPI stays neutral with regard to jurisdictional claims in published maps and institutional affiliations.

