Abstract
This paper describes the initial results of precipitation estimates from the Time-Resolved Observations of Precipitation structure and storm Intensity with a Constellation of Smallsats (TROPICS) Millimeter-wave Sounder (TMS) using the Precipitation Retrieval and Profiling Scheme (PRPS). The TROPICS mission consists of a Pathfinder CubeSat and a constellation of six CubeSats, providing a low-cost solution to the frequent sampling of precipitation systems across the Tropics. The TMS instrument is a 12-channel cross-track scanning radiometer operating at frequencies of 91.655 to 204.8 GHz, providing similar resolutions to current passive microwave sounding instruments. These retrievals showcase the potential of the TMS instrument for precipitation retrievals. The PRPS has been modified for use with the TMS using a database based upon observations from current sounding sensors. The results shown here represent the initial postlaunch version of the retrieval scheme, as analyzed for the Pathfinder CubeSat launched on 30 June 2021. In terms of monthly precipitation estimates, the results fall within the mission specifications and are similar in performance to retrievals from other sounding instruments. At the instantaneous scale, the results are very promising.
1. Introduction
The retrieval of precipitation from satellite-based sensors relies primarily upon visible, infrared (IR), passive, and active microwave instrumentation. Visible and IR techniques are capable of providing estimates of precipitation at relatively fine temporal and spatial scales from geostationary (GEO) and low Earth orbiting (LEO) platforms, but such estimates are indirect since they depend upon relationships between the cloud-top characteristics and precipitation at the surface [1]. Passive microwave (PMW) observations are more direct since hydrometeors are the main source of atmospheric attenuation and scattering [2]. However, since PMW sensors only occupy LEOs, multiple sensors are required to provide sufficient temporal and spatial coverage of the globe. While the active microwave instruments undoubtedly provide the most direct measure of satellite-based precipitation, such spaceborne observations are currently confined to the Global Precipitation Measurement (GPM) mission’s Dual-frequency Precipitation Radar (DPR) [3] and the CloudSat Cloud Profiling Radar (CPR) [4,5], and therefore provide limited observations in time and space.
While much work has been done on the extraction of precipitation information from PMW imaging sensors, less work has been concentrated upon retrievals from PMW sounding instruments [6,7]. The imaging sensors rely upon the window channels within the microwave section of the spectrum and are typically conically scanning systems, while the latter concentrate primarily upon the microwave absorption bands and are generally cross-track sensors. The inclusion of cross-track sounding instruments is critical for precipitation estimation since they provide additional observations to meet the necessary sampling requirements for precipitation measurements [8,9]. Furthermore, they provide sensors that can be operated on smaller satellite platforms, which reduces mission costs. The latter have been demonstrated on a number of missions, the latest of which, the Time-Resolved Observations of Precipitation structure and storm Intensity with a Constellation of Smallsats (TROPICS) [10], provides observations from a sensor onboard a 3U CubeSat.
This paper outlines the TROPICS mission together with a description of the retrieval scheme for the TROPICS Millimeter-wave Sounder (TMS). Initial results of the at-launch retrieval scheme are presented together with validation of these against the Integrated Multi-satellitE Retrievals for GPM (IMERG) global precipitation product [11] and the Multi-Radar/Multi-sensor System (MRMS) [12] surface precipitation over the US.
2. The TROPICS Mission
2.1. The TROPICS CubeSats
The TROPICS mission aims to provide rapid-refresh PMW measurements over the Tropics that can be used to observe the thermodynamics of the troposphere and precipitation structure for storm systems at the mesoscale and synoptic scale over the entire storm lifecycle [10]. TROPICS comprises an initial Pathfinder CubeSat (as illustrated in Figure 1) in a polar orbit launched on 30 June 2021 that will be followed by a constellation of six CubeSats in three low-inclination low Earth orbits in mid-2022. The configuration of this constellation will provide a median revisit time of about 50 min.
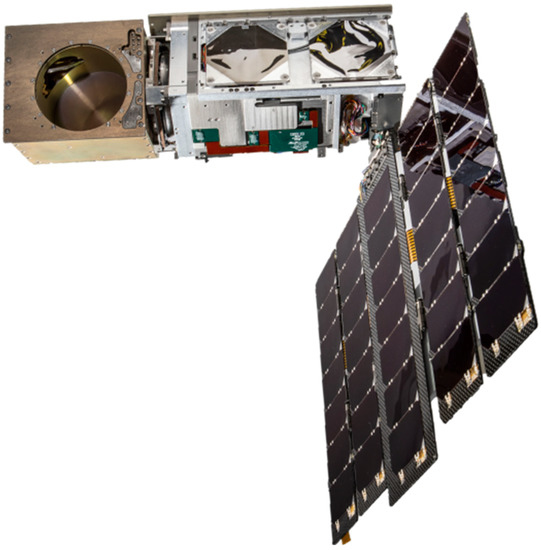
Figure 1.
TROPICS CubeSat showing the spacecraft bus, radiometer (on the left), and deployed articulated solar array.
This observing system offers an unprecedented temporal resolution to measure the atmospheric environment and inner-core conditions of tropical cyclones over the entire Tropics and represents a profound leap forward in the temporal resolution of several key parameters needed for a detailed study of high-impact meteorological events. TROPICS will demonstrate that a CubeSat constellation approach to Earth science can serve as a model for future missions by providing improved resolution, configurable coverage (Tropics, near global, or global), flexibility, reliability, and launch access at a low cost [10].
2.2. The TROPICS Millimeter-Wave Sounder (TMS)
The TMS provides observations across a 2200 km swath (distance between the center points of the first and last footprints) with a symmetrical scan pattern (i.e., equal number of field of views (FOVs) each side of nadir) with each scan line providing 81 scan positions, with about 2860 scan lines per orbit. The radiometer provides integrated field of views with elongated footprints in the cross-track direction: the quoted spatial resolution is the geometric mean of the minor and major axes of the ellipse projected on the Earth (and also accounting for Earth curvature). Being a cross-track sensor, the finest resolution is at nadir at about 17 km for the 183–204.8 GHz channels, and 27 km for the 91.55–118 GHz channels. The instrument observes the Earth and atmosphere with channels primarily around the 118 GHz oxygen and 183.31 GHz water vapor bands, together with two channels at 91.655 and 204.8 GHz. Frequencies around 91.655 and 183.31 GHz have a good history of being utilized for precipitation retrievals, responding to liquid water (91.655 GHz) and the scattering of upwelling radiation by the ice particles within precipitating weather systems [6]. The addition of the 204.8 GHz extends this capability by improving the identification and classification of ice particles. While the 114–118 GHz (oxygen) channels relate primarily to temperature profiles of the atmosphere, these too can be potentially used for precipitation retrievals [13] and may allow the delineation of liquid/frozen precipitation.
Table 1 below shows the channel characteristics together with similar channels from other PMW sensors: the TMS shares common channels around 89 and 183.31 GHz with the Advanced Technology Microwave Sounder (ATMS), the Microwave Humidity Sounder (MHS), and the GPM Microwave Imager (GMI), while the Microwave Humidity Sounder-2 (MWHS-2) provides the greatest number of similar channels. The 204.8 GHz channel provides observations at a new, higher frequency than current PMW instruments.

Table 1.
TMS channel sets together with similar frequencies from current operational sensors (figures in italics indicate approximate matches). The TMS noise equivalent delta temperature (NE∆T) quoted is from on-orbit Pathfinder analysis. Note that while most sounding instruments provide measurements on either side of the center line of an absorption band, the TMS only provides a single-sided measurement (i.e., 183.31 ± 3.0 ≅ 183.31 + 3.0).
An example of the imagery that can be obtained from the TMS is shown in Figure 2, which shows an overpass of Hurricane Sam by the Pathfinder satellite on 27 September 2021 at 17:49 UTC. These observations show that scattering by hydrometeors is evident across all channels, as can be seen over the land areas of South America at the bottom of the set of images. Scattering over the oceans becomes more evident at the higher frequencies. Indeed, the range of scattering signals is particularly interesting at 184.41 through 204.80 GHz: the former indicates areas of high/deep hydrometeor concentrations, while the latter corresponds to the upper-level hydrometeor concentrations. Furthermore, the surface background becomes increasingly opaque at frequencies of 114.50 GHz to 118.58 GHz due to the effect of the O2 absorption bands. Clearly, there is information within the observations that are precipitation related: the key challenges are to identify the areas/extent of precipitation along with the intensity of the precipitation.
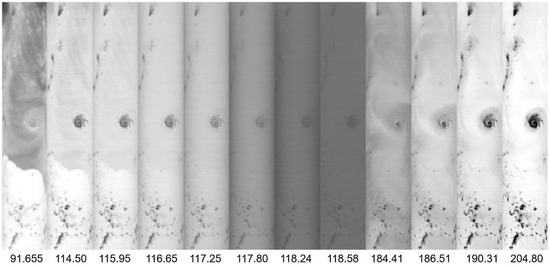
Figure 2.
Swath images of brightness temperatures (dark = cold, white = warm) for the 12 channels of the TROPICS sensor ranging from 91.655 (left) to 204.8 GHz (right) for Hurricane Sam on 27 September 2021. The time at the center of the image is 17:49 UTC with a location of about 16°N 52°W. Data are extracted from TROPICS01.BRTT.L1B.Orbit01352.V02-03.ST20210927-170942.ET20210927-184458.CT20220208-174340.nc.
2.3. Algorithm Considerations
The ability to retrieve precipitation from any sensor depends upon the range of channels available, the latter also determining the relationship between the observed brightness temperatures (Tbs) and surface precipitation. The most capable sensors provide observations over a large frequency range to address the range of precipitation characteristics and background surface types that might be observed. At the TMS frequencies (91.655–204.8 GHz), the observations relate primarily to ice particles, water vapor, and/or temperature profiles at the middle-to-upper levels of the atmosphere, rather than precipitation at the surface. The 183.31 GHz channels, while sensitive to emissions from water vapor in the cloudless atmospheric column, are also sensitive to the scattering of upwelling microwave radiation by ice particles in cloud and/or precipitation systems, the latter of which is exploited here to identify precipitation. The 114–118 GHz (O2) channels respond to atmospheric temperature profiles since these channels are sensitive to oxygen: these channels offer the prospect of being able to identify not only precipitation, but also potentially the phase of the precipitation near the surface [13]. The outlying channels at 91.655 and 204.8 GHz provide a good contrast between a common-used window channel and a high-frequency channel that is very sensitive to hydrometeor-sized ice particles. Nevertheless, it should be reiterated that the amount of scattering by ice identified at these frequencies is not necessarily directly related to surface precipitation. Furthermore, high amounts of water vapor in the atmospheric column above clouds or a precipitation layer may negate any precipitation-related Tb depression related to scattering. Despite this issue, precipitation retrievals are still feasible from these channels since surface precipitation rates and ice scattering signals are still strongly correlated in most convective systems.
3. Retrieval Scheme
The at-launch version of the TROPICS Precipitation Retrieval and Profiling Scheme (PRPS) utilized here is designed to provide a best estimate of precipitation based upon a priori Tb-to-precipitation relationships derived from other satellite sensors. It is anticipated that later versions will utilize matchups between the TMS observations and the GPM DPR to inform and improve these a priori relationships. This approach fulfills in part the role of GPM (and its predecessor, the Tropical Rainfall Measuring Mission, TRMM), in which the core observatory acts as a calibrator of precipitation retrievals for the international constellation of passive microwave instruments. In doing so, the retrievals from the partner constellation sensors are able to provide greater temporal sampling and spatial coverage than is possible from the GPM satellite alone. However, limitations of the core satellite instruments will be transferred through this retrieval scheme’s products. The availability of observations from the TROPICS Pathfinder mission is key to the further development and testing of the retrieval scheme prior to the launch of the TROPICS constellation in mid-2022.
3.1. Algorithm Overview
The PRPS is described in detail in [6,14]. A fundamental design of the PRPS is the independence from any dynamic ancillary datasets (e.g., atmospheric or surface temperature from model reanalysis and other satellite products); that is, the retrieval is based solely upon the satellite radiances linked to precipitation rates through a static a priori database and associated index file. This independence is advantageous when generating products across time scales from near real-time (inaccessibility to dynamic ancillary data, such as model data) to climatological scales (circumventing possible changes or trends in the ancillary data).
3.2. Input Data
Three data inputs are required for the PRPS:
- (i)
- An a priori database consisting of (a minimum of) Tb radiances and associated precipitation rates;
- (ii)
- A database index (defined below);
- (iii)
- Level 1 satellite observations (Tbs).
The prelaunch TROPICS PRPS database comprises an observation database based upon GPM DPR vs. ATMS matches by utilizing the four matching channels between the TMS and ATMS, as shown in Table 1.
3.2.1. Observational a Priori Database
The observational a priori databases used for the PRPS retrievals are derived from coincident observations made by the GPM DPR (or TRMM Precipitation Radar: RMSEPR) and each respective sensor. Since observations from TROPICS only became available after the launch of the Pathfinder satellite and are presently somewhat limited in number, an observational database has been generated using DPR–ATMS matchups, albeit using only the four corresponding channels, as shown in Table 1. To generate the database, the orbital tracks of the DPR and the ATMS are first analyzed to find crossing locations that occur within 5 min of each other. These crossing points are then used to find coincident DPR and ATMS measurements (see Kidd et al. [14]). The DPR observations are averaged over a 3 × 3 window, the center of which is coaligned with the ATMS footprint, thus providing a resolution of about 16.2 × 16.2 km (compared with 15.88 × 15.88 km best resolution of the ATMS at nadir and 17 × 17 km of the high-frequency channels of the TMS).
3.2.2. Database Index
To expedite the retrieval process in real time, the a priori databases are indexed based upon the two channels showing the greatest variance with each other. In this case, channels 1 and 9 (see Table 1) are used, although the channels are not necessarily critical since they are only used to provide a first guess. The index file describes the start and end point of the entries in the database array for a particular two-channel Tb combination, together with the number of entries for that combination. Accessing the relevant entries in the database is therefore merely looking up the starting entry [start(Tb1,Tb2)] and ending entry [end(Tb1,Tb2)]. To ensure that sufficient database entries are available for the retrieval, a search radius is set (within the Tb1-Tb2 space) to obtain a minimum of 10,000 database entries. This approach provides a computationally efficient retrieval scheme.
3.2.3. Level 1 Data
Key information from the level 1 sensor input data (see Leslie et al. [15]) includes: (i) date and time for each scan line (passed from the level 1 files directly to the level 2B output); (ii) geolocation (lat/lon) data; (iii) level 1 Tb data used in the generation of the retrieval; (iv) the “line-of-sight earth intersection longitude”; and (v) the level 1 quality flag, used to determine whether the data are within acceptable limits, with periods of solar/lunar intrusion, active maneuver, and hot/cold calibrations being excluded.
3.3. Processing Outline
The processing stages are relatively straightforward and follow a sequential order of quality check, precipitation retrieval, error estimation, and the generation of the “fit” of the retrieval.
3.3.1. Quality Check
All output data, including the quality check array, are set to “missing value” by default. If a scan/position exists, then it is assumed that the retrieval is potentially good, and the quality flag is set to zero. Tests are then undertaken to check that the input Tbs for each channel lie between 75 and 325 K; if one or more channel Tb lies outside of this range, this is reflected in the retrieval quality flag, thus indicating that an issue has been detected. The geolocation data are also checked along with the nadir viewing angle, the latter indicative of any spacecraft maneuvers. Finally, the level 1 quality flags are checked, and if relevant bits are set, then the level 2 flag reflects the quality flag status.
3.3.2. Precipitation Retrieval
The database index file is initially interrogated to establish the start and end positions within the database, together with the search radius associated with a particular two-channel Tb combination. Each database entry within the specified range is compared with the observed Tbs and the Euclidian distance calculated in Tb space. The six closest database entries (together with the associated DPR precipitation rate) are selected from the database. When the database search has finished, the six rain rates are then processed to generate the mean rain rate, together with measures of “error” and “fit”. The “error” is the root mean squared error (RMSE) of the six selected rain rates; thus, if all six of the entries are similar, then a low error estimate is generated, while if the entries are disparate, a large error estimate is generated. The measure of the fit is the RMSE of the observed Tbs–database Tbs to provide a measure of confidence in the representativeness of the retrieval. In addition, the most likely precipitation (the closest observation–database fit) is returned, along with its Euclidian distance and the associated surface type from the database.
3.3.3. Scan Position Correction
Since the TMS is a cross-track sensor, each scan position has different resolutions, atmospheric path lengths, and Earth incidence angles. With no correction, the retrieved values of precipitation will vary according to the scan position. Following the operational version of the PRPS retrieval scheme for Sondeur Atmospherique du Profil d’Humidite Intertropicale par Radiometrie (SAPHIR) [14], a similar correction methodology is applied to the TMS retrievals. Since the scan angle is included in both the database and the observations, only the database entries that have the same or similar scan angles to that of the observations are considered in the retrieval. This ensures that the characteristics of the resolution, incidence angle, and atmospheric path are passed through from the database to the retrieval. In addition, the algorithm is designed to generate instantaneous estimates of precipitation at a constant resolution regardless of scan position, an approach adopted in [16].
3.4. Output Data
The TROPICS precipitation product, therefore, includes the date and time, geolocation, retrieved precipitation, measures of error, and fit together with a quality flag. The dimensions of the output dataset are similar to that of the level 1 observational data, essentially about 2860 scan lines and 81 scan positions. A full description of the level 2B precipitation product can be found in Kidd and Matsui [17].
4. Precipitation Scheme Testing and Evaluation
4.1. Database Testing and Verification
The PRPS retrievals will ultimately rely upon a database based upon TMS–DPR observations. The at-launch and immediate postlaunch versions do not yet have sufficient coincident TMS–DPR observations to fully populate such a database; consequently, the current database for the PRPS–TMS is based upon four channels obtained from ATMS–DPR observations amounting to about 18 M entries. Nevertheless, at this stage, there are a reasonable number (1.6 M) of ocean-based TMS–DPR coincident matches that can be used to evaluate whether the ATMS-based database is suitable as a substitute. A comparison of the sensor–DPR rainfall relationships was investigated whereby the mean Tb per rainrate category was calculated for both the ATMS–DPR observations and the TMS–DPR observations for each of the corresponding channels. The plots of these relationships are shown in Figure 3. While a perfect match between the ATMS and TMS-based relationships would lie along the 1:1 line, the plots show that there is a very good agreement between the two different sensor–rainrate relationships and deemed to be high enough to provide a good degree of confidence in the retrieval scheme.
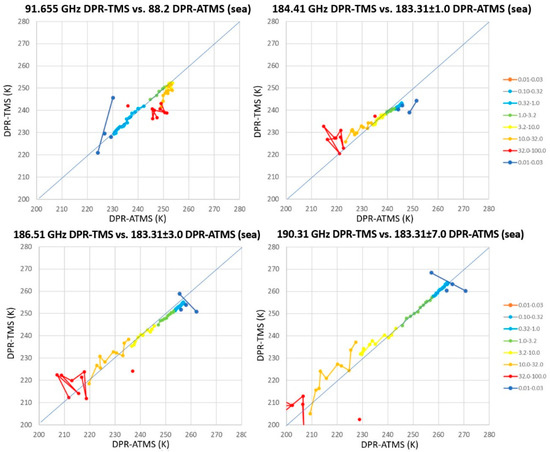
Figure 3.
Plots of Tb–rainrate relationships between the DPR–ATMS and the DPR–TMS with the colors representing the rainrate categories. Only ocean areas are shown due to the number of observations available from the TMS: a total of 1.6 M colocated DPR–TMS observations vs. 18 M DPR–ATMS observations were used.
4.2. Validation of Precipitation Retrievals
The requirements for the precipitation retrievals for the TROPICS mission is that the retrieved precipitation should be within 25% of the IMERG product at a spatial scale of 2.5 × 2.5 degrees and a temporal scale of 7 days. Analysis of the PRPS–TMS product has been carried out against the multisatellite IMERG precipitation product to evaluate whether this requirement has been met. Two 1-week time periods were selected that met the necessary level 1 data quality requirements, these being 8–14 August 2021 and 18–24 September 2021. A comparison is shown in Figure 4, which includes the IMERG product (top), the TMS product (middle), and the difference (bottom) for the first period (left) and the second period (right). The PRPS–TMS product captures the main precipitation features, although with some local–regional over-/underestimation, most likely due to the relatively limited temporal sampling provided by the single TROPICS Pathfinder sensor (14 samples), compared with the multisatellite IMERG product (336 samples). A more general underestimation is seen in the southern latitudes, most likely due to shallow precipitation that is often poorly identified in high-frequency PMW observations.
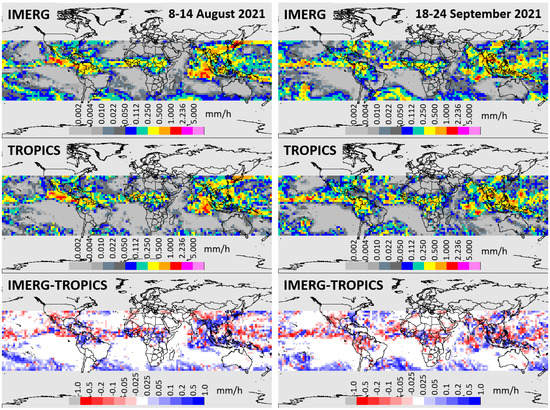
Figure 4.
Comparison of the IMERG product (top), the TMS product (middle), and the difference (bottom) for 8–14 August 2021 (left) and 18–23 September 2021 (right). Note that the IMERG product is the average of 33,630 min estimates, compared with a maximum of 14 instantaneous estimates from the TMS.
Scatterplots of IMERG vs. TMS mean precipitation intensity for these two periods are shown in Figure 5 and show that the points lie away from the x/y axes, with the overall scatter of points fairly well constrained. The thin solid blue lines define the 25% limits of the mission specification, with the thin dashed blue line showing the best-fit line through the data. While overall these cases show that the retrievals meet the required specifications, some of the data points lie outside the 25% specification: a total of 909 and 998 individual 2.5 × 2.5-degree values (out of a total of 4608) lie within ±25% for the August and the September cases, respectively. Although this appears poor, the GPROF–NOAA19 product result (which is ingested into the IMERG product) for the same period shows 1010 and 1065, respectively.
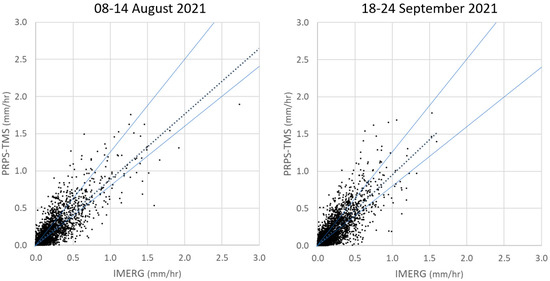
Figure 5.
The scatter plots showing the IMERG vs. PRPS–TMS mean precipitation intensity for the two 1-week periods. The outer solid blue lines define the ±25% limits, while the inner thin dashed lines show the best-fit line through the data.
For the same dates, a comparison of the PRPS–TMS retrievals was performed against retrievals from the NOAA-19 MHS observations generated by the Goddard profiling (GPROF) scheme since these have similar temporal and spatial samplings to the TROPICS Pathfinder. These results are shown in Table 2 and show that, overall, the PRPS–TMS has comparable performance to the GPROF scheme.
Table 2.
Statistical performance of the 2.5 × 2.5 degree. Seven-day precipitation totals from the PRPS–TROPICS vs. IMERG and the GPROF–NOAA19 vs. IMERG for the two time periods.
In terms of instantaneous precipitation, four case studies have been compared with the surface MRMS radar product [12] over the US and are shown in Figure 6. These cases cover a range of precipitation events, including (a) a frontal precipitation across SE US, (b) a Midwest convective system, (c) Hurricane Ida, and (d) mixed precipitation, including mountain snow. In all of these cases, the surface radar has been resampled to the resolution of the PRPS–TMS retrievals (ca. 16 × 16 km). Visually, the PRPS–TMS provides a good indication of precipitation extent and intensity, while the scatterplots and statistical performance (Figure 6, right) are similar to other instantaneous precipitation retrievals and show a reasonable performance, although variations between the different meteorological situations are evident. Given that this is an initial postlaunch version of the retrieval algorithm and is based only upon four channels, these results are encouraging.
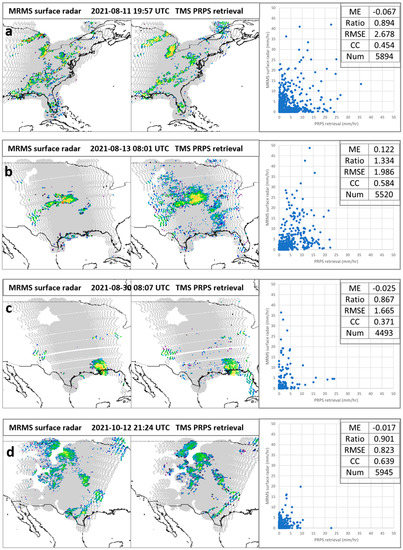
Figure 6.
Comparisons of instantaneous MRMS surface radar (left) vs. PRPS–TMS retrievals (right) over the US for four case studies: (a) Appalachian precipitation system, (b) Midwest connective system, (c) Hurricane Ida, and (d) Rocky Mountain mixed-phase precipitation. The scatterplots and statistics are for 15 × 15 km resolution MRMS/PRPS–TMS matches over the coverage of the images. (ME = mean error, CC = correlation coefficient).
5. Conclusions
The current version of the PRPS–TMS scheme will be the initial postlaunch version for the constellation. Consequently, it is expected that there will be issues with the accuracy of the final product, which will be addressed in future versions. At present, the O2 channels are not included in the precipitation retrievals, although it is anticipated that these channels will be included once sufficient observations from the TMS become available.
The PRPS technique, like any other technique, is based upon a number of assumptions leading to limitations in the final product. In particular, the rain rates in the current database are based on the DPR, and therefore, the PRPS product is intrinsically linked to the accuracy of the DPR. Further iterations of the PRPS database will evaluate the inclusion of surface and/or modelled precipitation with the aim of improving the overall accuracy of the retrievals. While one of the key criteria of the PRPS is to avoid the use of external dynamic datasets, external datasets may be considered in order to improve the accuracy of the product, particularly over certain regions; for example, since the SAPHIR instrument only provided observations at 183.31 GHz, model data were used to improve retrieval performance. Further investigations will be carried out to ascertain the value of incorporating additional information, such as model or even GEO-IR data, into the retrieval scheme.
Author Contributions
Conceptualization, C.K. and T.M.; methodology, C.K. and T.M.; software, C.K., T.M. and Z.G.; validation, C.K.; formal analysis, C.K. and T.M.; investigation, C.K. and T.M.; resources, C.K., T.M. and Z.G.; data curation, R.L. and Z.G.; writing—original draft preparation, C.K.; writing—review and editing, C.K., T.M., W.B., S.B. and R.L.; visualization, C.K.; project administration, W.B., S.B. and R.L.; funding acquisition, W.B. and S.B. All authors have read and agreed to the published version of the manuscript.
Funding
This research was based upon work supported by the National Aeronautics and Space Administration under Air Force Contract No. FA8702-15-D-0001.
Data Availability Statement
The data utilized here represents a pre-release version of the data. The data will be archived by the NASA GES-DISC, and will shortly be available at https://disc.gsfc.nasa.gov/ (accessed on 26 April 2022).
Acknowledgments
The authors would like to acknowledge the support and contributions made to this work by the TROPICS Science Team members.
Conflicts of Interest
The authors declare no conflict of interest.
References
- Kidd, C.; Levizzani, V. Status of satellite precipitation retrievals. Hydrol. Earth Syst. Sci. 2011, 15, 1109–1116. [Google Scholar] [CrossRef] [Green Version]
- Kummerow, C.D. Introduction to passive microwave retrieval methods. In Satellite Precipitation Measurement; Levizzani, V., Kidd, C., Kirschbaum, D.B., Kummerow, C.D., Nakamura, K., Turk, F.J., Eds.; Springer Nature: Berlin/Heidelberg, Germany, 2020; pp. 123–140. [Google Scholar] [CrossRef]
- Hou, A.Y.; Kakar, R.K.; Neeck, S.A.; Azarbarzin, A.; Kummerow, C.D.; Kojima, M.; Oki, R.; Nakamura, K.; Iguchi, T. The Global Precipitation Measurement mission. Bull. Amer. Meteor. Soc. 2014, 95, 701–722. [Google Scholar] [CrossRef]
- Stephens, G.L.; Vane, D.G.; Boain, R.J.; Mace, G.G.; Sassen, K.; Wang, Z.; Illingworth, A.J.; O’connor, E.J.; Rossow, W.B.; Durden, S.L.; et al. The CloudSat mission and the A-Train: A new dimension of space-based observations of clouds and precipitation. Bull. Am. Meteorol. Soc. 2002, 83, 1771–1790. [Google Scholar] [CrossRef] [Green Version]
- Stephens, G.; Winker, D.; Pelon, J.; Trepte, C.; Vane, D.; Yuhas, C.; L’Ecuyer, T.; Lebsock, M. CloudSat and CALIPSO within the A-Train: Ten Years of Actively Observing the Earth System. Bull. Am. Meteorol. Soc. 2018, 99, 569–581. [Google Scholar] [CrossRef] [Green Version]
- Kidd, C.; Matsui, T.; Chern, J.; Mohr, K.; Kummerow, C.; Randel, D. Global Precipitation Estimates from cross-track passive microwave observations using a physically based retrieval scheme. J. Hydrometeorol. 2016, 17, 383–400. [Google Scholar] [CrossRef] [Green Version]
- Bagaglini, L.; Sanò, P.; Casella, D.; Cattani, E.; Panegrossi, G. The Passive microwave Neural network Precipitation Retrieval algorithm for climate applications (PNPR-CLIM): Design and application. Remote Sens. 2021, 13, 1701. [Google Scholar] [CrossRef]
- Huffman, G.J.; Bolvin, D.T.; Nelkin, E.J.; Wolff, D.B.; Adler, R.F.; Gu, G.; Hong, Y.; Bowman, K.P.; Stocker, E.F. The TRMM Multisatellite Precipitation Analysis (TMPA): Quasi-Global, Multiyear, Combined-Sensor Precipitation Estimates at Fine Scales. J. Hydrometeorol. 2007, 8, 38–55. [Google Scholar] [CrossRef]
- Levizzani, V.; Kidd, C.; Aonashi, K.; Bennartz, R.; Ferraro, R.R.; Huffman, G.J.; Roca, R.; Turk, F.J.; Wang, N.-Y. The activities of the International Precipitation Working Group. Q. J. R. Meteorol. Soc. 2018, 144, 3–15. [Google Scholar] [CrossRef] [PubMed] [Green Version]
- Blackwell, W.J.; Braun, S.; Bennartz, R.; Velden, C.; DeMaria, M.; Atlas, R.; Dunion, J.; Marks, J.; Rogers, R.; Annane, B.; et al. An overview of the TROPICS NASA Earth Venture Mission. Q. J. R. Meteorol. Soc. 2018, 144, 16–26. [Google Scholar] [CrossRef] [PubMed] [Green Version]
- Huffman, G.J.; Bolvin, D.T.; Braithwaite, D.; Hsu, K.; Joyce, R.J.; Kidd, C.; Nelkin, E.J.; Sorooshian, S.; Stocker, E.F.; Tan, J.; et al. Integrated Multi-satellite Retrievals for the Global Precipitation Measurement (GPM) Mission (IMERG). In Satellite Precipitation Measurement; Levizzani, V., Kidd, C., Kirschbaum, D.B., Kummerow, C.D., Nakamura, K., Turk, F.J., Eds.; Advances in Global Change Research; Springer Nature: Cham, Switzerland, 2020; Volume 7, pp. 343–353. [Google Scholar] [CrossRef]
- Zhang, J.; Howard, K.; Langston, C.; Kaney, B.; Qi, Y.; Tang, L.; Grams, H.; Wang, Y.; Cocks, S.; Martinaitis, S.; et al. Multi-Radar Multi-Sensor (MRMS) Quantitative Precipitation Estimation: Initial Operating Capabilities. Bull. Am. Meteorol. Soc. 2016, 97, 621–638. [Google Scholar] [CrossRef]
- Li, N.; He, J.; Zhang, S.; Lu, N. Precipitation Retrieval Using 118.75-GHz and 183.31-GHz Channels from MWHTS on FY-3C Satellite. IEEE J. Sel. Top. Appl. Earth Obs. Remote Sens. 2018, 11, 4373–4389. [Google Scholar] [CrossRef]
- Kidd, C.; Matsui, T.; Ringerud, S. Precipitation Retrievals from Passive Microwave Cross-Track Sensors: The Precipitation Retrieval and Profiling Scheme. Remote Sens. 2021, 13, 947. [Google Scholar] [CrossRef]
- Leslie, R.V.; DiLiberto, M.; Blackwell, W.J. Time-Resolved Observations of Precipitation Structure and Storm Intensity with a Constellation of Smallsats: Level-1 Radiance Algorithm Theoretical Basis Document. 2022. Available online: https://ntrs.nasa.gov/citations/20210018919 (accessed on 26 April 2022).
- Surussavadee, C.; Staelin, D.H. Millimeter-Wave Precipitation Retrievals and Observed-versus-Simulated Radiance Distributions: Sensitivity to Assumptions. J. Atmos. Sci. 2007, 64, 3808–3826. [Google Scholar] [CrossRef]
- Kidd, C.; Matsui, T. NASA Time-Resolved Observations of Precipitation Structure and Storm Intensity with a Constellation of Smallsats (TROPICS) Precipitation Retrieval and Profiling Scheme (PRPS). 2022. Available online: https://ntrs.nasa.gov/citations/20220006496 (accessed on 26 April 2022).


Publisher’s Note: MDPI stays neutral with regard to jurisdictional claims in published maps and institutional affiliations. |
© 2022 by the authors. Licensee MDPI, Basel, Switzerland. This article is an open access article distributed under the terms and conditions of the Creative Commons Attribution (CC BY) license (https://creativecommons.org/licenses/by/4.0/).