Article

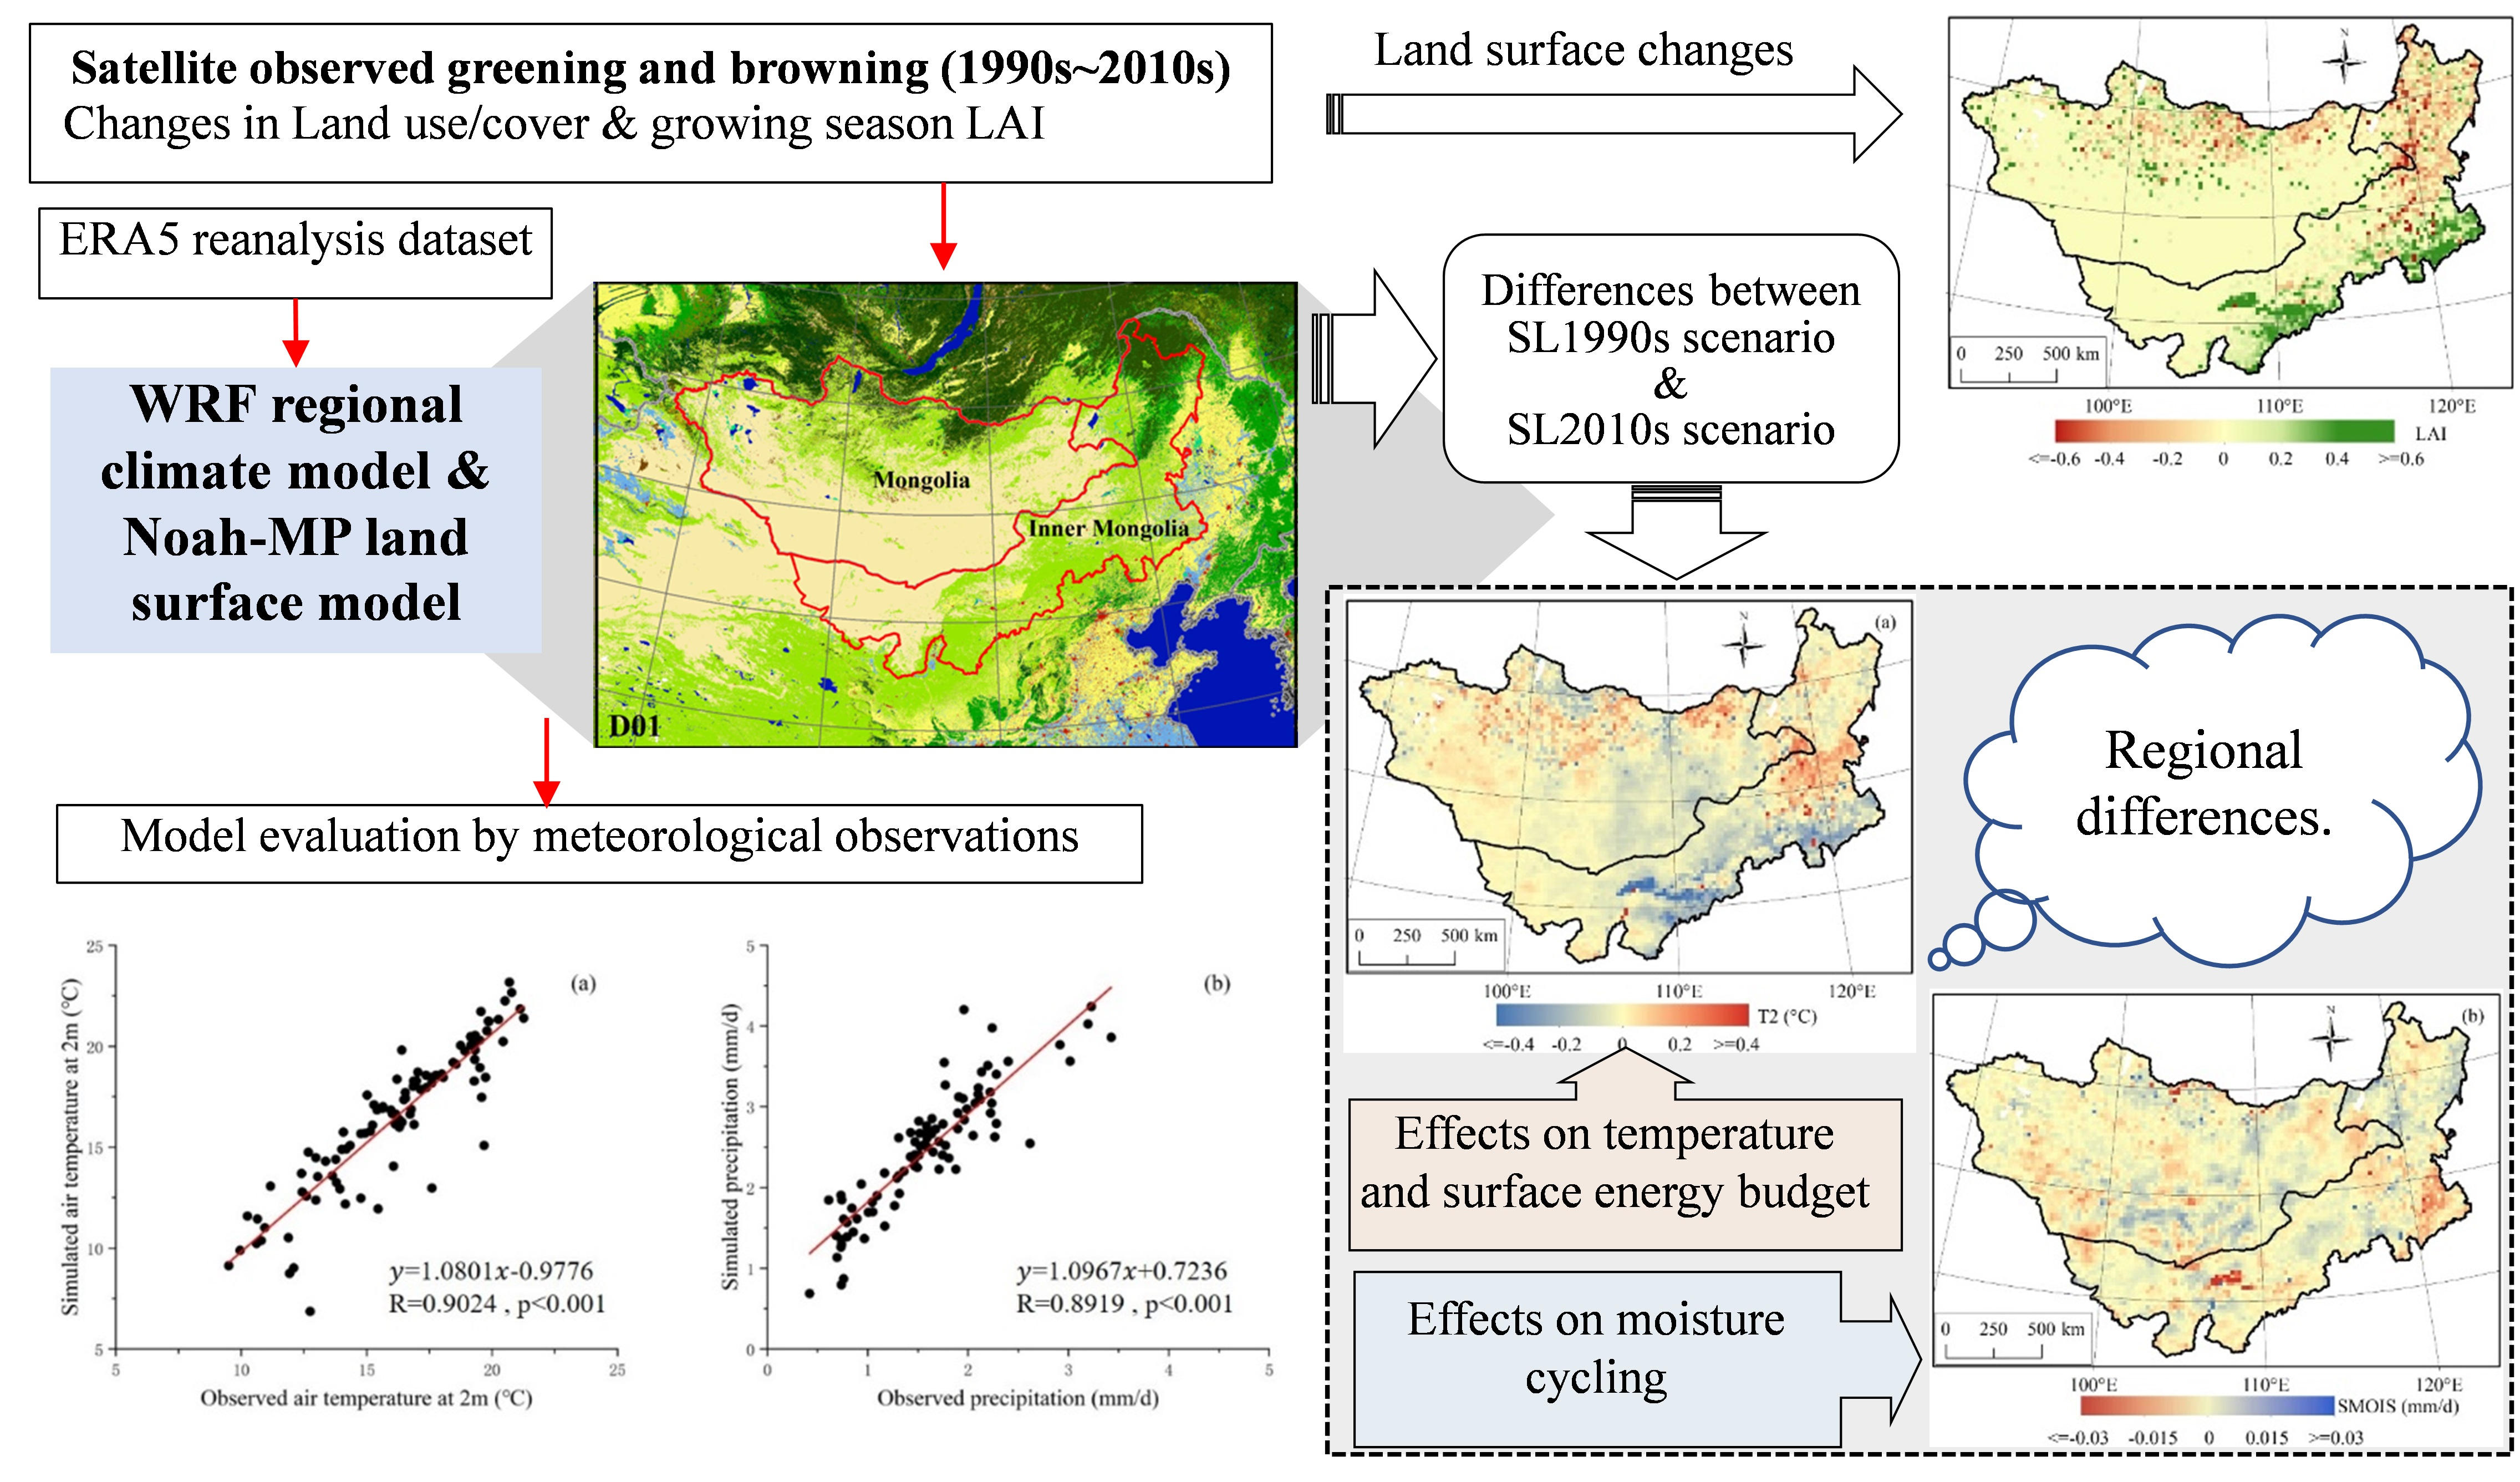
Modeling Potential Impacts on Regional Climate Due to Land Surface Changes across Mongolia Plateau

1
College of Geography Science, Changchun Normal University, Changchun 130032, China
2
Remote Sensing and Geographic Information Research Center, Northeast Institute of Geography and Agroecology, Chinese Academy of Sciences, Changchun 130102, China
*
Author to whom correspondence should be addressed.
Remote Sens. 2022, 14(12), 2947; https://doi.org/10.3390/rs14122947
Submission received: 16 May 2022 / Revised: 17 June 2022 / Accepted: 17 June 2022 / Published: 20 June 2022
(This article belongs to the Special Issue Remote Sensing for Advancing Nature-Based Climate Solutions)

Abstract

:
Although desertification has greatly increased across the Mongolian Plateau during the last decades of the 20th century, recent satellite records documented increasing vegetation growth since the 21st century in some areas of the Mongolian Plateau. Compared to the study of desertification, the opposite characteristics of land use and vegetation cover changes and their different effects on regional land–atmosphere interaction factors still lack enough attention across this vulnerable region. Using long-term time-series multi-source satellite records and regional climate model, this study investigated the climate feedback to the observed land surface changes from the 1990s to the 2010s in the Mongolia Plateau. Model simulation suggests that vegetation greening induced a local cooling effect, while the warming effect is mainly located in the vegetation degradation area. For the typical vegetation greening area in the southeast of Inner Mongolia, latent heat flux increased over 2 W/m2 along with the decrease of sensible heat flux over 2 W/m2, resulting in a total evapotranspiration increase by 0.1~0.2 mm/d and soil moisture decreased by 0.01~0.03 mm/d. For the typical vegetation degradation area in the east of Mongolia and mid-east of Inner Mongolia, the latent heat flux decreased over 2 W/m2 along with the increase of sensible heat flux over 2 W/m2 obviously, while changes in moisture cycling were spatially more associated with variations of precipitation. It means that precipitation still plays an important role in soil moisture for most areas, and some areas would be at potential risk of drought with the asynchronous increase of evapotranspiration and precipitation.

Graphical Abstract

1. Introduction

Land surface changes regulate local/regional weather and climate by directly modifying the surface radiation budget and the exchanges of heat, water, and momentum [1,2]. Remote sensing-based parameters, including the normalized difference vegetation index (NDVI), leaf area index (LAI), green vegetation fraction (GVF), albedo, etc., are used to characterize changes in land surface properties with detailed dynamics and regional differences [3,4,5,6]. Generally, these changes are closely connected with climate changes or/and human-induced land use changes [7,8,9], such as deforestation, desertification, surface greening, etc., which provide opportunities to comprehensively explore the regional differences of land–atmosphere interactions.
In vulnerable arid and semi-arid areas, vegetation degradation was highly sensible to drought [10,11,12,13,14,15] and socio-economic disturbance [16]. When the ability of vegetation restoration is out-balanced, typical desertification emerged with significant changes of ecosystem functions, and land surface properties [17]. Through the land–atmosphere interactions, the effects of desertification on regional climate have also attracted extensive attention [18,19,20,21]. Some studies revealed the biogeophysical mechanisms of climate process and pattern changes in response to desertification or vegetation degradation. Although it was controversial, Charney postulated a biogeophysical feedback mechanism for the vegetative cover of the semiarid regions [22], which has important influences on theoretical studies of vegetation–climate feedback [23]. Research by Zhang et al. [24] also indicated that land surface degradation over the transitional zone in northern China and its surrounding areas could be one of the main causes responsible for the climate anomalies over China, especially the drought over northern China. However, Rotenberg and Yakir [25] discovered that desertification over the past several decades contributed to negative radiative forcing at the Earth’s surface equivalent to approximately 20% of the global anthropogenic CO2 effect over the same period, moderating warming trends. These studies contributed to the comprehensive understanding of the impacts of desertification on radiative forcing and hydrothermal processes related to climate change.
In contrast to desertification, land surface greening due to vegetation restoration also changed land surface properties and brought opposite effects on regional climate basically, which has also been widely concerned in recent years [26,27]. Based on observation and numerical simulation, some studies indicated that vegetation restoration in semiarid northern China has an overall cooling effect [28,29]. However, several studies suggested that, due to the overwhelming impact of enhanced net radiation, vegetation restoration may result in atmospheric warming effects in the arid and semiarid regions [30,31]. Compared with temperature, the influence of vegetation restoration on the moisture cycle was more important and still controversial, especially in semiarid areas. A study by Zhu et al. [32] in a semiarid basin indicated that vegetation restoration induced a significant decrease in the drought index and more precipitation participated in the soil water–groundwater cycle. Some studies suggest that extensive vegetation restoration may lead to severe water resource scarcity due to the enhanced evapotranspiration (ET) [33,34]. These results indicated that the effects of vegetation restoration on the local hydrothermal process and regional climate remain unclear.
Mongolian Plateau, located in the hinterland of temperate Asia with an arid and semi-arid temperate continental climate, spans Inner Mongolia of China and Mongolia. It has experienced significant land degradation or desertification over the past few decades [35]. Based on regional climate models, several researchers analyzed the interactions between vegetation degradated land and atmosphere over this area. Xue [21] identified that the desertification over Mongolia and Inner Mongolia had a significant influence on the simulated regional climate, water balance, and surface energy balance. Chen et al. [19] also simulated and analyzed the potential impacts of vegetation degradation on regional climate over arid and semi-arid regions of China using the Weather Research and Forecasting (WRF) regional climate model [36]. These results indicated that grassland degradation in arid and semi-arid areas may lead to increased temperature and reduced precipitation. To restore damaged ecosystems, large-scale ecological protection programs such as the “Grain to Green Program” were established in China, and significant landscape greening is emerging in the Chinese side of the Mongolian Plateau since 2000 [37,38,39]. Meanwhile, vegetation degradation and vegetation restoration coexist currently over the Mongolian Plateau. Vegetation change and its effect on climate have the features of spatial heterogeneity and difference, especially between Inner Mongolia of China and Mongolia. However, related research was still inadequate in this area.
Therefore, the major objective of this study was to explore regional processes and patterns in the effects of land surface change on climate over the Mongolian Plateau. Firstly, using long-term time-series satellite records, we analyzed land use/land cover and LAI changes during the growing season to reveal characteristics of land surface change from the 1990s to the 2010s. Secondly, based on the regional climate model coupled with a land surface model, effects of land surface change on the regional climate process were simulated, and regional patterns of critical hydrothermal factors were analyzed, including temperature, surface energy budget, and moisture cycling. Finally, regional characteristics and biophysical mechanisms over the arid and semiarid Mongolian Plateau are discussed.

2. Materials and Methods
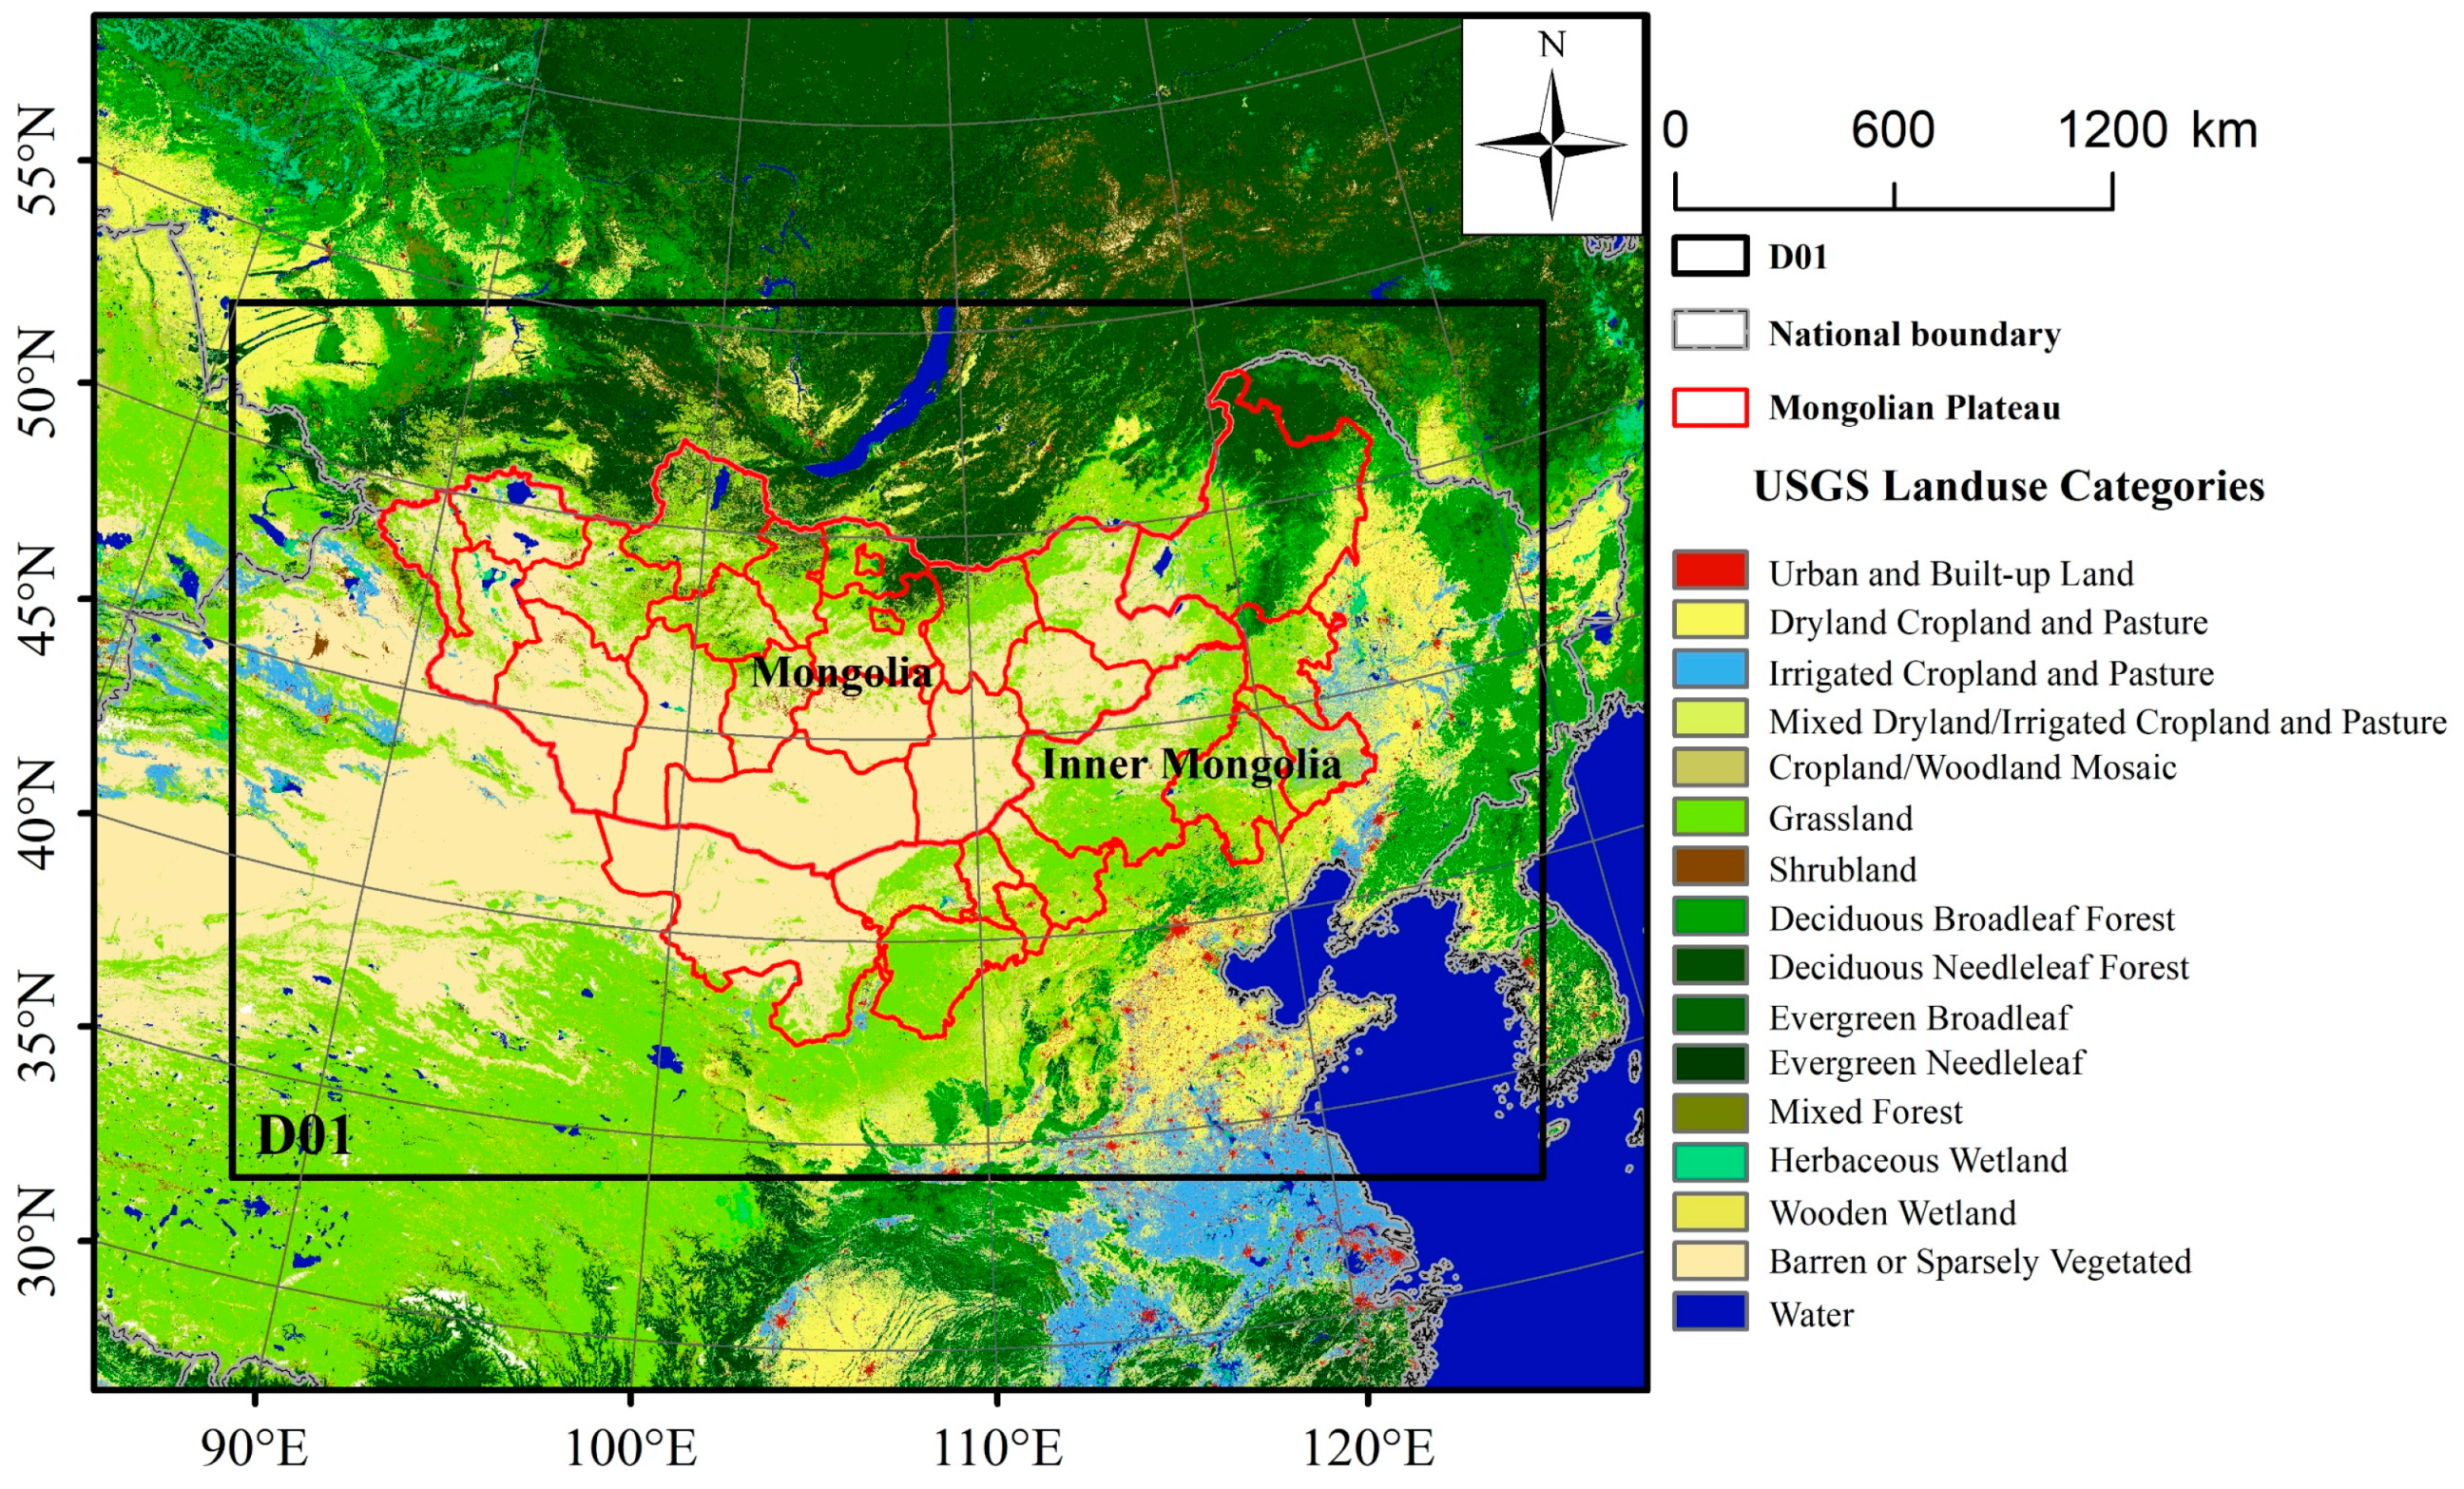
2.1. Study Area

The study area is located in the East Asian inland plateau, including Inner Mongolia of China and Mongolia, and extending from about 37°46′–53°08′E, 87°40′–122°15′E, with a total area of about 2.75 × 10⁸ hm2 [40] (Figure 1). The terrain in this area is high in the west and low in the east, with an average elevation of 1580 m. This area has a hyper-continental climate, with most rainfall concentrated in summer, and cold, long, and less precipitation in winter. The plateau’s vegetation is dominated by deserts and steppes, with the growing season from May to September. This region is a transition zone from the semi-humid area in the north and east to the semi-arid and arid area in the southwest.
In the past 30 years, negative and positive socio-economic activities jointly affected the land surface of this area, with increasing human population, livestock overgrazing, coal and mineral mining, rapid urbanization, and ecological protection behavior [39,40]. Meanwhile, the climate has become warmer and drier since the mid-1990s [40,41]. Typically, it is sensitive to natural climate changes and anthropogenic influences.

2.2. Data and Processing

The datasets used in this paper include satellite-observed land surface data, reanalysis data, and meteorological data (Table 1).
The Land Use and Land Cover (LULC) data of the study area were derived from the Climate Change Initiative (CCI) LULC dataset developed by the European Space Agency. LULC data were first converted to the United States Geological Survey (USGS) LULC classification system and then resampled to a 1 km resolution (Figure 1). Then, the land use fraction and major land use types were calculated at a model resolution of 20 km.
LAI and surface albedo were used to characterize vegetation coverage in this study [42]. The LAI is related to photosynthesis, canopy resistance, vegetation canopy transpiration, and CO2 exchange. Albedo represents the optical characteristics of the land surface and is the critical parameter controlling the net solar shortwave radiation. LAI data were obtained from the Global Land Surface Satellite (GLASS) products (http://www.glass.umd.edu/ (accessed on 25 June 2021)). The surface albedo data were obtained from the ERA5-land monthly dataset (https://doi.org/10.24381/cds.68d2bb30 (accessed on 25 June 2021)) instead of the GLASS albedo products because the latter overestimated the surface albedo during the growing season based on our previous studies [43]. ERA5-Land surface albedo used a climatological background albedo, which was calculated based on the Moderate Resolution Imaging Spectroradiometer (MODIS) observed values, and was modified by the H-TESSEL land surface model over water, ice, and snow [44]. We averaged LAI and albedo data into monthly means for the periods from 1990 to 2018. Then, they were resampled to the model resolution based on bilinear interpolation.
The climate model driven data in this study are the ERA5 reanalysis dataset, provided by European Centre for Medium-Range Weather Forecasts (ECMWF) (https://doi.org/10.24381/cds.bd0915c6/ (accessed on 25 June 2021)). This dataset includes a large number of atmospheric, land, and oceanic climate variables with a six-hour temporal resolution, 0.25° × 0.25° horizontal resolution, and atmospheric parameters at 37 pressure levels. The ERA5 reanalysis dataset could provide initial conditions and boundary field for dynamic downscaling of the regional climate model.
The meteorological observations, including monthly mean 2 m air temperature (T2) and precipitation of 2011–2018, were used to verify the performance of land–atmosphere interactions from the regional climate model. The stations in China were obtained from the China Meteorological Administration (CMA) (http://data.cma.cn/en (accessed on 25 June 2021)), and the stations in Mongolia were collected from the Mongolian Academy of Sciences. The meteorological observation data were interpolated to the model resolutions based on the ANUSPLIN [45].

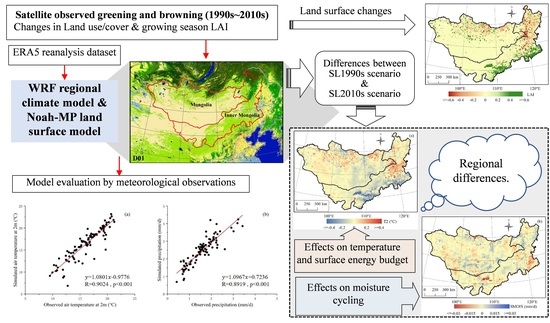
2.3. Model Configuration and Simulation

In this study, the Advanced Research WRF (ARW) model (version 4.2) was used to simulate regional climate patterns and process in response to land surface changes. With flexible parameterization schemes and horizontal resolutions, the state-of-the-art WRF model has been widely applied in regional climate change studies [46] and land–atmosphere interaction research [19,29,47]. Simulations were performed using one domain (D01) with a resolution of 20 km × 20 km. The D01 was centered at 107°E, 45°N (Figure 1), and contained 200 grids in the east-west direction, 200 grids in the north-south direction, and 32 levels vertically.
In the WRF model, the USGS 24-category Land Use Classification System was selected to describe the land use pattern of the study area (Figure 1). We also selected the WRF Single-Moment (WSM) 3-class scheme [48], the Community Atmospheric Model (CAM3) scheme [49], the Yonsei University planetary boundary layer scheme [50], the multi-scale Kain–Fritsch scheme [51], and Noah-MP Land Surface Model [52] as the microphysics, radiation, planetary boundary layer, cumulus parameterization, and land-surface, respectively. These physical schemes were proved to reproduce well the spatial variability of climate factors of Northeast Asia based on our previous studies [43,53]. They are also basically consistent with the schemes of Chen et al. [19] with a similar study area except for a different land surface model and version of microphysics. Particularly, the Noah-MP Land Surface Model was used to distinguish the energy, momentum, and moisture exchange between the land surface and the atmosphere [52]. The parameterization schemes of Noah-MP in this study were input LAI, calculated vegetation fraction, and other default options, including the Ball–Berry stomatal resistance scheme [54], the Monin–Obukhov surface layer drag coefficient calculation scheme [55], the Noah soil moisture factor for stomatal resistance [56], the two-stream radiative transfer applied to the vegetated fraction scheme [57], and the Canadian Land Surface Scheme [58].
Two sets of experiments were simulated in the WRF model to conduct a sensitivity analysis: the SL1990s scenario and the SL2010s scenario. The SL1990s scenario used 1990–1999 10-year monthly mean LAI and albedo to characterize the past land surface properties (Table 1). The SL2010s scenario used 2010–2018 9-year monthly mean LAI and albedo to characterize the recent land surface properties. The land surface revisions between the two scenarios were only for the grids in the study area. Both scenarios shared the same initial/lateral boundaries from 1 July 2010 to 31 December 2018, and the same physical parameterization schemes above. With the same periods of land surface data and initial/lateral boundaries data, simulation results of the SL2010s scenario were validated based on meteorological observations to assess the performance of the model schemes. Under the same climate background, the simulation differences between the SL1990s scenario and the SL2010s scenario were calculated to investigate regional climate variations caused by land surface changes without influences of background climate changes. In light of the regional climate and vegetation characteristics, as well as model spin-up, data from May to September in the growing season of 2011–2018 were used for analysis.

3. Results

3.1. Land Surface Changes from 1992 to 2018

Land use and land cover changes were the most notable feature of vegetation dynamics in this region. Based on the CCI LULC data, land cover conversion of the study area from 1992 to 2018 was analyzed first (Figure S1). The increase of grassland was the most important characteristic during this period. The area of grassland increased by 53,153 km2, 72.5% of which was attributed to the conversion from barren or sparsely vegetated land. This process mainly laid outside the north, east, and south edge of the southwestern present barren or sparsely vegetated area of the study area. The area of cropland also increased greatly by 23,078 km2, 54.3% and 35.8% of which were converted from grassland, and barren or sparsely vegetated land, respectively. However, 15,670 km2 of barren or sparsely vegetated land was transformed from other lands, including 75.9% of grassland. On the whole, the area of grassland and cropland has increased by 2.48% and 8.55%, respectively, while the area of barren or sparsely vegetated land has reduced by 2.34%. These results show that large areas of barren or sparsely vegetated lands have been revegetated due to anthropogenic agricultural activities or climate changes, meanwhile, vegetation destruction also appeared locally.
In addition to significant LULC conversion, vegetation change can also be proved by the trend of vegetation degradation or vegetation greening without changes in land cover/use type. So, variations in LAI were used to evaluate ensemble vegetation change over the study area. These variations were expressed by the difference in the growing season (May to September) averaged LAIs between the 1990s and the 2010s to reduce the impact of climate fluctuations, as shown in Figure 2.
There was an obvious spatial difference in LAI changes over this region from the 1990s to the 2010s. In Mongolia, LAI mainly decreased in the northern area with some scattered pixels of LAI increase, while LAI barely changed in most of the southern area. Spatially, some increased area of LAI was related to the forest, and the decreased area of LAI was mainly located on the grassland. There was a decrease of 0.01 over Mongolia and an increase of 0.01 over Inner Mongolia of China, averagely. However, in Inner Mongolia, there was also an obvious LAI decline of 0.12 over the north of 45°N, especially for the transition area between forest and sparsely vegetated land. There are plenty of stock farms distributed in this transition area, and the livestock density increased greatly in the past decades, which contributed to the typical vegetation degradation of this area. In addition, there were also some scattered pixels of significant LAI decrease in Inner Mongolia. There was an obvious LAI increase of 0.07 averagely over the south of 45°N, especially for the southeast of Inner Mongolia, which was highly related to the agriculture development. LAI of barren or sparsely vegetated land in the west of Inner Mongolia was also barely changed.
The gradual changes in LAI reflected the effects of climate changes and large-scale socio-economic factors on vegetation. Scattered pixels, especially with significant decrease in LAI, indicated negative results of local anthropogenic activities, such as mining in Mongolia and urbanization in Inner Mongolia.

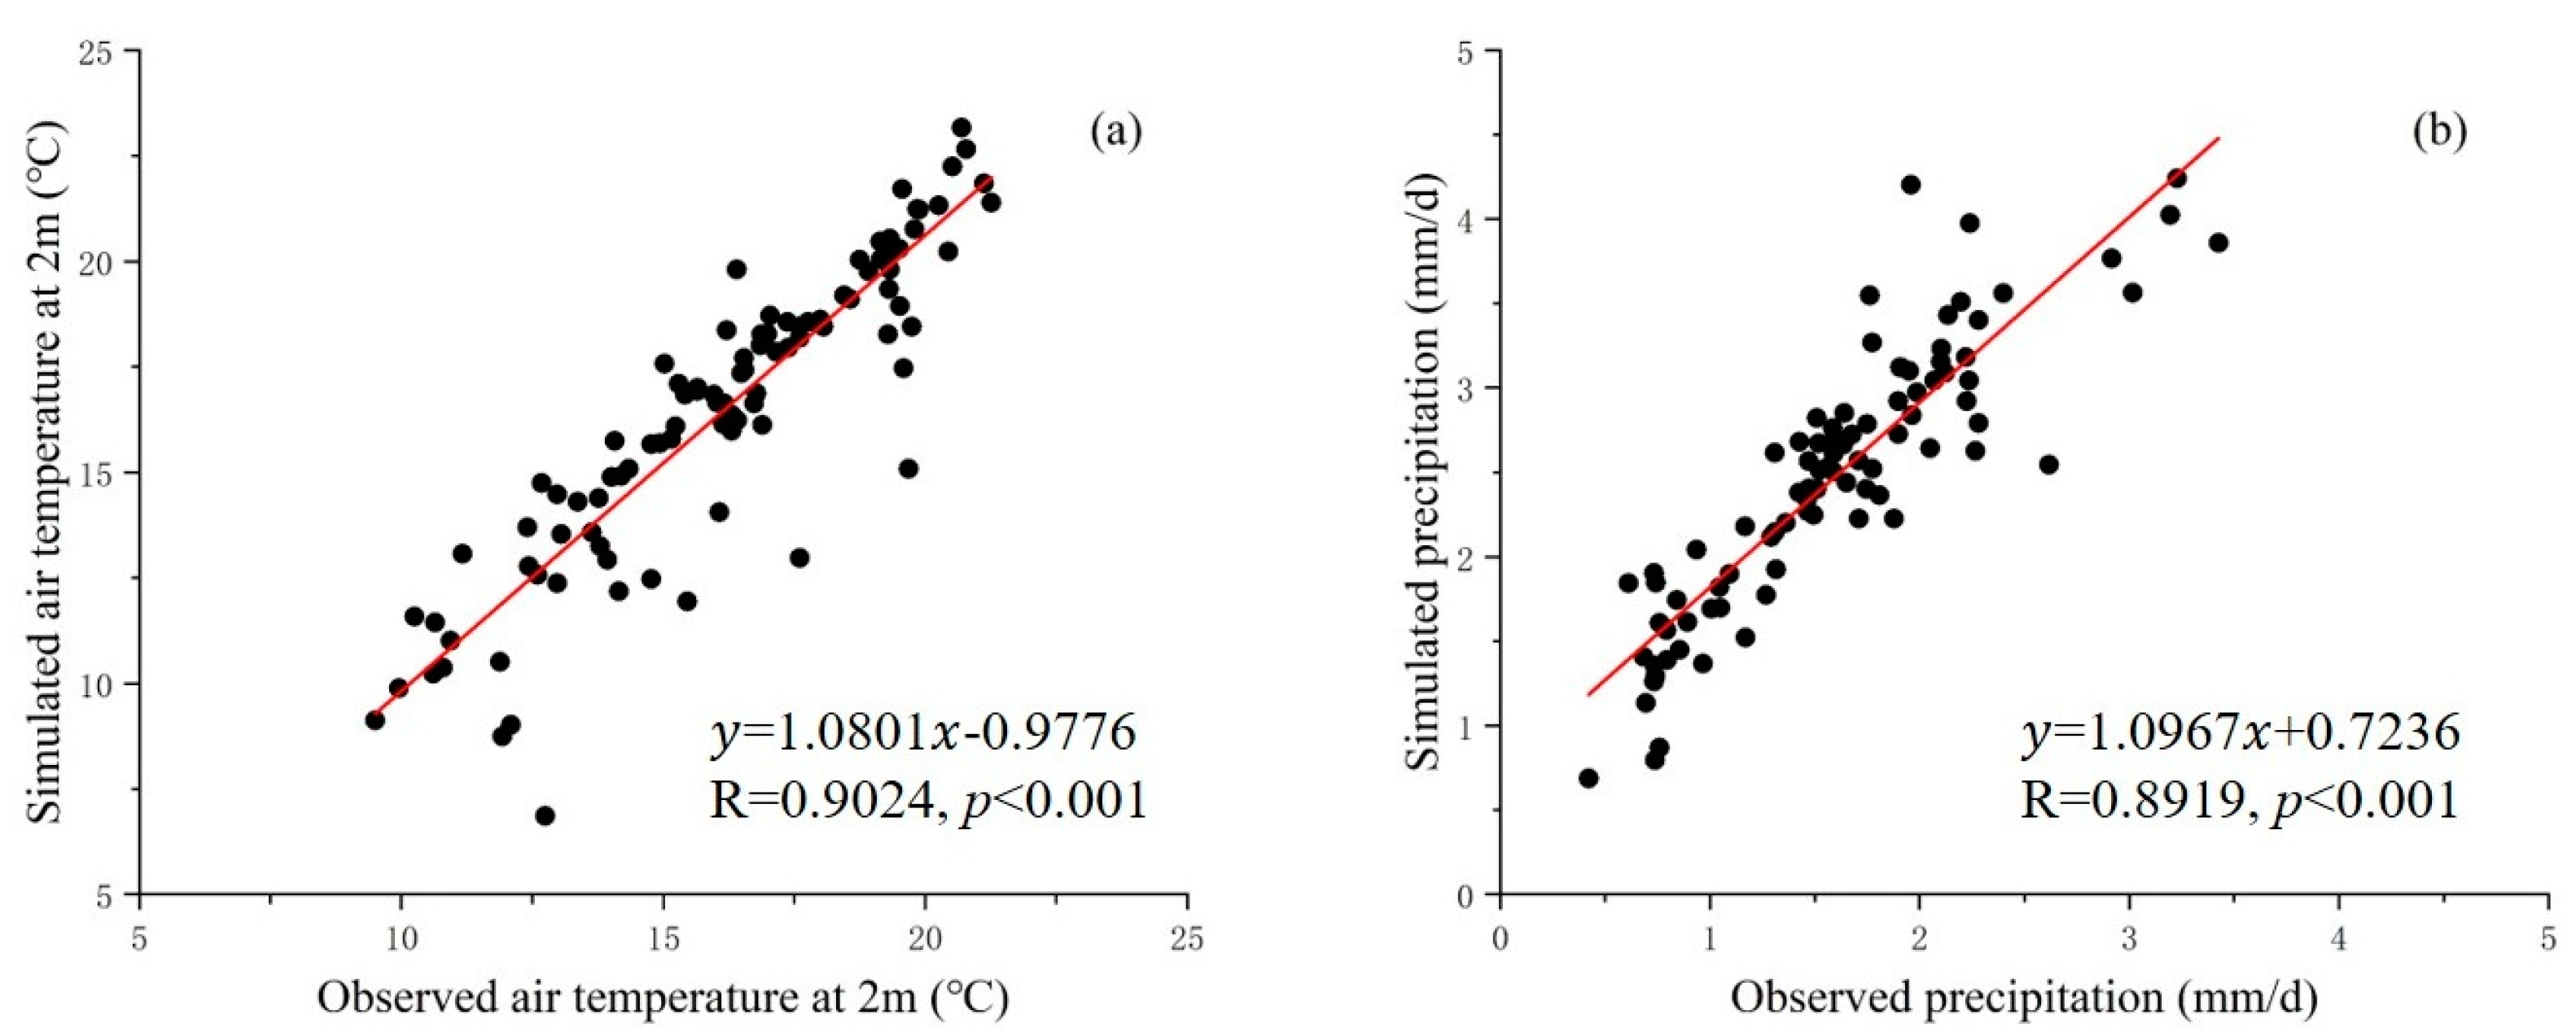
3.2. Model Evaluation Based on Meteorological Observations

To validate the model, we first compared the meteorological observation data with the simulated growing season temperature at 2 m (T2) and precipitation in the model resolution from 2011 to 2018, as shown in Figure 3. The slope of correlation between simulated T2 and observed T2 is 1.0801 (R = 0.9024, p < 0.001). The slope of correlation between simulated precipitation and observed precipitation is 1.0967 (R = 0.8919, p < 0.001). Both of the coefficients are close to 1 with a relatively small intercept, indicating that downscaling of the climate model and the applied physical schemes had accurately reproduced the regional temperature and precipitation from 2011 to 2018. In addition, the sensitivity experiment of SL1990s scenario based on the model could grasp the sensitive effects of land surface changes. However, some dots deviated relatively far from the fitting line in Figure 3, meaning that there were also discrepancies between the observations and simulations. In comparison, the accuracy of simulated T2 was better than that of precipitation, and the model overestimated precipitation in this study area. In addition to the errors of lateral boundary forcing and/or intrinsic limitations of the model and parameterization, the interpolation of observation data may also lead to this disagreement [53].

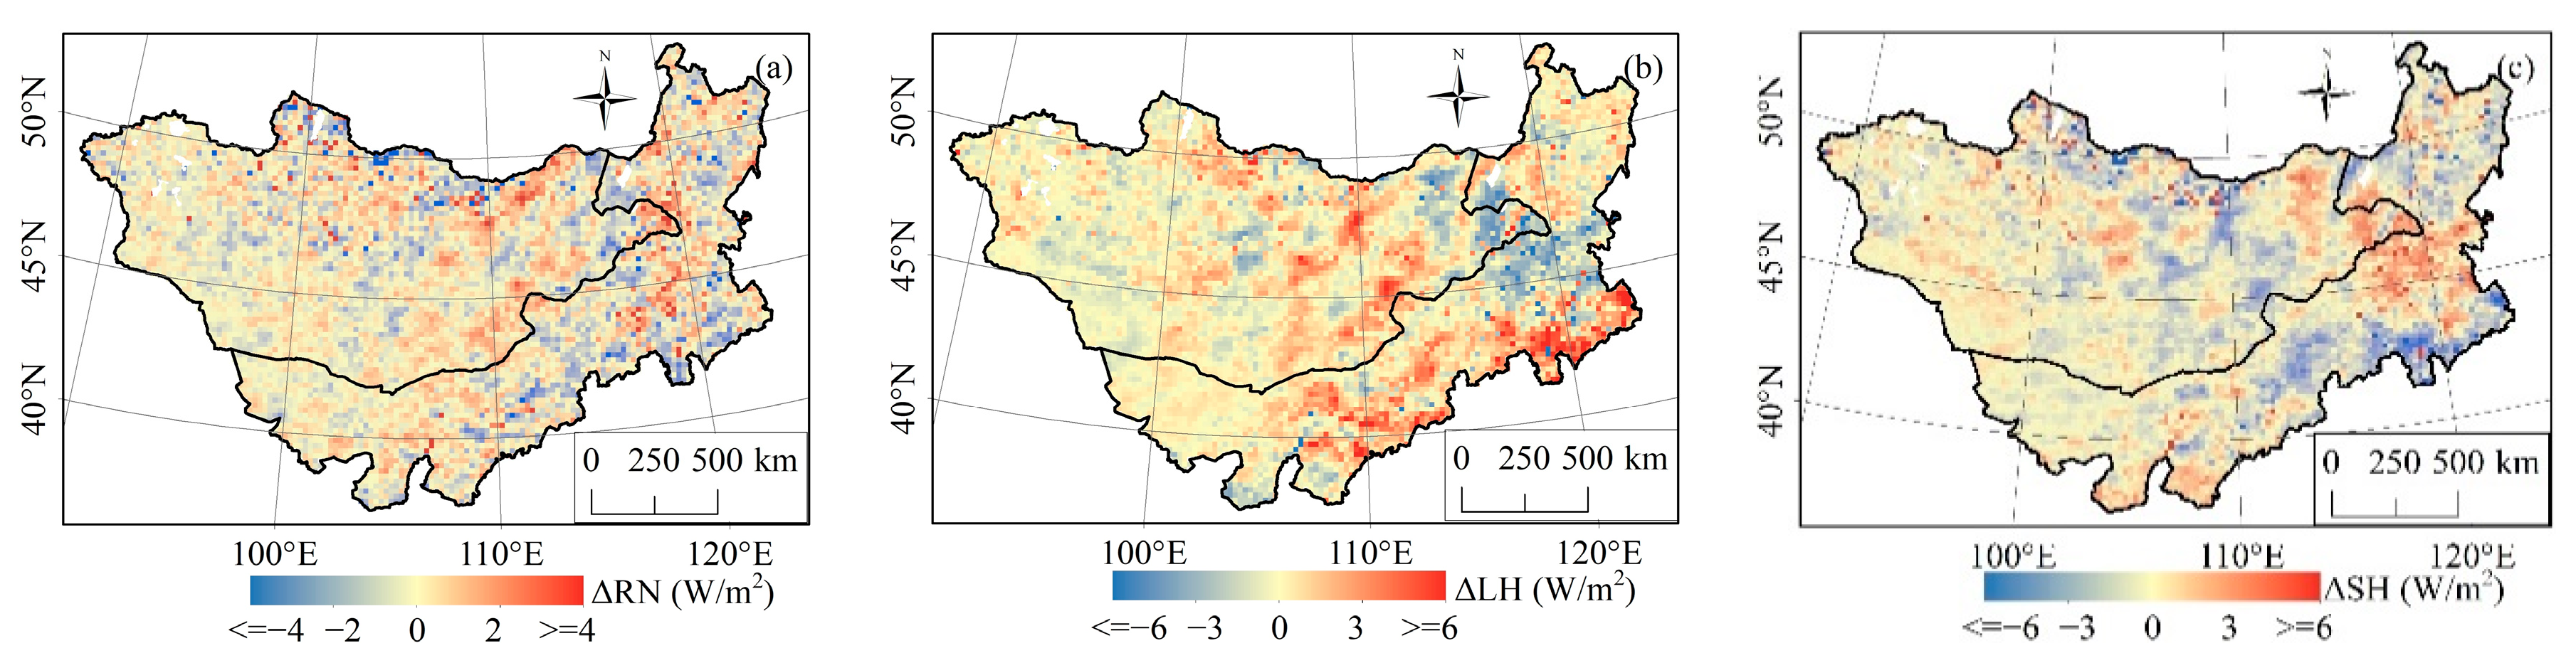
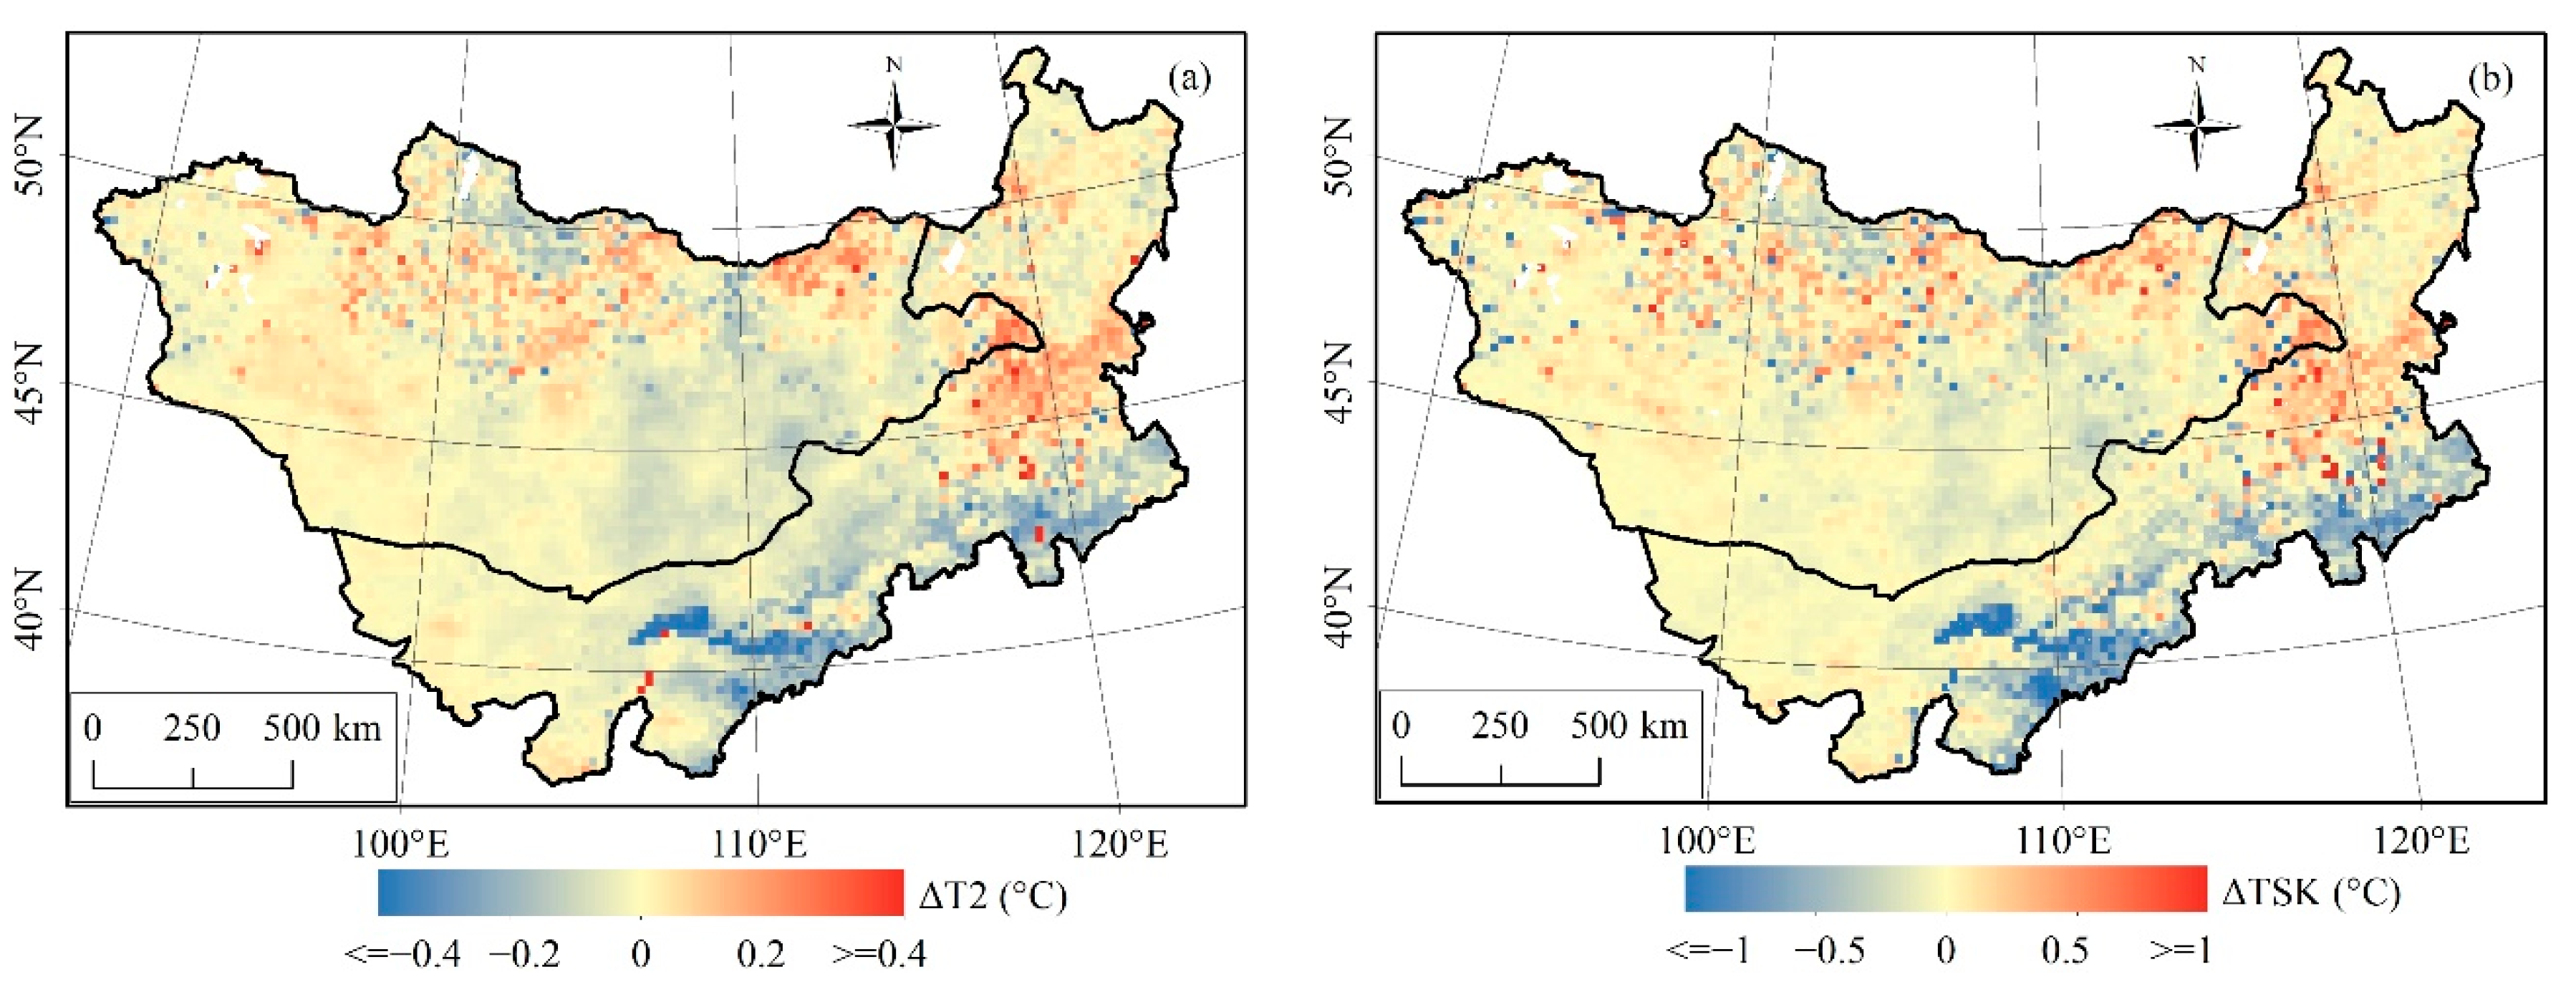
3.3. Impact of Vegetation Changes on Temperature and Surface Energy Budget

Vegetation changes have an important influence on the local surface energy budget, which is directly reflected in temperature variation. For the study area with arid and semi-arid climate conditions, the effects of vegetation changes would be more sensitive. Based on the simulated difference between the SL1990s scenario and SL2010s scenario with the same initial/lateral boundaries from 2011 to 2018, the effects of vegetation changes on growing season T2 and surface skin temperature (TSK) were extracted, as shown in Figure 4.
Based on Figure 4, the spatial pattern of differences in T2 was similar to the spatial pattern of differences in TSK. However, the differences in TSK were about 2.1 times larger than the differences in T2 in quantity, averagely. It suggests a major influence of local TSK on T2 in this region. In north Mongolia, the local cooling effect (−0.2~−0.1 °C) and local warming effect (0.1~0.2 °C) for T2 coexisted due to heterogeneity of vegetation changes in grassland and forest from the 1990s to 2010s. Meanwhile, there was slight cooling (−0.1~0 °C) and slight warming (0~0.1 °C) for T2 over the barren or sparsely vegetated land in the southeast and southwest Mongolia, respectively. Overall, T2 and TSK tended to increase by 0.001 °C and decrease by 0.014 °C, averagely, in Mongolia, indicating the offset effect of local vegetation changes on the temperature over the entire country. In Inner Mongolia of China, there was a warming effect (0.1~0.3 °C) area in the mid-east and a cooling effect (−0.5~−0.1 °C) area in the southeast for T2. The cooling area was consistent with the vegetation greening area, spatially, while the warming area was mainly located in the vegetation degradation area. Overall, T2 and TSK tended to decrease by 0.033 °C and decrease by 0.100 °C averagely in Inner Mongolia due to land surface changes. Compared with gradual changes, the prominent temperature changes over some scattered pixels showed “heat island” effects.
Biogeophysical impacts of vegetation changes on temperature resulted from the energy partitioning process of land surface. Variations of net radiation (RN), latent heat flux (LH), and sensible heat flux (SH) between two scenarios were analyzed to illustrate the mechanism of vegetation change on surface energy budget, as shown in Figure 5.
Under the same climate background of 2011–2018, variations of RN in Figure 5a resulted from changes in land surface characters and their atmosphere feedbacks, for example, albedo and cloudy fraction, which were more heterogeneous. RN increased by 0.08 W/m2 over Mongolia and increased by 0.03 W/m2 over Inner Mongolia, averagely, suggesting more energy was absorbed by the land surface over the entire study area due to land surface changes. However, changes in RN were less than those of LH and SH in quantity. On the whole study area, the LH increased by 0.33 W/m2 and SH decreased by 0.16 W/m2, averagely. For Inner Mongolia, the LH increased by 0.50 W/m2 and SH decreased by 0.22 W/m2, averagely. While for Mongolia, the LH increased by 0.21 W/m2 and SH decreased by 0.12 W/m2, averagely. For the typical vegetation degradation area in the east of Mongolia and mid-east of Inner Mongolia, LH decreased along with the increase of SH. It indicated that reduced vegetation decreased the land surface LH, leading to higher TSK and more heat distributed to SH. While for the typical vegetation greening area in the southeast of Inner Mongolia, LH increased along with the decrease of SH. Vegetation greening significantly increased LH, resulting in surface cooling and lower SH. The absolute values of changes in LH and SH in most of these typical areas were over 2 W/m2, generally. There was a relation of “as one falls, another rises” for LH and SH basically in Figure 5b,c, which reflected the typical effect of vegetation changes.

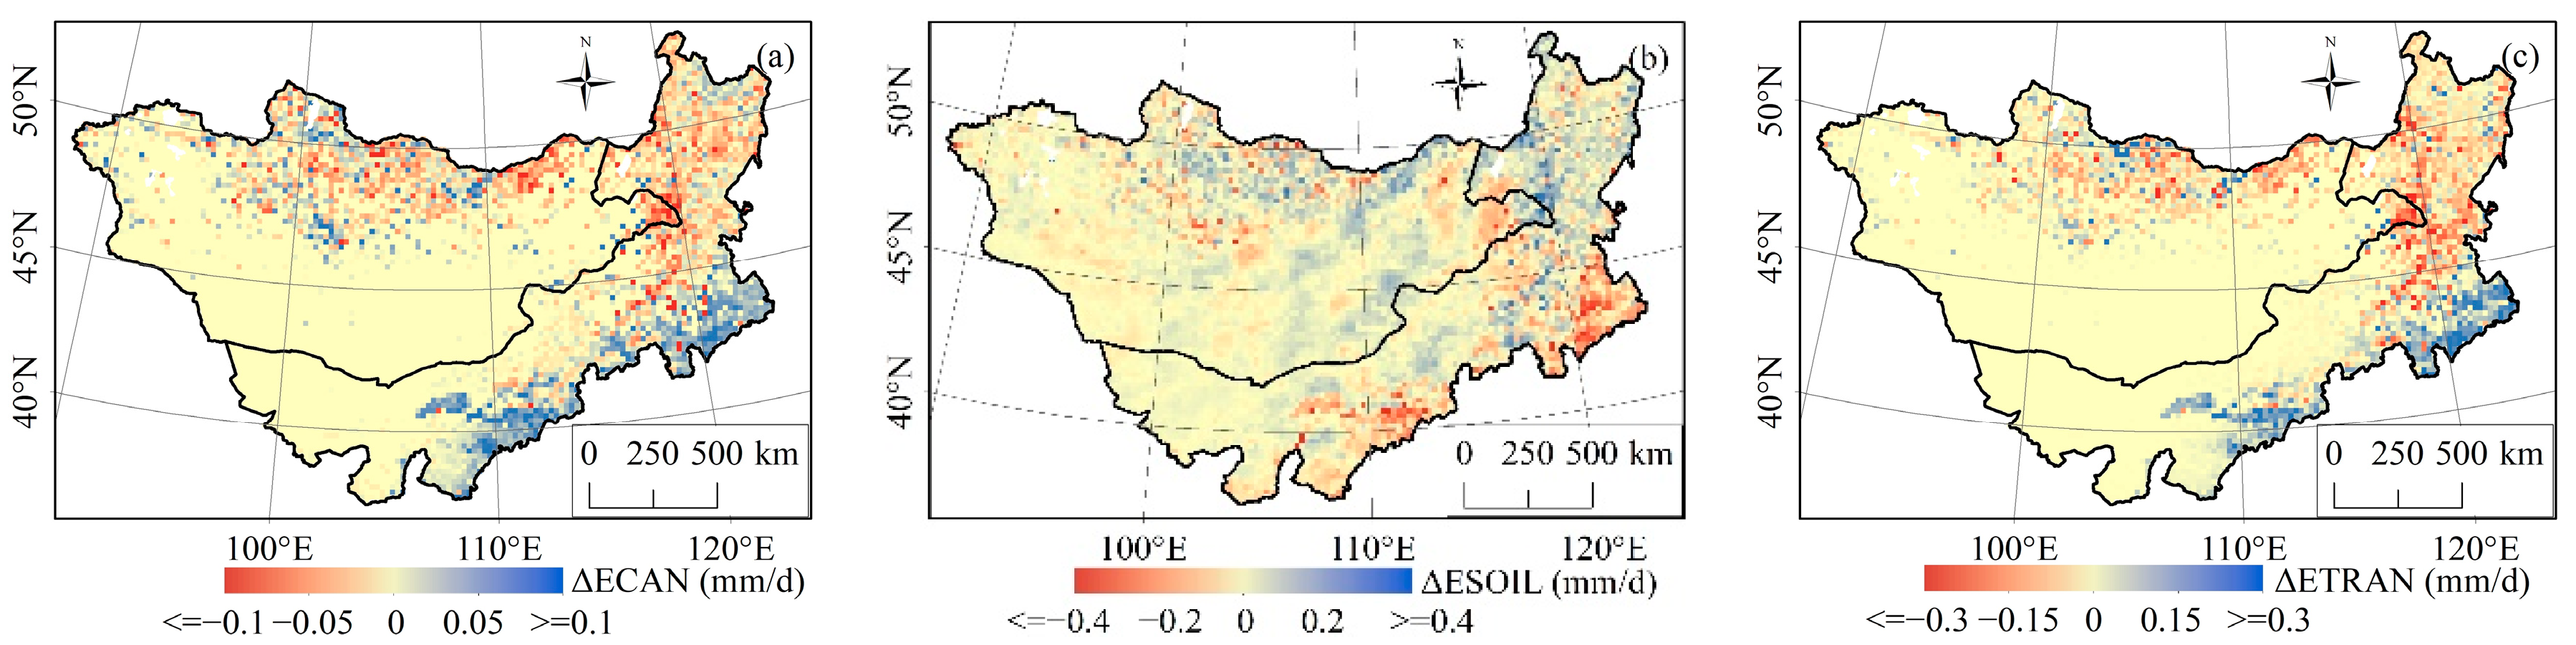
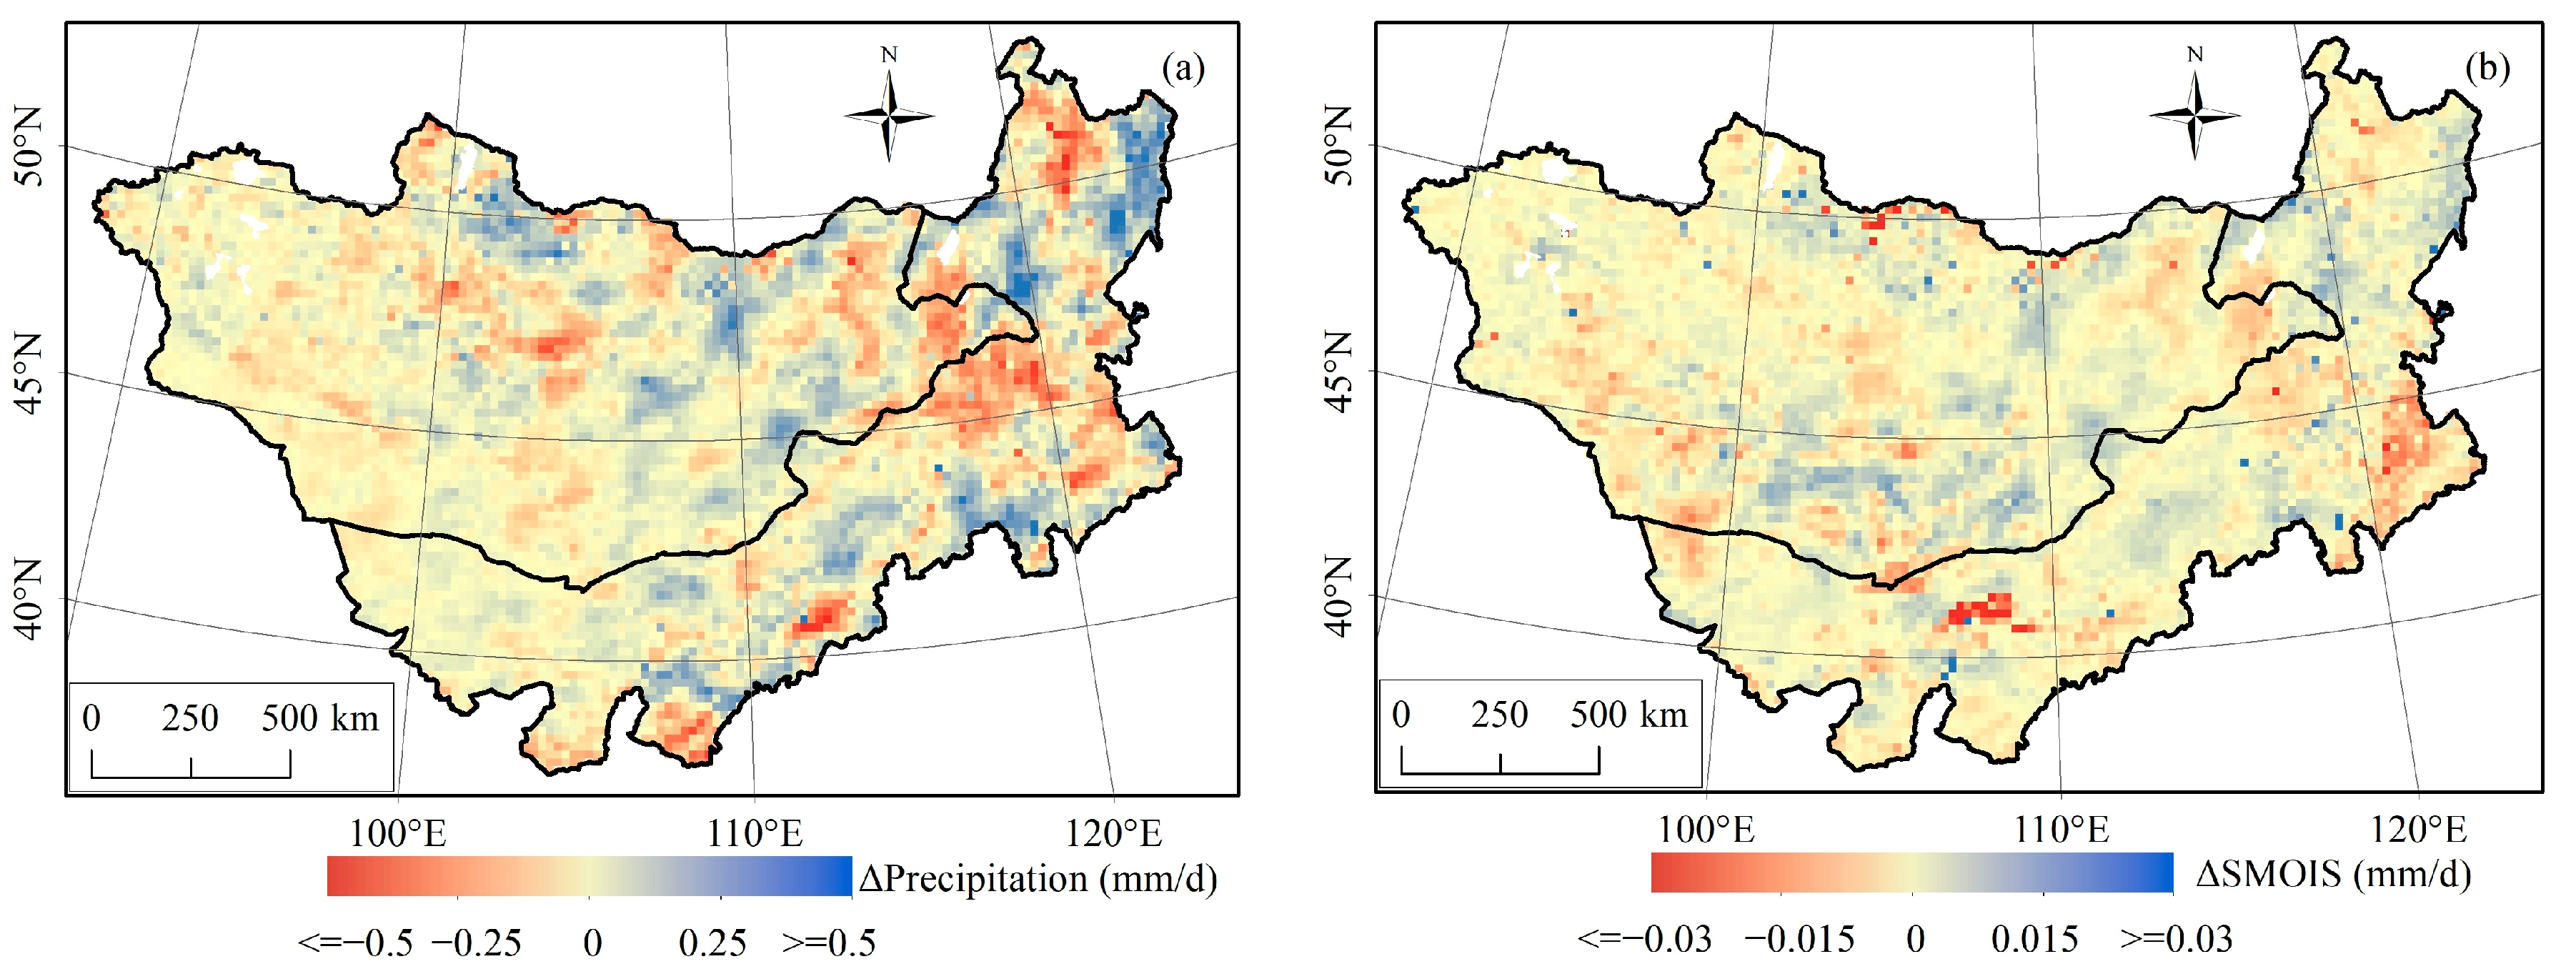
3.4. Impact of Vegetation Changes on Moisture Cycling

Vegetation changes have a direct impact on land surface evapotranspiration and further affect the regional moisture cycling. Meanwhile, changes in LH were also directly related to vegetation transpiration. In the Noah-MP land surface model, ET was composed of evaporation of intercepted water (ECAN), ground surface evaporation (ESOIL), and transpiration (ETRAN). In this section, we analyzed the changes in ECAN, ESOIL, and ETRAN between the two scenarios firstly, as illustrated in Figure 6.
There was an overall increase of ECAN in the southeast of Inner Mongolia, and an overall decrease in the north of both Mongolia and Inner Mongolia (Figure 6a). This distribution was similar to that for ETRAN (Figure 6c) in different quantities. These spatial variations were consistent with the distribution of LAI changes (Figure 2) rather than that of precipitation (Figure 7a), indicating changes in ECAN and ETRAN were more affected by vegetation changes than precipitation. Contrary to ECAN and ETRAN, the simulated differences in ESOIL decreased in the southeast of Inner Mongolia and increased in a large area of northern Mongolia and northern Inner Mongolia, which were negatively correlated with changes in LAI. For the typical area of vegetation greening in the southeast of Inner Mongolia, ECAN and ETRAN usually increased 0.1~0.2 mm/d and 0.2~0.4 mm/d, respectively, while ESOIL decreased 0.25~0.5 mm/d, resulting in around 0.1~0.2 mm/d increase of total ET. For the area of grassland degradation in the mid-east of the study area, variations of ECAN, ESOIL, and ETRAN were more heterogeneous. For some typical vegetation degradation pixels, ECAN and ETRAN usually decreased 0.1~0.2 mm/d and 0.2~0.4 mm/d, respectively. With less vegetation coverage, ESOIL increased 0.2~0.4 mm/d. However, total ET decreased around 0.1~0.2 mm/d.
Different from ET, precipitation was more affected by large-scale climate processes, such as monsoon, circulation, etc. So, spatial variations of precipitation in Figure 7a did not agree with changes in LAI on the whole, suggesting the influence of local LAI on precipitation was limited. Despite overall disturbance, ET increase in small areas did not bring precipitation locally and vice versa. Under the combined influence of precipitation and local ET, soil moisture also changed with certain spatial characters as shown in Figure 7b, which was important for vegetation growth in the arid and semi-arid regions. For the southeast area of Inner Mongolia, soil moisture decreased by around 0.01 mm/d, and there was a more obvious decrease of about 0.03 mm/d in a small area of mid-western Inner Mongolia. Soil moisture decrease over these two areas mainly resulted from the increase of local ET rather than changes in precipitation. For the other area of Inner Mongolia and most areas of Mongolia, changes in soil moisture were spatially more associated with variations of precipitation. For instance, soil moisture of the mid-south area of Inner Mongolia did not decrease correspondingly with the increase of ET due to effective moisture supplement by precipitation. These results suggested that precipitation still plays an important role in soil moisture in most areas, and some areas would be at potential risk of drought as the increase of ET and decrease of precipitation.

4. Discussion

4.1. Land Surface Changes in Mongolia Plateau

By using long-term satellite records from the 1990s to 2010s, we investigated the land cover changes including both land use conversions and vegetation cover changes across the Mongolia Plateau. Our results showed that the two dominant land-use conversions are from sparsely vegetation to grassland and cropland, respectively, across both Mongolia and Inner Mongolia from 1992 to 2018. This conclusion was consistent with previous studies of land use changes in this area [26,39,59]. Besides the land use changes, we also observed wide vegetation cover changes across the Mongolia Plateau, but with significant spatial heterogeneity. Beneficial from the ecological protection projects and the efforts to improve the ecological environment [17], the satellite observed obvious vegetation restoration in the middle south and eastern south of Inner Mongolia. However, the LAI decreased in the transition zone of forest and grassland on the west side of the Greater Khingan Range, which can be explained by the human disturbances by replacing the forests with cropland [60]. In addition, the land use conversion from grassland to cropland contributed to the LAI increase across the agro-pastoral ecotone in southeastern Inner Mongolia.
While in Mongolia, both vegetation browning and greening were observed during the period from the 1990s to the 2010s. Vegetation greening was shown in areas where the barren or sparsely vegetation has been improved to grassland, whereas the vegetation browning was shown in the northern part of Mongolia. As reported by John et al. [61], the vegetation cover changes in Mongolia were mainly influenced by climate changes instead of human activities. Therefore, the vegetation response to climate changes is highly dependent on the climate anomalies during the study period. For instance, the vegetation over the eastern border regions of Mongolia and Inner Mongolia of China showed slightly vegetation browning from the 1990s to the 2010s in our study. For the same area, the vegetation cover decreased from 1982 to 2018 [53], however, significantly increased from 2001 to 2017 [29]. These vegetation cover anomalies were highly correlated with the precipitation anomalies, suggesting precipitation plays a more important role in determining the vegetation activities in the semi-arid regions. Even though, socio-economic impacts on vegetation changes were also the important driving factors, such as distance to urban/built-up areas, fire, and livestock density [62,63,64]. Compared to climate changes, these anthropogenic drivers affect vegetation on a local scale, which would be related to the scattered LAI decrease in Figure 2.

4.2. Influence of Land Cover Changes on Regional Climate

In response to both human activities and climate changes, land cover changes can further feedback on climate systems by altering the energy, moisture, and momentum exchanges between land surface and atmosphere [21,27,38]. Land cover changes involve both the conversions between different land use categories and the vegetation cover changes. Previous studies documented that land use changes can significantly modify the local and regional climate, such as urbanization, afforestation, and paddy expansions [30,31]. Changes of vegetation greening/browning can regulate the surface temperature and water budgets [29]. Meanwhile, magnitudes of these impacts showed significant discrepancies at different latitude and moisture environments, seasons, and even among different ecosystems [53,62]. Some studies only focused on one typical land use change, such as desertification, as well as its effects on regional climate across the Mongolia Plateau. Our study comprehensively estimated the climate impacts of land surface changes including both the land use type and vegetation changes in this area. Satellite observed land surface changes were coupled with the regional climate model to study climate responses. Our results found that significant vegetation restoration in the southeastern and middle southern regions brings significant ET cooling during the growing season. In contrast, in the vegetation degradation areas such as the eastern border regions of Mongolia, surface warming was observed due to inhibited ET. The specific results were basically consistent with Xue et al. [21] and Yu et al. [6].
From the perspective of moisture transportation, LAI increase/decrease contributes to synchronous ECAN and ETRAN increase/decrease, while opposite ESOIL variations across the Mongolia Plateau were observed. These characteristics were consistent with the results from the Loess Plateau of China [6]. Unlike the temperature, our results also showed the simulated precipitation increase/decrease did not totally correspond to the LAI increase/decrease. As a result, the precipitation variation caused by vegetation cover changes showed more spatial heterogeneity than the LAI changes. As reported by previous studies, the increased vegetation growth may reduce the soil moisture as the enhanced ET cannot be compensated by the increased precipitation in the arid regions [62,65]. In this semi-arid region, we found that increased vegetation growth did bring water risks by reducing soil moisture in some areas, such as the southeast Mongolia Plateau. In contrast, as the ET was inhibited in some vegetation degraded regions such as the eastern border area of Mongolia, and the water cycling cannot be well activated, a similar water deficit was simulated. Although the land surface showed opposite changes in these two typical regions, the soil moisture responses showed the same signs. It means that the water responses to the land surface changes in this semi-arid region are much more complex. So, targeted vegetation restoration strategies should be proposed in future environmental protection programs.
In addition, we found the land surface hydrothermal characteristics across ecotones were most sensitive to climate changes, including agriculture and forestry ecotone, agriculture and animal husbandry ecotone, and forest animal husbandry ecotone. The land surface feedback also implied that interactions between surface and atmosphere in these ecologically vulnerable regions should also be concerned.

4.3. Uncertainties and Future Works

In this study, we used the sensitivity analysis based on regional climate numerical simulations to estimate the impacts of vegetation cover changes on regional temperature and precipitation. Although most of the objectives of this study have been achieved, there are still some limitations that should be addressed for a better understanding of the interactions between land surface changes and atmosphere in the semi-arid areas. First, through comparing with other studies, we found that the grassland vegetation cover changes showed different signals in different periods, and as a result, the associated climate feedbacks showed different characteristics, correspondingly. In this study, we used sensitivity analysis to evaluate the climate impacts from land cover changes without considering the climate background anomalies. Therefore, the results presented here and the background climate anomalies should be combined to understand the land surface responses to climate changes. In addition to LAI, vegetation change also results in changes in surface roughness length, which influences surface turbulence, and further local temperature and evapotranspiration. Effects of roughness length change in aerodynamic resistance or momentum flux should be considered to comprehensively understand thermal and moisture response to land surface changes.
Second, Xue et al. [21] revealed that grassland degradation in Inner Mongolia brought local warming effects, which was consistent with our results. However, Xue et al. [21] also revealed that grassland cover changes can also influence the precipitation pattern of its adjacent regions and even southern China. Our work in this study only considered the local and regional climate impacts from land cover changes in the Mongolia Plateau, without estimating the teleconnections from land cover changes on its adjacent and other regions, which should be further evaluated in future works.
Finally, although the climate pattern simulated by the regional climate model was validated by the observed air temperature and precipitation, the climate impacts from land cover changes should be further verified by in situ observations and multi-models. Moreover, these sensitive impacts from land surface changes in this study should consider the influences of long-term climate changes [66], rather than a certain period of climate background.

5. Conclusions

By using long-term time-series multi-source satellite records and the state-of-the-art regional climate model WRF, this study investigated the climate feedback to the observed land surface changes from the 1990s to 2010s in the arid/semiarid Mongolia Plateau. Land use changes show that large areas of barren or sparsely vegetated lands have been revegetated due to anthropogenic agricultural activities or climate changes. Meanwhile, vegetation destruction also appeared locally, especially in the middle-east of Inner Mongolia. Overall, the area of grassland and cropland has increased by 2.48% and 8.55%, respectively, while the area of barren or sparsely vegetated land has reduced by 2.34%. There was a LAI decrease of 0.01 over Mongolia and LAI increase of 0.01 over Inner Mongolia of China averagely. For Inner Mongolia of China, there was an obvious LAI decline of 0.12 and LAI increase of 0.07 over north and south of the 45°N, respectively.
Based on the simulated difference between two land surface scenarios with the same initial/lateral boundaries in the 2010s, the vegetation greening area indicated a local cooling effect spatially, while the warming effect was mainly located in the vegetation degradation area. Because of the typical vegetation degradation, LH tended to decrease over 2 W/m2 along with the increase of SH over 2 W/m2 obviously in the east of Mongolia and mid-east of Inner Mongolia. While due to the typical vegetation greening, LH tended to increase over 2 W/m2 along with the decrease of SH over 2 W/m2 in the southeast of Inner Mongolia. Accordingly, ECAN and ETRAN increased 0.1~0.2 mm/d and 0.2~0.4 mm/d, respectively, and ESOIL decreased 0.25~0.5 mm/d, resulting in around 0.1~0.2 mm/d increase in total ET for the reason of vegetation greening. In contrast, these hydrological factors showed an opposite character and similar in quantity as a result of vegetation degradation. Results of soil moisture changes over the study area suggested that precipitation still plays an important role in soil moisture for most areas, and some areas would be at potential risk of drought as the asynchronous increase of ET and precipitation.
This study focused on the heterogeneous land use and vegetation cover changes and their different effects regionally on hydrothermal factors in the arid/semiarid Mongolia Plateau. It suggested that much more attention should be paid to interactions between land surface and atmosphere in these vulnerable regions in policy making and planning due to new vegetation changes in recent years.

Supplementary Materials

The following supporting information can be downloaded at: https://www.mdpi.com/article/10.3390/rs14122947/s1, Figure S1: Land cover changes from 1992 to 2018.

Author Contributions

Conceptualization, T.L.; methodology, L.Y.; software, G.L.; validation, Y.J.; formal analysis, G.L.; investigation, J.Y.; writing—original draft preparation, G.L.; writing—review and editing, L.Y. and T.L.; visualization, G.L. and J.Y.; supervision, T.L.; funding acquisition, L.Y. and T.L. All authors have read and agreed to the published version of the manuscript.

Funding

This research was funded by the National Natural Science Foundation of China (41601093 and 42071025), and the Science and Technology Program of Jilin Provincial Department of Education (JJKH20210877KJ).

Data Availability Statement

The CCI land cover data are available from ESA (http://www.esa-landcover-cci.org/ (accessed on 25 June 2021)). LAI data were obtained from product GLASS, which are available from University of Maryland (http://www.glass.umd.edu/ (accessed on 25 June 2021)). Albedo data were obtained from ERA5-land dataset (https://doi.org/10.24381/cds.68d2bb30 (accessed on 25 June 2021)). The ERA5 reanalysis data are obtained from ECMWF (https://doi.org/10.24381/cds.bd0915c6 (accessed on 25 June 2021)). The meteorological observation data are obtained from the China Meteorological Data Service Center (CMDC; http://data.cma.cn/en (accessed on 25 June 2021)).

Conflicts of Interest

The authors declare no conflict of interest.

References

  1. Alkama, R.; Cescatti, A. Biophysical climate impacts of recent changes in global forest cover. Science 2016, 351, 600–604. [Google Scholar] [CrossRef] [PubMed] [Green Version]
  2. Notaro, M.; Liu, Z.; Williams, J.W. Observed Vegetation–Climate Feedbacks in the United States. J. Clim. 2006, 19, 763–786. [Google Scholar] [CrossRef] [Green Version]
  3. Bonan, G.B. Forests and climate change: Forcings, feedbacks, and the climate benefits of forests. Science 2008, 320, 1444–1449. [Google Scholar] [CrossRef] [PubMed] [Green Version]
  4. Bright, R.M.; Zhao, K.; Jackson, R.B.; Cherubini, F. Quantifying surface albedo and other direct biogeophysical climate forcings of forestry activities. Glob. Change Biol. 2015, 21, 3246–3266. [Google Scholar] [CrossRef] [PubMed]
  5. Piao, S.; Fang, J.; Zhou, L.; Ciais, P.; Zhu, B. Variations in satellite-derived phenology in China’s temperate vegetation. Glob. Change Biol. 2006, 12, 672–685. [Google Scholar] [CrossRef]
  6. Yu, L.; Liu, Y.; Liu, T.; Yan, F. Impact of recent vegetation greening on temperature and precipitation over China. Agric. For. Meteorol. 2020, 295, 108197. [Google Scholar] [CrossRef]
  7. Foley, J.A.; DeFries, R.; Asner, G.P.; Barford, C.; Bonan, G.; Carpenter, S.R.; Chapin, F.S.; Coe, M.T.; Daily, G.C.; Gibbs, H.K.; et al. Global consequences of land use. Science 2005, 309, 570–574. [Google Scholar] [CrossRef] [Green Version]
  8. Liang, S.L.; Kustas, W.; Schaepman-Strub, G.; Li, X.W. Impacts of climate change and land use changes on land surface radi-ation and energy budgets. IEEE J-STARS 2010, 3, 219–224. [Google Scholar]
  9. Forzieri, G.; Alkama, R.; Miralles, D.G.; Cescatti, A. Satellites reveal contrasting responses of regional climate to the wide-spread greening of Earth. Science 2017, 356, 1140–1144. [Google Scholar] [CrossRef] [Green Version]
  10. Panagoulia, D.; Dimou, G. Definitions and effects of droughts. In Proceedings of the Conference on Mediterranean Water Policy: Building on Existing Experience, Mediterranean Water Network, Valencia, Spain, 23 April 1998; Volume 1, p. 11. [Google Scholar]
  11. Wang, H.; Chen, A.; Wang, Q.; He, B. Drought dynamics and impacts on vegetation in China from 1982 to 2011. Ecol. Eng. 2015, 75, 303–307. [Google Scholar] [CrossRef]
  12. Alamdarloo, E.H.; Manesh, M.B.; Khosravi, H. Probability assessment of vegetation vulnerability to drought based on remote sensing data. Environ. Monit. Assess. 2018, 190, 702. [Google Scholar] [CrossRef] [PubMed]
  13. Xu, H.-J.; Wang, X.-P.; Zhang, X.-X. Decreased vegetation growth in response to summer drought in Central Asia from 2000 to 2012. Int. J. Appl. Earth Obs.Geoinf. ITC J. 2016, 52, 390–402. [Google Scholar] [CrossRef]
  14. Liu, S.; Zhang, Y.; Cheng, F.; Hou, X.; Zhao, S. Response of Grassland Degradation to Drought at Different Time-Scales in Qinghai Province: Spatio-Temporal Characteristics, Correlation, and Implications. Remote Sens. 2017, 9, 1329. [Google Scholar] [CrossRef] [Green Version]
  15. Jiang, Y.; Wang, R.; Peng, Q.; Wu, X.; Ning, H.; Li, C. The relationship between drought activity and vegetation cover in Northwest China from 1982 to 2013. Nat. Hazards 2018, 92, 145–163. [Google Scholar] [CrossRef]
  16. Feng, Q.; Ma, H.; Jiang, X.M.; Wang, X.; Cao, S.X. What has caused desertification in China? Sci. Rep. 2015, 4, 15998. [Google Scholar] [CrossRef] [Green Version]
  17. Prince, S.; Von Maltitz, G.; Zhang, F.; Byrne, K.; Driscoll, C.; Eshel, G.; Kust, G.; Martínez-Garza, C.; Metzger, J.P.; Midgley, G.; et al. Status and trends of land degradation and restoration and associated changes in biodiversity and ecosystem functions. In Assessment Report on Land Degradation and Restoration; Montanarella, L., Scholes, R., Brainich, A., Eds.; Intergovernmental Science-Policy Platform on Biodiversity and Ecosystem Services (IPBES): Bonn, Germany, 2018; pp. 221–338. [Google Scholar]
  18. Ahlström, A.; Raupach, M.R.; Schurgers, G.; Smith, B.; Arneth, A.; Jung, M.; Reichstein, M.; Canadell, J.G.; Friedlingstein, P.; Jain, A.K.; et al. The dominant role of semiarid ecosystems in the trend and variability of the land CO2 sink. Science 2015, 348, 895–899. [Google Scholar] [CrossRef] [Green Version]
  19. Chen, L.; Ma, Z.; Zhao, T. Modeling and analysis of the potential impacts on regional climate due to vegetation degradation over arid and semi-arid regions of China. Clim. Change 2016, 144, 461–473. [Google Scholar] [CrossRef]
  20. Li, C.J.; Fu, B.J.; Wang, S.; Lindsay, C.S.; Wang, Y.P.; Li, Z.D.; Liu, Y.X.; Zhou, W.X. Drivers and impacts of changes in China’s drylands. Nat. Rev. Earth Environ. 2021, 2, 858–873. [Google Scholar] [CrossRef]
  21. Xue, Y. The Impact of Desertification in the Mongolian and the Inner Mongolian Grassland on the Regional Climate. J. Clim. 1996, 9, 2173–2189. [Google Scholar] [CrossRef]
  22. Charney, J.G. Dynamics of deserts and drought in the Sahel. Q. J. R. Meteorol. Soc. 1975, 101, 193–202. [Google Scholar] [CrossRef]
  23. Hoffmann, W.A.; Jackson, R.B. Vegetation-Climate Feedbacks in the Conversion of Tropical Savanna to Grassland. J. Clim. 2000, 13, 1593–1602. [Google Scholar] [CrossRef]
  24. Zhang, J.; Dong, W.; Fu, C. Impact of land surface degradation in northern China and southern Mongolia on regional cli-mate. Chin. Sci. Bull. 2005, 50, 75–81. [Google Scholar] [CrossRef]
  25. Rotenberg, E.; Yakir, D. Contribution of Semi-Arid Forests to the Climate System. Science 2010, 327, 451–454. [Google Scholar] [CrossRef] [PubMed]
  26. Li, X.; Zhang, X.; Xu, X. Precipitation and Anthropogenic Activities Jointly Green the China–Mongolia–Russia Economic Cor-ridor. Remote Sens. 2022, 14, 187. [Google Scholar] [CrossRef]
  27. Piao, S.; Wang, X.; Park, T.; Chen, C.; Lian, X.; He, Y.; Bjerke, J.; Chen, A.; Ciais, P.; Tømmervik, H.; et al. Characteristics, drivers and feedbacks of global greening. Nat. Rev. Earth Environ. 2019, 1, 14–27. [Google Scholar] [CrossRef]
  28. Cao, Q.; Wu, J.G.; Yu, D.Y.; Wang, W. The biophysical effects of the vegetation restoration program on regional climate met-rics in the Loess Plateau, China. Agric. Forest. Meteorol. 2019, 268, 169–180. [Google Scholar] [CrossRef]
  29. Yu, L.; Xue, Y.; Diallo, I. Vegetation greening in China and its effect on summer regional climate. Sci. Bull. 2020, 66, 13–17. [Google Scholar] [CrossRef]
  30. Huang, L.; Zhai, J.; Liu, J.Y.; Sun, C. The moderating or amplifying biophysical effects of afforestation on CO2-induced cool-ing depend on the local background climate regimes in China. Agric. Forest. Meteorol. 2018, 260, 193–203. [Google Scholar] [CrossRef]
  31. Peng, S.-S.; Piao, S.; Zeng, Z.; Ciais, P.; Zhou, L.; Li, L.Z.X.; Myneni, R.B.; Yin, Y.; Zeng, H. Afforestation in China cools local land surface temperature. Proc. Natl. Acad. Sci. USA 2014, 111, 2915–2919. [Google Scholar] [CrossRef] [Green Version]
  32. Zhu, L.; Liu, J.T.; Yang, M.N.; Zhang, Y.X.; Wen, D.P. Evolutionary trend of water cycle in Beichuan River Basin of China under the influence of vegetation restoration. J. Groundw. Sci. Eng. 2021, 9, 202–211. [Google Scholar]
  33. Jackson, R.B.; Jobbágy, E.G.; Avissar, R.; Roy, S.B.; Barrett, D.J.; Cook, C.W.; Farley, K.A.; le Maitre, D.C.; McCarl, B.A.; Murray, B.C. Trading Water for Carbon with Biological Carbon Sequestration. Science 2005, 310, 1944–1947. [Google Scholar] [CrossRef] [PubMed] [Green Version]
  34. Ge, J.; Pitman, A.J.; Guo, W.; Zan, B.; Fu, C. Impact of revegetation of the Loess Plateau of China on the regional growing season water balance. Hydrol. Earth Syst. Sci. 2020, 24, 515–533. [Google Scholar] [CrossRef] [Green Version]
  35. Liu, J.; Diamond, J. China’s environment in a globalizing world. Nature 2005, 435, 1179–1186. [Google Scholar] [CrossRef]
  36. Skamarock, W.C.; Klemp, J.B.; Dudhia, J.; Gill, D.O.; Liu, Z.; Berner, J.; Wang, W.; Powers, J.G.; Duda, M.G.; Barker, D.M.; et al. A Description of the Advanced Research WRF Version 4; NCAR Tech. Note NCAR/TN-556+STR; NCAR: Boulder, CO, USA, 2019; p. 145. [Google Scholar]
  37. Piao, S.; Yin, G.; Tan, J.; Cheng, L.; Huang, M.; Li, Y.; Liu, R.; Mao, J.; Myneni, R.B.; Peng, S.; et al. Detection and attribution of vegetation greening trend in China over the last 30 years. Glob. Change Biol. 2014, 21, 1601–1609. [Google Scholar] [CrossRef] [PubMed]
  38. Chen, C.; Park, T.; Wang, X.; Piao, S.; Xu, B.; Chaturvedi, R.K.; Fuchs, R.; Brovkin, V.; Ciais, P.; Fensholt, R.; et al. China and India lead in greening of the world through land-use management. Nat. Sustain. 2019, 2, 122–129. [Google Scholar] [CrossRef]
  39. Jiang, H.; Lu, N.; Zhang, X.; Yao, L.; Bai, Y. Satellite observed cooling effects from re-vegetation on the Mongolian Plateau. Sci. Total Environ. 2021, 781, 146707. [Google Scholar] [CrossRef]
  40. Fang, J.Y.; Bai, Y.F.; Wu, J.G. Towards a better understanding of landscape patterns and ecosystem processes of the Mongo-lian Plateau. Landsc. Ecol. 2015, 30, 1573–1578. [Google Scholar] [CrossRef]
  41. Zhao, X.; Hu, H.; Shen, H.; Zhou, D.; Zhou, L.; Myneni, R.B.; Fang, J. Satellite-indicated long-term vegetation changes and their drivers on the Mongolian Plateau. Landsc. Ecol. 2014, 30, 1599–1611. [Google Scholar] [CrossRef]
  42. Zhang, X.Z.; Tang, Q.H.; Zheng, J.Y.; Ge, Q.S. Warming/cooling effects of farmland greenness changes during 1982–2006 in the North China Plain. Environ. Res. Lett. 2013, 8, 024038. [Google Scholar] [CrossRef]
  43. Yu, L.; Liu, T.; Bu, K.; Yang, J.; Chang, L.; Zhang, S. Influence of snow cover changes on surface radiation and heat balance based on the WRF model. Arch. Meteorol. Geophys. Bioclimatol. Ser. B 2016, 130, 205–215. [Google Scholar] [CrossRef]
  44. Copernicus Climate Change Service (C3S). C3S ERA5-Land Reanalysis. Copernicus Climate Change Service. 2019. Available online: https://cds.climate.copernicus.eu/cdsapp#!/home (accessed on 25 June 2021).
  45. Hijmans, R.J.; Cameron, S.E.; Parra, J.L.; Jones, P.G.; Jarvis, A. Very high resolution interpolated climate surfaces for global land areas. Int. J. Climatol. 2005, 25, 1965–1978. [Google Scholar] [CrossRef]
  46. Leung, L.R.; Kuo, Y.-H.; Tribbia, J. Research Needs and Directions of Regional Climate Modeling Using WRF and CCSM. Bull. Am. Meteorol. Soc. 2006, 87, 1747–1752. [Google Scholar] [CrossRef] [Green Version]
  47. Qian, Y.; Huang, M.; Yang, B.; Berg, L.K. A modeling study of irrigation effects on surface fluxes and land air-cloud interac-tions in the Southern Great Plains. J. Hydrometeorol. 2013, 14, 700–721. [Google Scholar] [CrossRef]
  48. Hong, S.Y.; Dudhia, J.; Chen, S.H. A revised approach to ice microphysical processes for the bulk parameterization of clouds and precipitation. Mon. Weather Rev. 2004, 132, 103–120. [Google Scholar] [CrossRef]
  49. Collins, W.D.; Rash, P.J.; Boville, B.A.; Hack, J.J.; McCaa, J.R.; Williamson, D.L.; Kiehl, J.T. Description of the NCAR Com-munity Atmosphere Model (CAM 3.0); NCAR Technical Note NCAR/TN-464+STR; NCAR: Boulder, CO, USA, 2004. [Google Scholar]
  50. Hong, S.Y.; Pan, H.L. Nonlocal boundary layer vertical diffusion in a Medium-Range Forecast Model. Mon. Weather Rev. 1996, 124, 2322–2339. [Google Scholar] [CrossRef] [Green Version]
  51. Zheng, Y.; Alapaty, K.; Herwehe, J.A.; Del Genio, A.; Niyogi, D. Improving High-Resolution Weather Forecasts Using the Weather Research and Forecasting (WRF) Model with an Updated Kain–Fritsch Scheme. Mon. Weather Rev. 2016, 144, 833–860. [Google Scholar] [CrossRef]
  52. Niu, G.Y.; Yang, Z.L.; Mitchell, K.E.; Chen, F.; Ek, M.B.; Barlage, M.; Kumar, A.; Manning, K.; Niyogi, D.; Rosero, E.; et al. The community Noah land surface model with multi-parameterization options (NoahMP): 1. Model description and evaluation with local scale measurements. J. Geophys. Res. 2011, 116, D12109. [Google Scholar] [CrossRef] [Green Version]
  53. Liu, T.; Yu, L.; Bu, K.; Yang, J.; Yan, F.; Zhang, S.; Li, G.; Jiao, Y.; Liu, S. Thermal and moisture response to land surface changes across different ecosystems over Heilong-Amur River Basin. Sci. Total Environ. 2021, 818, 151799. [Google Scholar] [CrossRef]
  54. Ball, J.T.; Woodrow, I.E.; Berry, J.A. A Model Predicting Stomatal Conductance and its Contribution to the Control of Photosynthesis under Different Environmental Conditions. In Progress in Photosynthesis Research; Springer: Dordrecht, The Netherlands, 1987; pp. 221–224. ISBN 978-94-017-0519-6. [Google Scholar]
  55. Brutsaert, W. Evaporation into the Atmosphere; Springer: Berlin/Heidelberg, Germany, 1982. [Google Scholar]
  56. Chen, F.; Mitchell, K.; Schaake, J.; Xue, Y.; Pan, H.-L.; Koren, V.; Duan, Q.; Ek, M.; Betts, A. Modeling of land surface evaporation by four schemes and comparison with FIFE observations. J. Geophys. Res. Earth Surf. 1996, 101, 7251–7268. [Google Scholar] [CrossRef] [Green Version]
  57. Niu, G.-Y.; Yang, Z.-L. Effects of vegetation canopy processes on snow surface energy and mass balances. J. Geophys. Res. Earth Surf. 2004, 109, D23111. [Google Scholar] [CrossRef]
  58. Verseghy, D.L. CLASS-A Canadian land surface scheme for GCMS:I. Soil model. Int. J. Climatol. 1991, 11, 111–133. [Google Scholar] [CrossRef]
  59. Miao, L.; Sun, Z.; Ren, Y.; Schierhorn, F.; Müller, D. Grassland greening on the Mongolian Plateau despite higher grazing intensity. Land Degrad. Dev. 2020, 32, 792–802. [Google Scholar] [CrossRef]
  60. Yu, L.; Zhang, S.; Liu, T.; Tang, J.; Bu, K.; Yang, J. Spatio-temporal pattern and spatial heterogeneity of ecotones based on land use types of southeastern Da Hinggan Mountains in China. Chin. Geogr. Sci. 2014, 25, 184–197. [Google Scholar] [CrossRef]
  61. John, R.; Chen, J.Q.; Ou-Yang, Z.T.; Xiao, J.F.; Becker, R.; Samanta, A.; Ganguly, S.; Yuan, W.P.; Ochirbat, B. Vegetation re-sponse to extreme climate events on the Mongolian Plateau from 2000 to 2010. Environ. Res. Lett. 2013, 8, 035033. [Google Scholar] [CrossRef]
  62. Li, Y.; Piao, S.; Li, L.Z.X.; Chen, A.; Wang, X.; Ciais, P.; Huang, L.; Lian, X.; Peng, S.; Zeng, Z.; et al. Divergent hydrological response to large-scale afforestation and vegetation greening in China. Sci. Adv. 2018, 4, eaar4182. [Google Scholar] [CrossRef] [Green Version]
  63. Filei, A.A.; Slesarenko, L.A.; Boroditskaya, A.V.; Mishigdorj, O. Analysis of Desertification in Mongolia. Russ. Meteorol. Hydrol. 2018, 43, 599–606. [Google Scholar] [CrossRef]
  64. Ren, H.; Zhou, G. Measuring the impacts of anthropogenic activities on Inner Mongolian temperate grassland. Land Degrad. Dev. 2018, 29, 2942–2950. [Google Scholar] [CrossRef]
  65. Zeng, Z.; Piao, S.; Li, L.Z.X.; Zhou, L.; Ciais, P.; Wang, T.; Li, Y.; Lian, X.; Wood, E.F.; Friedlingstein, P.; et al. Climate mitigation from vegetation biophysical feedbacks during the past three decades. Nat. Clim. Change 2017, 7, 432–436. [Google Scholar] [CrossRef]
  66. Han, J.; Dai, H.; Gu, Z. Sandstorms and desertification in Mongolia, an example of future climate events: A review. Environ. Chem. Lett. 2021, 19, 4063–4073. [Google Scholar] [CrossRef]
Figure 1. Location of study area, simulation domain (D01), and the land use pattern.
Remotesensing 14 02947 g001
Figure 2. Changes in growing season LAI from the 1990s to the 2010s.
Remotesensing 14 02947 g002
Figure 3. Relationship between simulated T2 and observed T2 (a), simulated precipitation and observed precipitation (b), from 2011 to 2018.
Remotesensing 14 02947 g003
Figure 4. Model-simulated differences in T2 (a) and TSK (b) due to vegetation changes in the growing season between scenarios of SL1990s and SL2010s.
Remotesensing 14 02947 g004
Figure 5. Model-simulated differences in the growing season net radiation (a), latent heat flux (b), and sensible heat flux (c) due to vegetation changes between scenarios of SL1990s and SL2010s.
Remotesensing 14 02947 g005
Figure 6. Model-simulated differences in ECAN (a), ESOIL (b), and ETRAN (c) due to vegetation changes in the growing season between scenarios of SL1990s and SL2010s.
Remotesensing 14 02947 g006
Figure 7. Model-simulated differences in precipitation (a), and soil moisture (b) due to vegetation changes in the growing season between scenarios of SL1990s and SL2010s.
Remotesensing 14 02947 g007
Table 1. Data source.
CategoryDataSpatial ResolutionPeriodsData Source
Land surface data (Two scenarios)LULC300 m1992, 2018Climate Change Initiative (CCI) of European Space Agency (ESA) (https://www.esa-landcover-cci.org/ (accessed on 25 June 2021))
LAI 0.05°1990–1999 *,
2010–2018 *
Global Land Surface Satellite (GLASS) (http://www.glass.umd.edu/
(accessed on 25 June 2021))
Albedo0.1°1990–1999 *,
2010–2018 *
ERA5-land (https://doi.org/10.24381/cds.68d2bb30 (accessed on 25 June 2021))
Model driving dataERA5 reanalysis dataset0.25°2010–2018European Centre for Medium-Range Weather Forecasts (ECMWF)
(https://doi.org/10.24381/cds.bd0915c6/ (accessed on 25 June 2021))
Model validation dataObserved meteorological data-2011–2018China Meteorological Administration (CMA) (http://data.cma.cn/en
(accessed on 25 June 2021)) & the Mongolian Academy of Sciences
* Multi-year monthly mean values in growing season.
Publisher’s Note: MDPI stays neutral with regard to jurisdictional claims in published maps and institutional affiliations.

