1. Introduction
In response to the rising human population and plateau of global capture fisheries production, aquaculture has a crucial role in providing an alternative food source, especially those dependent primarily on coastal resources for food such as Palawan’s population. Sustainable aquaculture has the potential to generate economic benefits to those coastal communities leading towards social and economic well-being.
However, the full potential of aquaculture gain cannot be achieved without efficient management and control of aquaculture resources and reduction in their environmental impacts [
1]. Solving these complex tasks requires utilisation of spatial information obtained by satellite remote sensing (RS) methods. The RS methods can be used: to ensure that there is sufficient separation between aquaculture objects and shipping routes; to check that there is no intrusion to marine protected areas; and to evaluate the impact of different environmental factors, such as marine fronts and currents, river outflows, and sediment concentration [
1].
Information about aquaculture is usually obtained through in situ observations or satellite remote sensing methods: the latter approach is less expensive and less time consuming. If processing can be automated, then it can be applied on a regular basis to map larger areas while minimising additional costs [
2,
3,
4]. Both multispectral optical and microwave synthetic aperture radar (SAR) sensors are used for this task [
4,
5]. The main advantages of SAR sensors are their ability to image through cloud cover and to provide regular sea surface observations during day and night, while optical sensors are strongly affected by clouds so cannot be applied regularly in tropical and sub-tropical regions.
The capabilities of SAR and multispectral optical sensors to detect mussel farms from space were investigated by Alexandridis et al. [
2]. In their experiment, the SAR images were pre-processed by a Lee-sigma filter to suppress speckle noise. Then, mapping of the mussel farms was performed visually by using photo-interpretation and on-screen digitising techniques. The long-line mussel farms were identified in SAR sensor images but not observed in optical images, even at higher spatial resolution. One of the main factors that adversely affected the detection of aquaculture structures in SAR sensor images was speckle noise, formed by the coherent interaction of microwaves. To reduce speckle in SAR images, Profeti et al. [
6] proposed a multivariate analysis technique. This technique was based on applying an averaging operator along the time dimension of a set of co-registered SAR images arranged in an ordered sequence. The position of an image in the sequence was defined by the time when it was acquired by the sensor, i.e., a time series. The approach based on processing the time series allowed Profeti et al. [
6] to improve the accuracy of mapping aquaculture objects without loss of spatial resolution, but the methodology still relied on visual interpretation of enhanced images. A similar approach was employed by Ottinger et al. [
5] for mapping aquaculture ponds in China and Vietnam using a time series of Sentinel-1 SAR data. To improve detection of aquaculture pond features, embankments, levees, and dikes, Ottinger et al. [
5] replaced the averaging operator with the time series median combined with a non-local mean filter to suppress speckle. Then, a Connected Component Segmentation algorithm was used for the automated segmentation of aquaculture ponds in SAR images. This technique was applied to process large volumes of SAR data and map coastal aquaculture over a large area. Sun et al. [
7] successfully implemented this methodology for the Google Earth Engine, while Prasad et al. [
8] extended it for mapping coastal aquaculture in India.
The methodology pioneered by Ottinger et al. [
5] is suitable for mapping inland aquaculture ponds of rectangular shape, but not for small inshore and offshore aquaculture objects located in the open sea, such as fixed net cages, longline rafts, floating houses, and other types of aquaculture structures that can be found in the coastal waters of the Philippines [
4]. These objects are traditionally made of bamboo sticks and can be characterised as having relatively low backscattering coefficients. They are relatively small and can occupy only several pixels in the medium resolution satellite SAR image. The detection of such small objects at the open water background is a challenging task. It was approached by Ariel Russell et al. [
9] by using the dual-polarisation signatures in Sentinel-1 SAR Single Look Complex (SLC) VV + VH images. They applied the unsupervised Wishart classification to dual-polarisation data to improve the accuracy of fish cage detection. However, the impact of wind and waves was not fully studied.
Ballester-Berman et al. [
10] applied dual-polarisation SLC Sentinel-1A data for mapping fish cages in the Norwegian fjords and floating mussel farms in Galicia, Spain. To classify aquaculture objects, a multi-stage procedure was proposed that included: estimation of dual-polarisation scattering matrix; polarimetric speckle filtering; decomposition of scattering matrix into Entropy (H), Anisotropy (A) and Scattering Mean Angle (α) components; and unsupervised Wishart classification of H/A/a components into 16 classes. Promising experimental results were obtained in [
10] for the round fish cages, but not for the mussel farm structures. It is worth mentioning that Ariel Russell et al. [
9] and Ballester-Berman et al. [
10] used separate SAR images and did not study a time series.
In this study, we developed a new methodology for automatic mapping of aquaculture structures in coastal and offshore environments based on the open access medium resolution Sentinel-1 SAR and Sentinel-2 MSI remote sensing data. The sequences of SAR images were processed over the selected time interval to reduce speckle noise and to discriminate static objects from moving objects, such as small vessels and yachts. The Sentinlel-2 MSI images were applied to discriminate land objects of relatively small size, including rocks and sand banks.
The methodology can be applied on a regular basis to monitor relocation of aquaculture cages and installation of new aquaculture structures or for evaluating the damage of aquaculture sites caused by storms, tsunamis, and other extreme events. In this study, the Sentinel-1 and Sentinel-2 data were processed to build a detailed map of aquaculture structures in Palawan, Philippines, in 2016 and 2019. The comparison of these maps revealed temporal changes in aquaculture structures over time. To our best knowledge these are the first maps of coastal aquaculture sites in Palawan based on Earth observation (EO) data.
2. Study Region
Although Palawan is one of the largest islands in the Philippines and possesses vast natural resources, the culture of fish species in the province is not intensive. Excluding seaweed culture, only about 600 metric tons of aquaculture species are being produced in the province, a majority of which is the green mussel, accounting for more than 200 metric tons. Many fish farmers in the province focus on seaweed culture, with their contribution to national production reaching approximately 342 thousand metric tons [
11].
In Palawan, aquaculture started in the early 1980s with the brackish water pond culture of the milkfish
Chanos chanos using fry collected along the shoreline of coastal communities using a fry bulldozer [
12]. In the late 1980s, the tilapia
Oreochromis mossambicus was introduced in Palawan for brackish water pond culture. Migrants from the Visayan region introduced milkfish and tilapia farming to the locals in Palawan. Tilapia was then polycultured with milkfish. The provision of the freshwater hatchery in the Western Philippines University (WPU) and Bureau of Fisheries and Aquatic Resources (BFAR) allows the culture of the Nile tilapia
Oreochromis niloticus and red tilapia hybrid, taken from SEAFDEC/AQD and Central Luzon in the mid-1990s.
The use of cages in culturing fish from fingerlings to marketable size is a popular venture for small- or large-scale commercial aquaculture [
13]. This industry has been practised in many countries such as Thailand, Singapore, Malaysia, Indonesia, and the Philippines [
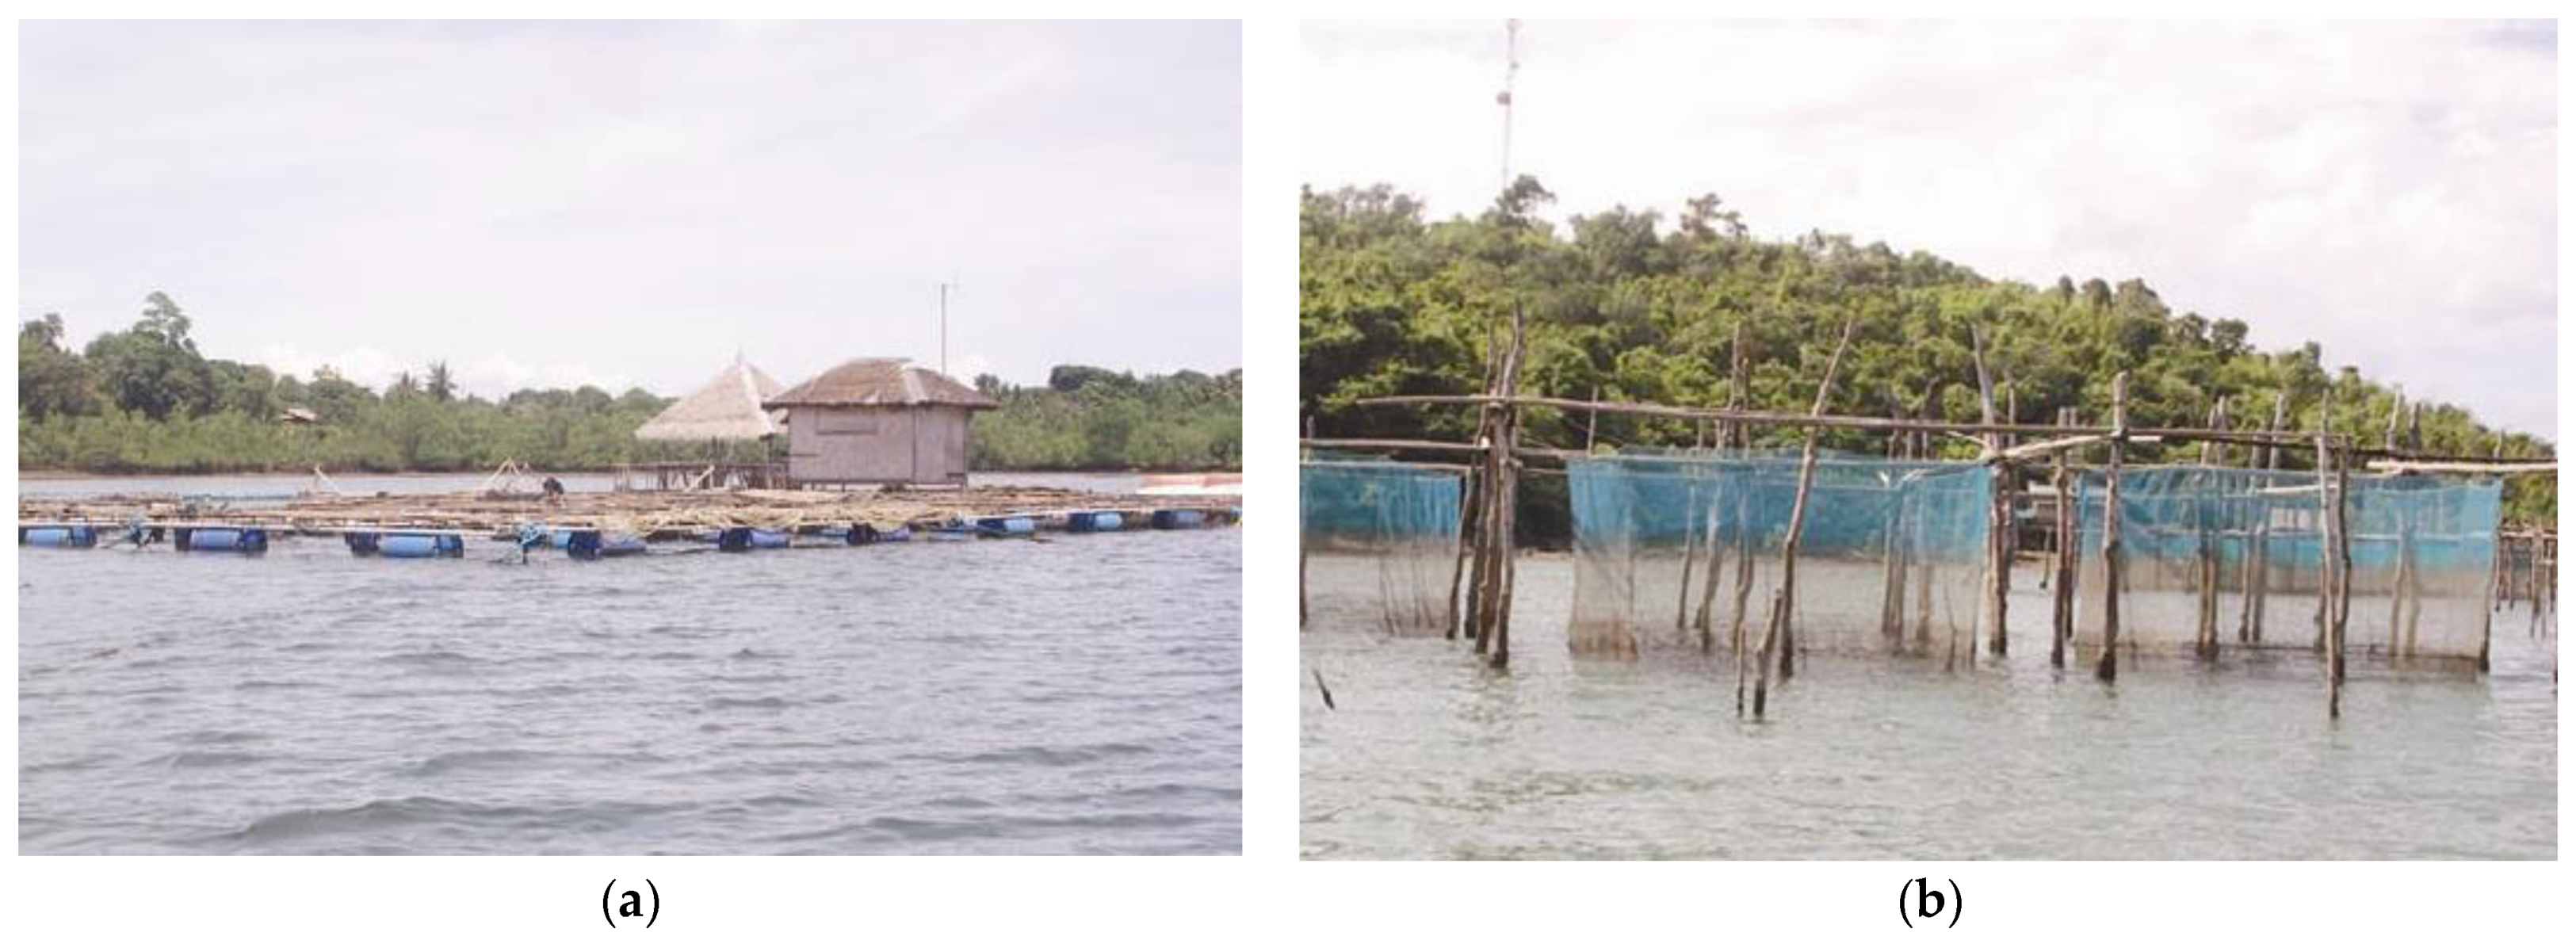
14]. Cage use in fish culture in Palawan is either fixed or floating net cages (
Figure 1). The former is supported by posts driven into the substratum, while the latter is supported by a buoyant collar or frame anchored to the bottom substrate [
15]. Grouper is the most preferred cultured fish in Malampaya Sound, using mainly fixed cages. Its popularity is attributed to its high demand in both local and foreign markets. It is a highly esteemed food fish because of its size, good flesh, texture, and excellent taste.
3. Datasets
For mapping aquaculture sites, we used the Sentinel-1 SAR and Sentinel-2 multispectral instrument (MSI) sensors developed for operational needs of Copernicus, the European Union Earth observation programme. The images generated by these sensors were downloaded from the Copernicus Open Access Hub [
16].
The Sentinel-1 dataset for Palawan, Philippines, covered three time intervals: August–November 2016; August–November 2019; and April–July 2021. Of the two Sentinel-1 sensors, only Sentinel-1A provided coverage for Palawan. Sentinel-1A scenes of Palawan were acquired on the descending paths of the satellite every 12 days at around 21:50 Coordinated Universal Time (UTC).
Sentinel-1A SAR uses several operation modes depending on the geographical location. In the Palawan coastal zone, it operates in the Interferometric Wide Swath (IWS) mode with radar signal transmitted at vertical (V) polarisation and received at both vertical and horizontal (H) polarisations. The IWS mode can be recommended for mapping aquaculture structures, as the backscatter coefficient of aquaculture objects, mainly made of bamboo sticks, is higher at the VV polarisation, while the VH polarisation measures the multiple scattering effect.
In the IWS mode the Sentinel-1 sensor swath is 250 km wide. It is divided into several parts by using the technique called “Terrain Observations with Progressive ScansSAR (TOPSAR)”. ESA uses two formats for the Sentinel-1 SAR data in IWS mode: Single Look Complex (SLC) data format at a sensor maximum spatial resolution of 3 m in the range direction and 20 m in the azimuth direction, and Ground Range Detected High-Resolution (GRDH) data format with the range resolution reduced to 20 m in the range and 20 m resolution in the azimuth. In this study, we applied the SLC product, as it has a better spatial resolution in the range direction. However, it takes more time to process the IWS data in the SLC format, as additional stages are required to combine different sub-swath images stored separately, to translate slant range coordinates to the ground range and to convert the data from complex to amplitude format.
The Sentinel-2 MSI sensor data were applied to discriminate land and water. To reduce processing time, we used the Sentinel-2 Level-2A Bottom of Atmosphere (BOA) corrected reflectance product available at the Copernicus Open Access Hub. The Level-2A images were already processed by the atmospheric correction algorithm, mapped to the Universal Transverse Mercator (UTM) projection, WGS 84 geodetic datum, and divided into tiles of size 100 × 100 km2. We additionally reduced the amount of downloaded data by selecting the images with cloud cover less than 15 percent. In total, 328 scenes were selected from January 2018 to January 2020.
The in situ data for this study were kindly provided by the Western Philippines University.
4. Methods
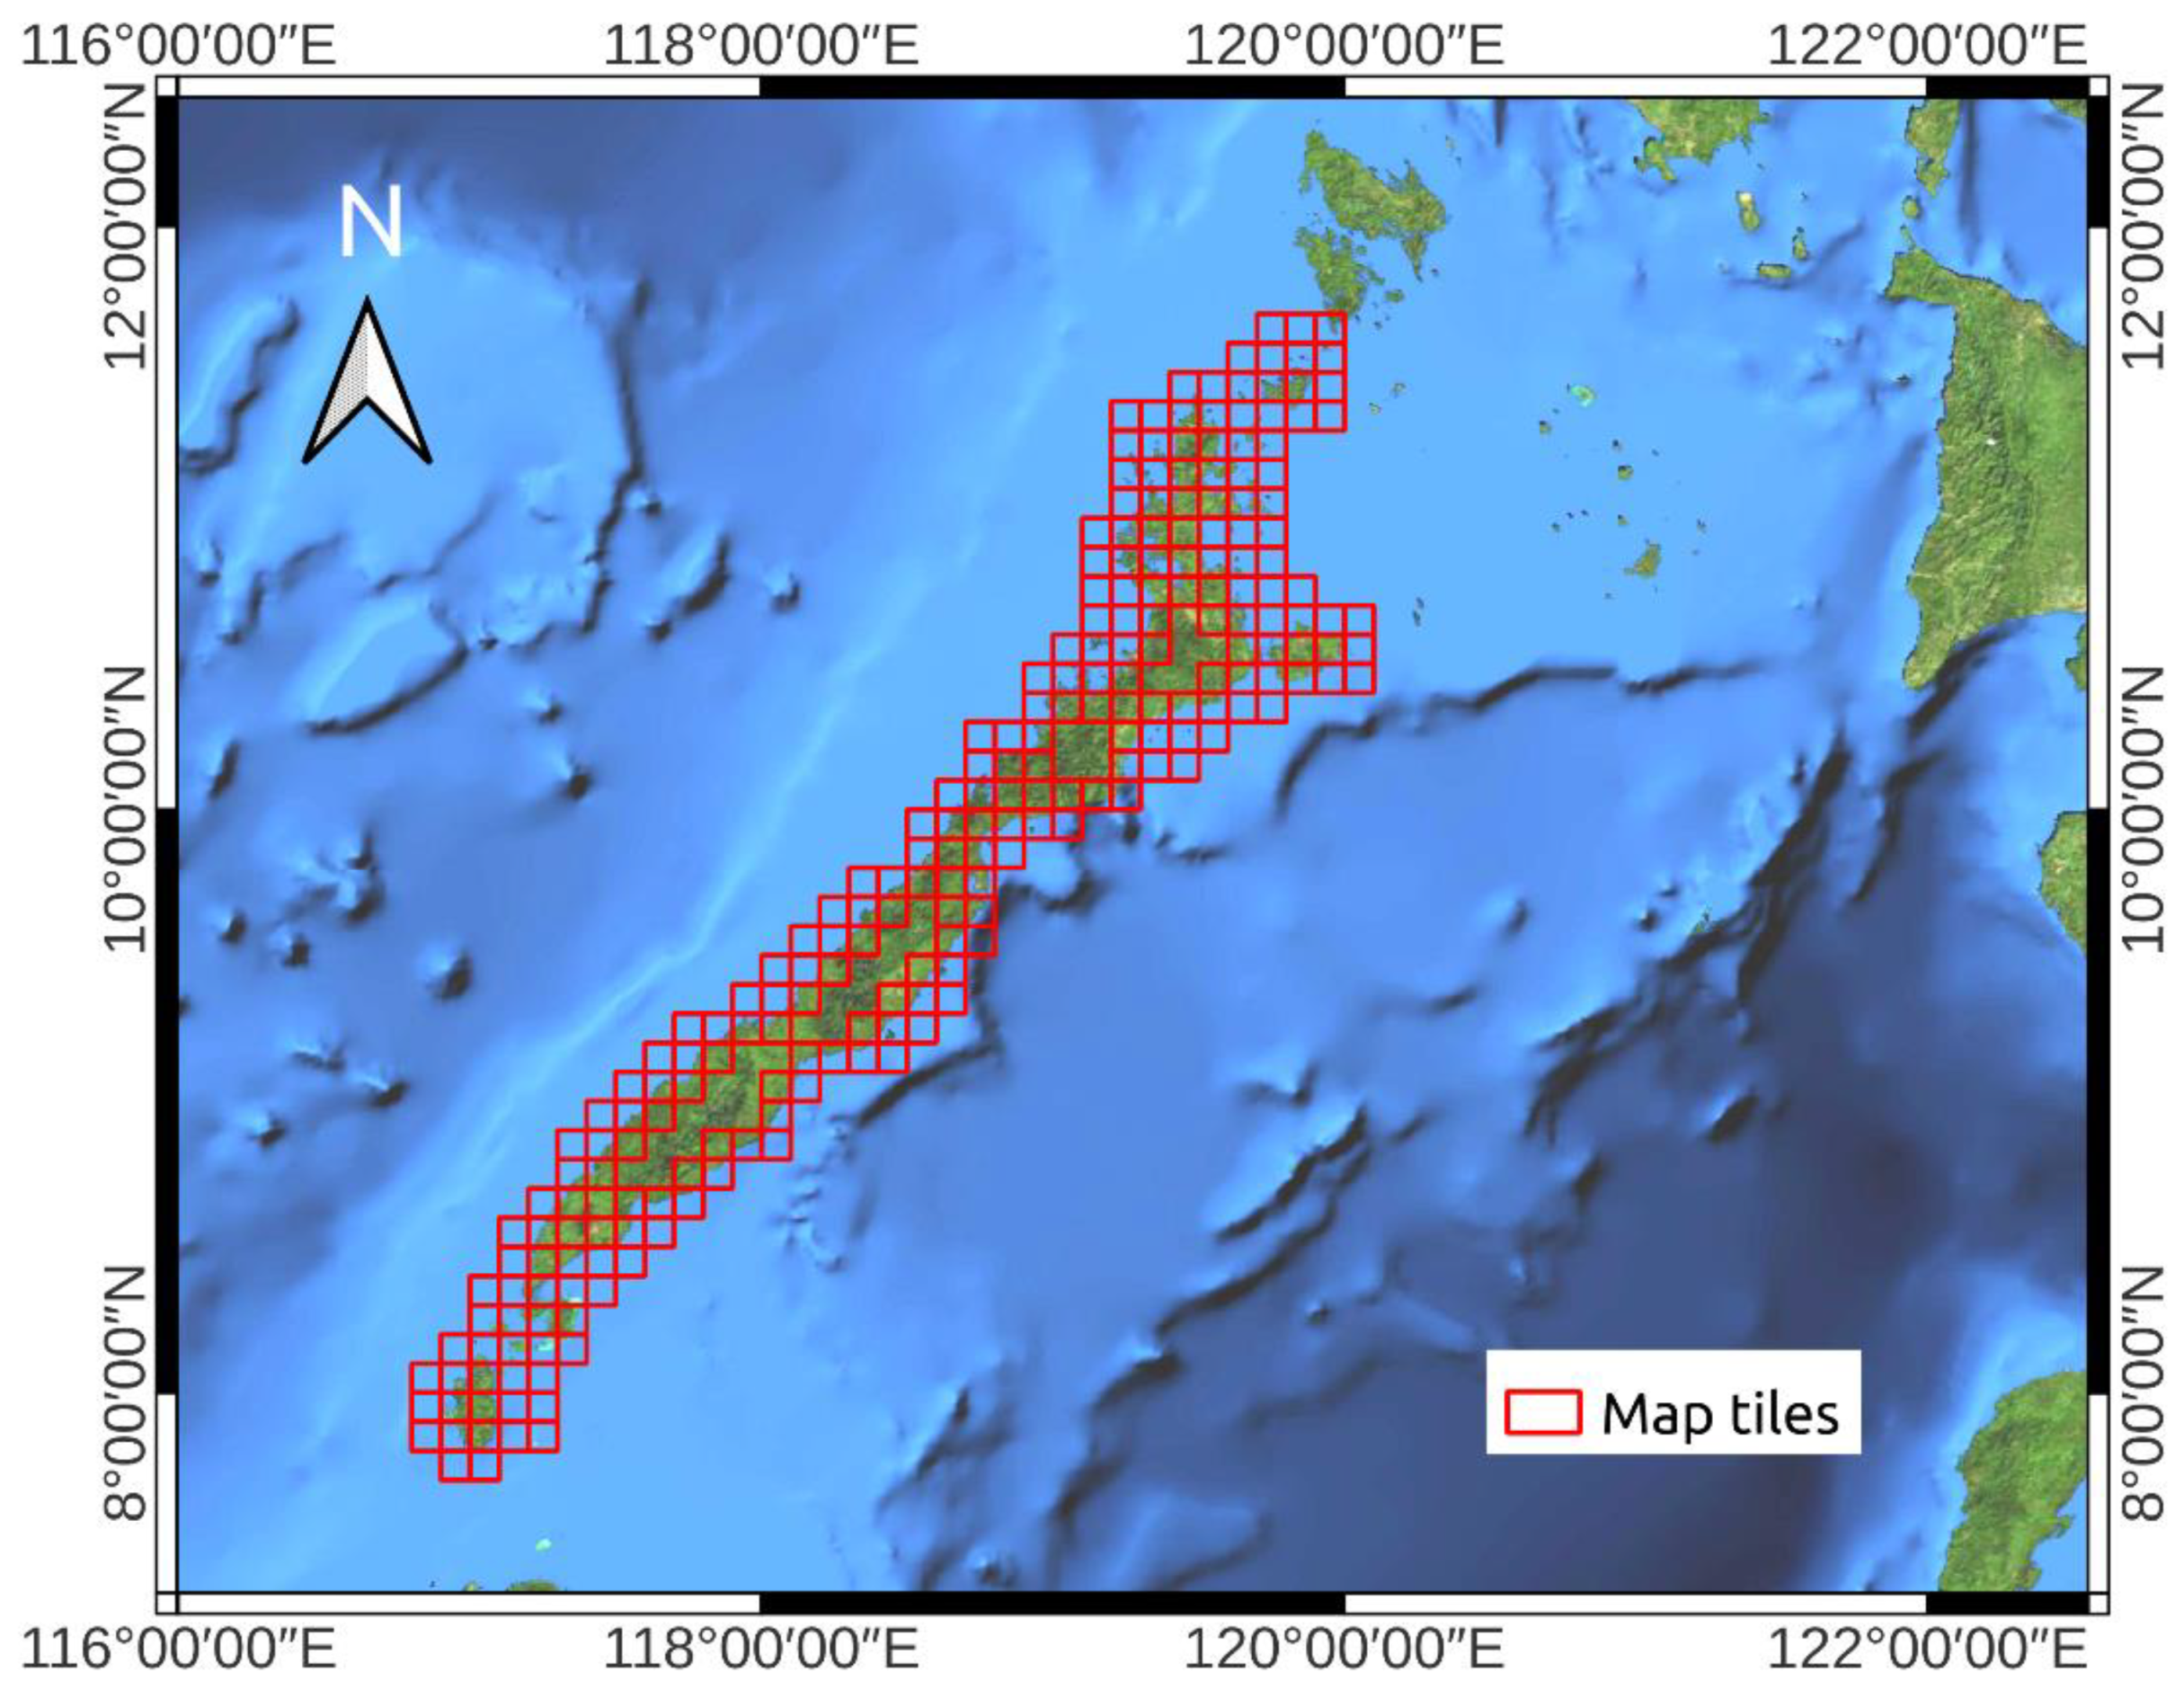
The methodology for processing EO data was adapted to relatively large volumes of data generated by Sentinel-1 SAR and Sentinel-2 MSI sensors. For example, the average size of the Sentinel-1 SLC product varied from 3.3 to 3.9 Gigabytes and so it was not possible to keep all the processed data in the computer memory. To overcome this limitation, we decided to split the processed scenes into multiple tiles of equal size, as shown in
Figure 2, and processed each tile separately.
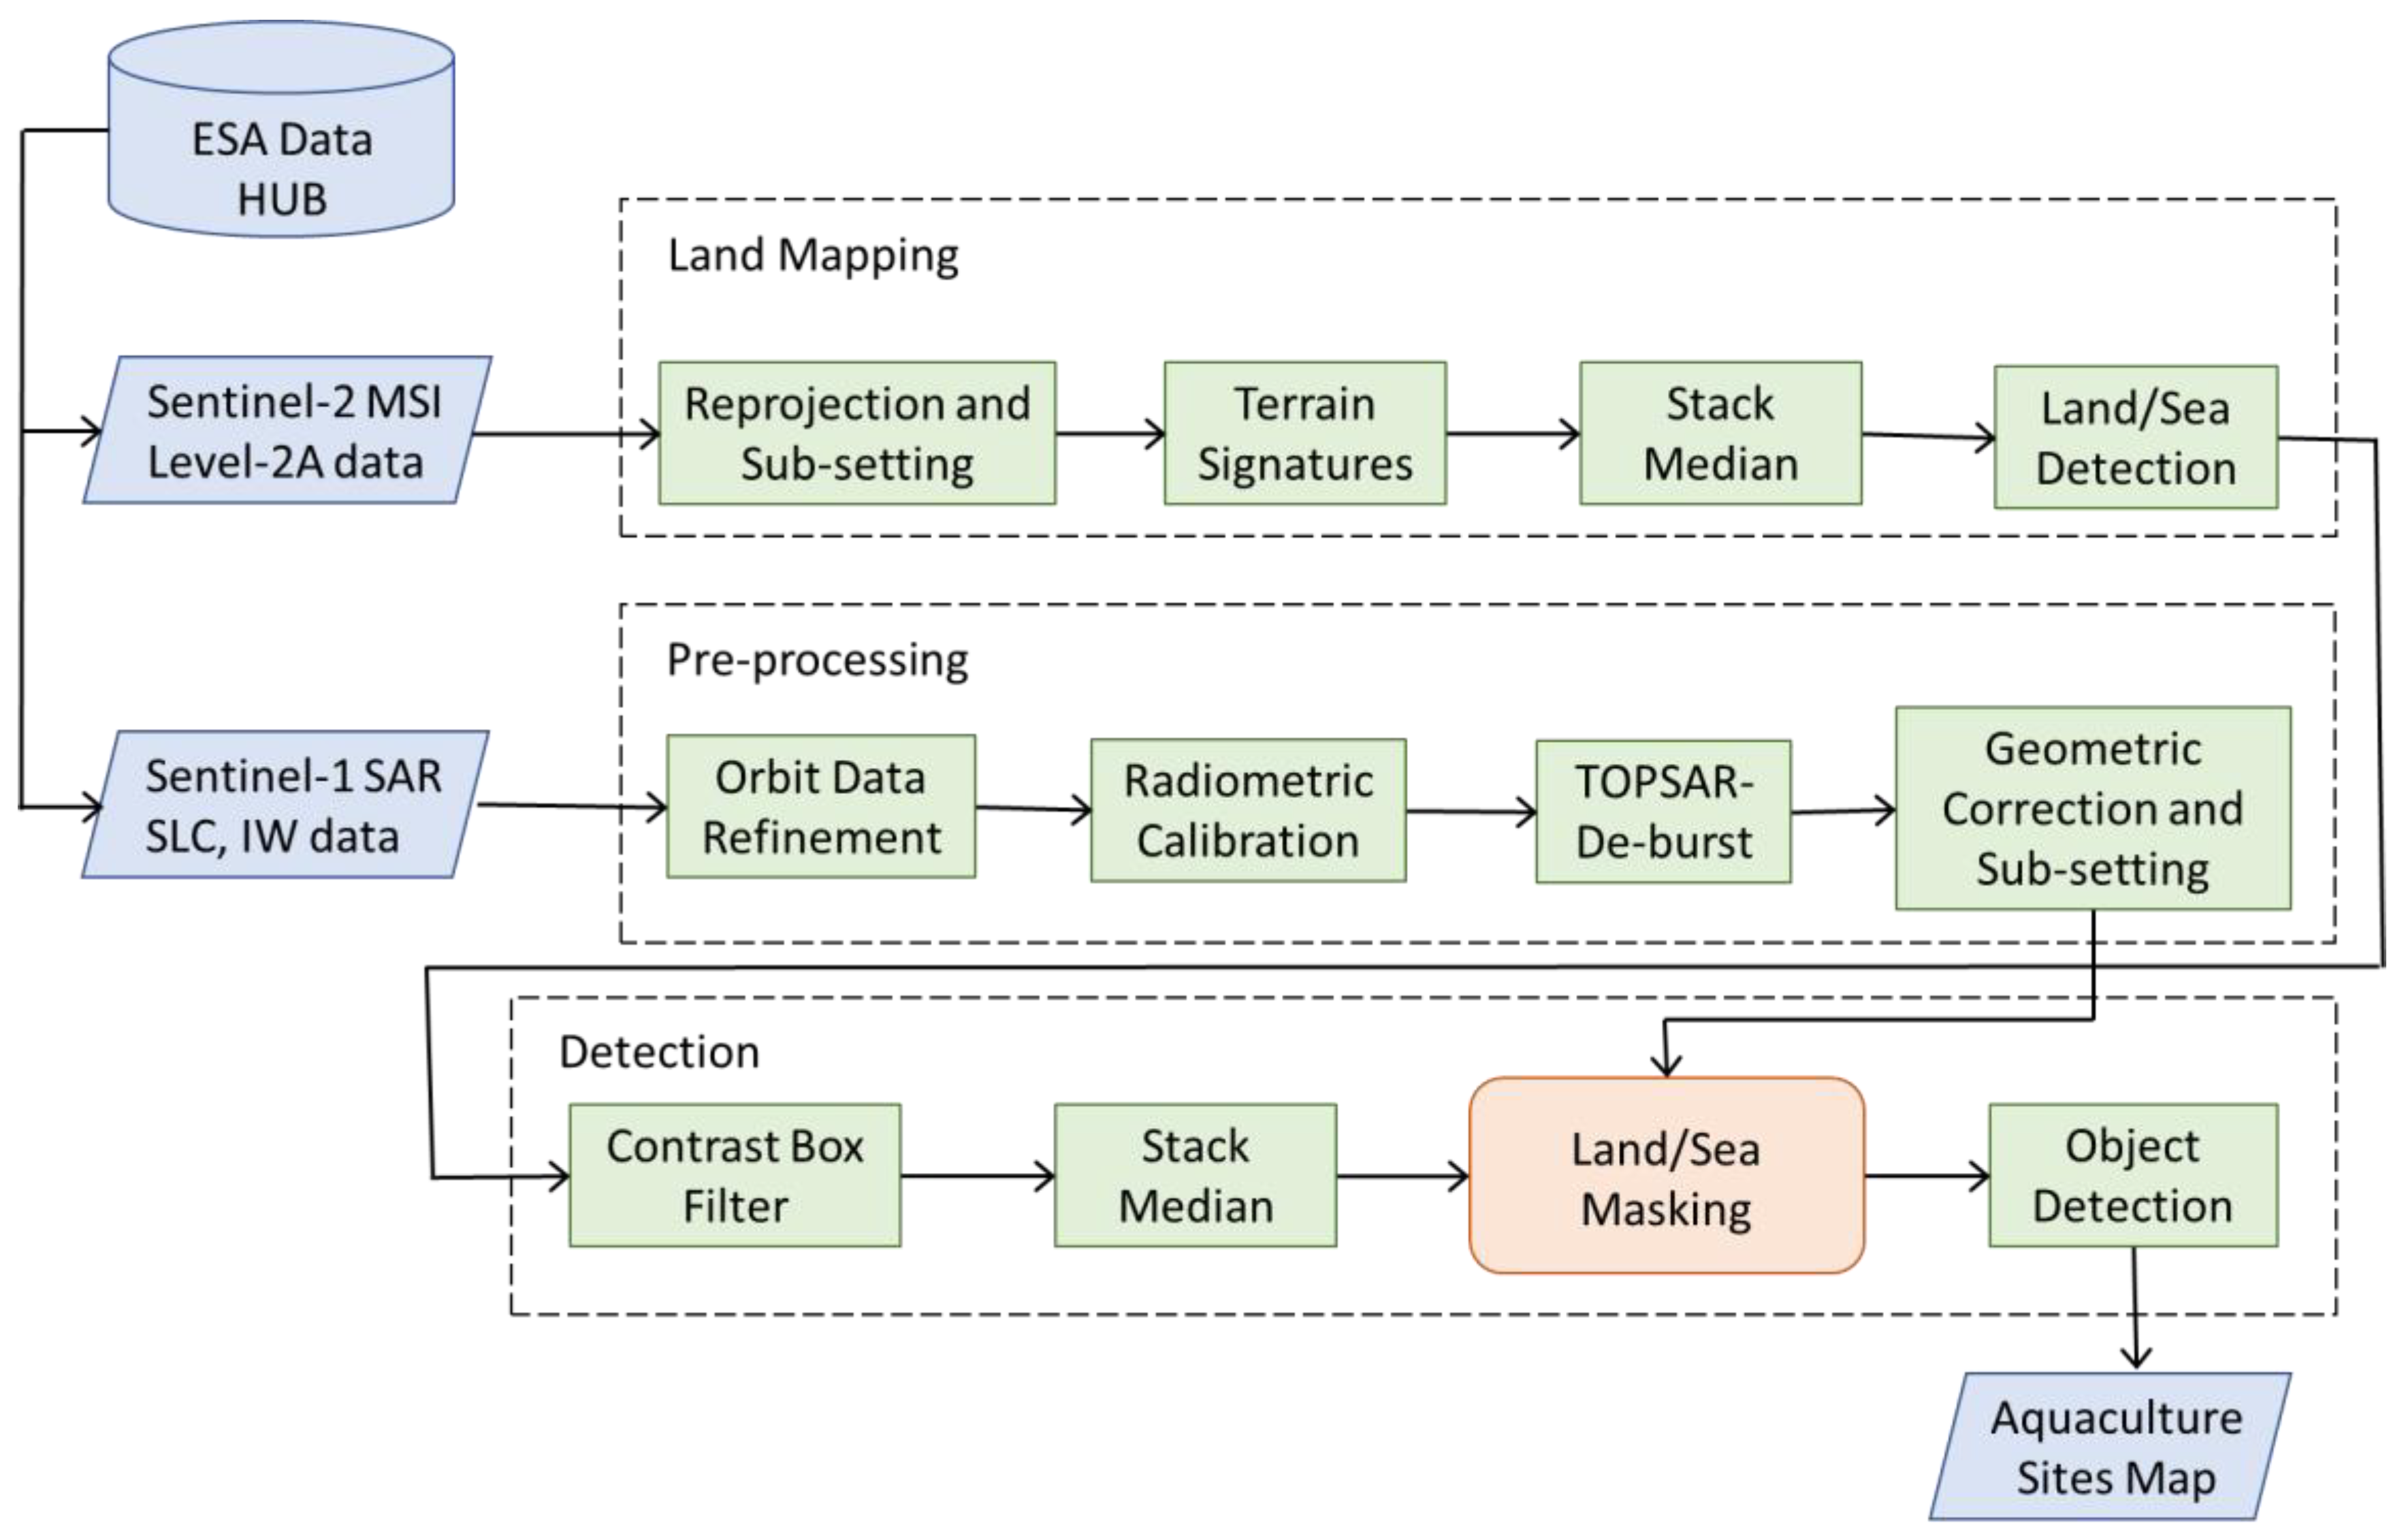
The developed methodology consisted of multiple processing stages. These stages were integrated into a processing chain that was run automatically to generate aquaculture maps. This processing chain is illustrated in
Figure 3. It is divided into two independent branches that can be run in parallel. One of the branches is responsible for processing Sentinel-1 SAR sensor data and the other one performs processing of Sentinel-2 MSI sensor data. The outputs of Sentinel-1 and Sentinel-2 processing branches are connected to the detection branch that eventually generates the aquaculture site map.
4.1. Sentinel-1 SAR Pre-Processing
The processing branch implements several operations on the Sentinel-1 SAR data downloaded from the Copernicus Open Access Hub, before running the object detection algorithm.
The first operation is refining the state vector data of the Sentinel-1 SLC product. The state vectors provided by ESA with the product were generally not accurate and were updated to improve the accuracy. The orbit data refinement operation was implemented using the ESA SeNtinel Applications Platform (SNAP) software package and Sentinel-1 Toolbox [
17]. This was followed by radiometric calibration of SAR images that converts the raw SAR data to absolute values of the backscatter coefficient. This operation was also implemented in SNAP. After calibration, the TOPSAR De-Burst algorithm [
17] was applied to SAR data to resample all images from different sub-swaths and bursts into a common spacing grid in range and azimuth coordinates. At the final stage, the data were translated from the slant range to ground range coordinates and mapped into the geographic projection and WGS-84 coordinate reference system (CRS).
These processing stages were applied to all Sentinel-1 SAR images in a dataset before moving to the detection stage (see
Figure 3).
4.2. Sentinel-2 MSI Processing and Land Masking
The Sentinel-2 data were processed to generate a land–water mask with a spatial resolution of 10 m (comparable to 20 m spatial resolution of Sentinel-1 SAR data). At the next stage, the generated land–water mask was combined with the map of objects detected in SAR data. This helped to reduce false alarms produced by small rocks and islands and shallow water regions detected by SAR sensors near the coast
The discrimination algorithm, implemented in the Sentinel-2 processing branch, is based on a calculation of water index, defined as the ratio of the spectral bands that are sensitive to water content. Many water indexes were proposed in the literature, such as the Normalised Difference Water Index (NDWI) [
18], New Water Index (NWI) [
19], and Automated Water Extraction Index for Non-Shadow Areas [
20]. The efficiency of these methods depends on many factors, such as water reflectance properties, land vegetation coverage, and soil composition. For the aquaculture mapping task, it was important to achieve higher spatial resolution of the land mask. Only the visible and near-infrared (NIR) bands could be used to provide 10 m spatial resolution. The NDVI [
18] uses visible “Green” and NIR bands to emphasise water features, but application of a visible “Blue” band as the alternative to “Green” may have benefits in the waters with relatively low chlorophyll and sediment concentrations. For discrimination of land and water in Sentinel-2 data, we applied a modified NDWI (MNDWI), where “Green” Band3 was replaced with “Blue” Band2 and NIR Band8 (864 nm) was used instead of SWIR spectral band:
As the water body strongly absorbs the incident light in the NIR band and has much higher reflectance in the “Blue” band, the values of water index (1) are higher for water and lower for land. For aquaculture structures these values are relatively high, since these objects are partly submerged in water and the size of their components is small compared to sensor spatial resolution. Here, we presume that the water index (1) of aquaculture structures cannot be very different from the index of surrounding waters and that the aquaculture objects will not be mapped as land in the land–water mask.
The performance of MNDWI was evaluated in the coastal waters in Palawan, Philippines. The index in Equation (1) was compared with NDWI [
18] based on “Green” and NIR spectral bands, and it was shown that MNDWI provides similar and in some cases better performance, particularly for the places with small rocks and bare land.
The discrimination of land and water is carried out by applying a threshold
T = 0 to all MNDWI values, calculated in each pixel position of the Sentinel-2 MSI raster image:
The optimal threshold value in Equation (2) was evaluated experimentally by visual analysis of generated land masks and was set to
T = 0. The same threshold was recommended by McFeeters in [
18] for land discrimination using NDWI.
The land mask was generated from a series of Sentinel-2A and Sentinel-2B MSI images, pre-processed and composited together. To fill the cloud gaps, the images were selected over a sufficiently large time interval of two years and the scenes with cloud cover more than 15% were discarded. On average, about 10 scenes were composed for each tile of the land–water mask of size 0.1 × 0.1 degree.
The main data processing steps are shown in
Figure 3. Firstly, the Sentinel-2A and Sentinel-2B Bottom of Atmosphere (BOA) reflectance images (Level-2A data product) were selected and downloaded from the Copernicus Open Access Hub. The downloaded data were then mapped to the common coordinate system with the Sentinel-1 SAR images. Then, the water index map was calculated by applying Equation (1) to all pixels in the image. In addition, the following quality masks, provided with the Level-2A product, were applied to flag image pixels affected by clouds and other distortions:
- -
Cloud high probability (scl_cloud_high_proba);
- -
Cloud medium probability (scl_cloud_medium_proba);
- -
Cloud shadow (scl_cloud_shadow);
- -
Saturated or defective (scl_saturated_defective);
- -
No data (scl_nodata).
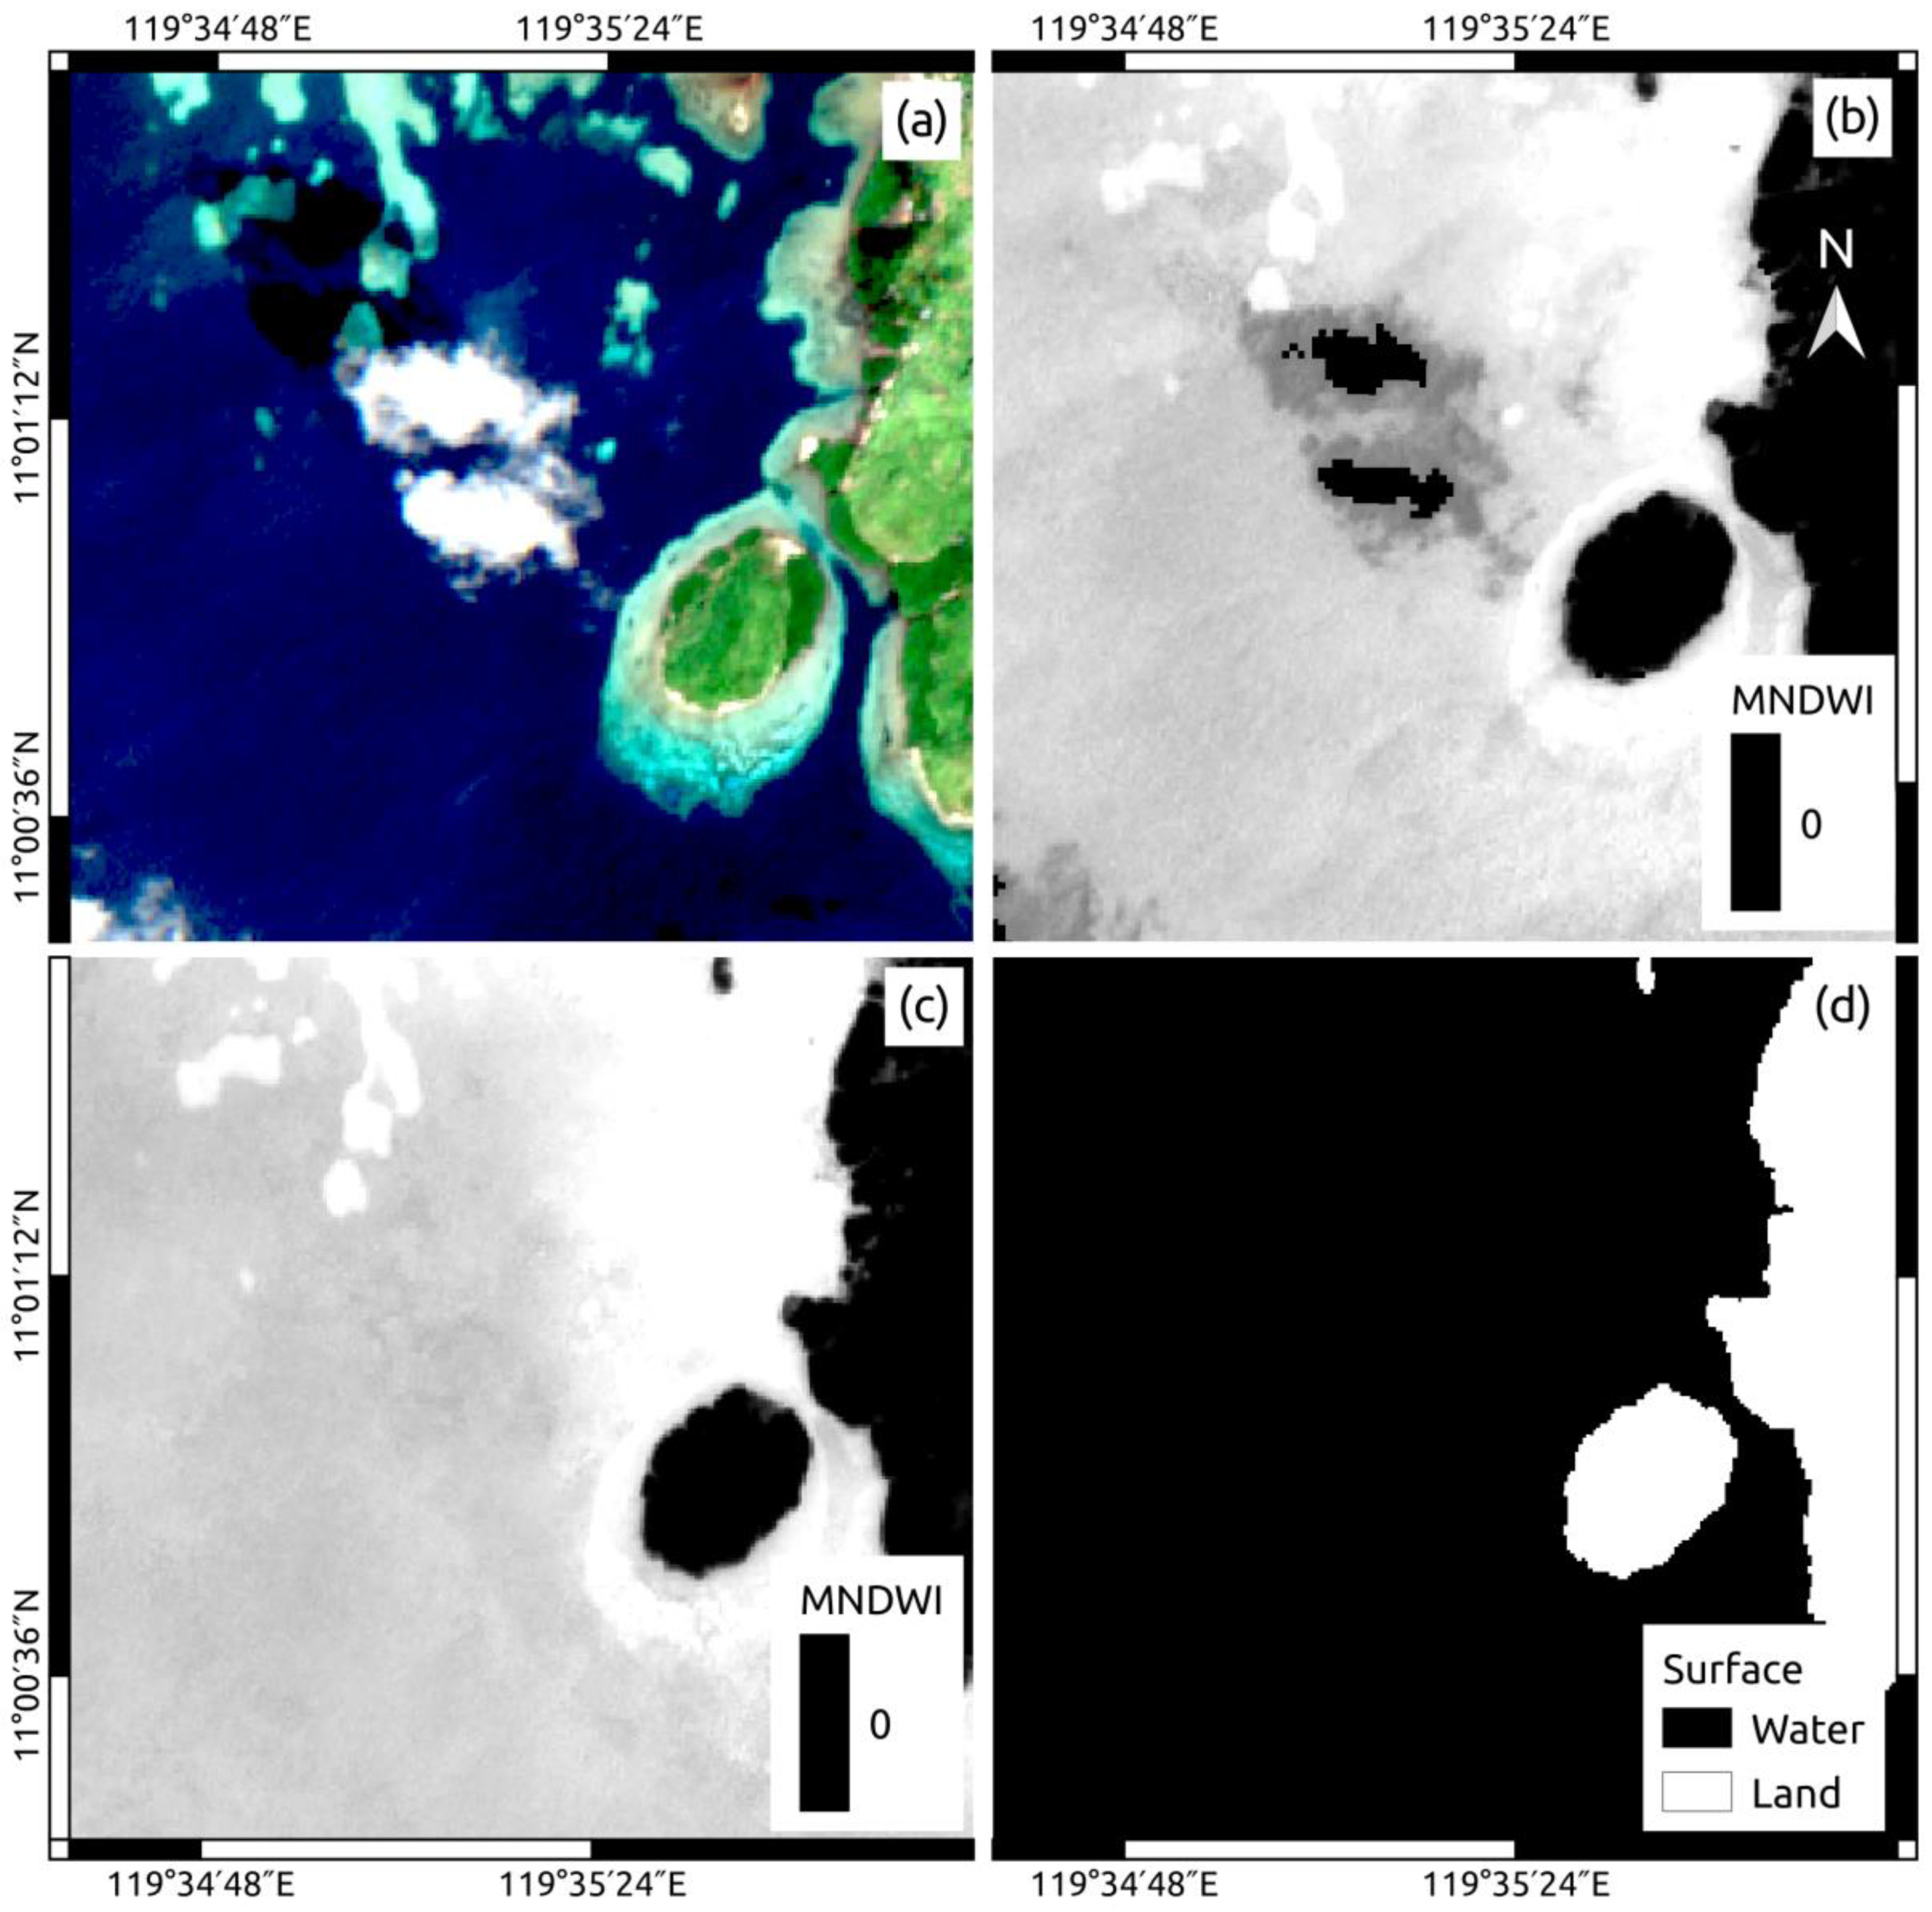
If any of these masks were set to “1”, the water index Equation (1) was automatically assigned a no-data value. At the next stage, all processed scenes (water index maps) were composited along the time dimension into a single scene by applying a median operator. The median was calculated after removing all non-data pixels. This ensures that the gaps produced by clouds and missing data are filled in the composite image. The described processing stages are illustrated in
Figure 4. The original Sentinel-2 BOA product is illustrated in
Figure 4a in colour, with Band2 shown in blue, Band3 in green, and Band4 in red. The modified water index calculated from these data using Equation (1) is presented in
Figure 4b. This figure demonstrates a clear discrimination between the water, with high water index values (bright pixels) and the land with much lower water index values (dark pixels). A median composite of a series of water index images is presented in
Figure 4c. The composite image has lower variation in water index values over the land and water and provides more accurate discrimination between these two classes of objects.
4.3. Aquaculture Object Detection
The aquaculture structures in Sentinel-1 SAR images are observed as small and bright objects on the darker background of surrounding waters. Other types of objects with similar backscattering characteristics include small vessels, yachts, and boats.
We applied a scene composite method for the discrimination of aquaculture structures and vessels, described as follows. A series of SAR images acquired over a relatively large time interval (several months) were combined into a single scene by the median operator. (A similar method was used in
Section 4.2 to generate a land–water map from Sentinel-2 MSI images).
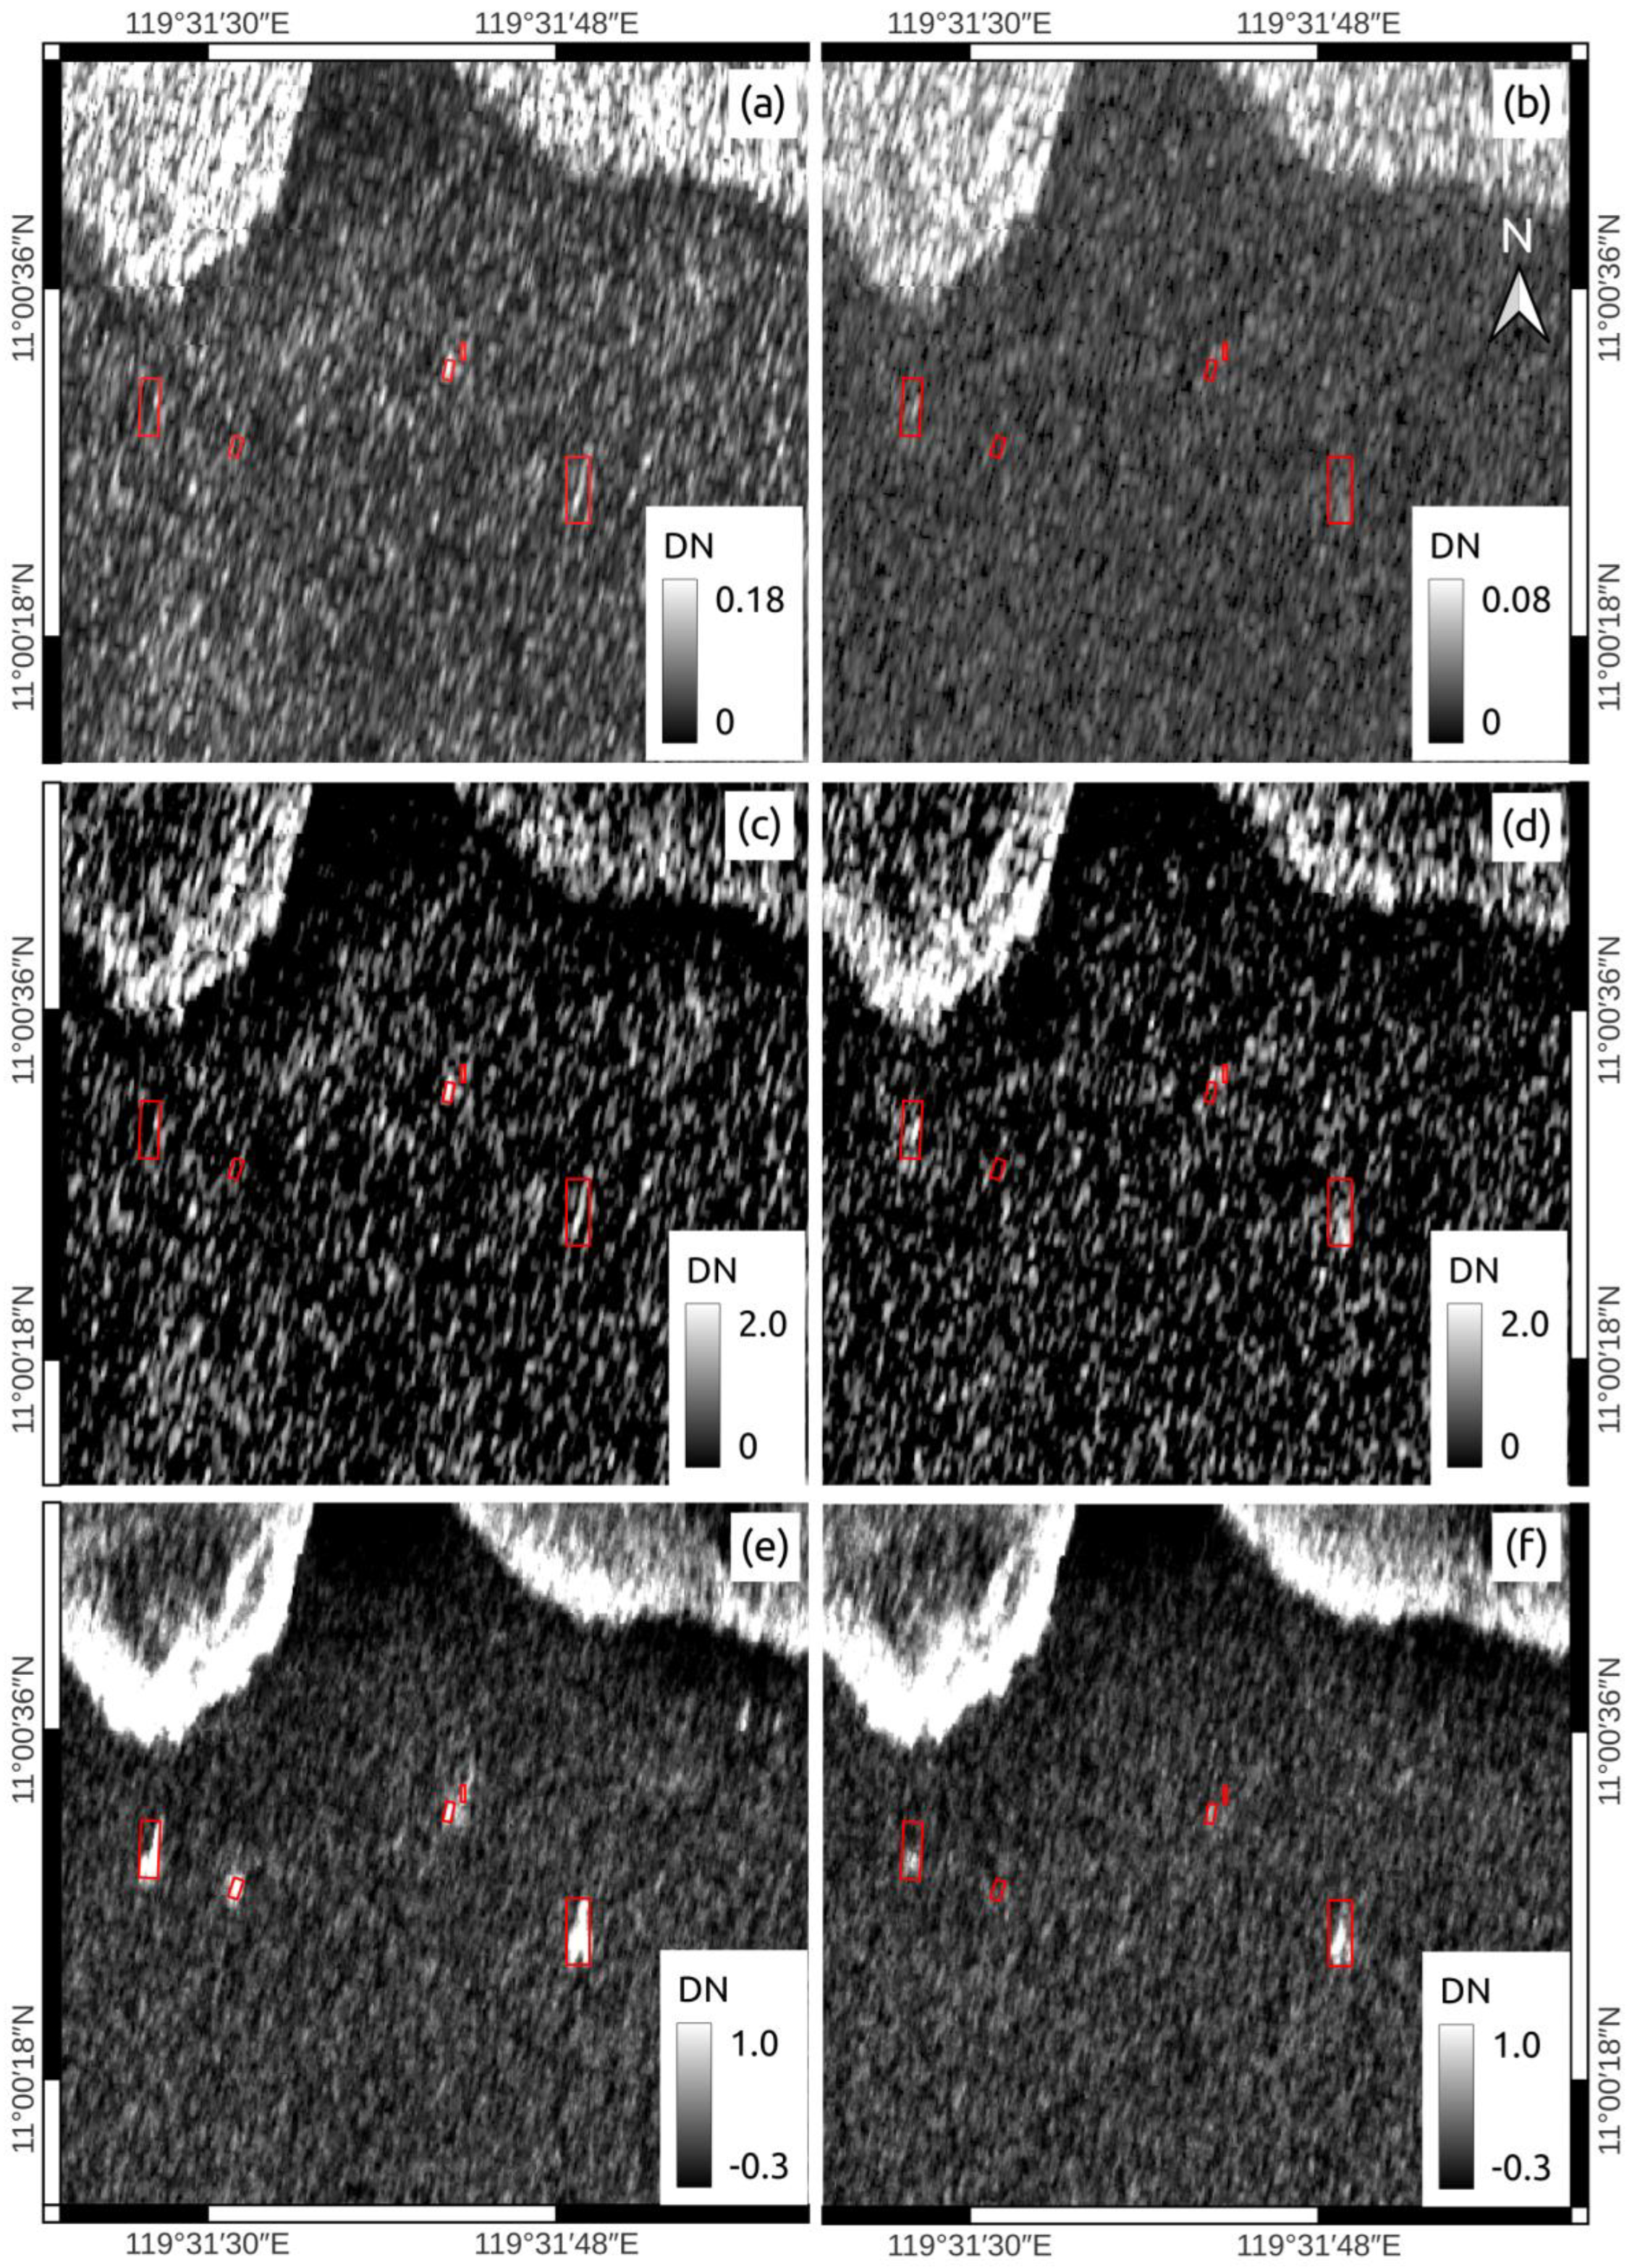
Static objects, including fish cages and caretaker sheds, were automatically retained in the composite image as they did not change their position quickly over time. The composite operator had an opposite effect on moving objects, including small vessels, yachts, and boats. As these objects changed their position over time, and they were automatically removed from the composite images by the median operator. An additional positive effect of composing multiple SAR images was achieved in suppression of speckle noise and improvement of object detection accuracy [
6]. This is illustrated in
Figure 5a,b, where the original SAR image, affected by speckle, is shown (VV and VH polarisations). The images processed by the box filter are shown in
Figure 5c,d, and the composite images are shown in
Figure 5e,f. It is seen in
Figure 5a,b that speckle noise significantly obscures small objects in SAR images. The objects are outlined in
Figure 5 in red. On the other hand, the composite image in
Figure 5e,f is less affected by speckle and the objects, such as fish corals, can be clearly seen.
Small rocks, coral reefs, and islands may also appear in the composite SAR images as bright objects and cannot be easily distinguished from aquaculture sites. However, the preliminary analysis of land masks, generated using Sentinel-2 MSI data (see
Section 4.2), revealed that most such objects were classified as land and removed by applying the land mask.
After land masking, the composite SAR images were processed to detect aquaculture objects and estimate their coordinates, dimensions, and orientation. The detection was carried out automatically and was based on the methodology that the authors previously developed for monitoring illegal fishing from space [
21]. This is shown in the diagram in
Figure 2 and includes several processing stages. Firstly, the contrast box detection filter [
22] was applied to discriminate small and bright objects in the pre-processed Sentinel-1 SAR images. It was adapted to image backgrounds of varying intensity and emphasises the objects of small size, as illustrated in
Figure 5c,d. The size of the box filter was set to 300 m for the background estimation window and to 1.5 m for the target estimation window. This filter was applied separately to VV and VH polarisation components of the SAR image. After all the SAR images within the specified time interval were processed with the contrast box detection filter, the data were stacked in a three-dimensional array, where two dimensions corresponded to image coordinates and the third dimension was associated with the time. The composite image was generated for VV and VH polarisations by calculating a sample median along the time dimension (see
Figure 5e,f). At the next stage, the VV and VH composite images were processed to detect aquaculture structures, which appear in the images as small bright blobs at the background of lower intensity. For detecting such objects, we adopted a constant false alarm rate (CFAR) multi-channel detection method applied to the VV and VH composite images [
21]. A morphological image filtering technique was applied to extract contours of detected objects and estimate coordinates, dimensions, and orientation of the detected objects [
21].
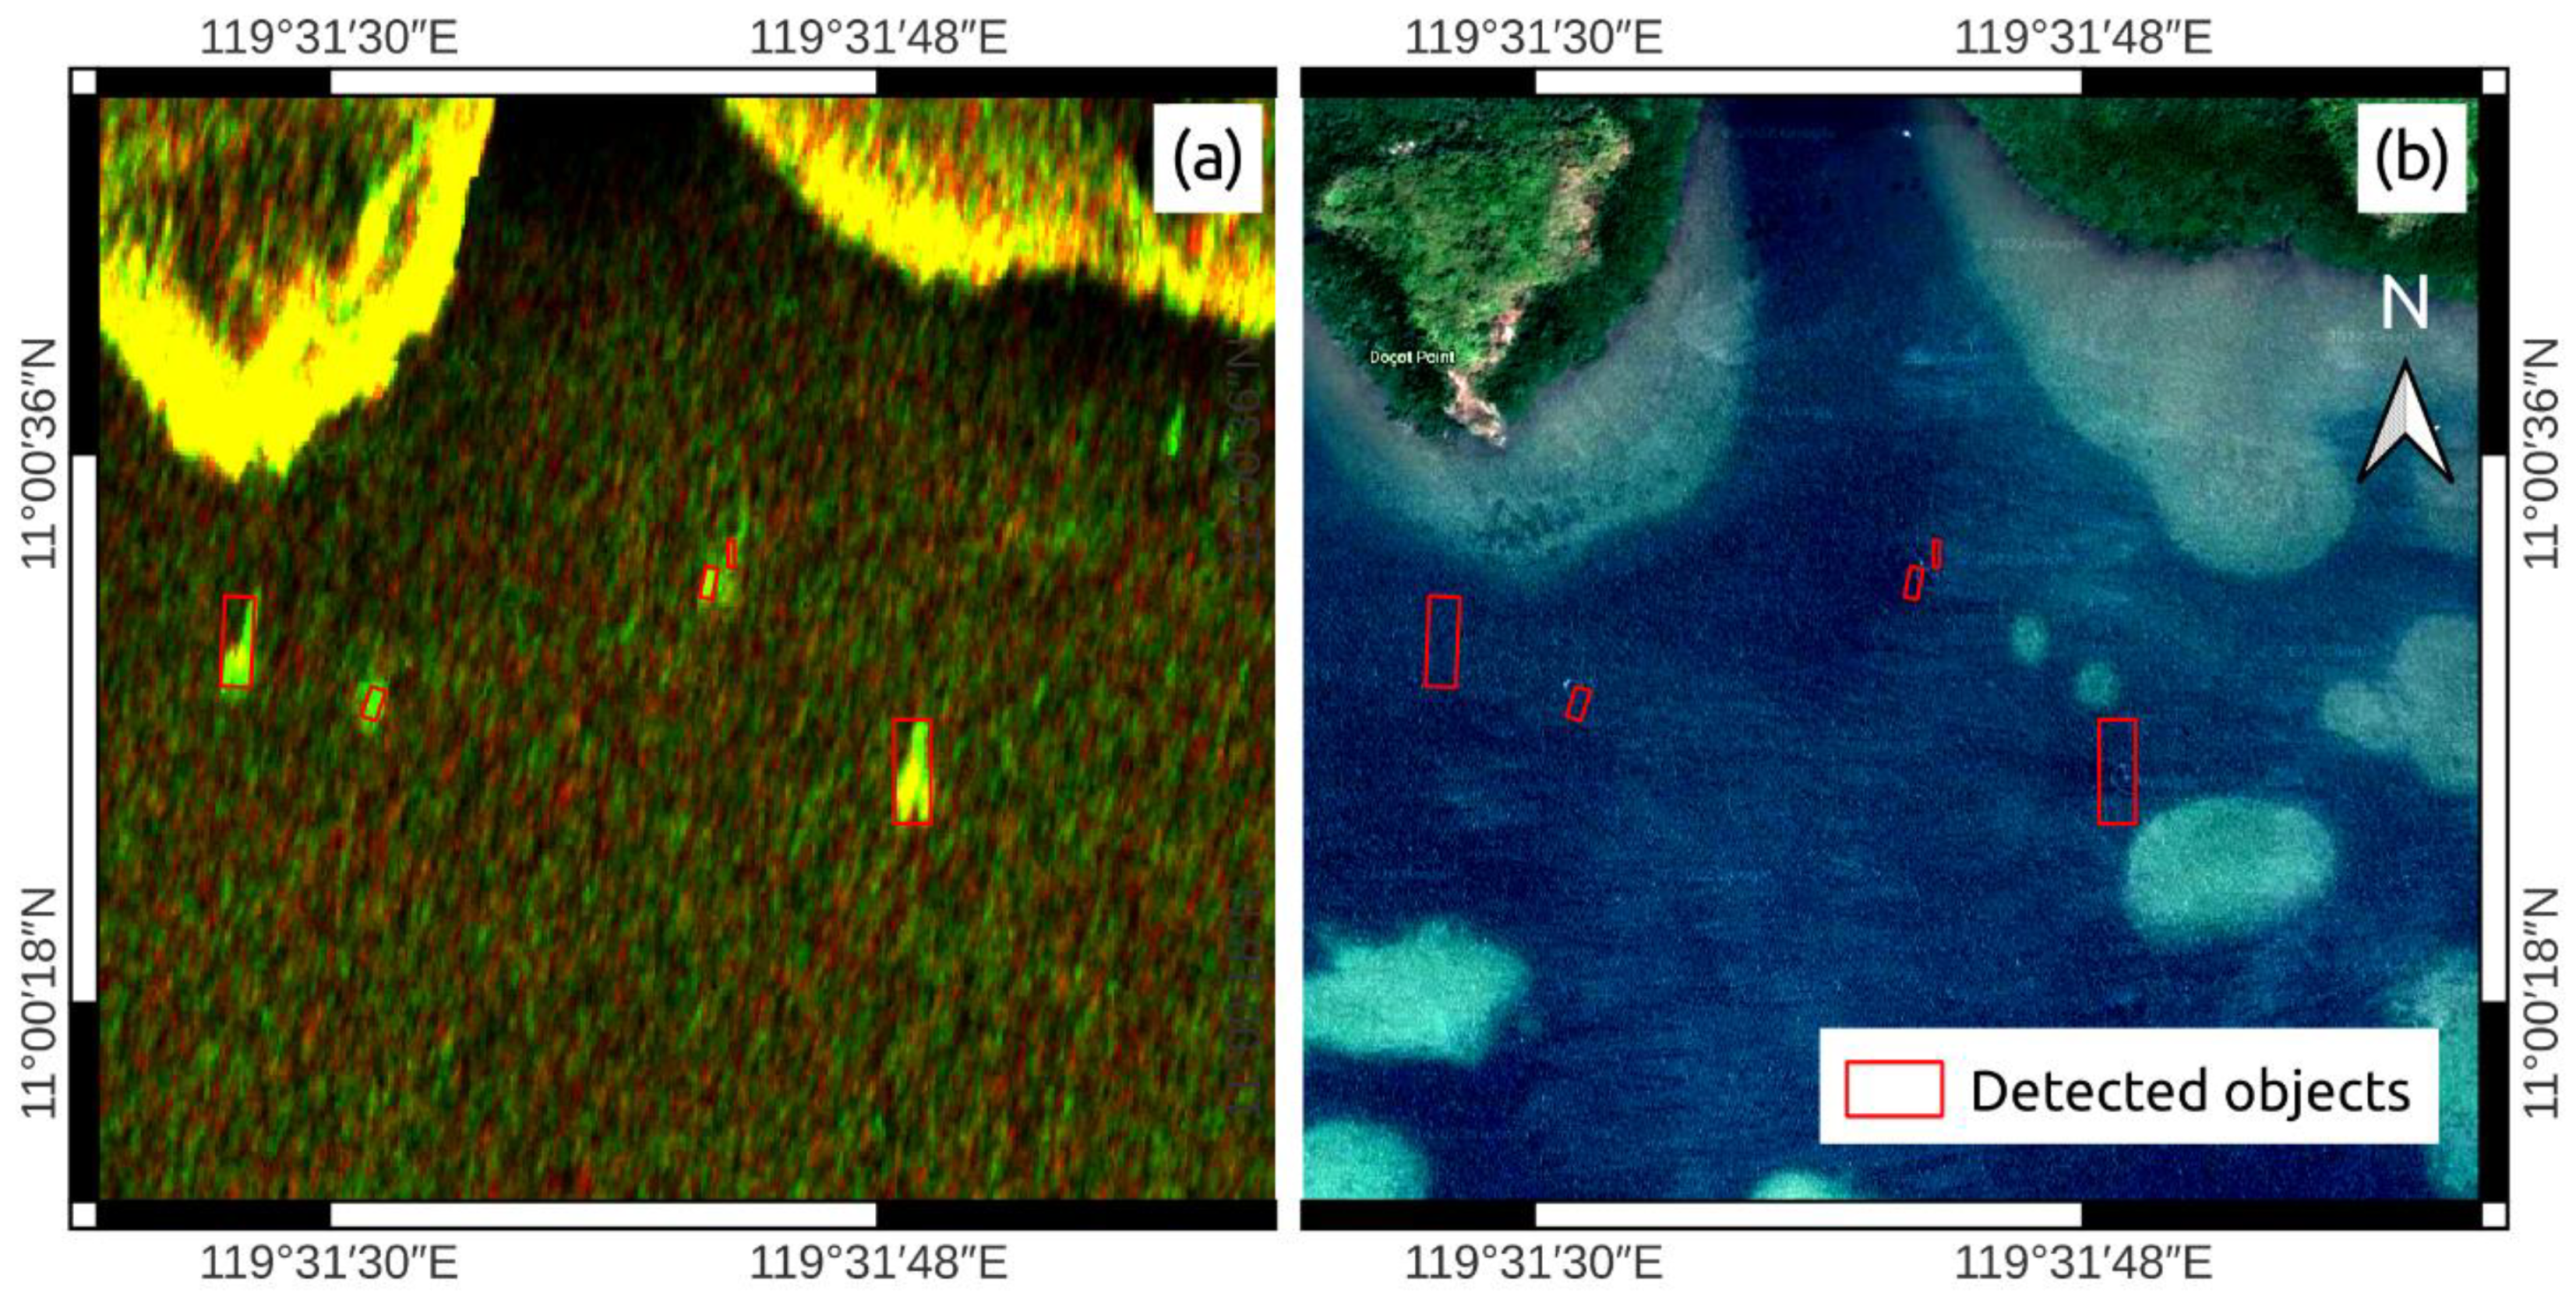
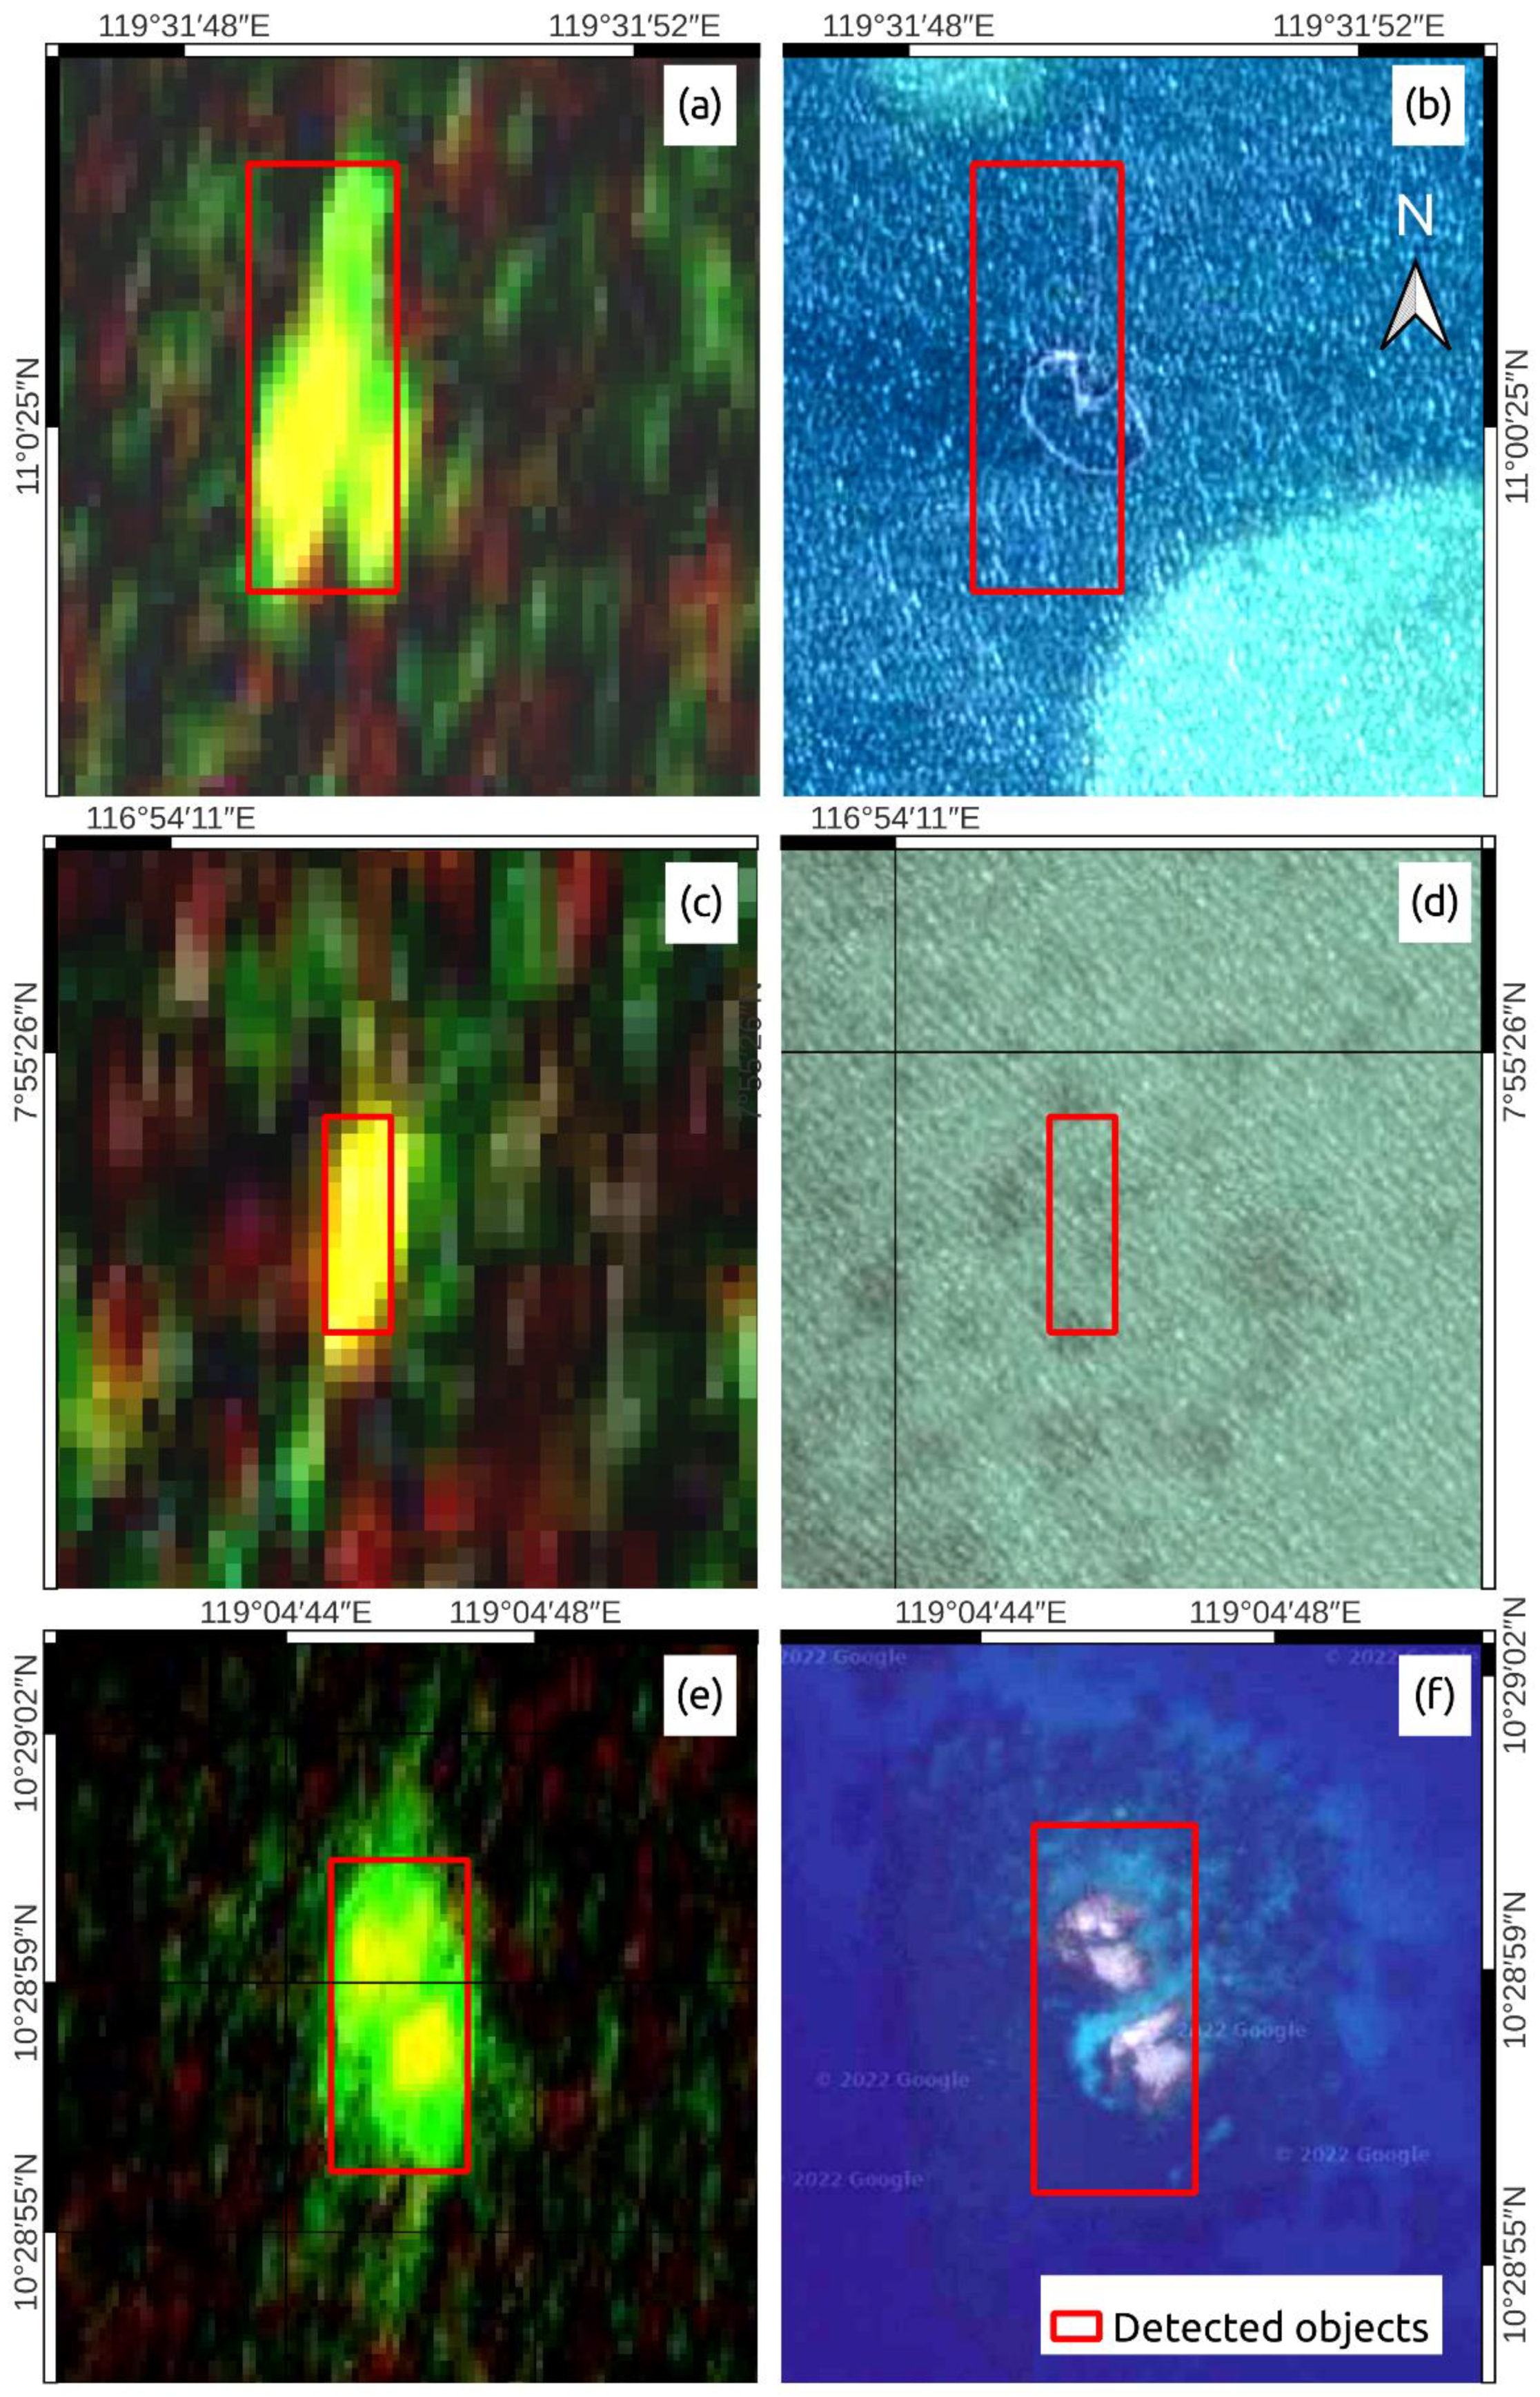
Figure 6 shows an example of applying this technique to VV and VH polarisation composite images in
Figure 5e,f.
The position, orientation, and dimensions of automatically detected objects are shown in the SAR composite image in
Figure 6a. It is seen in
Figure 6b that the detected objects are very difficult to observe visually in the Google Earth image even if their locations are already known from the SAR data. At the final stage of the detection algorithm, the aquaculture objects were discriminated based on the dimension feature: if the estimated size of the detected object was between 6 and 150 m, it was classified as an aquaculture structure; objects of other sizes were discarded.
5. Results and Discussion
5.1. Aquaculture Maps
The methodology was tested in the coastal waters of Palawan, Philippines. To monitor temporal changes in local aquaculture, several maps of aquaculture structures were generated using three time intervals: from August to November 2016, from August to November 2019, and from April to July 2021. The study area was extended about 11 km from the coast and covered around 14,000 sq.km. For the simplicity of data processing, this area was equally split into 231 tiles of size 0.1 degrees in latitude and longitude.
Figure 3 shows the map of Palawan with tiles outlined in red.
The land mask was generated separately for each tile by processing the Sentinel-2 MSI images covering the period from January 2018 to January 2020, as discussed in
Section 4.2. The mask data were stored in file formats: GeoTIFF (OGC Geotiff Standard, 2021) and Google Earth KMZ (Earth Outreach, 2021).
The Sentinel-1 SAR images acquired in the three periods were then processed to produce maps of aquaculture structures that were then stored in QGIS and Google Earth KML file format. The detected objects were outlined in the maps using rectangles and stored along with their attributes: coordinates, dimensions, and orientation. A separate layer was added to the maps to outline groups of densely located aquaculture structures. The groups were identified by calculating the nearest distance between the detected aquaculture objects and clustering the objects with a minimum distance of 1 km and minimum number of five objects in a group, using the Density-Based Spatial Clustering of Applications with Noise (DBSCAN) clustering algorithm [
23]. This algorithm has been successfully used in remote sensing over the last decade, as it provides significant advantages over the K-Means algorithm: it does not require the number of clusters in the data to be specified; it can find the clusters of arbitrary shape; and it is robust to outliers.
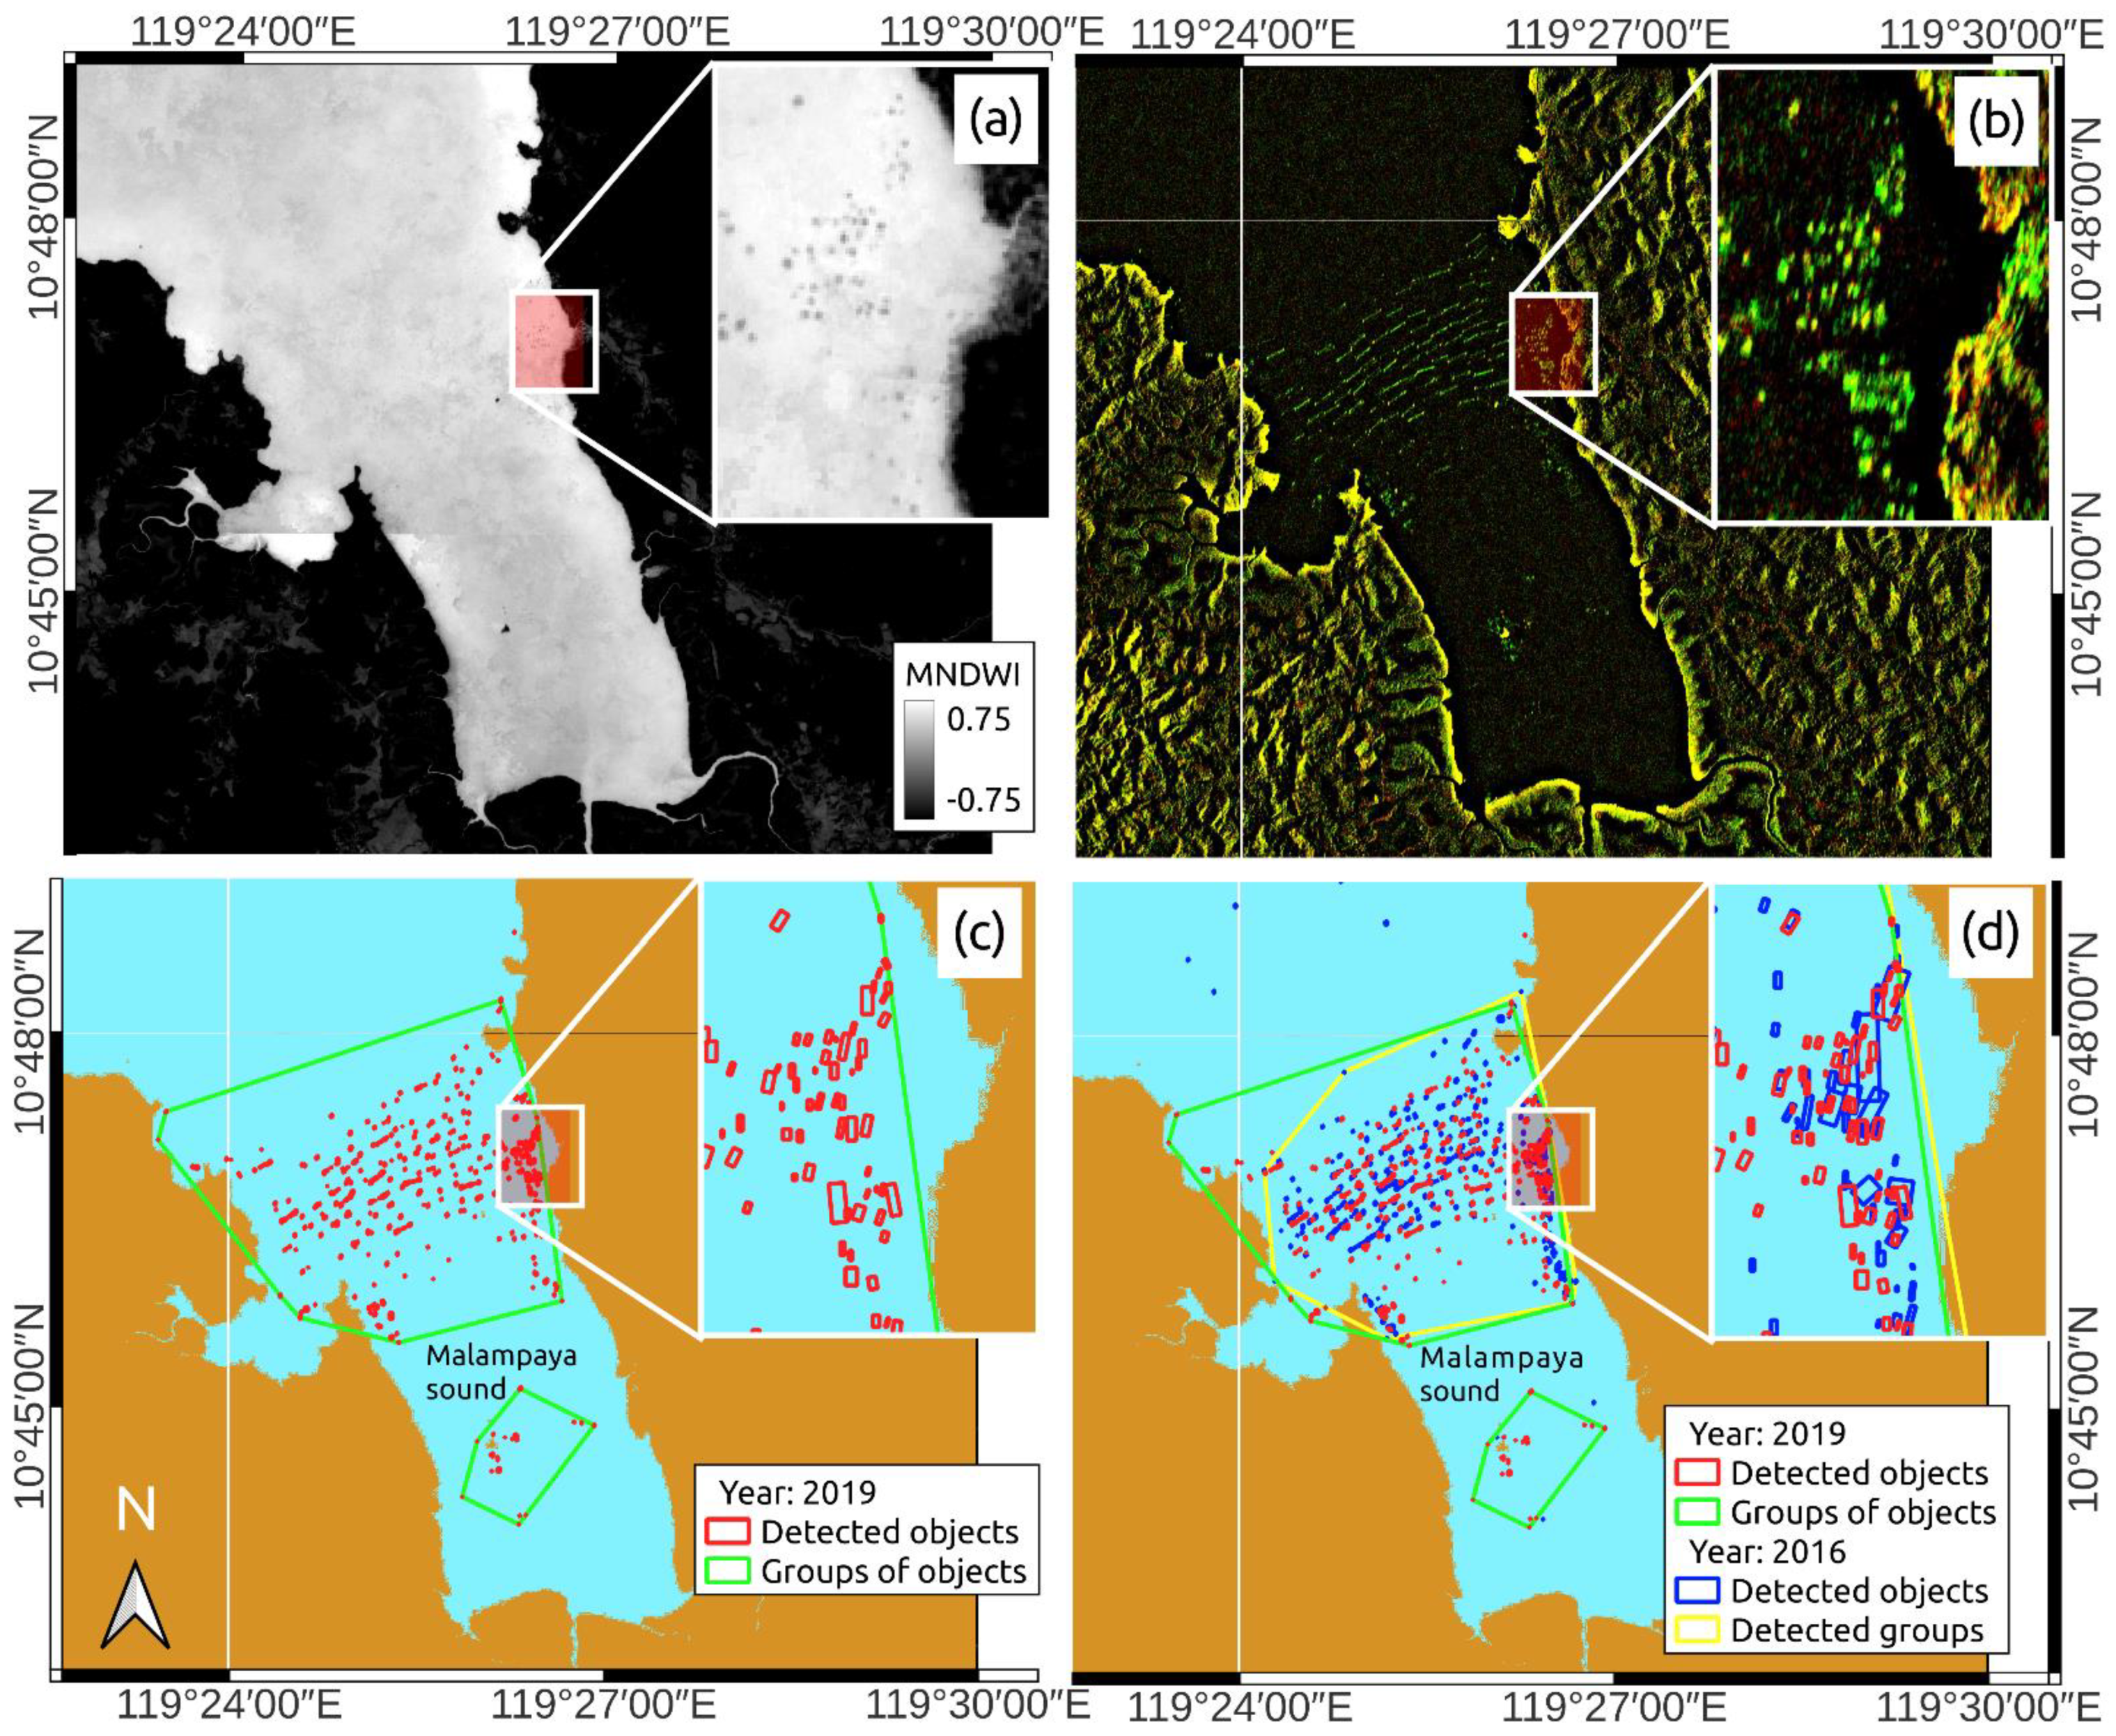
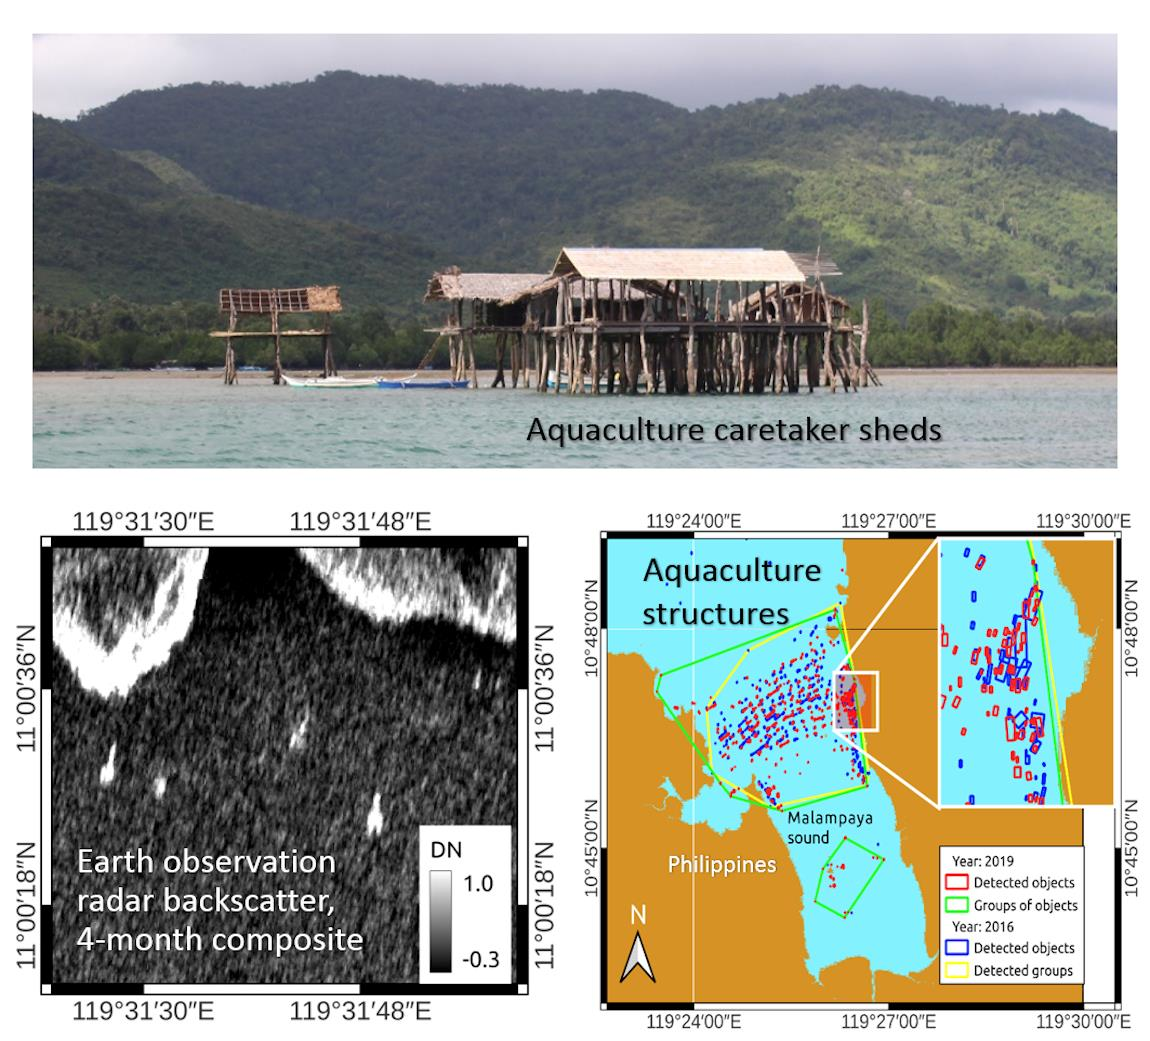
Figure 7 shows the maps for Malampaya Sound, the region known as the “fishing bowl of the Philippines” [
24]. A Modified Normalised Water Index (MNDWI) map of this region was obtained by applying Equation (1) to Sentinel-2 MSI data and is illustrated in
Figure 7a. A pink rectangle in the map indicates the a priori known location of aquaculture cages. In the MNDWI image, the cages are seen as grey dots in the brighter background. This shows that aquaculture objects in general may have reduced values of MNDWI compared to the water, but these differences are relatively small and do not affect the land mask in
Figure 7c, where the fish cages are masked as the water (in light blue).
In the composite Sentinel-1 SAR image in
Figure 7b the fish cages can be identified as bright blobs, concentrated in the middle of the Sound and along the coastline to the east. The colour of the blobs in the RGB image in
Figure 7b is green or yellow, meaning that the microwaves are backscattered from these objects at VH polarisation only or both VH and VV polarisations.
A map of aquaculture structures automatically detected by processing the composite image in August–November 2016 is shown in
Figure 7c. In the map the detected objects are shown in red, and the clusters of objects are outlined in green, while the land mask is presented in light brown. It is seen in the map that the concentration of aquaculture structures is especially high across the bay and near the coastal village to the east. To evaluate the changes in aquaculture of Malampaya Sound over time, we processed the Sentinel-1 satellite images acquired from August–November 2019 for exactly the same location. The aquaculture site map in
Figure 7d shows the objects from the map in
Figure 7c in red and the objects detected in August–November 2019 in blue. It is seen that by 2019 new structures were detected around Bangiluan Island and in coastal waters near the village. The position of many previously observed fish cages has also changed over time.
The comparison of the maps of aquaculture structures in years 2016 and 2019 reveals new objects deployed in Malampaya Sound and the objects that were moved to new locations. However, if the objects continued moving during the time interval when the satellite data were acquired (from August to November), these objects may not be detected. If the aquaculture structures were not staying at the same location for at least half the time of the analysed time series, they were suppressed by the median operator and did not appear in the composite image and the aquaculture map.
To reduce the chance that the detector will miss the aquaculture structure due to its transportation to a new position, we selected a relatively large interval for time series analysis. An interval of four months was considered sufficient to ensure that some movement of fish cages will not affect the detection results.
The maps in
Figure 7c,d show that the objects of about 6 metres in diameter were reliably detected in Sentinel-1 images. In other studies, the groups of aquaculture objects, such as fish cages, mussel farms, and other types of aquaculture objects, were successfully mapped using Earth observation (EO) data [
9,
10]. These groups of objects occupied at least several pixels in the image, so that spatial image filtering techniques could be applied to reduce speckle. In this study, we demonstrated that objects much smaller than the sensor spatial resolution element can be detected by applying time series analysis.
Sensor spatial resolution is not the only factor limiting the detection of aquaculture structures, as a small object can still be detected if it has high contrast. The contrast is related to object size [
22], but also depends on many other factors: object geometry; the material it is made of; the characteristics of the background; and technical specification of the sensor. However, object size is one of the most important object properties for the users of the service.
5.2. Validation
The maps of detected aquaculture structures in SAR images were validated by implementing two alternative scenarios. Firstly, the detected aquaculture objects were compared to the historical high-resolution optical satellite and aerial images provided by a Google Earth computer programme [
25]. The Google Earth images were collected by different airborne and satellite sensors and then merged together to produce a mosaic.
The spatial resolution of a mosaic image varied with location, but for the validation area in Taytay Bay, Palawan, the estimated resolution was about 0.4 m.
In the second validation scenario, the detected aquaculture objects were compared to in situ observations at Malampaya Sound.
5.2.1. Comparison with Google Earth Images
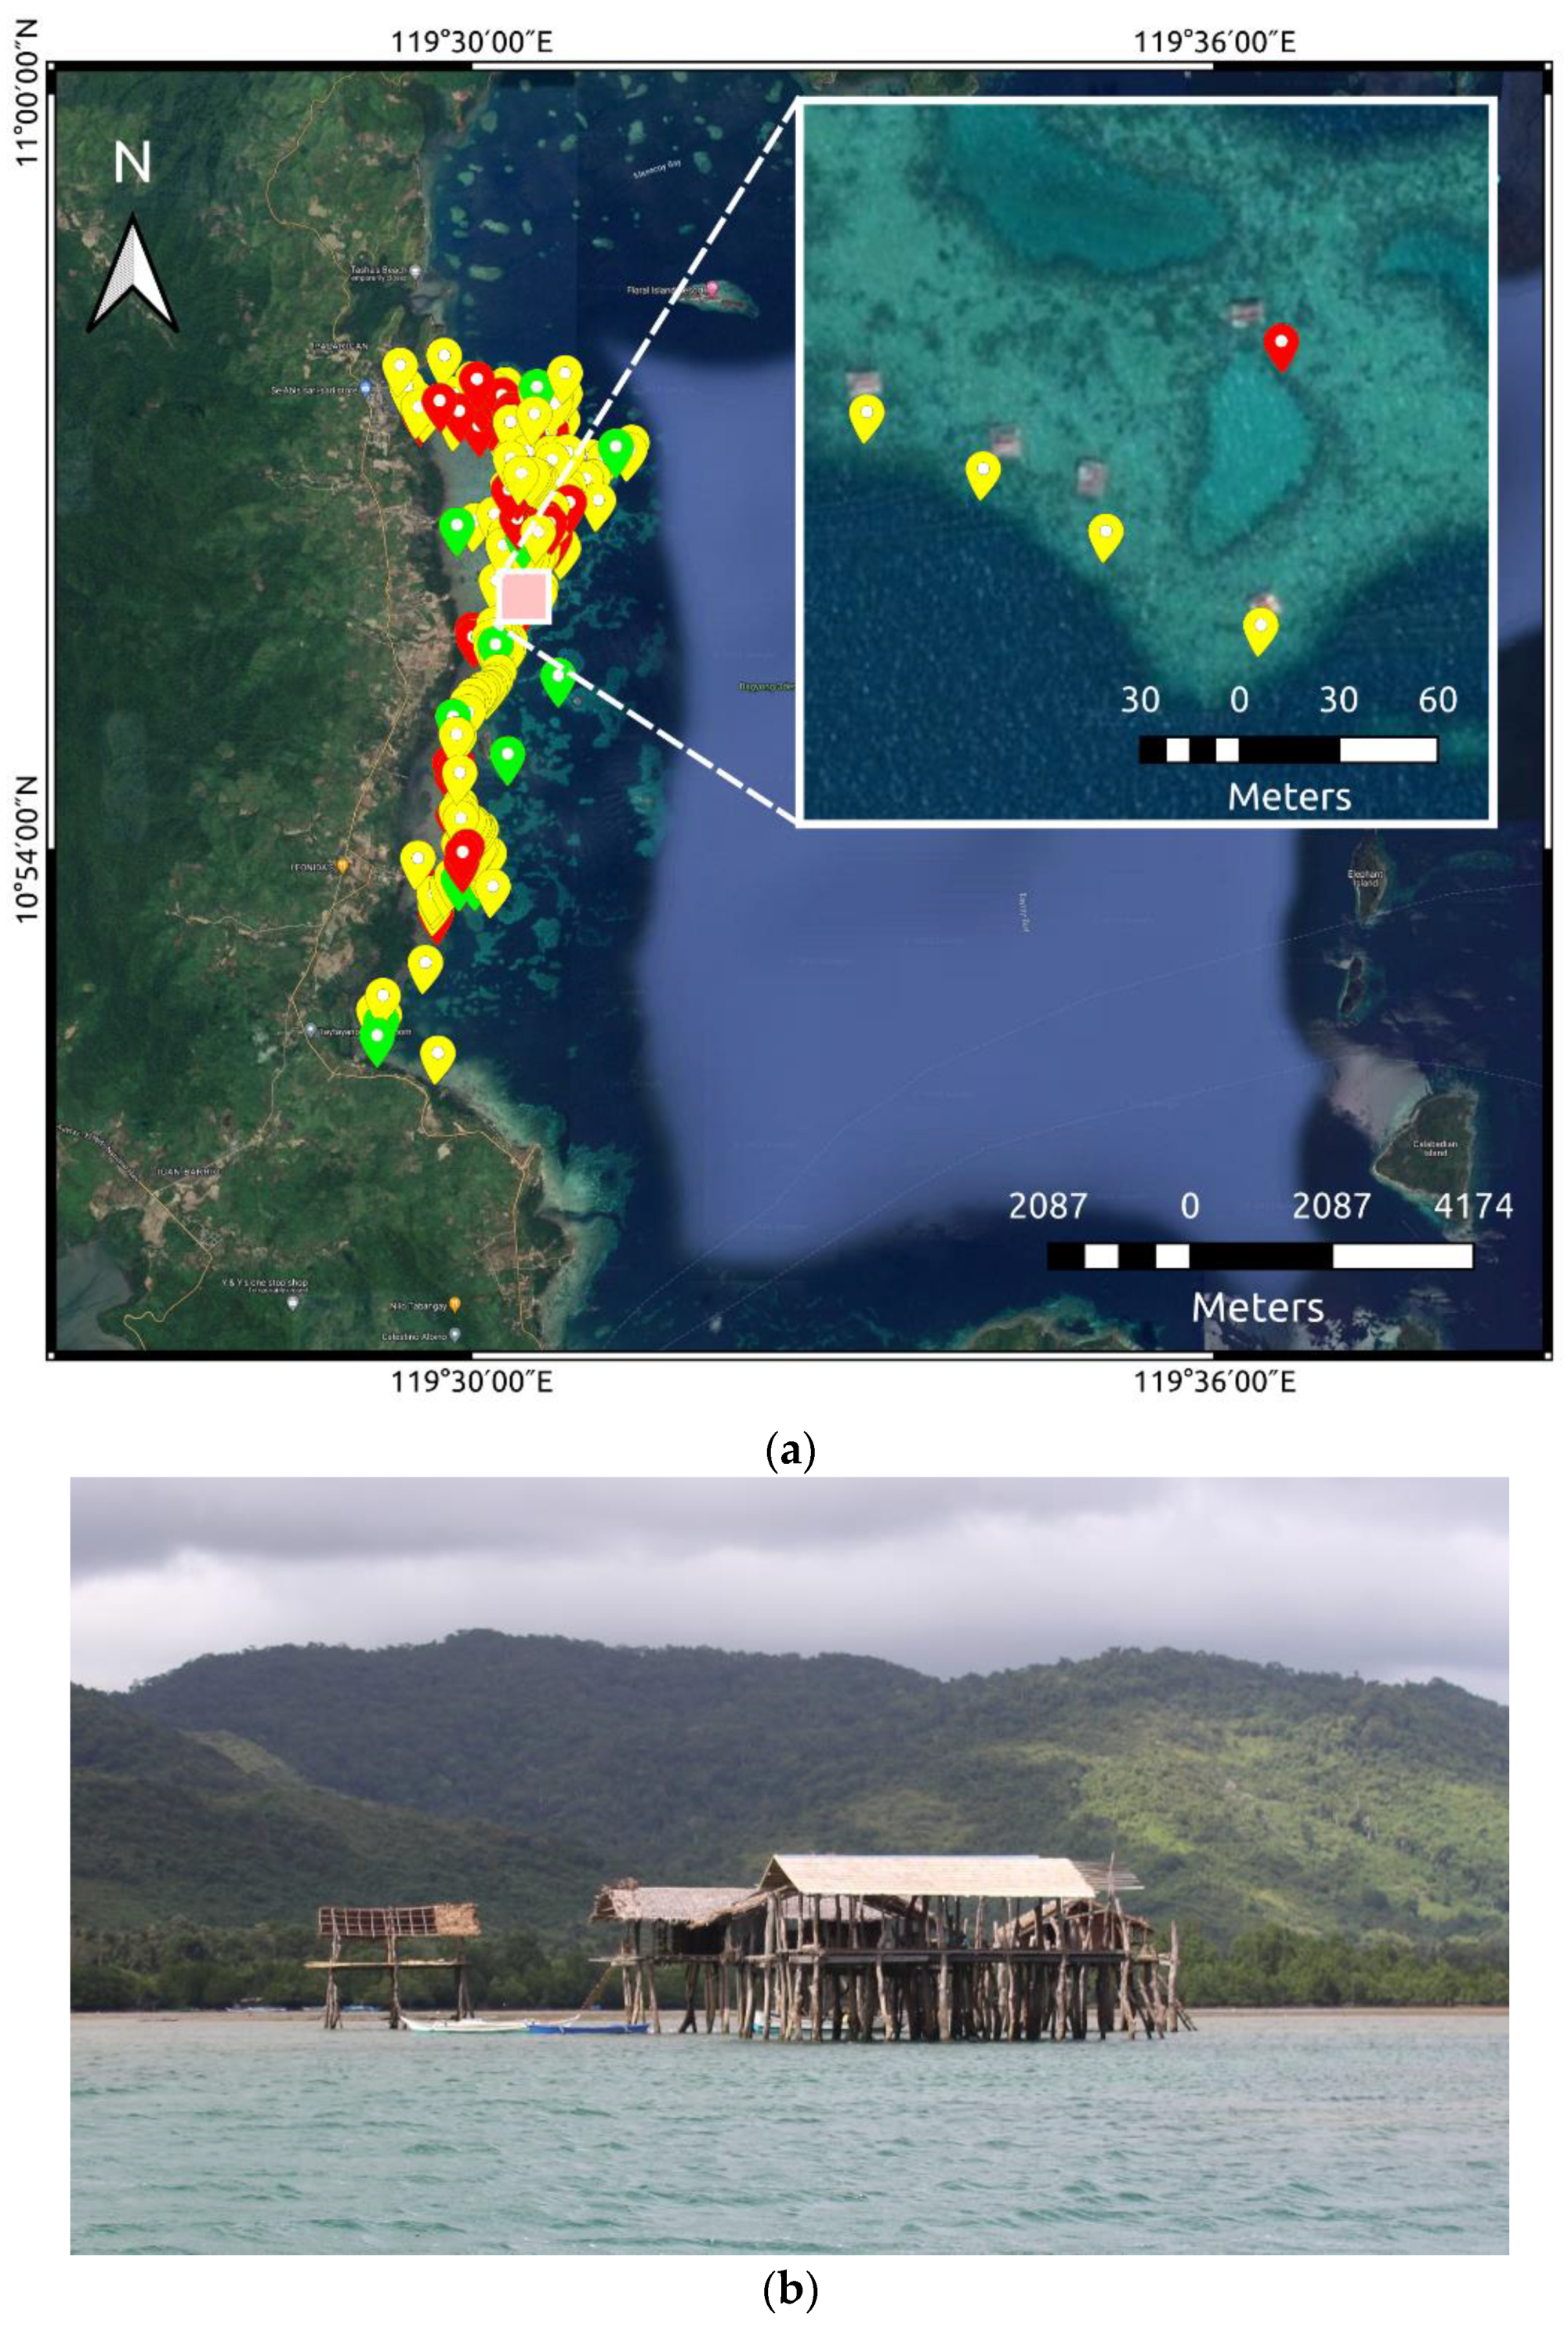
The aquaculture maps for November 2019 were validated by comparison with high-resolution Google Earth optical images. For this validation, we focused our attention on a subscene of the map centred on Taytay Bay (
Figure 8a), which is one of the chosen study sites of the Blue Communities Programme [
26] that this study is a part of. In this area, the majority of local communities were engaged in seaweed farming. Moreover, most of these seaweed farms have sheds wherein the seaweeds are dried and processed (
Figure 8b).
Within the boundaries of the selected map of Taytay Bay (
Figure 8a), all possible sheds have been detected using SAR sensor data. The coordinates where the sheds have been detected were then compared visually with Google Earth optical images. As the time interval between the aquaculture map and Google Earth data was 7 months, some discrepancies can be observed between these data sources.
Figure 8a shows a Google map, where all correctly detected caretaker sheds in Taytay Bay are marked in yellow, the location of false alarms are shown in green, and the sheds that were not detected in SAR data but visually identified in the Google Earth image are shown in red. It can be seen in the figure that the number of undetected objects is much larger than false alarms and they are mostly concentrated in the northern part of Taytay Bay. For the SAR sensors, these sheds are challenging targets due to their small size. According to the Google Earth images, the length of these sheds varied from 5 to 15 m, which is around four times smaller than the spatial resolution of the Sentinel-1 SAR sensors. The average distance between the caretaker sheds varied from 30 to 200 m and was enough for discriminating individual sheds in Sentinel-1 SAR images. For most of the false alarm objects, the physical size is less than one pixel in the Sentinel-1 SAR image and the backscatter signal they produce is less than the noise threshold.
In total there were 186 objects detected and tested in Google Earth images, and 72 percent of these objects were detected using other Earth observation data (see
Table 1). About 21 percent were not detected, as the objects’ size and radar backscattering properties of these objects imposed a limitation on the detection algorithm. The estimated proportion of false alarms was relatively small. Only 7.5 percent of objects were misclassified as aquaculture structures. With the help of high-resolution Google Earth images, these false alarms were identified as follows. Firstly, the detection algorithm picked up the fish corrals located in several places in Taytay Bay, as illustrated in
Figure 9. Secondly, some coral reefs and shallow water areas were also incorrectly detected, as they may appear from under the water during low tides. These errors could be reduced by improving the land classification methodology described in
Section 4.2, which is based on processing a time series of Sentinel-2 MSI data. This methodology currently does not use the sea surface height information coincident with the SAR data acquisition.
5.2.2. Validation with In Situ Observations
For validation using in situ data, a different location was chosen which is also a site of the Blue Communities Programme (
Figure 7c) where collaborators are conducting regular monthly water quality monitoring. Initially, two key informants who are coastal residents in Malampaya Inner Sound were provided with printed maps of the detected aquaculture structures (
Figure 7d, both 2016 and 2019) based on EO data. Based on the recollection of the informants, objects shown on the printed map were then labelled as green mussel raft, fish cages, fish corrals, and artificial reef. Maps were then further edited in QGIS (version Bonn 3.2) to integrate the additional information taken from the informants for easy verification. Immediate validation was achieved through a ground truth survey the following day. With the use of a small boat, only structures close to the coast were visited and geotagged using GPS due to logistics constraints.
The validation surveys were performed within a 3-day period mainly in the Inner Malampaya Sound, Taytay, Palawan. The community readiness to respond to our queries along the survey area expedited the ground truth survey.
Additional information was also recorded, such as cultured species, owner, and area, through interviews with the caretakers of the structures. GPS coordinates were then plotted as vectors using QGIS and compared against the maps of the detected aquaculture structures.
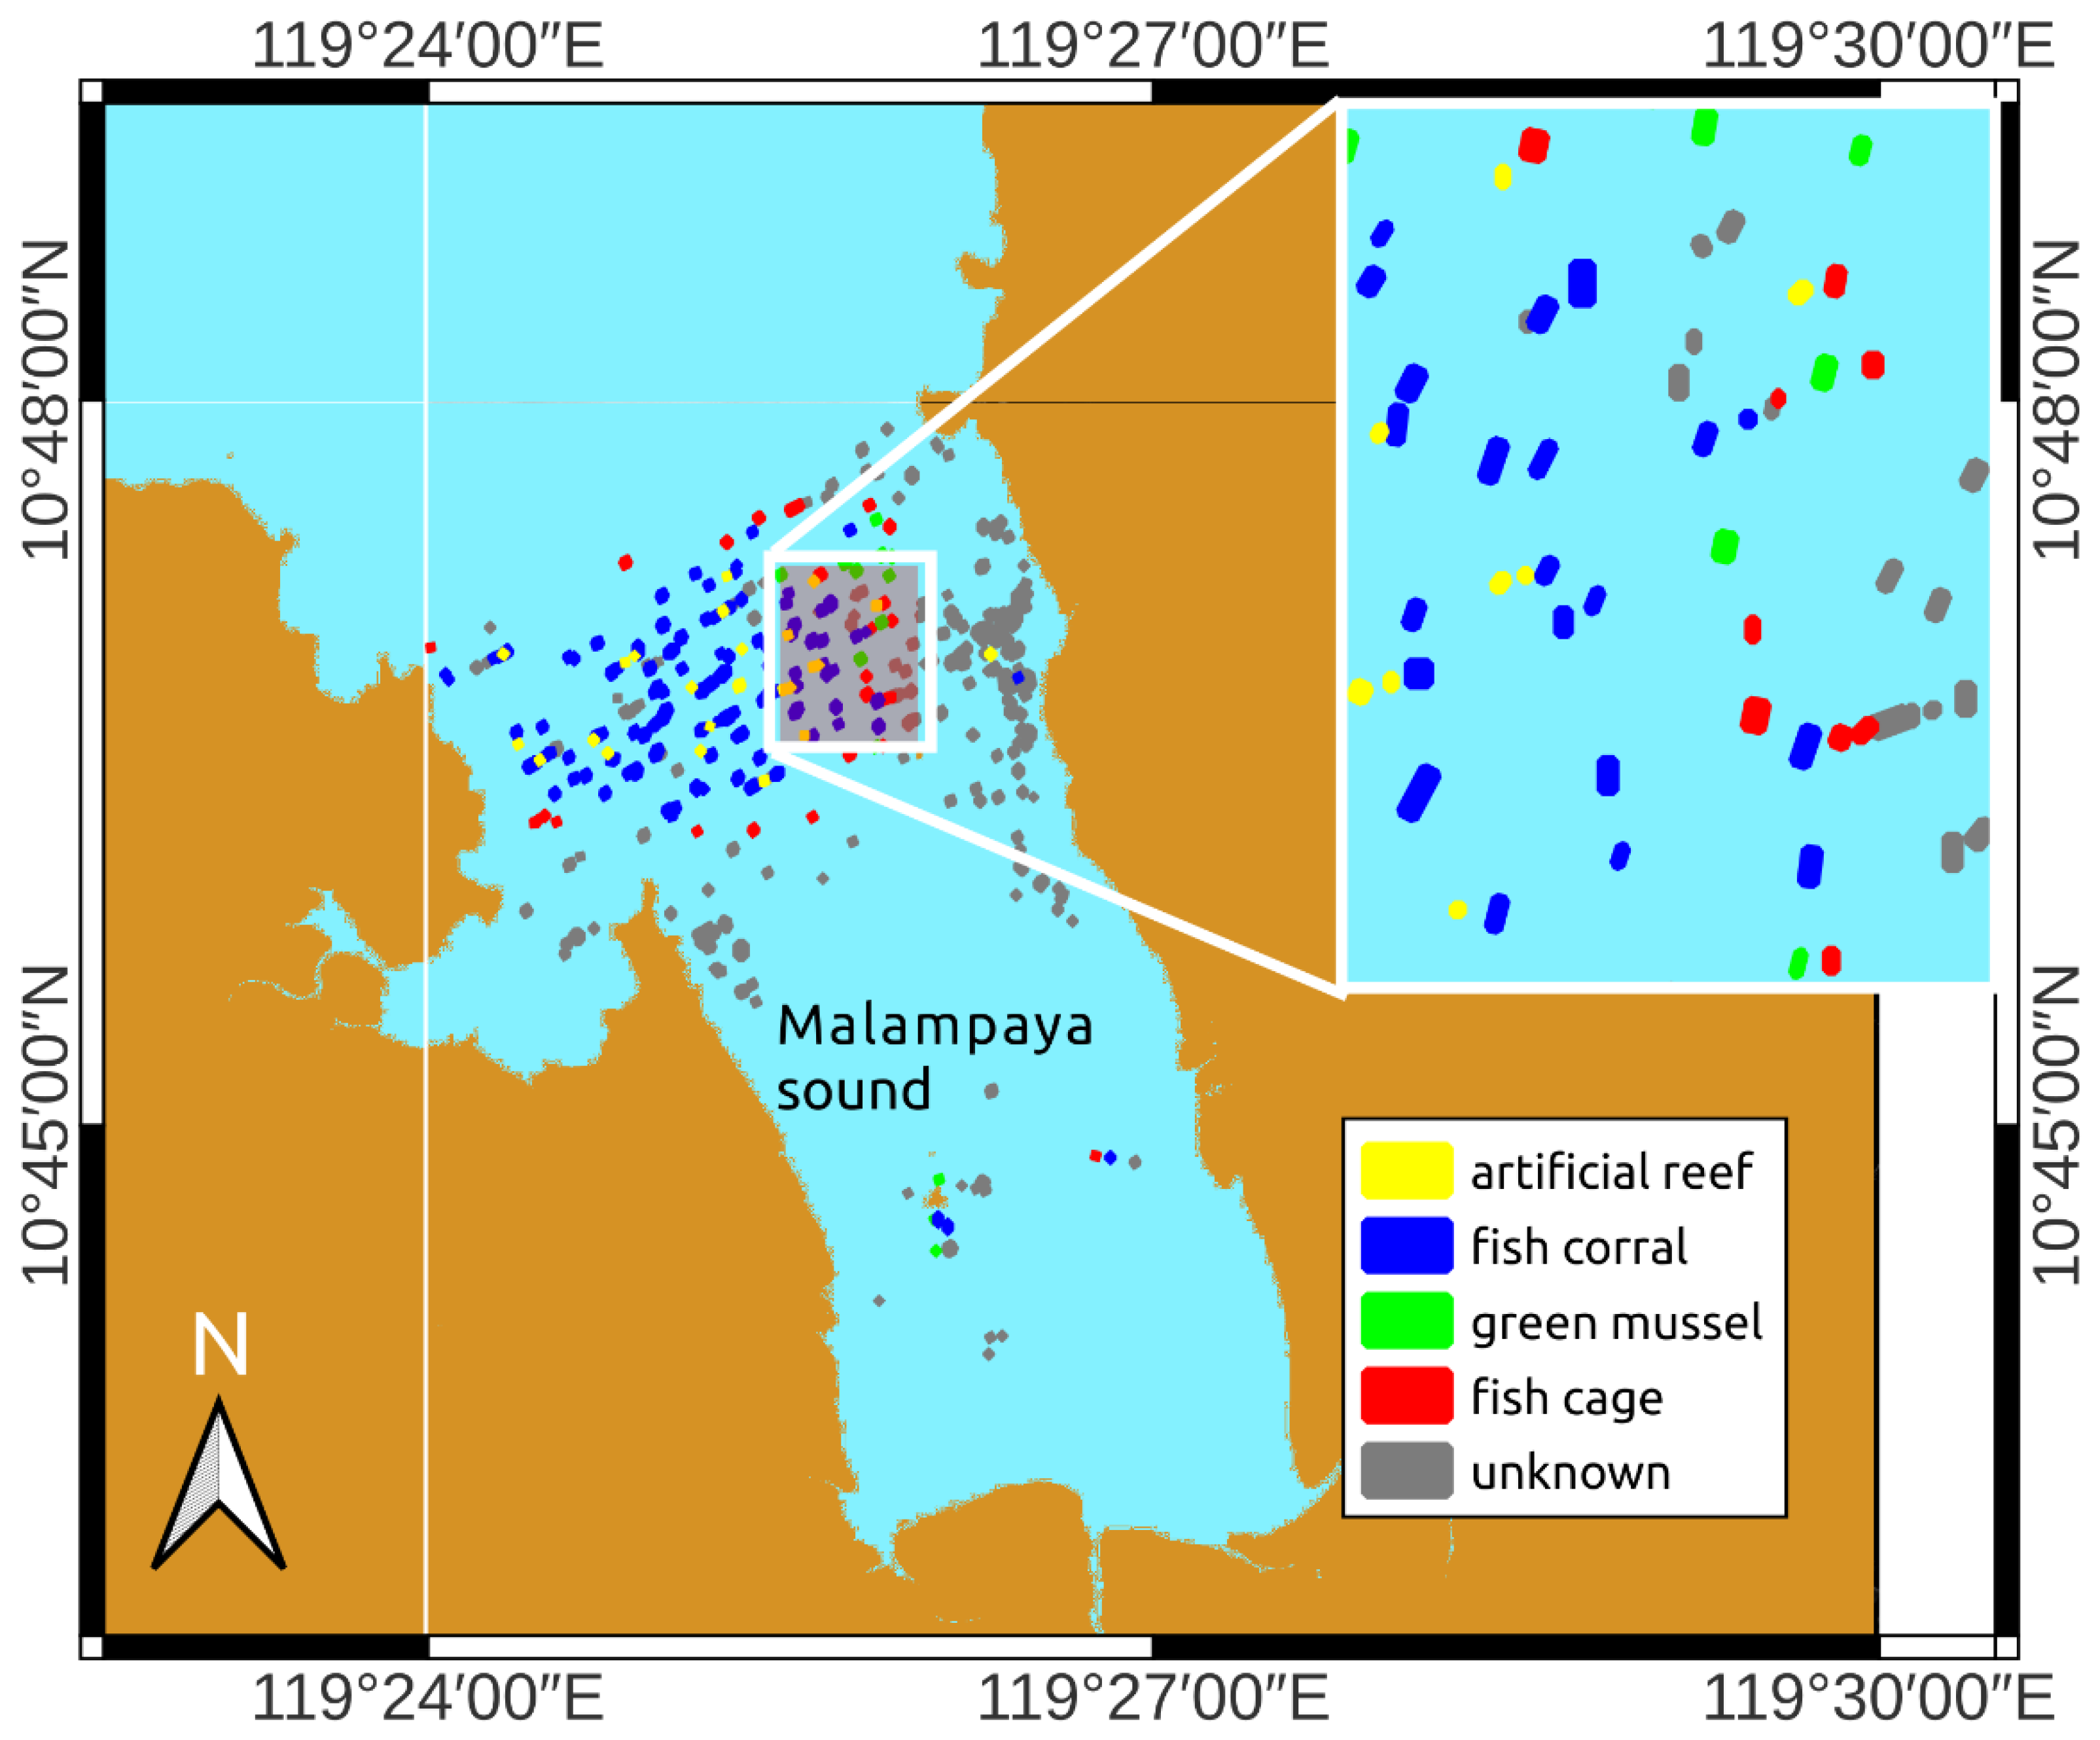
In total, 166 objects were recognised on the map by the survey participants, distributed into different classes, as shown in
Table 2.
Figure 10 shows these objects on the Google map using colour coding for different object types. While the proposed methodology correctly identified the location of objects on the sea surface, we can see in
Figure 10 that aquaculture structures and fishing gear were automatically detected. Validation using in situ observations has shown that a large majority of the automatically detected structures in Malampaya Sound in 2019 were genuine aquaculture or fishing structures.
5.3. Transferability of Methodology
In general, application of the developed methodology is limited to the areas where Sentinel-1 SAR and Sentinel-2 MSI sensor data are available. The coverage of Sentinel sensors includes coastal areas over most of the world, but some specific areas may not be covered [
16].
Overall, the developed methodology is not limited to the specific location in Palawan, Philippines. The land mask can be generated for any location where the Sentinel-2 MSI sensor data are available, which includes near-global coverage of coastal waters. The consistent and regular observations of the Earth surface for more than 5 years’ time can be used to generate historical land mask data.
Sentinel-1 also provides wide coverage of coastal waters all over the world and can be applied to generate aquaculture site maps on a larger scale. The historical records of Sentinel-1 images, starting in 2015, can also be used to produce historical aquaculture site maps.
However, extension of the methodology to other places may require a combination of Earth observation data with other sources of information. Some stationary objects, such as buoys, moored yachts, partly sunken ships, or wind farms, may produce false alarms in satellite images. To reduce these false alarms a specific knowledge of the mapped area may be required.
False alarms can be also produced by “ghost signals”—periodic patterns in the images of coastal areas induced by a strong reflection of radar signal from the roofs of buildings, ridges, masts, and other large metal objects along the coast [
27]. These patterns do not frequently change over time, so they can be detected as static objects and produce false alarms at the output of the aquaculture mapping algorithm.
Errors of this type can be often found in densely built-up areas, near to towns and seaports. In these locations, the developed methodology has to be further improved to suppress “ghost signals” by using the techniques proposed, for example, in [
28,
29]. The application of the methodology is not limited to coastal aquaculture structures but can also be extended to mapping inshore aquaculture cages and rafts. However, the spatial resolution of Sentinel-1 and Sentinel-2 sensors may be insufficient for mapping inland aquaculture due to their proximity to the land, and require the application of commercial high-resolution sensors.
6. Conclusions
In this work, a new methodology was developed for mapping aquaculture structures in coastal waters using Sentinel-1 SAR sensor data. We have made significant advances in aquaculture structure detection by implementing temporal composition of SAR images. To combine time series data, we applied a median operator widely used in remote sensing to merge multiple images. However, we believe that in the context of mapping aquaculture structures the application of the median operator is unique. It helps to emphasise static objects, reduce speckle noise in SAR data, and increase the contrast of aquaculture objects in satellite images. We expect that the proposed methodology can also be adopted for mapping coastal aquaculture structures, but as inshore fish cages and rafts are located close to the coast, high-resolution remote sensing images will be required to detect them.
The aquaculture structures were identified in SAR images and detected as static objects in a fully automatic process. The developed methodology allowed us to process 113 Sentinel-1 SAR scenes and 328 Sentinel-2 MSI scenes and to provide the first detailed map of aquaculture structures at Palawan, Philippines, in 2016 and 2019. Overall, the automatically generated aquaculture maps demonstrated good agreement with Google Earth high-resolution images and with the in situ observations. The comparison of maps separated by a three-year time interval revealed temporal changes in the aquaculture structures of Malampaya Sound, Palawan.
Despite the limitation in spatial resolution of the Sentinel-1 SAR sensors, the developed methodology allowed us to detect objects up to four times smaller than the sensor resolution size with a success rate of 72% and a false alarm rate of 7.5%. Most false alarms were identified as land masking errors and discrimination errors of non-aquaculture objects, such as fish corrals and artificial reefs. The discrimination errors were mostly due to the limited spatial resolution of SAR and multispectral sensors applied in this study.
Compared to previous studies that reported successful detection of aquaculture structures distributed in space and occupying at least several pixels in the image, in this study we demonstrated that objects much smaller than the sensor spatial resolution can be reliably detected using the proposed methodology based on a time series analysis of satellite data.
Further work will focus on extending the methodology demonstrated in Palawan to aquaculture studies in other regions around the world. The capabilities of this methodology will be further extended by applying EO data with higher spatial resolution, and machine learning techniques to improve discrimination accuracy of aquaculture structures, fishing gear, and other types of detected objects.
Author Contributions
Conceptualization, A.A.K. and A.L.A.; methodology, A.A.K.; software, A.A.K.; validation, A.L.A., J.D.C.S. and A.A.K.; investigation, A.A.K., P.I.M., A.L.A. and J.D.C.S.; resources, P.I.M. and A.L.A.; writing—original draft preparation, A.A.K., A.L.A. and J.D.C.S.; writing—review and editing, A.A.K., P.I.M., A.L.A. and J.D.C.S.; visualization, A.A.K.; supervision, A.A.K.; project administration, P.I.M. and A.L.A.; funding acquisition, P.I.M. and A.L.A. All authors have read and agreed to the published version of the manuscript.
Funding
This work has received funding from the Global Challenges Research Fund (GCRF) via the United Kingdom Research and Innovation (UKRI) under grant agreement references NE/P021107/1 and NE/P021107/2 to the Blue Communities project.
Data Availability Statement
The data presented in this study are available on request from the corresponding author.
Acknowledgments
We wish to express our appreciation to the locals who served as our key informants and boat pilots and for sharing their local knowledge during the survey of aquaculture structures in Malampaya Sound. We would like also to thank the project staff of the GeM-PHIL project who participated in validation interviews and actual surveys.
Conflicts of Interest
The authors declare no conflict of interest.
References
- Meaden, G.J.; Aguilar-Manjarrez, J. Advances in geographic information systems and remote sensing for fisheries and aquaculture. CD-ROM version. In FAO Fisheries and Aquaculture, CD–ROM Version; Technical Paper No. 552; FAO: Rome, Italy, 2013; 425p. [Google Scholar]
- Alexandridis, T.; Topaloglou, C.A.; Lazaridou, E.; Zalidis, G.C. The performance of satellite images in mapping aquacultures. Ocean Coast. Manag. 2008, 51, 638–644. [Google Scholar] [CrossRef]
- Gernez, P.; Palmer, S.C.J.; Thomas, Y.; Forster, R. Editorial: Remote Sensing for Aquaculture. Front. Mar. Sci. 2021, 7, 1258. [Google Scholar] [CrossRef]
- Travaglia, C.; Profeti, G.; Aguilar-Manjarrez, J.; Lopez, N.A. Mapping coastal aquaculture and fisheries structures by satellite imaging radar. In Case Study of the Lingayen Gulf, the Philippines; FAO Fisheries Technical Paper No. 459; FAO: Rome, Italy, 2004. [Google Scholar] [CrossRef]
- Ottinger, M.; Clauss, K.; Kuenzer, C. Large-Scale Assessment of Coastal Aquaculture Ponds with Sentinel-1 Time Series Data. Remote Sens. 2017, 9, 440. [Google Scholar] [CrossRef] [Green Version]
- Profeti, G.; Travaglia, C.; Carla, R. Detecting and monitoring aquacultural patterns through multitemporal SAR imagery analysis. In Remote Sensing for Agriculture, Ecosystems, and Hydrology IV; Owe, M., D’Urso, G., Toulios, L., Eds.; SPIE: Washington, DC, USA, 2003. [Google Scholar] [CrossRef]
- Sun, Z.; Luo, J.; Yang, J.; Yu, Q.; Zhang, L.; Xue, K.; Lu, L. Nation-Scale Mapping of Coastal Aquaculture Ponds with Sentinel-1 SAR Data Using Google Earth Engine. Remote Sens. 2020, 12, 3086. [Google Scholar] [CrossRef]
- Prasad, K.A.; Ottinger, M.; Wei, C.; Leinenkugel, P. Assessment of Coastal Aquaculture for India from Sentinel-1 SAR Time Series. Remote Sens. 2019, 11, 357. [Google Scholar] [CrossRef] [Green Version]
- Russell, A.G.; Castillo, D.U.; Elgueta, S.A.; Sierralta, C.J. Automated fish cages inventorying and monitoring using H/A/α unsupervised Wishart classification in sentinel 1 dual polarization data. In Proceedings of the 2020 IEEE Latin American GRSS & ISPRS Remote Sensing Conference (LAGIRS), Santiago, Chile, 22–26 March 2020; pp. 395–400. [Google Scholar] [CrossRef]
- Ballester-Berman, J.D.; Sanchez-Jerez, P.; Marino, A. Detection of aquaculture structures using Sentinel-1 data. In Proceedings of the EUSAR 2018; 12th European Conference on Synthetic Aperture Radar, Aachen, Germany, 4–7 June 2018; pp. 1–4, ISBN 978-3-8007-4636-1. [Google Scholar]
- Philippine Statistics Authority. Fisheries Statistics of the Philippines 2017–2019; Philippine Statistics Authority: Diliman Quezon, Philippines, 2020; Volume 28, 313p.
- Avillanosa, A.L.; Avillanosa, A.P.; Roche, R.T. Status of Milkfish Fry Industry in Roxas, Palawan; The Palawan Scientist: Palawan, Philippines, 2005; Volume 2, pp. 54–61. [Google Scholar]
- Baliao, D.D.; Santos, M.A.; Franco, N.M.; Jamon, N.R.S. Grouper Culture in Floating Net Cages; Aquaculture Department, Southeast Asian Fisheries Development Center: Palembang, Indonesia, 2000; 11p, ISBN 971-8511-39-3. [Google Scholar]
- Basa, S.S. Fin Fish Culture, an Income Generating Project; The Bureau of Fisheries and Aquatic Resources (BFAR): Quezon City, Philippines, 1997; 10p.
- Avillanosa, A.P. Grouper Culture in Net Cages: WPU Experience; The Palawan Scientist: Palawan, Philippines, 2005; Volume 2, pp. 22–31. [Google Scholar]
- Copernicus Open Access Hub, European Space Agency. 2022. Available online: https://scihub.copernicus.eu (accessed on 27 April 2022).
- Sentinel 1 Toolbox|STEP. Available online: http://step.esa.int/main/toolboxes/sentinel-1-toolbox/ (accessed on 11 September 2017).
- McFeeters, S.K. The use of the Normalized Difference Water Index (NDWI) in the delineation of open water features. Int. J. Remote Sens. 1996, 17, 1425–1432. [Google Scholar] [CrossRef]
- Ding, F. Study on Information Extraction of Water Body with a New Water Index (NWI). Sci. Surv. Mapp. 2009, 34, 155–157. [Google Scholar]
- Feyisa, G.L.; Meilby, H.; Fensholt, R.; Proud, S.R. Automated Water Extraction Index: A new technique for surface water mapping using Landsat imagery. Remote Sens. Environ. 2014, 140, 23–35. [Google Scholar] [CrossRef]
- Kurekin, A.A.; Loveday, B.R.; Clements, O.; Quartly, G.D.; Miller, P.I.; Wiafe, G.; Agyekum, K.A. Operational Monitoring of Illegal Fishing in Ghana through Exploitation of Satellite Earth Observation and AIS Data. Remote Sens. 2019, 11, 293. [Google Scholar] [CrossRef] [Green Version]
- Crisp, D.J. The State-Of-The-Art in Ship Detection in Synthetic Aperture Radar Imagery. In Defence Science and Technology Organisation DSTO Information Sciences Laboratory; DSTO Information Sciences Laboratory: Edinburgh, Australia, 2004; 116p. [Google Scholar]
- Schubert, E.; Sander, J.; Ester, M.; Kriegel, H.P.; Xu, X. DBSCAN revisited, revisited: Why and how you should (still) use DBSCAN. ACM Trans. Database Syst. 2017, 42, 1–21. [Google Scholar] [CrossRef]
- Gonzales, B.J. Fishing Gears and Methods of the Malampaya Sound Philippines: An Approach to Fisheries and Ecosystems Management; Asian Conservation Foundation, Banco de Oro, WWF-Philippines, Western Philippines University: Palawan, Philippines, 2018; 177p, ISBN 978-621-95538-2-7. [Google Scholar]
- Google Earth. How Images Are Collected 2021. Google.Com. Available online: https://support.google.com/earth/answer/6327779?hl=en (accessed on 10 December 2021).
- Blue Communnities, Global Challenges Research Fund (GCRF). Available online: https://www.blue-communities.org (accessed on 2 May 2022).
- Santamaria, C.; Greidanus, H. First Analyses of Sentinel-1 Images for Maritime Surveillance, Joint Research Centre, Institute for the Protection and Security of the Citizen, Publications Office. 2016. Available online: https://data.europa.eu/doi/10.2788/132810 (accessed on 27 April 2022).
- Choi, J.H.; Won, J.-S. Efficient SAR Azimuth Ambiguity Reduction in Coastal Waters Using a Simple Rotation Matrix: The Case Study of the Northern Coast of Jeju Island. Remote Sens. 2021, 13, 4865. [Google Scholar] [CrossRef]
- Monti-Guarnieri, A.V. Adaptive removal of azimuth ambiguities in SAR images. IEEE Trans. Geosci. Remote Sens. 2005, 43, 625–633. [Google Scholar] [CrossRef]
Figure 1.
Floating (a) and fixed (b) cages in Palawan.
Figure 1.
Floating (a) and fixed (b) cages in Palawan.
Figure 2.
The map of the study area in Palawan, Philippines. It was divided into tiles of 0.1 degrees in latitude and longitude shown in red.
Figure 2.
The map of the study area in Palawan, Philippines. It was divided into tiles of 0.1 degrees in latitude and longitude shown in red.
Figure 3.
The EO data processing and aquaculture maps generation chain. It has two parallel branches for the Sentinel-1 SAR and Sentinel-2 MSI data processing and a branch for aquaculture object detection.
Figure 3.
The EO data processing and aquaculture maps generation chain. It has two parallel branches for the Sentinel-1 SAR and Sentinel-2 MSI data processing and a branch for aquaculture object detection.
Figure 4.
Sentinel-2 MSI land mask processing stages: (a) a fragment of Sentinel-2 MSI image in colour, where Band2 is shown in blue, Band3 in blue, and Band4 in red; (b) a map of modified water index values (Equation (1)) derived from one Sentinel-2 scene; (c) a composite map of water index values; (d) a land–water mask where the land is shown in white and the water in black.
Figure 5.
Composition of multiple Sentinel-1 SAR scenes: original SAR image at (a) VV and (b) VH polarisation; (c) VV and (d) VH polarisation images at the output of contrast box detection filter; (e) VV and (f) VH polarisation median composite images. The brightness of each point indicates the backscatter amplitude digital number (DN).
Figure 6.
Detection of static objects in SAR data: (a) RGB composite image with VV polarisation given in red and VH polarisation in green; (b) Google Earth high-resolution satellite image. The contours of detected objects are outlined in red.
Figure 6.
Detection of static objects in SAR data: (a) RGB composite image with VV polarisation given in red and VH polarisation in green; (b) Google Earth high-resolution satellite image. The contours of detected objects are outlined in red.
Figure 7.
Generated maps of aquaculture structures in Malampaya Sound, Palawan, Philippines: (a) a modified NDWI index map generated from Sentinel-2 MSI data; (b) Sentinel-1 SAR image composite RGB image with VV polarisation shown in red and VH polarisation in green; (c) a map of aquaculture structures in the year 2019; (d) a combined map of aquaculture structures in the years 2016 and 2019.
Figure 8.
Aquaculture caretaker sheds in Taytay Bay, comparison between aquaculture map and Google Earth images: (a) covered area and a larger fragment of the map. True positive detections are shown as yellow balloons, false alarms are shown in green, and undetected objects are shown in red; (b) a caretaker shed.
Figure 9.
Examples of false alarms in SAR data (left column) and Google Earth images (right column): (a,b) fish corral; (c,d) coral reef; (e,f) rocks.
Figure 9.
Examples of false alarms in SAR data (left column) and Google Earth images (right column): (a,b) fish corral; (c,d) coral reef; (e,f) rocks.
Figure 10.
The classification of detected objects based on the Malampaya Sound survey: fish cages are shown in red, green mussels in green; fish corrals in blue; and artificial reefs in yellow. The unknown objects are shown in grey.
Figure 10.
The classification of detected objects based on the Malampaya Sound survey: fish cages are shown in red, green mussels in green; fish corrals in blue; and artificial reefs in yellow. The unknown objects are shown in grey.
Table 1.
Evaluation of aquaculture detector performance based on visual interpretation of Google Earth images.
Table 1.
Evaluation of aquaculture detector performance based on visual interpretation of Google Earth images.
| Objects | Number | Percent |
|---|
| Correctly detected | 133 | 71.51 |
| False alarms | 14 | 7.51 |
| Undetected | 39 | 20.97 |
| In total | 186 | 100 |
Table 2.
Classification of detected objects based on a survey.
Table 2.
Classification of detected objects based on a survey.
| Object Type | Number of Objects |
|---|
| Artificial reef | 24 |
| Fish cage | 26 |
| Fish coral | 103 |
| Green mussel | 13 |
| In total | 166 |
| Publisher’s Note: MDPI stays neutral with regard to jurisdictional claims in published maps and institutional affiliations. |
© 2022 by the authors. Licensee MDPI, Basel, Switzerland. This article is an open access article distributed under the terms and conditions of the Creative Commons Attribution (CC BY) license (https://creativecommons.org/licenses/by/4.0/).


