Abstract
Sea surface barometric pressure contributes to calculating the surface transmissivity so that the observations of Microwave Temperature Sounder-II channels with non-zero surface transmissivity contain the sea surface barometric pressure information. Meanwhile, all channels of Microwave Temperature Sounder-II are sensitive to sea surface barometric pressure due to the correlation between channels. However, the traditional sensitivity test method based on the radiative transfer model cannot characterize the sensitivity of Microwave Temperature Sounder-II to sea surface barometric pressure due to the correlations between channels. In this study, the relationship between atmospheric parameters and Microwave Temperature Sounder-II observations is studied by a deep neural network, and the deep neural network-based model for Microwave Temperature Sounder-II simulations is established. Then, the deep neural network-based test method for the sensitivity of Microwave Temperature Sounder-II to sea surface barometric pressure is developed, and the sensitivity test experiments are carried out. The experimental results show that the sensitivity of all channels of Microwave Temperature Sounder-II to sea surface barometric pressure is captured by the deep neural network-based test method. In addition, the retrieval experiments of sea surface barometric pressure using Microwave Temperature Sounder-II observations are carried out, and the retrieval results further validate the feasibility of the deep neural network-based test method.
1. Introduction
Sea surface barometric pressure (SSP) is a fundamental parameter characterizing the atmospheric state and plays an essential role in atmospheric applications such as climate change studies, numerical weather prediction, and extreme weather monitoring [1,2,3,4]. The measured SSP with an accuracy of 1–2 hPa in clear sky conditions and 3 hPa in cloudy sky conditions can be useful for meteorological applications [5,6]. With the advantages of high horizontal resolution, global intensive and continuous observation, the wide detection area, etc., satellite-based microwave remote sensing is an important means to obtain information on geophysical parameters [7,8]. Zhang et al. [9,10] have proposed the concept of passive microwave remote sensing of SSP for the first time in 2018, and verified that the satellite-based microwave radiometer with the channels set near the 118.75 GHz oxygen absorption line, in the 60 GHz oxygen absorption band, or near the 183.31 GHz water vapor absorption line have the detection capability of SSP, and the SSP retrievals can meet the requirements of meteorological applications.
For passive microwave remote sensing of atmosphere, the conversion of microwave observations to atmospheric parameters is achieved by using a retrieval algorithm [11,12]. Successful retrievals require that the microwave observations are sensitive to specific atmospheric parameters. Therefore, the sensitivity study of microwave observations to atmospheric parameters has an important status in the field of atmospheric microwave remote sensing [13]. On the one hand, the sensitivity test results are essential bases for the theory development of microwave remote sensing of atmospheric parameters. On the other hand, the sensitivity test results can also be used to optimize the channel selection of the microwave radiometer in the retrieval calculations, which in turn improves the retrieval accuracy and also provides an important reference for the fusion retrieval of the microwave observations from multi-platform or multi-band datasets [14].
Currently, the radiative transfer model-based method is the traditional method for sensitivity testing in microwave remote sensing of the atmosphere; that is, the specified atmospheric parameters with artificial perturbation are input to the radiative transfer model to calculate the simulated brightness temperature, and the variation of the simulated brightness temperature with the desired atmospheric parameter are obtained, and then the relationship between the real observations and the desired atmospheric parameters are characterized [15,16,17,18,19]. The sensitivity studies of Microwave Temperature Sounder-II (MWTS-II), Microwave Humidity and Temperature Sounder (MWHTS) and the Advanced Technology Microwave Sounder (ATMS) to SSP have been carried out by Zhang et al. [10] using the sensitivity test method based on the radiative transfer model. The sensitivity test results only show that the microwave channels with peak weighting function (WF) heights close to the surface are sensitive to SSP, while channels which contribute significantly to the SSP retrievals in the retrieval experiments, such as some temperature sounding channels with peak WF heights far from the surface, are not sensitive to SSP. However, it is important to note that the simulated brightness temperatures are obtained using the artificially perturbed parameters rather than the actual atmospheric parameters in their sensitivity tests, which may have an adverse effect on the sensitivity test results.
He et al. [20] have carried out the sensitivity study of MWHTS and MWTS-II to SSP based on the radiative transfer model using the actual atmospheric parameters, and have obtained similar sensitivity test results as Zhang et al. [10] while pointing out that the operational radiative transfer model used in the sensitivity test method may be the cause of the inconsistencies between the sensitivity test results and the retrieval results of SSP. He et al. [20] have demonstrated that the sensitivity test method based on the radiative transfer model is not applicable to the retrieval of SSP, and have pointed out that improving the radiative transfer model is an important way to obtain a more effective sensitivity test method for SSP. However, they have not developed a valid sensitivity test method for passive microwave observations to SSP.
For currently popular operational radiative transfer models, such as Atmospheric Radiative Transfer Simulator (ARTS), Radiative Transfer to TOVS (RTTOV) and Community Radiative Transfer Model (CRTM), etc., SSP is involved in the calculation of near-surface atmospheric transmissivity by linear interpolation [21,22,23,24]. The calculation error brought by such a rough calculation may reduce the weight of SSP in the radiative transfer calculation, which may lead to inaccurate sensitivity test results. In addition, there are many error sources, such as the satellite sounder (e.g., poor calibration or adverse environmental effects) and the radiative transfer model (e.g., errors in the physics or the atmospheric parameters, or from the non-modeled atmospheric process, etc.), which lead to a bias between the simulated brightness temperature and the satellite-observed brightness temperature [25,26,27]. Moreover, the bias is also a significant reason for the inaccuracy of the sensitivity test results based on the radiative transfer model. Obviously, if the method for SSP involved in radiative transfer calculation or the calculation accuracy of the simulated brightness temperature can be improved, then it is expected to obtain more accurate sensitivity test results of microwave observations to SSP.
However, based on the existing research on microwave remote sensing, it is a great challenge to improve the accuracy of the simulated brightness temperature calculated by the radiative transfer model. The radiative transfer model is a modeling of the wave transmission in the atmosphere and is also a physical description of the relationship between microwave observations and atmospheric parameters. Considering the important role played by the radiative transfer model in the theoretical development and data applications of microwave remote sensing, the versions of radiative transfer models such as RTTOV, CRTM and ARTS are continuously updated. However, the improvement in the accuracy of the simulated brightness temperature from different versions is not significant. It is clear that the difficulty of dealing with non-modeled physical processes and signal distortion in the ionosphere, eliminating errors in the spectroscopy, and improving the accuracy of atmospheric parameters involved in the radiative transfer calculation is enormous [25,26,27]. Using machine learning algorithms to characterize the relationship between microwave observations and atmospheric parameters, and then predict the simulated brightness temperatures that are closer to microwave observations, may be a good choice.
Neural networks, as a type of machine learning algorithm, are widely used in atmospheric parameter retrieval using passive microwave measurements due to their powerful nonlinear mapping capability [28]. In supervised learning, each set of input variables in the training dataset correlates to an already known set of output variables. Neural networks are able to model the relationship between input and output variables in the training dataset, whether this relationship is simple (e.g., linear) or complex (e.g., highly nonlinear). When the input variables provided by the testing dataset are fed as new data to the neural network which has been trained using the training dataset, predictions corresponding to the new data are generated, and these predictions are estimates of the output variables in the testing dataset [29].
Deep Neural Network (DNN), which shows more potential in the field of microwave remote sensing because of its greater learning capability compared with shallow neural networks [30,31,32], is a promising method for studying the nonlinear relationship between atmospheric parameters and microwave observations [33]. In this study, in order to avoid the adverse effects of the computational errors of the radiative transfer model on the sensitivity test results for SSP, DNN is proposed to characterize the relationship between the atmospheric parameters and the observed brightness temperatures from the satellite-based microwave radiometer, and a more accurate model for the computation of the simulated brightness temperature based on DNN is established, and then a DNN-based sensitivity test method for SSP is developed.
MWTS-II is one of the main payloads of Fengyun-3C (FY-3C) and Fengyun-3D (FY-3D) satellites [34,35], and has the capability of detecting SSP. In this study, the sensitivity test method of MWTS-II to SSP based on DNN is proposed and studied. This paper is organized as follows: Section 2 focuses on describing the data used in this study, followed by the theoretical principle of passive microwave remote sensing of SSP in Section 3. In Section 4, the DNN-based model for MWTS simulations is developed and the sensitivity test approach for SSP is described. Section 5 provides a detailed description of the experimental design of the sensitivity test experiment and the retrieval experiments of SSP. Section 6 presents the experimental results. Finally, the conclusions are summarized in Section 7.
2. Data Description
2.1. MWTS-II Characteristics and Data Description
Launched on 23 September 2013 and November 15 2017, respectively, FY-3C and FY-3D are the new generation of polar-orbiting satellites dedicated to operational meteorology [36,37]. MWTS-II onboard FY-3C and FY-3D, which is designed to mainly detect atmospheric temperature profiles, has 13 channels with frequencies in the 60 GHz oxygen absorption band. MWTS-II is a cross-track scanning radiometer, with a scan angle of ±49.5° from nadir and a total of 90 Earth fields-of-view of 2.2° per scan line, providing a nominal spatial resolution of about 32 km at nadir [35]. Table 1 provides performance characteristics of all MWTS-II channels, including the channel frequency, sensitivity requirements, on-orbit sensitivity, and peak weighting function (WF) height. The Level-1b brightness temperature dataset of MWTS-II onboard FY-3D satellite from the National Satellite Meteorological Center (NSMC) (http://satellite.nsmc.org.cn/portalsite/default.aspx/, accessed on 1 March 2020). is selected to build the MWTS-II dataset for carrying out the sensitivity test experiment of MWTS-II to SSP and the retrieval experiment of SSP. The MWTS-II data quality has been carefully evaluated, and its impact on the European Centre for Medium-Range Weather Forecasts (ECMWF) system has been reported by Su and Jiang [38], Lu et al. [39], Li and Liu [40], Carminati and Migliorini [41].

Table 1.
Channel characteristics of MWTS-II.
2.2. Atmospheric Data Description and Pre-Processing
In this study, an atmospheric dataset, including surface and atmospheric state, is built and used to calculate brightness temperatures observed by MWTS-II. The atmospheric profiles and surface properties that are used to build the atmospheric dataset are obtained from ERA-Interim (http://apps.ecmwf.int/datasets/data/interim-full-daily/, accessed on 17 June 2020). ERA-Interim is a four-dimensional variational system that assimilates various measurements from satellite sounders, radiosondes, in situ sounders, and other sources to provide a reanalysis of the global atmosphere and surface at ECMWF [42,43]. In order to accurately calculate MWTS-II simulated brightness temperatures, the following information are kept in the atmospheric dataset with a horizontal resolution of 1° × 1° and a temporal resolution of 6 h (with data available at 0000 UTC, 0600 UTC, 1200 UTC and 1800 UTC): atmospheric profiles, including temperature, specific humidity, cloud cover, cloud liquid water and cloud ice water profiles on 37 pressure levels ranging from 1000 hPa to 1 hPa; and surface properties, including 10 m u wind component (the eastward component of the 10 m wind), 10 m v wind component (the northward component of the 10 m wind), 2 m dewpoint temperature, 2 m temperature, skin temperature and surface pressure. In this work, the MWTS-II dataset and the atmospheric dataset covering the ocean area of 25° N–45° N and 160° E–220° E from 1 September 2018 to 31 August 2019 are chosen.
The following pre-processing is required for the MWTS-II dataset and atmospheric dataset. The MWTS-II dataset and atmospheric dataset are collocated with the criteria that their difference in time is less than 10 min, and their differences in longitude and latitude are both less than 0.1° to constitute the collocated dataset. The collocated dataset is used to develop the DNN-based model for MWTS-II simulations, as well as to build the retrieval model for SSP. Therefore, the collocated dataset including MWTS-II brightness temperatures and the atmospheric parameters with 393,093 collocated samples from 1 September 2018 to 31 May 2019 is selected as the analysis dataset for the training of DNN, and the collocated dataset with 130,134 collocated samples from 1 June to 30 August 2019 is selected as the testing dataset for the performance evaluation and analysis of the trained DNN. It is to be noted that the collocated samples in the analysis dataset and the testing dataset are completely independent, since they are from different time periods.
3. Theoretical Principle
3.1. Principle of Measuring SSP by Satellite-Based Microwave Radiometer
For a satellite-based downward-looking radiometer, the upward-emitted brightness temperature can be expressed as [44],
where and are the upwelling and downwelling emissions of the atmosphere at frequency and zenith angle given by Equations (2) and (3),
where is the absorption coefficient of the atmosphere at height . is the atmospheric temperature profile. is the galactic and cosmic radiation originating from outside of the Earth’s atmosphere. is the brightness temperature of the ocean (or ground) surface when observed in the absence of the atmosphere. is the reflectivity of the surface. is the zenith optical thickness of the atmospheric layer between the surface and height , which is related to , and is given by
is the one-way transmissivity of the atmosphere layer between the surface and the top of the atmosphere along direct , which is given by
According to Equation (5), and replacing the height with the integral variable , Equation (1) can be simplified as
where represents the vertical distribution of temperature at atmospheric pressure level , denotes sea surface pressure, is the emissivity of the surface, is the surface temperature, is the transmissivity between the surface and the top of the atmosphere (i.e., the surface transmissivity).
It can be observed in Equation (6) that SSP is the endpoint of the transmission path of atmospheric radiation, and contributes to calculating the transmissivity of the atmosphere layer. Generally, when other atmospheric parameters are the same, increasing only the SSP will lead to a longer detection path of the microwave radiometer, which in turn leads to an increase in brightness temperature. However, it also can be found that SSP does not affect the satellite brightness temperature when the surface transmissivity ) is zero. Based on Equation (6), it can be concluded that the brightness temperatures of the satellite-based microwave radiometer’s channels with non-zero can be influenced by SSP, and thus contain the detection information on SSP.
3.2. Theoretical Analysis
According to Equation (6), it is theoretically possible to use the surface transmissivity for each channel of MWTS-II calculated by the radiative transfer model to determine which channels are sensitive to SSP. In this study, RTTOV v11.3 is selected to calculate the surface transmissivity and the simulated brightness temperature of MWTS-II. RTTOV is a very fast radiative transfer model for passive visible, infrared and microwave downward-viewing satellite radiometers, spectrometers and interferometers, and is widely used in the satellite observation retrieval and data assimilation communities [22]. The atmospheric parameters and satellite viewing angles from the analysis dataset built in Section 2.2 are input to RTTOV to obtain 393,093 sets of surface transmissivity for each channel of MWTS-II. The mean value of the surface transmissivity of each channel are shown in Figure 1.
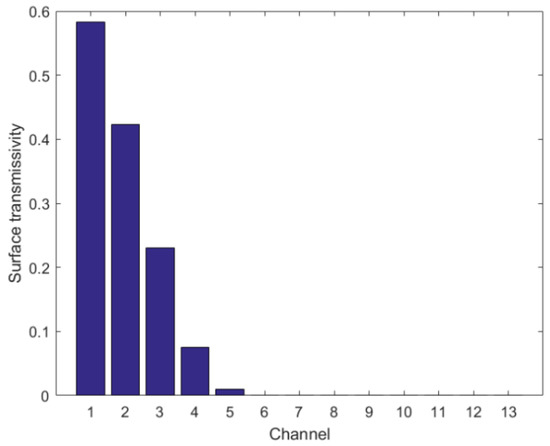
Figure 1.
The mean value of the surface transmissivity for each channel of MWTS-II.
It can be observed from Figure 1 that the mean values of the surface transmissivity for MWTS-II channels 1–5 with peak WF heights distributed in the middle and lower atmosphere are not zero, and the closer the peak WF height is to the surface, the greater the mean value of the surface transmissivity. The mean values of the surface transmissivity for MWTS-II channels 6–13 with peak WF heights distributed in the upper atmosphere are zero. Thus, MWTS-II channels 1–5 with non-zero mean values of the surface transmissivity are sensitive to SSP, while MWTS-II channels 6–13 with zero mean values of the surface transmissivity are not.
However, the atmospheric layers detected by MWTS-II channels are overlapping, and the atmospheric temperature, humidity, and surface parameters are linked in natural climate [33,45]. Therefore, the observations of MWTS-II channels may be correlated. The correlation coefficients between the observations of channels with zero and channels with non-zero are calculated using the analysis dataset, and the calculated correlation coefficients are shown in Table 2.
Table 2.
The correlation coefficients between the observations of channels with zero surface transmissivity and those with non-zero surface transmissivity.
Based on the mean values of the surface transmissivity for MWTS-II, MWTS-II channels 6–13 are not sensitive to SSP; however, their observations have the highest correlation with channel 5, channel 2, channel 3, channel 4, channel 2, channel 1, channel 2 and channel 3, with correlation coefficients of 0.880, –0.661, –0.509, –0.269, 0.370, 0.485, 0.386 and 0.387, respectively, as shown in Table 2. Therefore, there is a correlation between observations of channels with zero surface transmissivity and with non-zero surface transmissivity for MWTS-II. Although the main cause of the correlation is related to the atmospheric parameters at the same atmospheric layers detected by MWTS-II channels, there are natural linkages between atmospheric parameters such as pressure, temperature, humidity, etc. in natural climate. For this reason, pressure may also be a factor causing the correlation.
According to the above analysis, the observations of each channel of MWTS-II may contain the information about SSP. However, whether each channel of MWTS-II is sensitive to SSP can be verified by the sensitivity test method.
4. Model and Method
4.1. The Deep Neural Network Algorithm
Considering the demand for DNN in this study, a five-layer neural network is constructed, which contains an input layer, an output layer, and three hidden layers for carrying out nonlinear calculations between input and output parameters.
The Rectified Linear Unit (ReLU) function is employed as the activation function in the three hidden layers, which is the most successful and widely used activation function thus far in deep learning research. This configuration of layers, neurons, and activation function was selected after extensive testing with smaller and larger numbers of layers and neurons, and with different activation functions, such as Sigmoid and Leaky ReLU [46,47]. The optimizer used in this neural network is RMSprop, which is an adaptive learning rate algorithm for gradient-based optimization, with a learning rate of 0.0001. In the training of this neural networks, too many epochs can lead to overfitting, while too few could result in an underfitted model. In the present study, early stopping was the method used to terminate training before overfitting occurred. Early stopping split the training dataset and use a subset (20%) as a validation dataset to monitor the performance of DNN during training. If the loss on the validation dataset remains unchanged over a set number of epochs (or patience), the training of DNN will be stopped. An arbitrary large number of training epochs (or the maximum number of epochs) was specified, and the training would be stopped if the loss on the validation dataset did not change over a given patience. The maximum number of epochs and the patience used in this study were 3000 and 100, respectively.
This study involves the calculation of MWTS-II simulated brightness temperatures based on DNN and the retrieval study of SSP based on DNN. The input and output samples of DNN will be set up according to different research requirements.
4.2. The DNN-Based Model for MWTS-II Simulations
In this study, DNN is used to characterize the nonlinear relationship between MWTS-II observed brightness temperatures and atmospheric parameters due to its powerful nonlinear mapping ability. Additionally, a DNN-based model for MWTS-II simulations is established to calculate the observed brightness temperature of MWTS-II for high accuracy. The atmospheric parameters and satellite viewing angles from the analysis dataset are taken as the input, and the corresponding observed brightness temperatures are taken as the output to build the training dataset for DNN. Then, the number of neurons in the input and output layers are 192 and 15, respectively, and the number of neurons in all hidden layers is set to 512.
According to the above configuration, DNN is trained, and the DNN-based model for MWTS-II simulations are established. The atmospheric parameters and satellite viewing angles in the testing dataset are input to the DNN-based model for MWTS-II simulations to obtain the DNN-based simulated brightness temperatures, and the observed brightness temperatures in the testing dataset are used to validate the accuracy of the DNN-based brightness temperatures. The schematic of the building process of the DNN-based model for MWTS-II simulations is summarized in Figure 2.
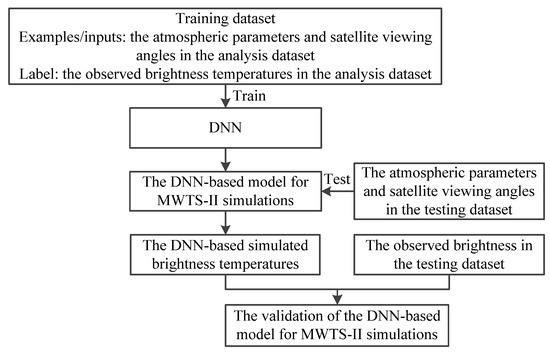
Figure 2.
The schematic of building the DNN-based model for MWTS-II simulations.
4.3. The DNN-Based Test Method for the Sensitivity of MWTS-II to SSP
The DNN-based test method for the sensitivity of MWTS-II to SSP can be established by inputting the artificially perturbed SSP data into the DNN-based model for MWTS-II simulations established in Section 4.2, as follows.
Firstly, the artificial perturbed SSP data are constructed, i.e., the starting value of SSP is 980 hPa, and we increased it to 1030 hPa in steps of 0.05 hPa to obtain 2001 SSP data. Then, a set of atmospheric parameters is selected randomly in the analysis dataset built in Section 2.2, and SSP in this set of atmospheric parameters is replaced by the 2001 artificial SSP sequentially. Thus, an artificial atmospheric parameter dataset containing 2001 sets of atmospheric parameters is established, in which all atmospheric parameters are the same except that SSP is changed. Finally, the artificial atmospheric parameter dataset and the satellite viewing angle (set to 0°) are input to the DNN-based model for MWTS-II simulations to calculate the simulated brightness temperature, and obtain the simulated brightness temperature versus SSP for each channel of MWTS-II.
5. Experimental Design
In this study, in order to verify that the sensitivity test results obtained by the DNN-based test method for the sensitivity of MWTS-II to SSP proposed in this paper are consistent with the theoretical analysis of microwave remote sensing of SSP in Section 3, the following experiments are designed.
Experiment 1: The validation of the DNN-based model for MWTS-II simulations. According to the building process of the DNN-based model for MWTS-II simulations shown in Figure 2, the DNN-based model for MWTS-II simulations can be built and the DNN-based simulated brightness temperatures can be obtained using the atmospheric parameters and satellite viewing angles in the testing dataset. Meanwhile, the RTTOV-based simulated brightness temperatures can be obtained by inputting the same testing dataset as the DNN-based model used into RTTOV. The accuracies of the DNN-based and RTTOV-based simulated brightness temperatures can be validated by the observed brightness temperatures in the testing dataset, and the accuracy comparison between the DNN-based and RTTOV-based simulated brightness temperatures can be analyzed.
Experiment 2: The sensitivity test experiment of MWTS-II to SSP. In order to present more reliable and robust experimental results, three artificial atmospheric parameter datasets are established randomly based on the analysis dataset as described in Section 4.3. These three datasets are input to the DNN-based model for MWTS-II simulations to calculate the DNN-based simulated temperatures, respectively. Then, the relationships between the DNN-based simulated brightness temperatures of each channel of MWTS-II and SSP are established. According to the above procedures, three DNN-based sensitivity test results can be obtained based on three artificial atmospheric parameter datasets.
In addition, for comparison, the same three atmospheric parameter datasets used in the DNN-based test method for the sensitivity of MWTS-II to SSP are also input to RTTOV, which represents the traditional radiative transfer model, to calculate the RTTOV-based simulated brightness temperatures. Thus, three RTTOV-based sensitivity test results of MWTS-II to SSP can also be obtained.
Experiment 3: The retrieval experiments of SSP based on the DNN-based simulated brightness temperatures. The purpose of these experiments is to further verify the DNN-based sensitivity test results of MWTS-II to SSP from Experiment 2. The DNN-based simulated brightness temperatures, which are generated by the DNN-based model for MWTS-II simulations, are used to retrieve SSP. DNN is also chosen as the retrieval algorithm for SSP, in which the configuration of DNN, such as structure, optimizer, learning algorithm, activation function, treatments for overfitting, and the method of determining the number of neurons in the hidden layers are the same as the DNN developed in the DNN-based model for MWTS-II simulations in Section 4.2.
The atmospheric parameters and satellite viewing angles in the testing dataset built in Section 2.2 are input to the DNN-based model for MWTS-II simulations to obtain the DNN-based simulated brightness temperatures. Then, the collocated samples in the testing dataset containing the atmospheric parameters, the observed brightness temperatures, and the DNN-based simulated brightness temperatures from 1 June to 10 August 2019 are selected to build the retrieval training dataset, which consists of 104,107 collocated samples, for training DNN in the retrieval algorithm. The collocated samples in the testing dataset from 11 August to 30 August 2019 are taken as the retrieval testing dataset, which consists of 26,027 collocated samples for the performance verification of the DNN-based retrieval algorithm for SSP.
The DNN-based simulated brightness temperatures of all channels of MWTS-II and SSP in the retrieval training dataset are used as the input and output of DNN, respectively, to train DNN and build the DNN-based retrieval model of SSP. Then, the DNN-based simulated brightness temperatures of all channels of MWTS-II in the retrieval testing dataset are input to the DNN-based retrieval model of SSP to obtain the retrievals of SSP. Taking SSP from the ERA-Interim in the retrieval testing dataset as the reference value, the root mean square error (RMSE) between the reference value and the retrieval value of SSP is calculated and used as the DNN-based retrieval baseline accuracy. The schematic of obtaining the DNN-based retrieval baseline accuracy is summarized in Figure 3.
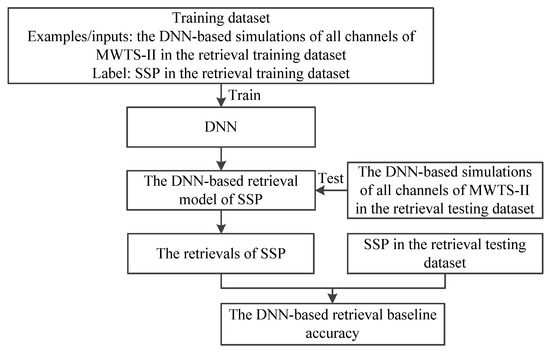
Figure 3.
The schematic of obtaining the DNN-based retrieval baseline accuracy.
In order to verify whether each channel of MWTS-II contributes to the SSP retrieval, a partial channel combination is established by removing one channel of MWTS-II at a time. Since MWTS-II has 13 channels, 13 partial channel combinations can be established. The DNN-based simulated brightness temperatures of the partial channel combination and SSP in the retrieval training dataset are used as the input and output of DNN, respectively, to build the corresponding DNN-based retrieval model of SSP. Moreover, the corresponding DNN-based simulated brightness temperatures in the retrieval testing dataset are used to retrieve SSP and obtain the SSP retrieval accuracy from the partial channel combination, which is built by removing the specific channel of MWTS-II. Then, the impact of the specific channel of MWTS-II on the SSP retrieval is evaluated by comparing the SSP retrieval accuracy from the partial channel combination with the DNN-based retrieval baseline accuracy. Following the same procedures, 13 SSP retrieval accuracies from the partial channel combinations can be obtained, and the contribution of each channel of MWTS-II to the SSP retrieval can be evaluated. The schematic of obtaining the SSP retrieval accuracy from the partial channel combination is shown in Figure 4.
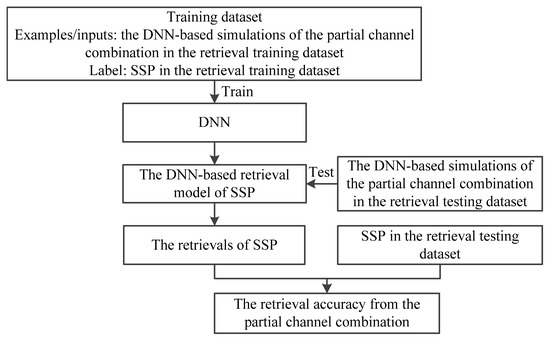
Figure 4.
The schematic of obtaining the retrieval accuracy from the partial channel combination.
Experiment 4: The retrieval experiments of SSP based on MWTS-II observed brightness temperatures. From the perspective of practical retrieval applications, it is necessary to validate the DNN-based sensitivity test method of MWTS-II to SSP by using the retrieval experimental results based on MWTS-II observed brightness temperatures. Meanwhile, the theoretical principle of passive microwave remote sensing of SSP can also be validated by the practical retrieval experiments of SSP.
The procedure to verify whether the observations of each channel contribute to the SSP retrieval is similar to that of Experiment 3. The observations of all channels of MWTS-II replace the DNN-based simulations of all channels of MWTS-II, as shown in Figure 3, to carry out the retrieval experiments of SSP, and then the practical retrieval model of SSP and the practical retrieval baseline accuracy can be obtained. The observations of the partial channel combinations replace the DNN-based simulations of the partial channel combinations in Figure 4 to carry out the retrieval experiments of SSP, then the corresponding practical retrieval model of SSP and the practical retrieval accuracy from the partial channel combination can be obtained. Whether the specific channel contributes to the SSP retrieval in the practical retrieval applications can be determined by comparing the practical retrieval baseline accuracy and the practical retrieval accuracy from the partial channel combination.
6. Experimental Results
This section presents the calculation results of the DNN-based model for MWTS-II simulations which is evaluated by the RMSE between the DNN-based brightness temperature and the observed brightness temperature. The sensitivity test results of MWTS-II to SSP based on the DNN-based simulated brightness temperatures are also analyzed. The results of the SSP retrieval experiments conducted to verify the sensitivity test results are also presented, and the RMSE, the correlation coefficient, and the mean bias between the SSP from ERA-Interim (i.e., the reference value) and the SSP retrievals are calculated for analyzing the SSP retrievals.
6.1. Results of the DNN-Based Model for MWTS-II Simulations
The atmospheric parameters and satellite viewing angles in the testing dataset are input to the DNN-based model for MWTS-II simulations and RTTOV, and 130,134 sets of DNN-based and 130,134 sets of RTTOV-based simulated brightness temperatures can be obtained, respectively. The RMSEs between these two kinds of simulated brightness temperatures and the observed brightness temperatures are calculated separately, then the accuracy comparison between them is shown in Figure 5.
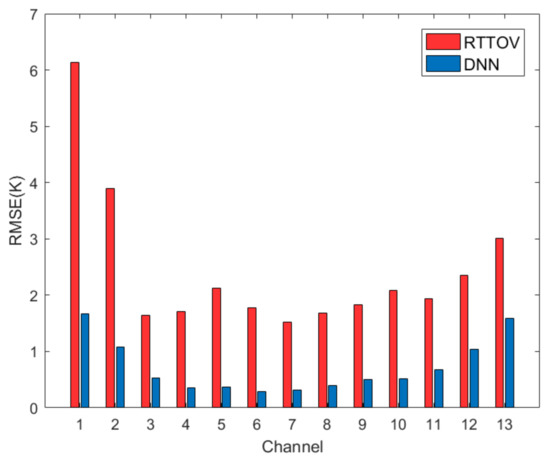
Figure 5.
The accuracy comparison between the DNN-based model for MWTS-II simulations and RTTOV.
Figure 5 shows that the accuracies of simulated brightness temperatures of RTTOV in channels 1 and 2 are poor, with 6.13 K and 3.89 K, respectively. The main reason for this is that the peak WF heights of these channels are close to the surface, and the radiations observed by these channels mainly come from the near-surface atmosphere and the surface. Therefore, errors in the temperature, water vapor, cloud and surface parameters all affect the measurements of these channels, and the nonlinearities between the simulated brightness temperature and atmospheric parameters are relatively complex. The radiations observed by the temperature sounding channels 3–12 with the peak WF heights far from the surface are mainly from the atmospheric temperature, and the accuracies of simulated brightness temperatures of these channels are relatively high, which are about 2 K. Although the peak WF height of channel 13 is distributed in the upper atmosphere, the accuracy in channel 13 is poor, about 3 K. The reason for this may be the poor on-orbit sensitivity of channel 13, as shown in Table 1. For the DNN-based simulated brightness temperature, as shown in Figure 5, the accuracies in channels 1 and 2 are 1.67 K and 1.07 K, respectively. The accuracies in channels 3–12 with peak WF heights far from the surface are all within 1 K. Similar to the calculation results of RTTOV, the accuracy of the simulated brightness temperature in channel 13 is 1.58 K, due to its poor on-orbit sensitivity.
Compared with the results of RTTOV, the accuracies of the simulated brightness temperatures calculated by the DNN-based model for MWTS-II simulations are significantly improved in all 13 channels of MWTS-II. The accuracies of the simulated brightness temperature calculated by the DNN-based model for MWTS-II simulations in channels 1 and 2 with relatively complex relationships between the measurements and atmospheric parameters have greatly improved, especially in channel 1, where the improvement is the largest at 4.5 K. The improvements in the accuracy of the simulated brightness temperatures calculated by the DNN-based model for MWTS-II simulations are all above 1.2 K in channels 3–13, with peak WF heights far from the surface. By comparison, it can be found that the DNN-based model can obtain higher calculation accuracy than RTTOV in terms of MWTS-II simulated brightness temperatures.
6.2. The Sensitivity Test Results of MWTS-II to SSP Based on MWTS-II Simulated Brightness Temperature
According to the experimental design of the sensitivity test of MWTS-II to SSP, three artificial atmospheric parameter datasets built randomly in Section 5 are input to the DNN-based model for MWTS-II simulation and RTTOV, and three DNN-based and three RTTOV-based sensitivity test results of MWTS-II to SSP can be obtained, respectively, as shown in Figure 6.
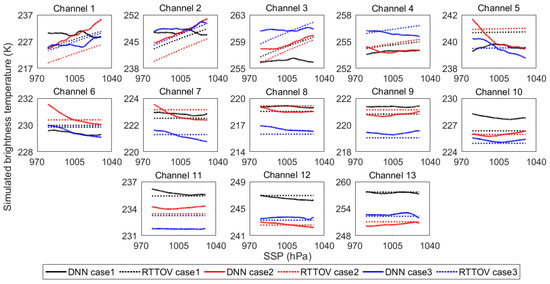
Figure 6.
The sensitivity test results of MWTS-II to SSP based on the DNN-based and RTTOV-based simulated brightness temperatures.
It can be observed from Figure 6 that for the RTTOV-based sensitivity test results, the simulated brightness temperatures of channels 1–4 are all highly sensitive to SSP, while the simulated brightness temperatures of channel 5 are less sensitive to SSP, and the simulated brightness temperatures of channels 6–13 are not sensitive to SSP. This sensitivity test result is consistent with the analytical inference of Equation (6) derived from the radiative transfer equation, i.e., microwave channels with non-zero surface transmissivity are sensitive to SSP, while microwave channels with zero surface transmissivity are not sensitive to SSP. In addition, according to the calculation of the average surface transmissivity for each channel of MWTS-II shown in Figure 1, it can be found that the larger the surface transmissivity, the more sensitive the simulated brightness temperatures are to SSP.
For the DNN-based sensitivity test results of MWTS-II to SSP, the simulated brightness temperatures of all channels of MWTS-II show sensitivity to SSP. This sensitivity test result can verify the conclusion of the theoretical analysis in Section 3 that each channel of MWTS-II has sensitivity to SSP. Moreover, it can be found that the sensitivity of each channel to SSP is different, and some channels, such as channels 1–4, are more sensitive to SSP than other channels.
Meanwhile, it can be observed from Figure 6 that the simulated brightness temperatures of channels 1–5 all increase with increasing SSP in the RTTOV-based sensitivity test results of MWTS-II to SSP, which may be explained by the fact that all other atmospheric parameters are the same while the detection path of the satellite becomes longer as SSP increases, thus leading to an increase in the atmospheric radiation detected by the microwave radiometer. However, the simulated brightness temperatures of each channel of MWTS-II exhibit various variation patterns with changes in SSP in the DNN-based sensitivity test results of MWTS-II to SSP, which may be caused by the sensitivity of the DNN-based model for MWTS-II simulations to different atmospheric parameters and the combined effects of atmospheric parameters. In addition, the differences between the three cases in the RTTOV-based or DNN-based sensitivity test results are mainly due to the differences in the atmospheric parameters in the three artificial atmospheric parameter datasets.
It should be noted that the DNN-based model for MWTS-II simulations established in this study is fundamentally different from the traditional radiative transfer models such as RTTOV, CRTM and ARTS. The DNN-based model for MWTS-II simulations is a statistical modeling of the relationship between atmospheric parameters and satellite-observed brightness temperatures, without any physical concept involved. The atmospheric parameters can be used to calculate the simulated brightness temperatures as long as they meet the requirements of DNN for the input samples. Therefore, the artificial atmospheric parameters dataset constructed in Section 4.3 satisfies the requirements of the DNN-based model for MWTS-II simulations with respect to the input atmospheric parameters, although the atmospheric parameters may not be the actual physical atmospheric parameters.
However, the traditional radiative transfer model is developed based on the radiative transfer equation, which is essentially a modeling of the transmission process of electromagnetic waves in the atmosphere and is a direct representation of the physical concept. The precondition for the establishment of the radiative transfer model is that the atmosphere should be in static equilibrium, and the atmospheric parameters involved in the radiative transfer calculation are expected to be in line with the actual physical state as much as possible. However, the sensitivity tests of MWTS-II to SSP based on RTTOV using the actual physical atmospheric parameters have been carried out in previous research work, and the findings have shown that the sensitivity test results using the actual atmospheric parameters are consistent with those obtained in this study using the artificial atmospheric parameter dataset, details of which can be referred to He et al. [20].
On the basis of the above sensitivity test results of MWTS-II to SSP, it can be concluded that the RTTOV-based sensitivity test result of MWTS-II to SSP is consistent with the theoretical analysis of Equation (6), i.e., MWTS-II channels with non-zero surface transmissivity are sensitive to SSP, while MWTS-II channels with zero surface transmissivity are not sensitive to SSP. Therefore, RTTOV cannot describe the correlation between microwave observations due to SSP. However, the DNN-based model for MWTS-II simulations can characterize the correlation between observations of channels due to SSP, and the DNN-based sensitivity test result is consistent with the conclusion of the theoretical analysis in Section 3 that each channel of MWTS-II is sensitive to SSP.
6.3. The Retrieval Results of SSP Based on MWTS-II Simulated Brightness Temperatures
In order to validate the DNN-based sensitivity test result that each channel of MWTS-II is sensitive to SSP, i.e., each channel contributes to the SSP retrieval, according to the design of Experiment 3, SSP is retrieved using the DNN-based simulated brightness temperatures of all channels of MWTS-II in the retrieval testing dataset, 26,027 retrieval values of SSP and the DNN-based retrieval baseline accuracy are obtained, and the retrieval results are shown in Figure 7. It can be seen that the correlation coefficient and the bias between the retrieval values and the reference values of SSP is 0.956 and 0.159 hPa, respectively. The DNN-based retrieval baseline accuracy is 2.115 hPa.
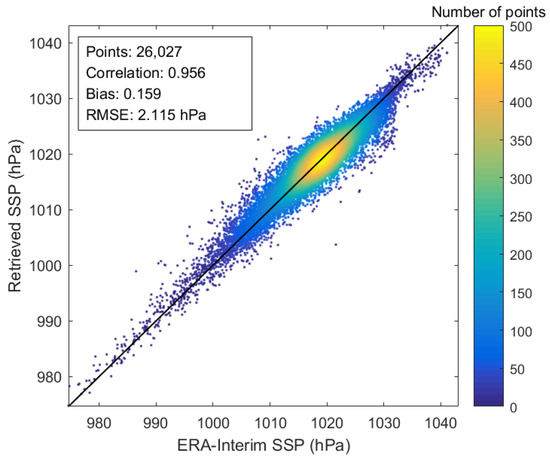
Figure 7.
The retrieval results of SSP using the DNN-based simulated brightness temperatures of all channels of MWTS-II.
Then, 13 partial channel combinations can be established by removing each channel of MWTS-II one-at-a-time, separately, which corresponds to 13 retrieval accuracies of SSP. The differences between each of these 13 retrieval accuracies and the DNN-based baseline retrieval accuracy are shown in Figure 8, and the complete retrieval results are summarized in Table 3.
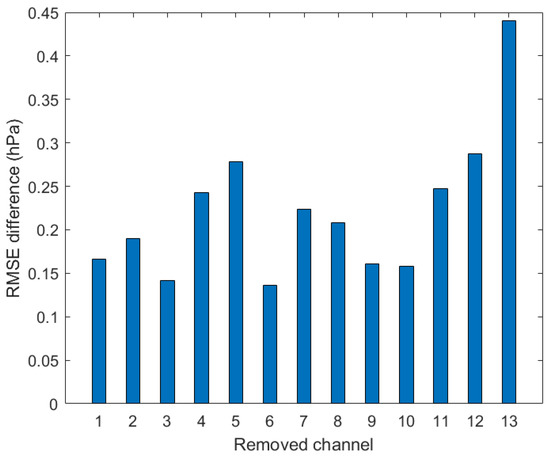
Figure 8.
The difference between the retrieval accuracy from the partial channel combination and the DNN-based retrieval baseline accuracy.
Table 3.
The SSP retrieval results using the DNN-based simulated brightness temperatures of the partial channel combinations.
By comparing the retrieval accuracy from the partial channel combination with the DNN-based retrieval baseline accuracy, it can be observed through Figure 8 and Table 3 that all the retrieval accuracies from the partial channel combination are lower than the DNN-based retrieval baseline accuracy, and the correlation coefficients between the retrieval values and the reference values are all lower than those using all channels of MWTS-II. This indicates that when any channel is removed from MWTS-II, the SSP retrieval accuracy decreases, and the decrease is greater than at least 0.14 hPa. It is to be noted that although MWTS-II channels 12 and 13 mainly detect the upper atmosphere, the effects of the removal of these two channels on the DNN-based retrieval baseline accuracy are up to 0.3 hPa.
6.4. The Retrieval Results of SSP Based on MWTS-II Observed Brightness Temperatures
The above sensitivity test experiments of MWTS-II to SSP and the SSP retrieval experiments are carried out using MWTS-II simulated brightness temperature. However, as shown in Figure 5, there are biases between the simulated and the observed brightness temperatures. Therefore, it is necessary to perform the SSP retrieval experiments using MWTS-II observed brightness temperatures to further validate the DNN-based test method for the sensitivity of MWTS-II to SSP established in this study, and also to validate the theoretical analysis of microwave remote sensing of SSP presented in Section 3 with the actual satellite observations.
According to the experimental design of Experiment 4, the observed brightness temperatures of all channels of MWTS-II in the retrieval testing dataset are used to retrieve SSP, and 26,027 retrieval values of SSP and the practical retrieval baseline accuracy can be obtained. The retrieval results are shown in Figure 9. In addition, 13 practical retrieval accuracies from the partial channel combinations are obtained, which are compared with the practical retrieval baseline accuracy as shown in Figure 10. The complete retrieval results from the partial channel combinations are summarized in Table 4.
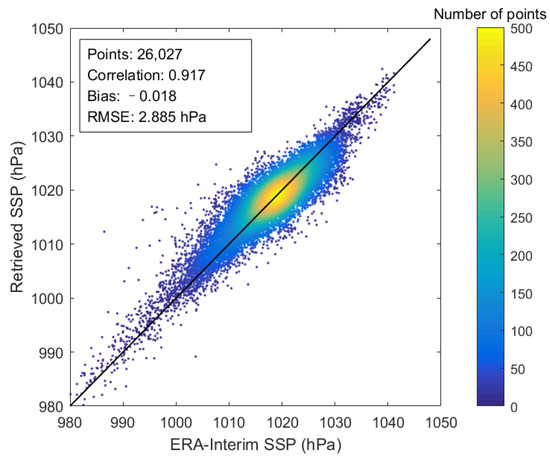
Figure 9.
The retrieval result of SSP using the observed brightness temperatures of all channels of MWTS-II.
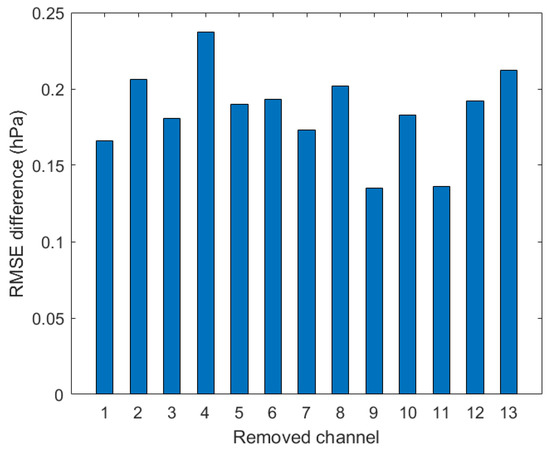
Figure 10.
The difference between the practical retrieval accuracy from the partial channel combination and the practical retrieval baseline accuracy.
Table 4.
The SSP retrieval results using the observed brightness temperatures of the partial channel combinations.
As can be seen from Figure 9, the correlation coefficient, bias, and RMSE between the retrieval values and the reference values of SSP are 0.917, –0.018 hPa, and 2.885 hPa, respectively. Compared to the retrieval results of SSP from the DNN-based simulated brightness temperature shown in Figure 7, the bias between the simulated brightness temperature and the observed brightness temperature decreases the retrieval accuracy of SSP from the observed brightness temperature by about 0.8 hPa.
The comparison of the practical retrieval baseline accuracy with the practical retrieval accuracy from the partial channel combinations can be seen in Figure 10; the removal of any one channel in MWTS-II reduces the practical retrieval baseline accuracy. The effect of removing MWTS-II channel 9 or 12 on the practical retrieval baseline accuracy is relatively small, about 0.13 hPa, whereas the practical retrieval baseline accuracy is significantly reduced by more than 0.2 hPa when any one of MWTS channel 2, channel 8, and channel 13 are removed. In addition, it should be noted that, similar to the SSP retrieval results from removing MWTS-II channel 13 in Table 3, the SSP retrieval result from removing MWTS-II channel 13 shown in Table 4 also make an important contribution to the SSP retrieval.
Through the above analysis, it can be concluded that the SSP retrieval experimental results using the observed brightness temperatures indicate that each channel of MWTS-II contributes to the SSP retrieval, which is consistent with that of the SSP retrieval experiments using the DNN-based simulated brightness temperatures. This demonstrates the reliability of the DNN-based sensitivity test results, as well as the feasibility of the DNN-based test method for the sensitivity of MWTS-II to SSP proposed in this study. In addition, The SSP retrieval experimental results based on MWTS-II observed brightness temperatures validate the theoretical analysis of passive microwave remote sensing of SSP in Section 3 from the perspective of practical retrieval application.
6.5. Evaluation of Algorithm Stability
It should be noted that the calculation of MWTS-II simulated brightness temperature and the retrieval experiments of SSP are both carried out based on DNN in this study. Therefore, the analysis of the stability of DNN, which may have a direct impact on the experimental results and experimental conclusions, is of great importance. A well-constructed DNN can always obtain almost identical predictions, which is not affected by the DNN’s initialization represented by the biases and weights used at the start of training.
Taking the retrieval of SSP using the observed brightness temperatures of the partial channel combinations in this study as an example, the stability of DNN constructed in this study is tested. According to the process of obtaining the practical retrieval accuracy from the partial channel combination in Experiment 4, for the specific partial channel combination, DNN is retrained with three randomly-initialized weights and biases, and three tested retrieval accuracies from the specific channel combination can be obtained. Meanwhile, the differences in the retrieval accuracies between the three tested retrieval accuracies from the specific partial channel combination and the practical retrieval accuracy from the corresponding channel combination as described in Section 6.4 can be obtained. For 13 partial channel combinations of MWTS-II, 13 sets of the differences in the retrieval accuracies between the three tested retrieval accuracies from a partial channel combination and the practical retrieval accuracy from the corresponding partial channel combination can be obtained, and are shown in Figure 11.
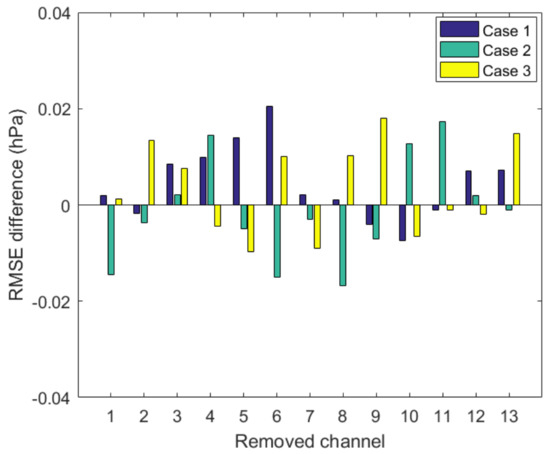
Figure 11.
The stability test result of DNN in retrieving SSP using the observed brightness temperatures of the partial channel combinations.
It can be seen from Figure 11 that when different weights and biases are used at the start of training DNN, the differences of the RMSEs of the SSP retrievals using the observed brightness temperatures of the partial channel combination between three tested retrieval accuracies from a partial channel combination and the practical retrieval accuracy from the corresponding partial channel combination stay within 0.02 hPa for all 13 partial channel combinations. Thus, the retrieval accuracy difference of 0.02 hPa due to the DNN can be negligible to the retrieval results of SSP based on MWTS-II brightness temperatures shown given in Section 6.4. The stability test result of DNN in retrieving SSP reveals that the DNN constructed in this study is stable, and therefore the experimental results based on DNN as well as the experimental conclusions presented in this study are reliable.
7. Conclusions
In this paper, the DNN-based test method for the sensitivity of MWTS-II to SSP is proposed, which can study the sensitivity of MWTS-II to SSP caused by the correlation between MWTS-II channels and then describes the relationship between MWTS-II observations and SSP more accurately than the traditional sensitivity test method based on the radiative transfer model RTTOV. The retrieval experiments of SSP using the DNN-based simulated brightness temperatures and the observed brightness temperatures are performed to demonstrate the feasibility of the DNN-based test method proposed in this study. The theoretical analysis of passive microwave remote sensing of SSP is also verified from the perspective of the practical retrieval of SSP.
The DNN-based test method for the sensitivity of MWTS-II to SSP established in this paper is not only applicable to SSP but may also have potential applications in the sensitivity testing of atmospheric parameters, such as temperature, humidity, cloud water and surface parameters. The next promising research direction is to apply the DNN-based test method to the sensitivity studies of other atmospheric parameters. In addition, the relationship between atmospheric parameters and MWTS-II measurements is described using DNN and the DNN-based model for MWTS-II simulations is developed. The brightness temperature values calculated with the DNN display a closer match to actual values than the values simulated with the RTTOV model. Therefore, research on the application of the DNN-based model for MWTS-II simulations in passive microwave remote sensing atmospheric parameters is also the focus of future work.
Author Contributions
Q.H. and Z.W. designed the study; Q.H. and J.L. carried out the experiments; Z.W. presented some conclusions; Q.H. wrote the manuscript; and Q.H., J.L., Z.W. and W.W. edited the article. All authors have read and agreed to the published version of the manuscript.
Funding
This research was funded by the National Natural Science Foundation of China under Grant No. 41901297, the Science and Technology Key Project of Henan Province under Grant No. 202102310017, 222102210104, the Key Research Projects for the Universities of Henan Province under Grant No. 20A170013, 22A120009, and the China Postdoctoral Science Foundation under Grant No. 2021M693201.
Data Availability Statement
Not applicable.
Acknowledgments
The authors would like to thank NSMC for providing the MWTS-II observations, as well as ECMWF for providing the ERA-Interim reanalysis data.
Conflicts of Interest
The authors declare no conflict of interest. The funders had no role in the design of the study; in the collection, analyses, or interpretation of data; in the writing of the manuscript, or in the decision to publish the results.
References
- Lorenc, A.C. Analysis methods for numerical weather prediction. Q. J. R. Meteorol. Soc. 2010, 112, 1177–1194. [Google Scholar] [CrossRef]
- Holton, J.R.; Hakim, G.J. An Introduction to Dynamic Meteorology; Academic Press: New York, NY, USA, 2013. [Google Scholar]
- Min, Q.; Gong, W.; Lin, B.; Hu, Y. Application of surface pressure measurements from O2-band differential absorption radar system in three-dimensional data assimilation on hurricane: Part I. An observing system simulation experiments study. J. Quant. Spectrosc. Radiat. Transf. 2011, 150, 148–165. [Google Scholar] [CrossRef]
- Min, Q.; Gong, W.; Lin, B.; Hu, Y. Application of surface pressure measurements from O2-band differential absorption radar system in three-dimensional data assimilation on hurricane: Part II. A quasi-observational study. J. Quant. Spectrosc. Radiat. Transf. 2015, 150, 166–174. [Google Scholar] [CrossRef]
- Zhang, Z. Remote sounding of atmospheric pressure profile from space, part 1: Principle. J. Appl. Remote Sens. 2010, 4, 2840–2849. [Google Scholar] [CrossRef]
- Millán, L.; Lebsock, M.; Livesey, N.; Tanelli, S.; Stephens, G. Differential absorption radar techniques: Surface pressure. Atmos. Meas. Tech. 2014, 7, 3959–3970. [Google Scholar] [CrossRef][Green Version]
- Rosenkranz, P.W. Retrieval of temperature and moisture profiles from AMSU-A and AMSU-B measurements. IEEE Trans. Geosci. Remote Sens. 2001, 39, 2429–2435. [Google Scholar] [CrossRef]
- Purna Chand, C.; Rao, M.V.; Ramana, I.V.; Ali, M.M.; Patoux, J.; Bourassa, M.A. Estimation of sea level pressure fields during Cyclone Nilam from Oceansat-2 scatterometer winds. Atmos. Sci. Lett. 2014, 15, 65–71. [Google Scholar] [CrossRef]
- Zhang, Z.; Dong, X.; Liu, L.; He, J. Retrieval of barometric pressure from satellite passive microwave observations over the oceans. J. Geophys. Res. 2018, 123, 4360–4372. [Google Scholar] [CrossRef]
- Zhang, Z. Study on the Retrieval Theory and Method of Sea Surface Pressure Basing on Passive Microwave Observations. Ph.D. Thesis, Chinese Academy of Science, Beijing, China, 2019. [Google Scholar]
- Elachi, C.; van Zyl, J. Introduction to the Physics and Techniques of Remote Sensing; John Wiley & Sons Inc.: Hoboken, NJ, USA, 2006. [Google Scholar] [CrossRef]
- Rodgers, C.D. Retrieval of atmospheric temperature and composition from remote measurements of thermal radiation. Rev. Geophys. 1976, 14, 609–624. [Google Scholar] [CrossRef]
- Klein, M.; Gasiewski, A.J. Nadir sensitivity of passive millimeter and submillimeter wave channels to clear air temperature and water vapor variations. J. Geophys. Res. Atmos. 2000, 105, 17481–17511. [Google Scholar] [CrossRef]
- Zhang, K.; Gasiewski, A.J. Multiband Simulations of Multistream Polarimetric Microwave Radiances Over Aspherical Hydrometeors. J. Geophys. Res. Atmos. 2018, 123, 12738–12761. [Google Scholar] [CrossRef]
- Guo, Y.; Lu, N.; Gu, S. Simulation of the radiometric characteristics of 118 GHz and 183 GHz channels for FY-3C new microwave radiometer sounder. J. Infrared Millim. Waves 2014, 33, 481. [Google Scholar] [CrossRef]
- Hong, G.; Heygster, G.; Miao, J.; Kunzi, K. Sensitivity of microwave brightness temperatures to hydrometeors in a tropical deep convective cloud system at 89–190 GHz. Radio Sci. 2005, 40, RS4003. [Google Scholar] [CrossRef]
- Weng, F.; Zou, X.; Qin, Z. Uncertainty of AMSU-A derived temperature trends in relationship with clouds and precipitation over ocean. Clim. Dyn. 2014, 43, 1439–1448. [Google Scholar] [CrossRef]
- Moradi, I.; Ferraro, R.R.; Soden, B.J.; Eriksson, P.; Arkin, P. Retrieving Layer-Averaged Tropospheric Humidity from Advanced Technology Microwave Sounder Water Vapor Channels. IEEE Trans. Geosci. Remote Sens. 2015, 53, 6675–6688. [Google Scholar] [CrossRef][Green Version]
- Navas-Guzmán, F.; Stähli, O.; Kämpfer, N. An integrated approach toward the incorporation of clouds in the temperature retrievals from microwave measurements. Atmos. Meas. Tech. 2014, 7, 1619–1628. [Google Scholar] [CrossRef]
- He, Q.; Wang, Z.; Li, J. Fusion Retrieval of Sea Surface Barometric Pressure from the Microwave Humidity and Temperature Sounder and Microwave Temperature Sounder-II Onboard the Fengyun-3 Satellite. Remote Sens. 2022, 14, 276. [Google Scholar] [CrossRef]
- Saunders, R.; Hocking, J.; Rundle, D.; Rayer, P.; Matricardi, M.; Geer, A.; Lupu, C.; Brunel, P.; Vidot, J. RTTOV-11 Science and Validation Report; NWP-SAF Report; Met Office: Exeter, UK, 2013; pp. 1–62.
- Saunders, R.; Hocking, J.; Turner, E.; Rayer, P.; Rundle, D.; Brunel, P.; Vidot, J.; Roquet, P.; Matricardi, M.; Geer, A.; et al. An update on the RTTOV fast radiative transfer model (currently at version 12). Geosci. Model Dev. 2018, 11, 2717–2737. [Google Scholar] [CrossRef]
- Han, Y.; Van Delst, P.; Liu, Q.H.; Weng, F.Z.; Yan, B.; Treadon, R.; Derber, J. Community Radiative Transfer Model (CRTM), Version 1; NOAA Technical Report 122; Department of Commerce/NOAA/NESDIS: Washington, DC, USA, 2006.
- Buehler, S.A.; Mendrok, J.; Eriksson, P.; Perrin, A.; Larsson, R.; Lemke, O. ARTS, the Atmospheric Radiative Transfer Simulator—version 2.2, the planetary toolbox edition. Geosci. Model Dev. 2018, 11, 1537–1556. [Google Scholar] [CrossRef]
- He, Q.; Wang, Z.; He, J. Bias correction for retrieval of atmospheric parameters from the Microwave Humidity and Temperature Sounder onboard the Fengyun-3C satellite. Atmosphere 2016, 7, 156. [Google Scholar] [CrossRef]
- Auligné, T.; McNally, A.P.; Dee, D.P. Adaptive bias correction for satellite data in a numerical weather prediction system. Q. J. R. Meteorol. Soc. 2007, 133, 631–642. [Google Scholar] [CrossRef]
- Zhu, Y.; Derber, J.; Collard, A.; Dee, D.; Treason, R.; Gayno, G.; Jung, J.A. Enhanced radiance bias correction in the National Centers for Environmental Prediction’s Gridpoint Statistical Interpolation data assimilation system. Q. J. R. Meteorol. Soc. 2014, 140, 1479–1492. [Google Scholar] [CrossRef]
- Yan, X.; Liang, C.; Jiang, Y.; Luo, N.; Zang, Z.; Li, Z. A deep learning approach to improve the retrieval of temperature and humidity profiles from a ground-based microwave radiometer. IEEE Trans. Geosci. Remote Sens. 2020, 58, 8427–8437. [Google Scholar] [CrossRef]
- Zhou, Y.; Grasstotti, C. Development of a machine learning-based radiometric bias correction for NOAA’s Microwave integrated retrieval system (MIRS). Remote Sens. 2020, 12, 3160. [Google Scholar] [CrossRef]
- He, Q.; Wang, Z.; Li, J. Application of the Deep Neural Network in Retrieving the Atmospheric Temperature and Humidity Profiles from the Microwave Humidity and Temperature Sounder Onboard the Feng-Yun-3 Satellite. Sensors 2021, 21, 4673. [Google Scholar] [CrossRef]
- Dueben, P.; Modigliani, U.; Geer, A.; Siemen, S.; Pappenberger, F.; Bauer, P.; Brown, A.; Palkovič, M.; Raoult, B.; Wedi, N.; et al. Machine Learning at ECMWF: A Roadmap for the Next 10 Years; Technical Report, Number 878; European Centre for Medium-Range Weather Forecasts: Reading, UK, 2021; pp. 1–18. [Google Scholar] [CrossRef]
- Aires, F.; Weston, P.; Rosnay, P.; Fairbairn, D. Statistical approaches to assimilate ASCAT soil moisture information: Part I Methodologies and first assessment. Q. J. R. Meteorol. Soc. 2021, 147, 1823–1825. [Google Scholar] [CrossRef]
- Blackwell, W.J.; Chen, F.W. Neural Networks in Atmospheric Remote Sensing; Artech House: Norwood, MA, USA, 2009. [Google Scholar]
- Yuan, B.; Ma, G.; Zhang, P.; Xi, S.; Wang, T. A Precipitation Detection Method for MWTS-Ⅱ Radiance Assimilation in Typhoon Simulation. J. Trop. Meteorol. 2020, 26, 150–160. [Google Scholar] [CrossRef]
- Niu, Z.; Zhang, L.; Dong, P.; Weng, F.; Huang, W. Impact of Assimilating FY-3D MWTS-2 Upper Air Sounding Data on Forecasting Typhoon Lekima. Remote Sens. 2021, 13, 1841. [Google Scholar] [CrossRef]
- Wang, Z.; Li, J.; He, J.; Zhang, S.; Gu, S.; Li, Y.; Guo, Y.; He, B. Performance analysis of Microwave Humidity and Temperature Sounder onboard the FY-3D satellite from prelaunch multiangle calibration data in thermal/vacuum test. IEEE Trans. Geosci. Remote Sens. 2019, 57, 1664–1683. [Google Scholar] [CrossRef]
- Xia, X.; Zou, X. Combining FY-3D MWTS-2 with AMSU-A data for inter-decadal diurnal correction and climate trends of atmospheric temperature. Remote Sens. 2021, 13, 3148. [Google Scholar] [CrossRef]
- Su, X.; Jiang, G. Intercalibration of FY-3D MWTS against S-NPP ATMS based on microwave radiative transfer model. IEEE J. Sel. Top. Appl. Earth Obs. Remote Sens. 2021, 14, 8427–8435. [Google Scholar] [CrossRef]
- Lu, Q.; Hu, J.; Wu, C.; Qi, C.; Wu, S.; Xu, N.; Sun, L.; Li, X.; Liu, H.; Guo, Y.; et al. Monitoring the performance of the Fengyun satellite instruments using radiative transfer models and NWP fields. J. Quant. Spectrosc. Radiat. Transf. 2020, 225, 107239. [Google Scholar] [CrossRef]
- Li, J.; Liu, G. Direct assimilation of Chinese FY-3C Microwave Temperature Sounder-2 radiances in the global GRAPES system. Atmos. Meas. Tech. 2016, 9, 3095–3113. [Google Scholar] [CrossRef]
- Carminati, F.; Migliorini, S. All-sky data assimilation of MWTS-2 and MWHS-2 in the Met Office Global NWP System. Adv. Atmos. Sci. 2021, 38, 1682–1694. [Google Scholar] [CrossRef]
- Dee, D.P.; Uppala, S.M.; Simmons, A.J.; Berrisford, P.; Poli, P.; Kobayashi, S.; Andrae, U.; Balmaseda, M.A.; Balsamo, G.; Bauer, P.; et al. The ERA-Interim reanalysis: Configuration and performance of the data assimilation system. Q. J. R. Meteorol. Soc. 2011, 137, 553–597. [Google Scholar] [CrossRef]
- Berrisford, P.; Dee, D.; Poli, P.; Brugge, R.; Fielding, K.; Fuentes, M.; Kallberg, P.; Kobayashi, S. The ERA-Interim Archive Version 2.0; ERA Report Series 1; ECMWF: Reading, UK, 2011. [Google Scholar]
- Ulaby, F.T.; Moore, R.K.; Fung, A.K. Microwave Remote Sensing: Active and Passive; Addison-Wesley: Reading, MA, USA, 1981. [Google Scholar]
- Boukabara, S.A.; Garrett, K.; Chen, W.; Iturbide-Sanchez, F.; Grassotti, C.; Kongoli, C.; Chen, R.; Liu, Q.; Yan, B.; Weng, F.; et al. MiRS: An all-weather 1DVAR satellite data assimilation and retrieval system. IEEE Trans. Geosci. Remote Sens. 2011, 49, 3249–3272. [Google Scholar] [CrossRef]
- Srivastava, N.; Hinton, G.; Krizhevsky, A.; Sutskever, I.; Salakhutdinov, R. Dropout: A simple way to prevent neural net-works from overfitting. J. Mach. Learn. Res. 2014, 15, 1929–1958. [Google Scholar]
- Lee, Y.; Han, D.; Ahn, M.H.; Im, J.; Lee, S.J. Retrieval of total precipitable water from Himawari-8 AHI data: A comparison of random forest, extreme gradient boosting, and deep neural network. Remote Sens. 2019, 11, 1741. [Google Scholar] [CrossRef]
Publisher’s Note: MDPI stays neutral with regard to jurisdictional claims in published maps and institutional affiliations. |
© 2022 by the authors. Licensee MDPI, Basel, Switzerland. This article is an open access article distributed under the terms and conditions of the Creative Commons Attribution (CC BY) license (https://creativecommons.org/licenses/by/4.0/).