
Estimation of Regional Ground-Level PM2.5 Concentrations Directly from Satellite Top-of-Atmosphere Reflectance Using A Hybrid Learning Model


Abstract
:1. Introduction
2. Materials and Methods
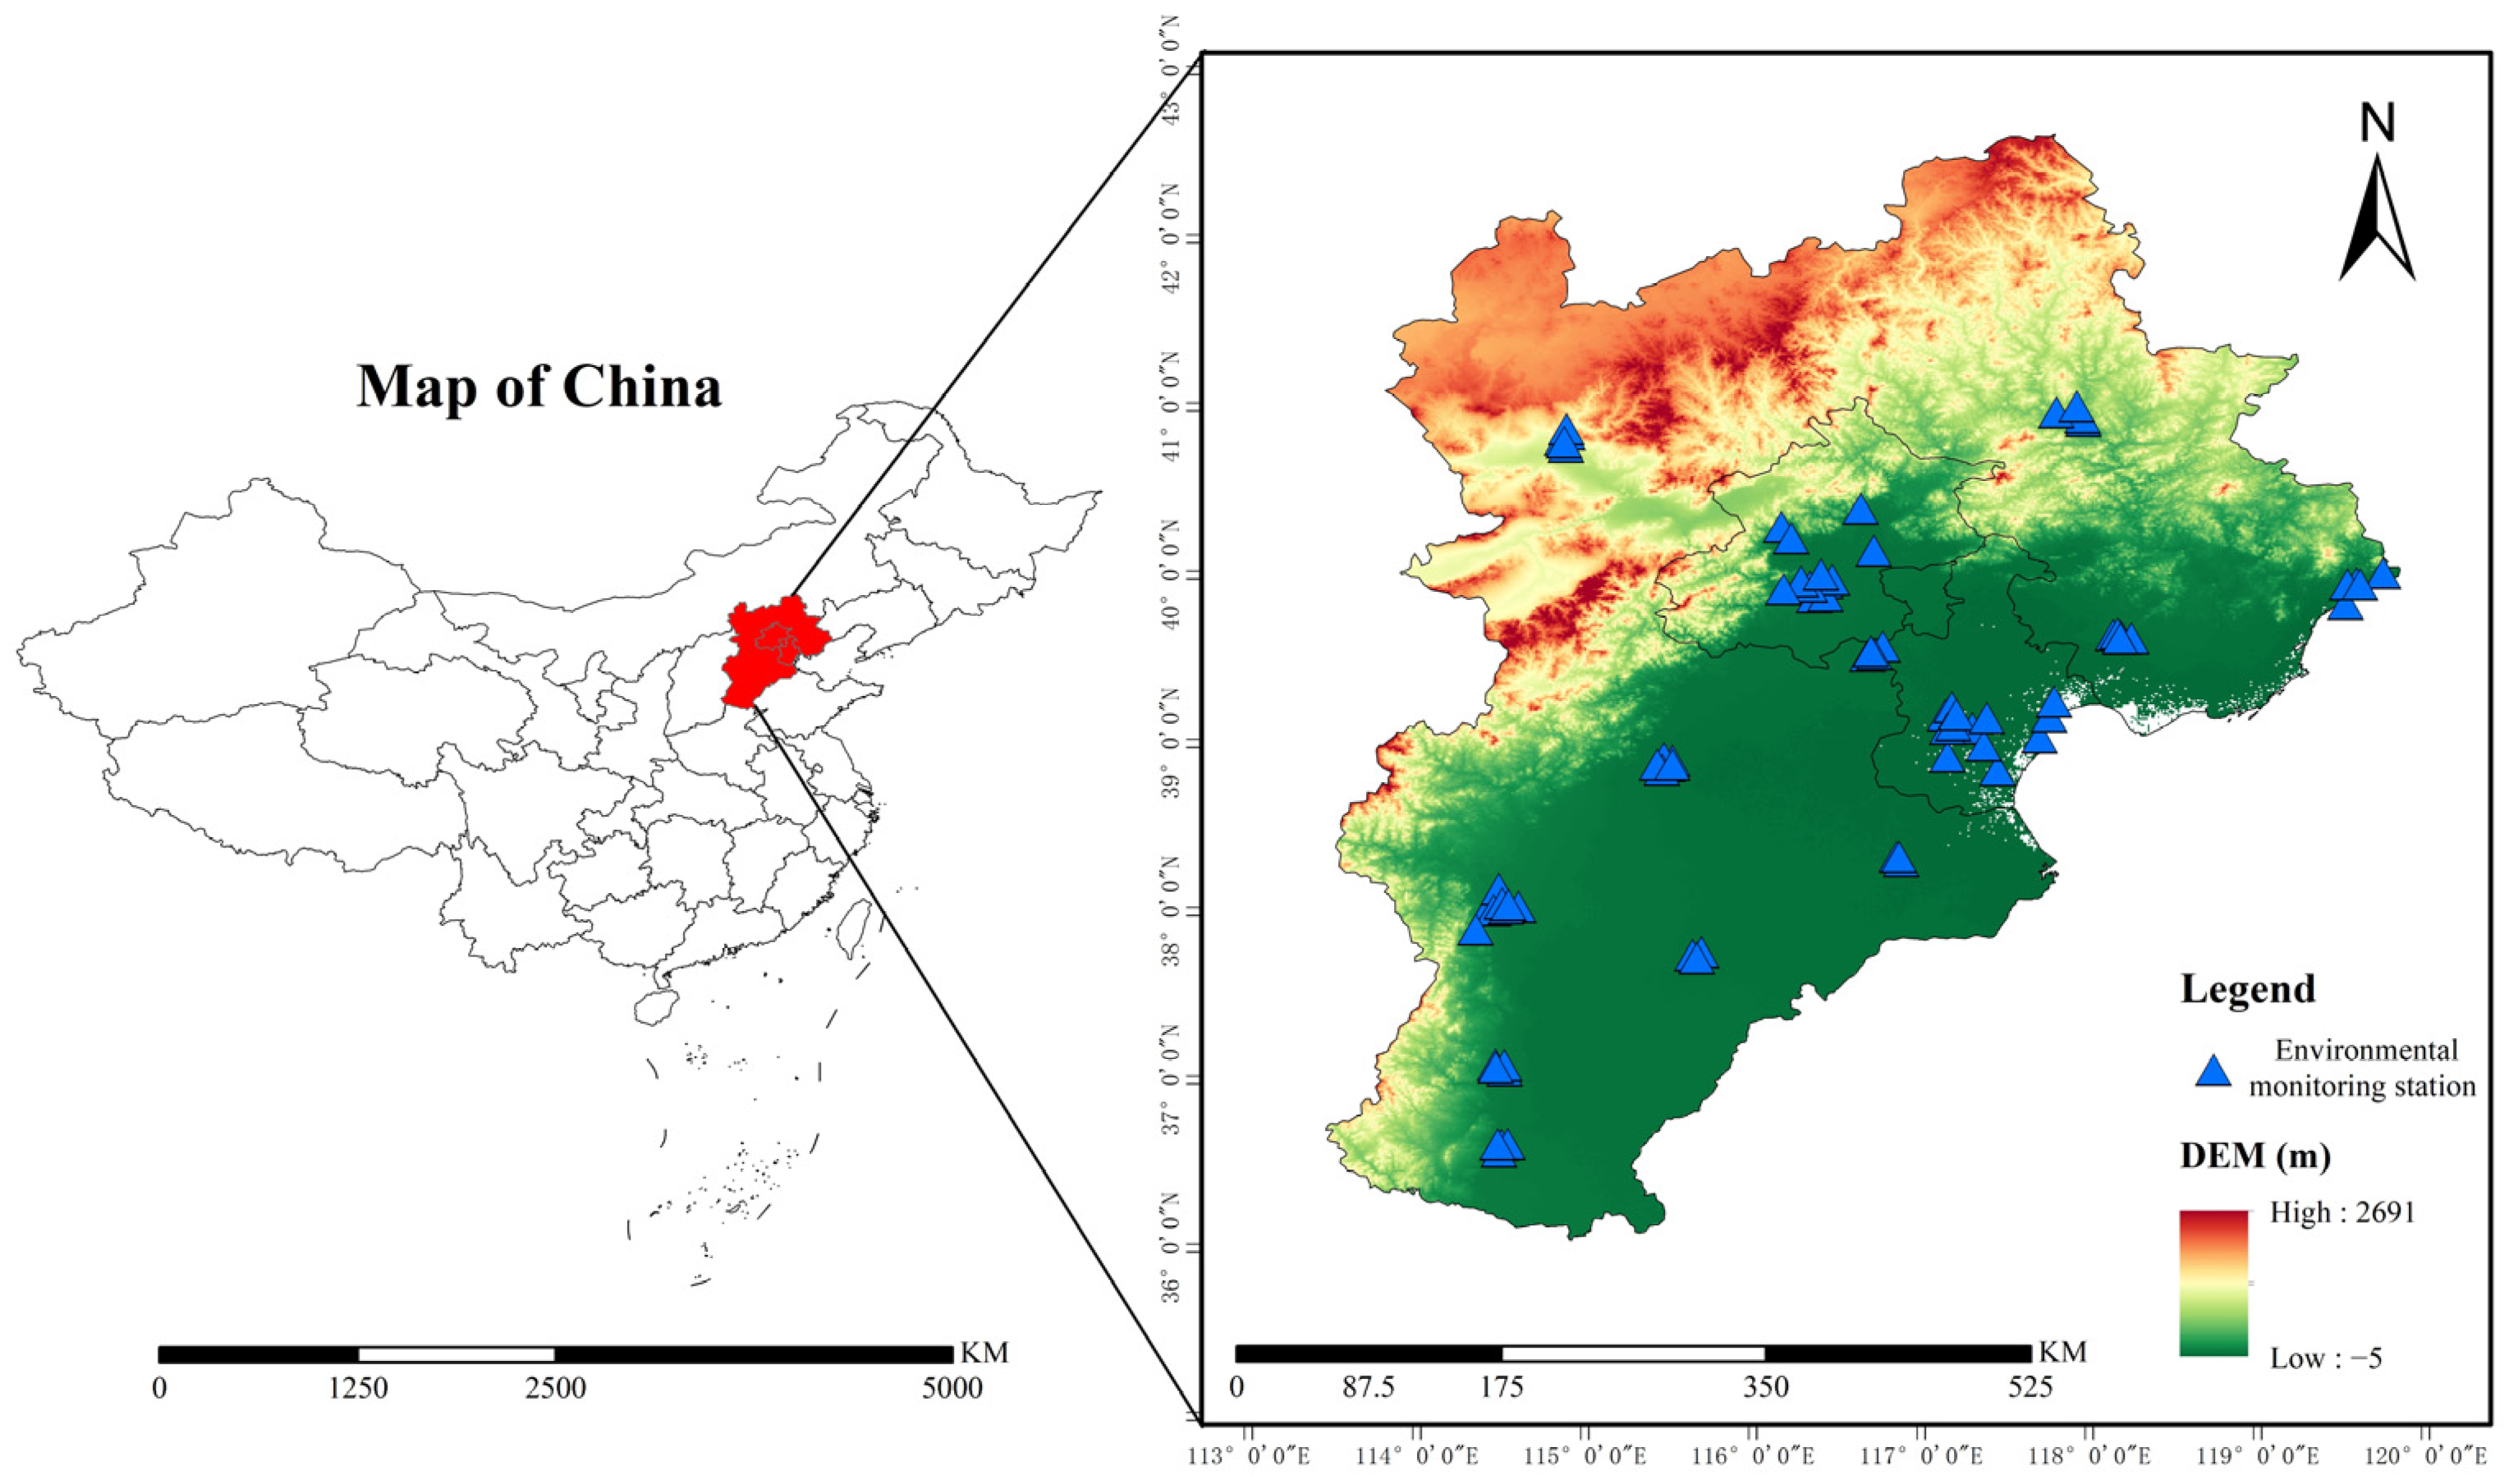
2.1. Research Area
2.2. Data Collection
- (1)
- Near-ground PM2.5 monitoring data
- (2)
- Satellite Data
- (3)
- Meteorological and elevation data
- (4)
- Descriptive Statistics
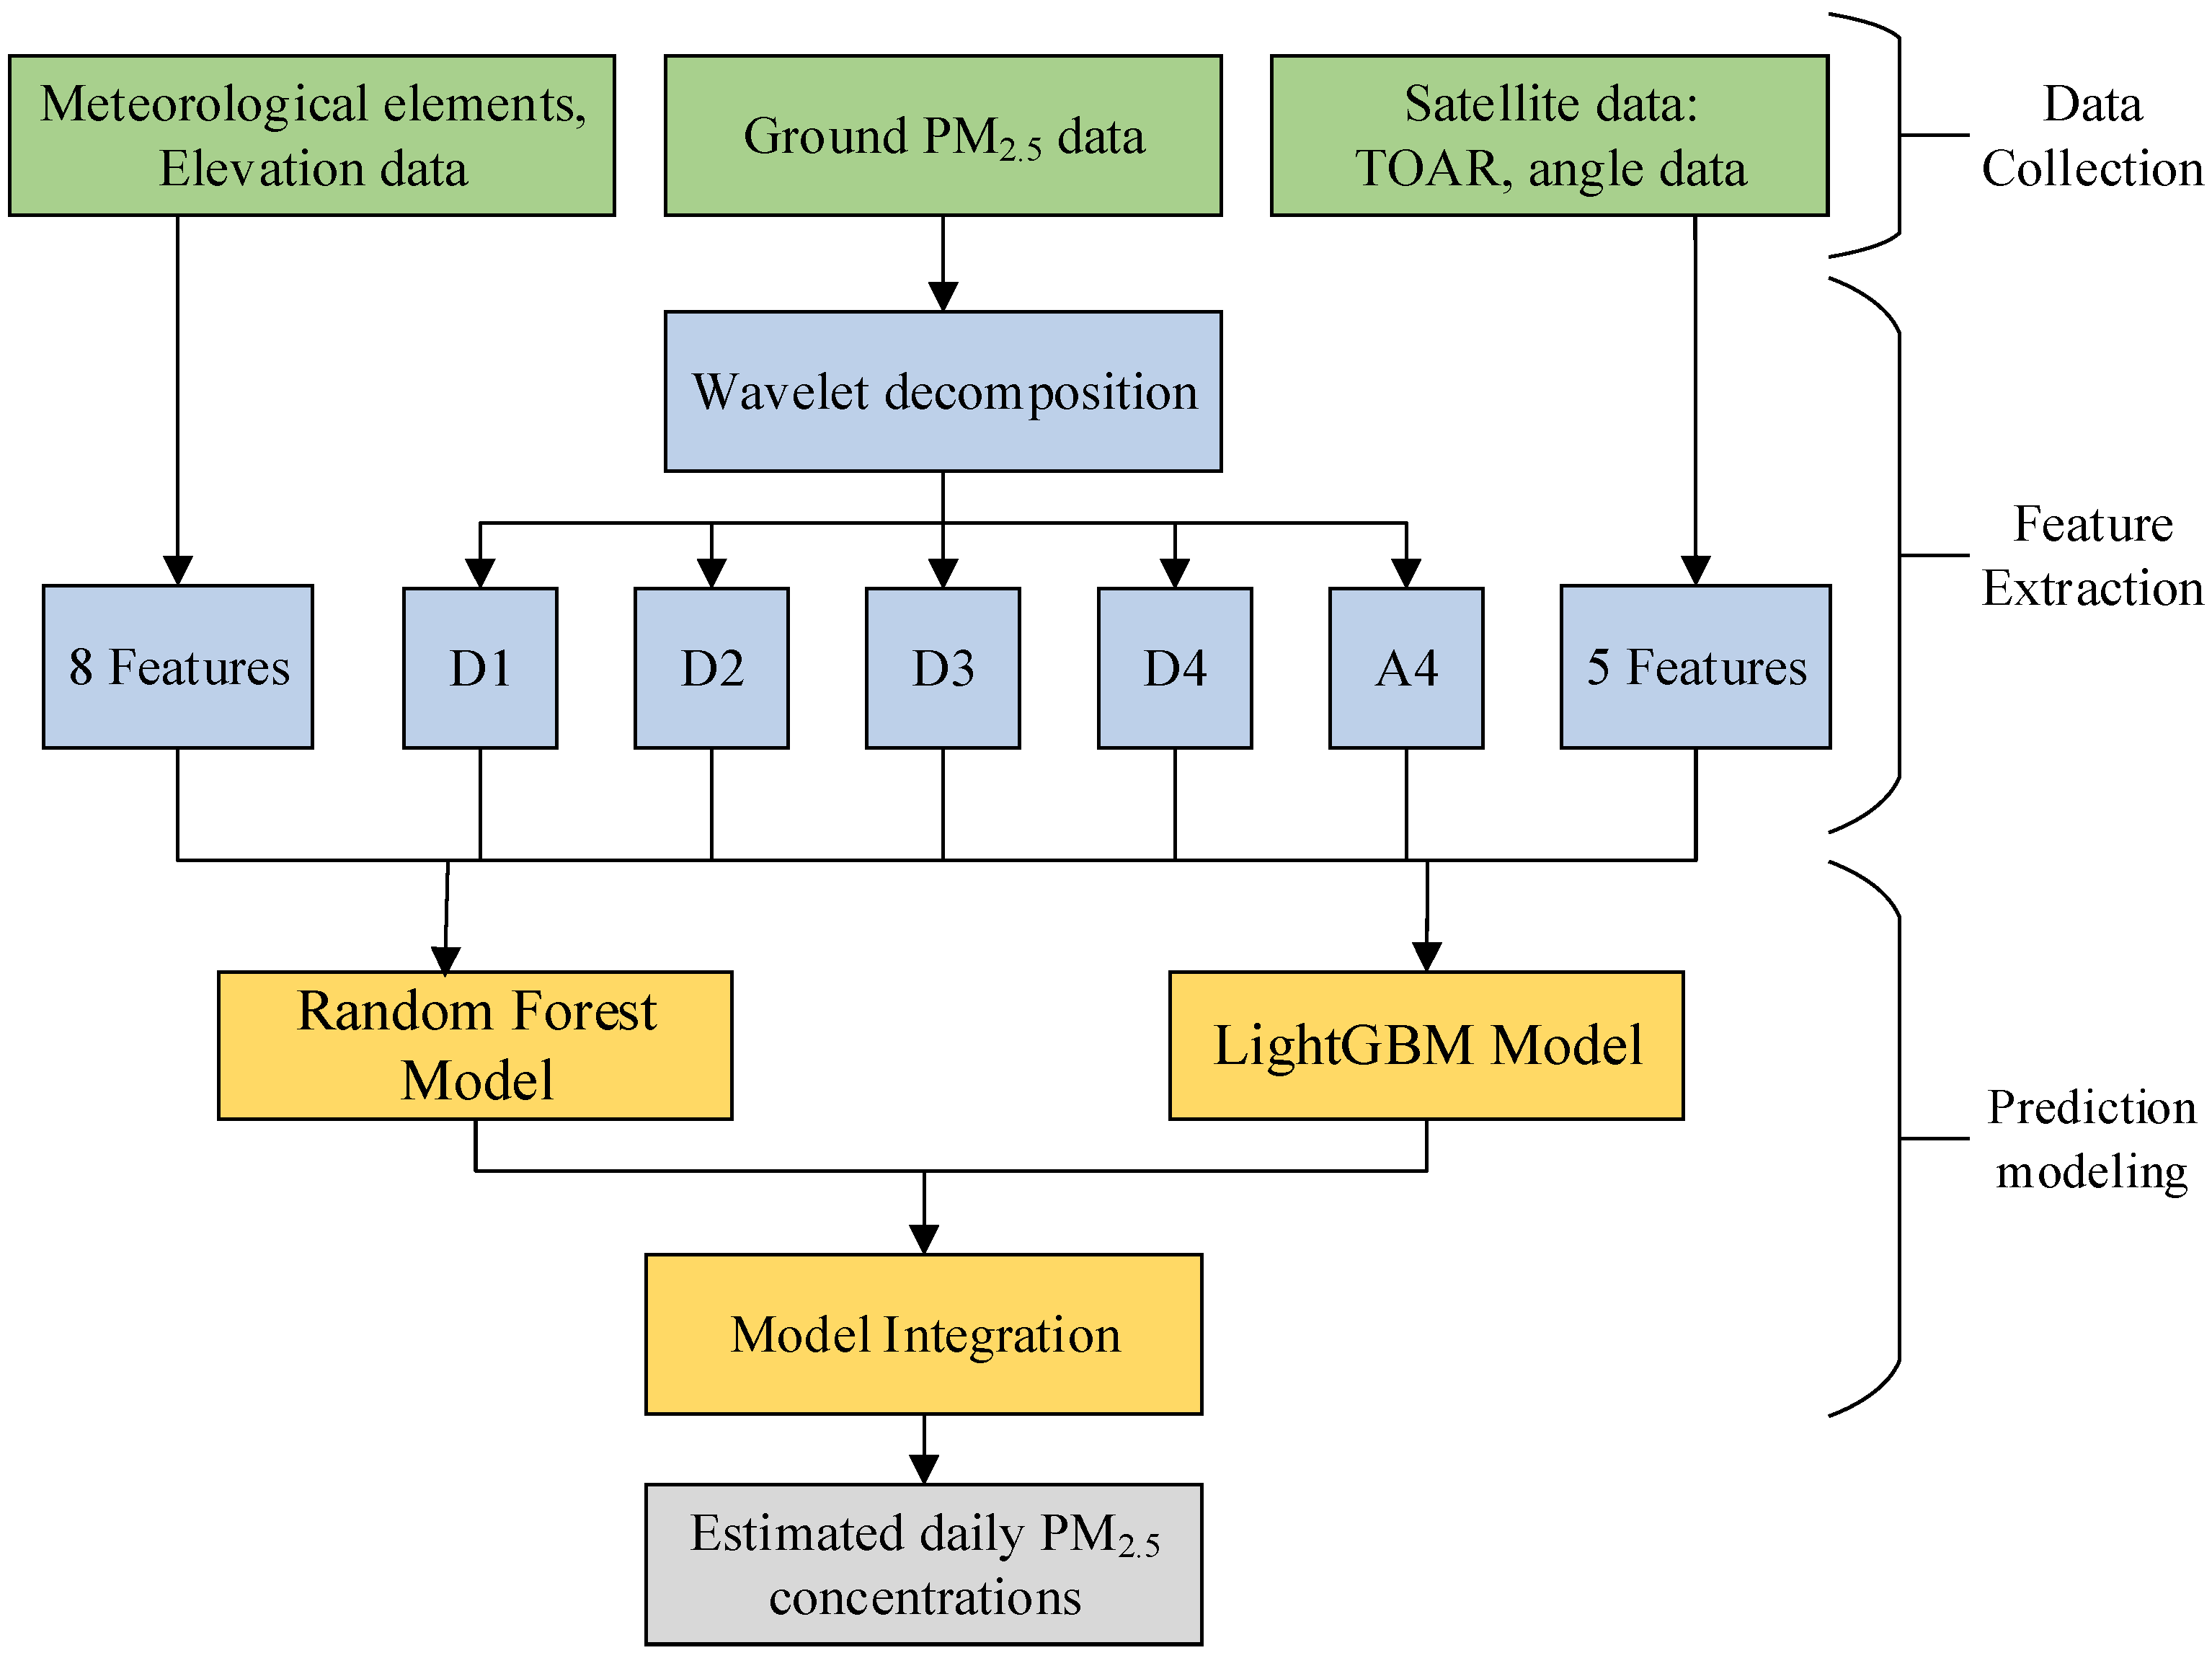
2.3. Methods
- (1)
- Data collection: This included temporal and spatial matching of ground station PM2.5 data, satellite data, and meteorological element data;
- (2)
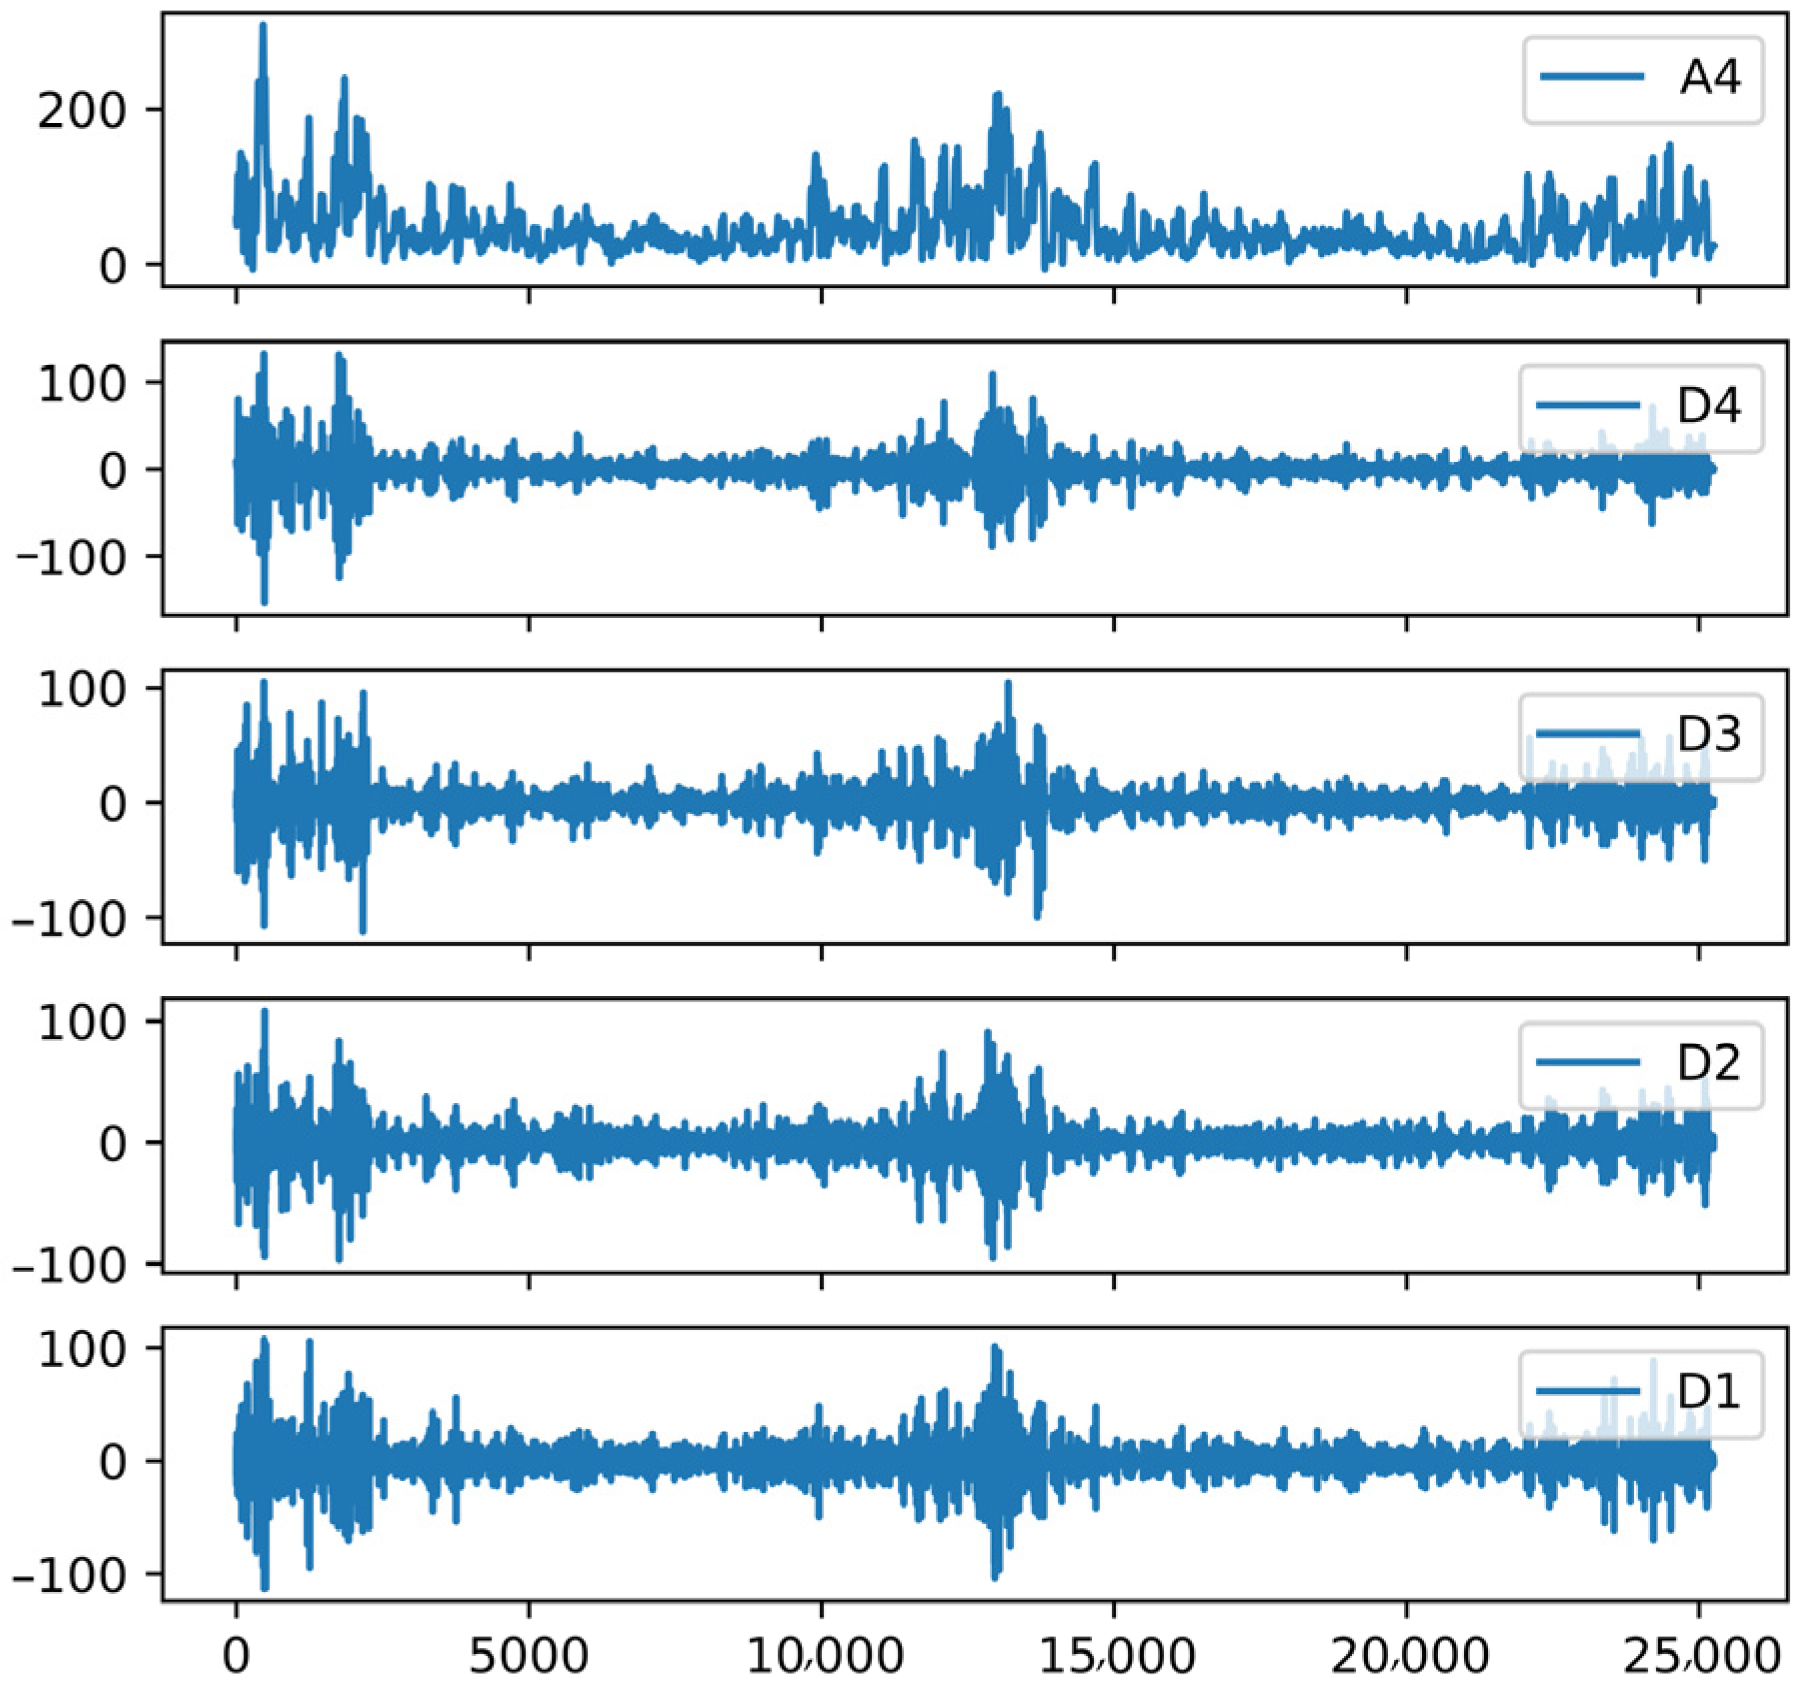
- Feature extraction: Four layers of wavelet decomposition were used to obtain four high-frequency detail components (D1, D2, D3, and D4) and one low-frequency approximate component A4 for PM2.5 data, and the features were mainly composed of D1-D4, A4, meteorological elements, elevation data, TOAR, and angle data with a total of 18 features;
- (3)
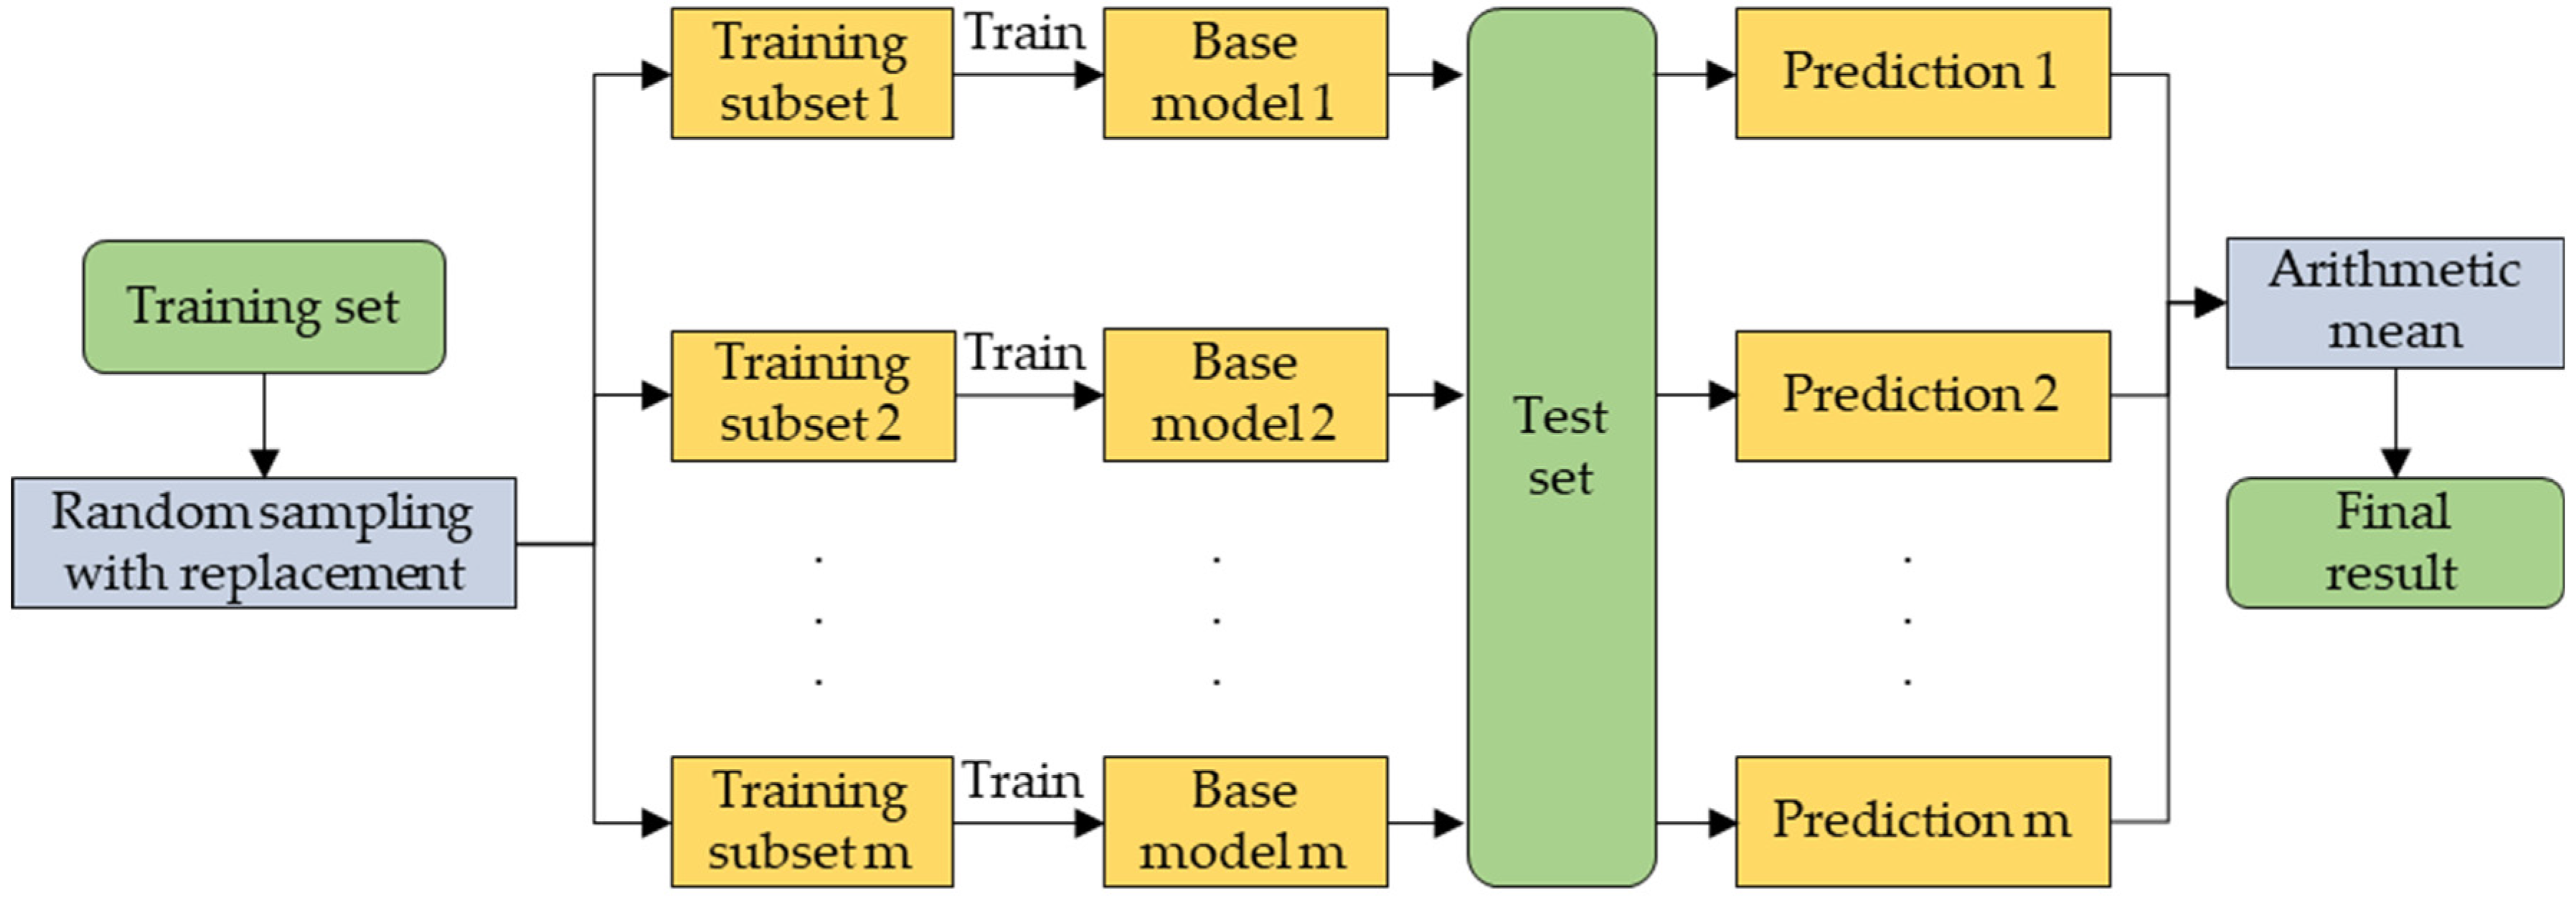
- Prediction modeling: The predictions of the PM2.5 subseries data after wavelet decomposition were summed using Random Forest (RF) and LightGBM models to construct an integrated learning model to obtain the final prediction results of the PM2.5 concentrations.
2.3.1. Feature Extraction
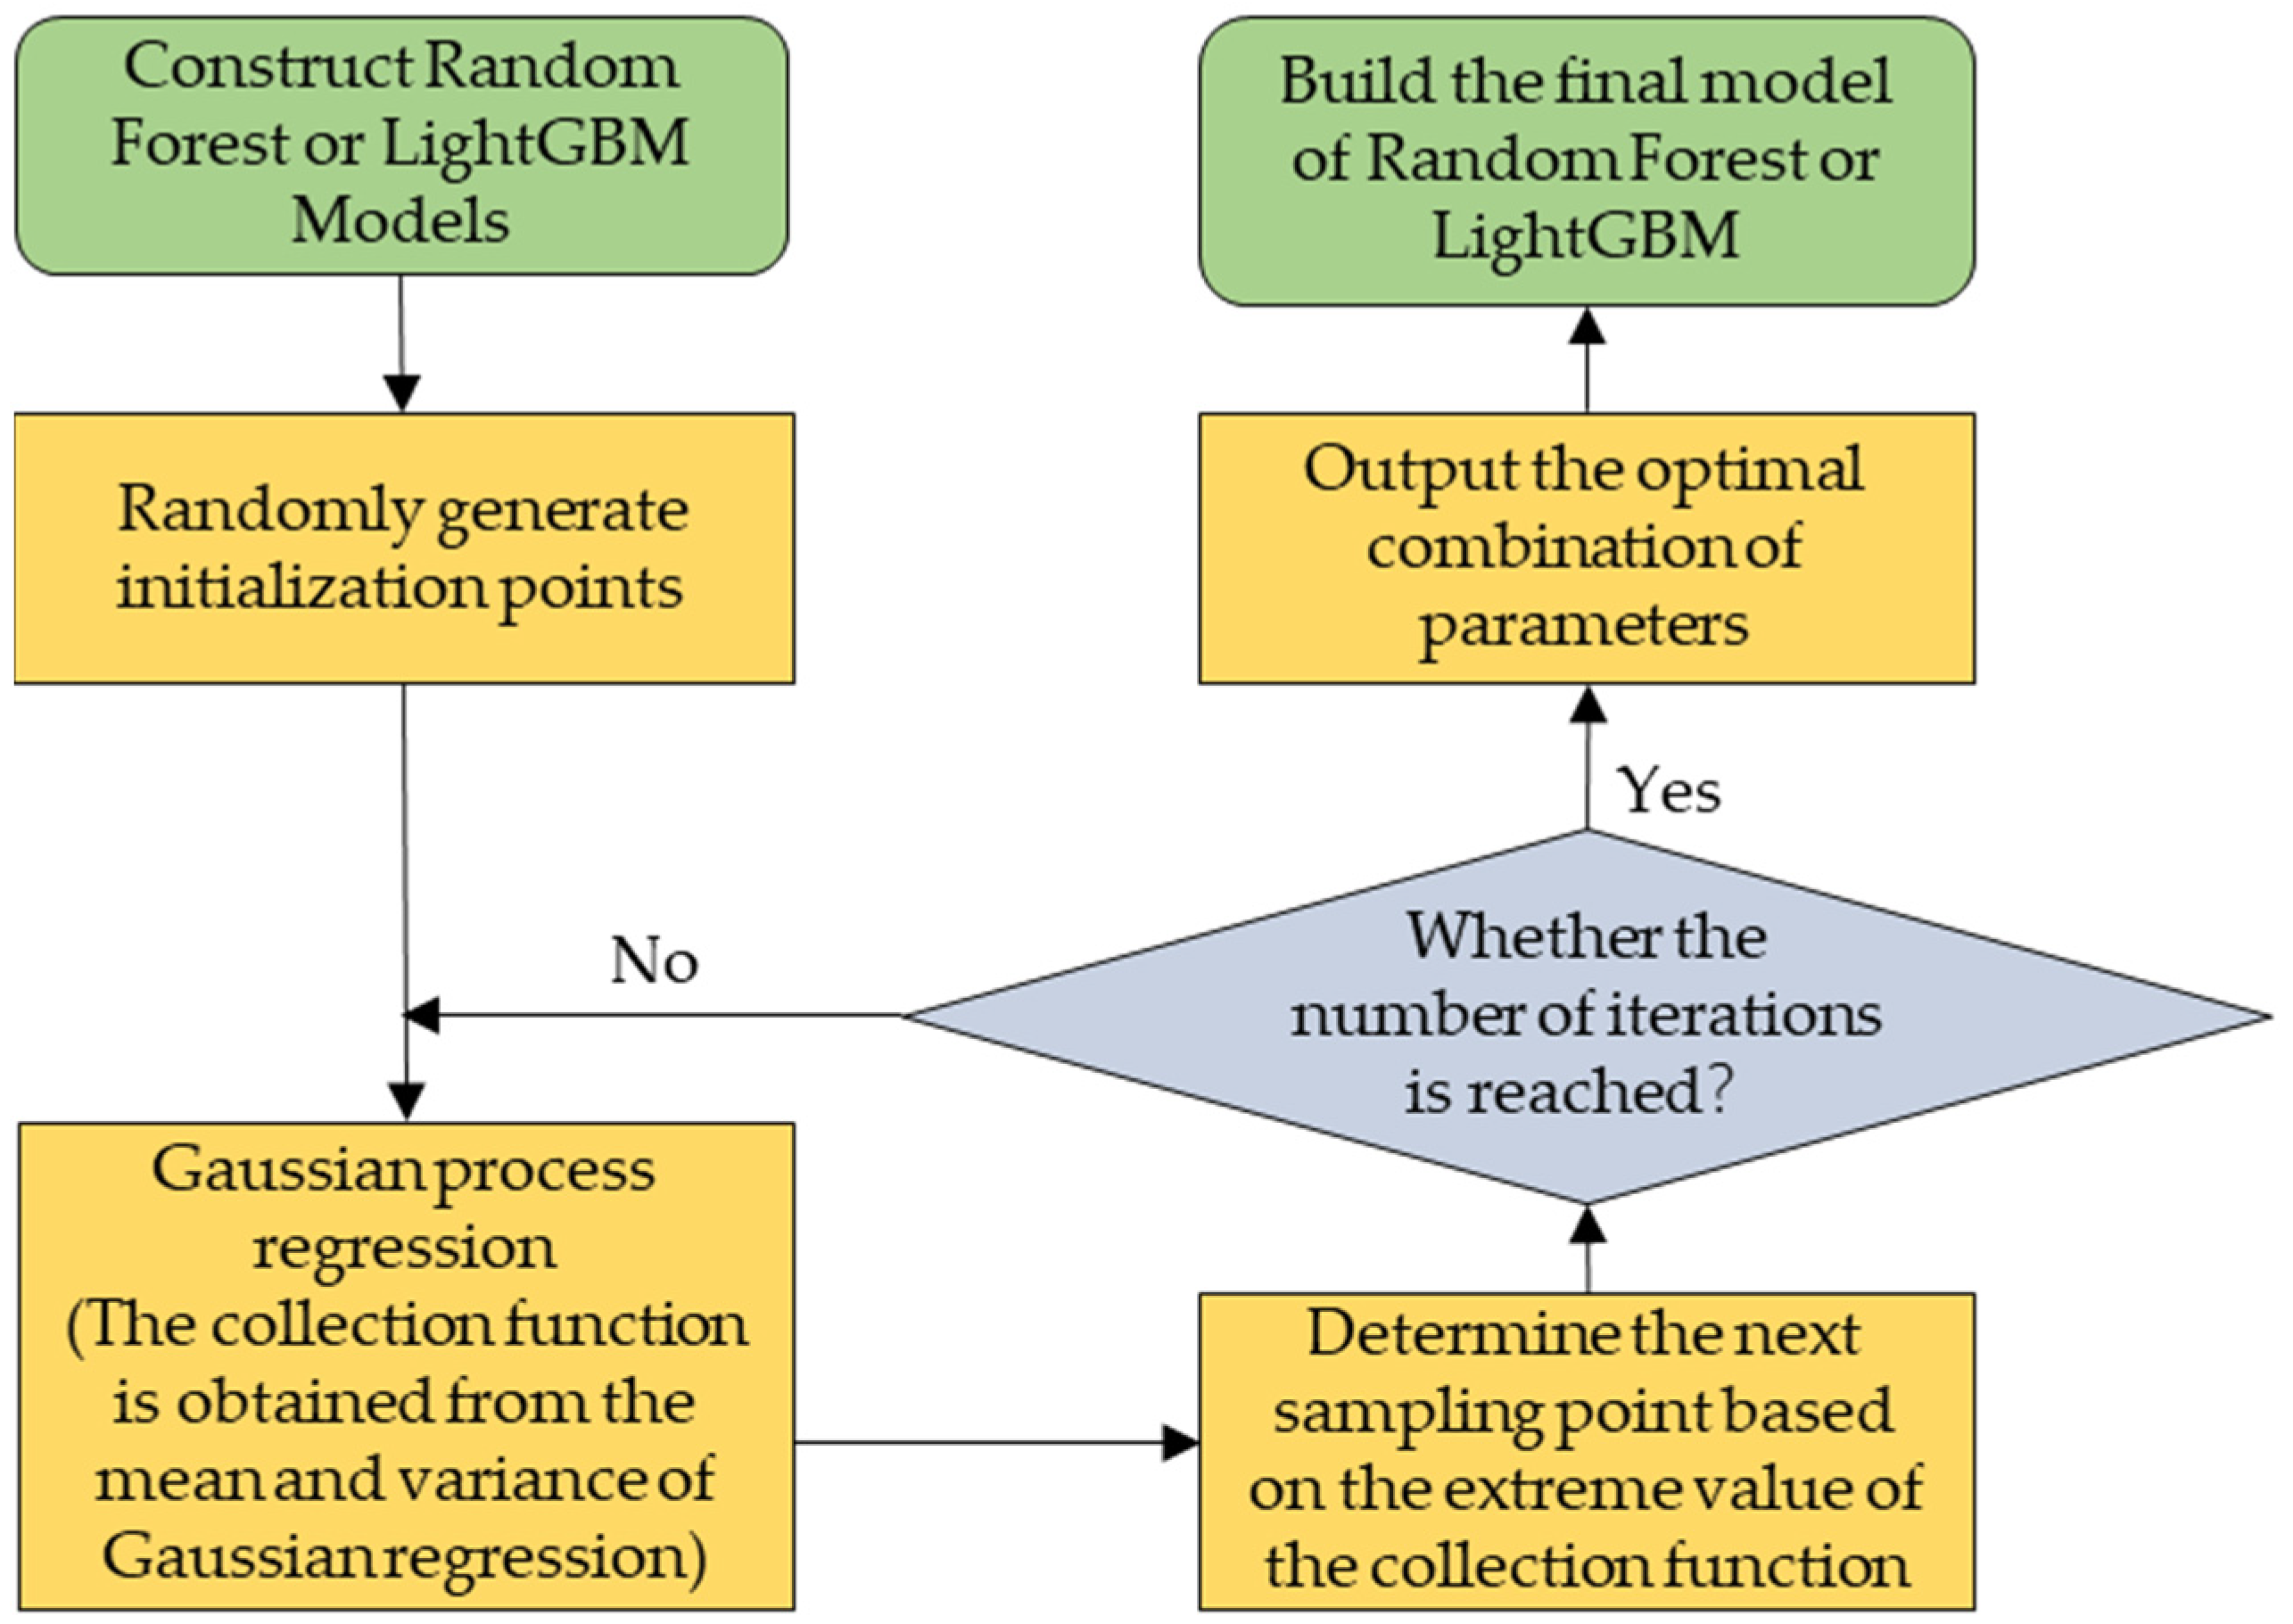
2.3.2. Precision Modeling
3. Results
3.1. PM2.5 Concentrations Prediction and Comparative Analysis
3.1.1. Application Environment and Parameter Setting
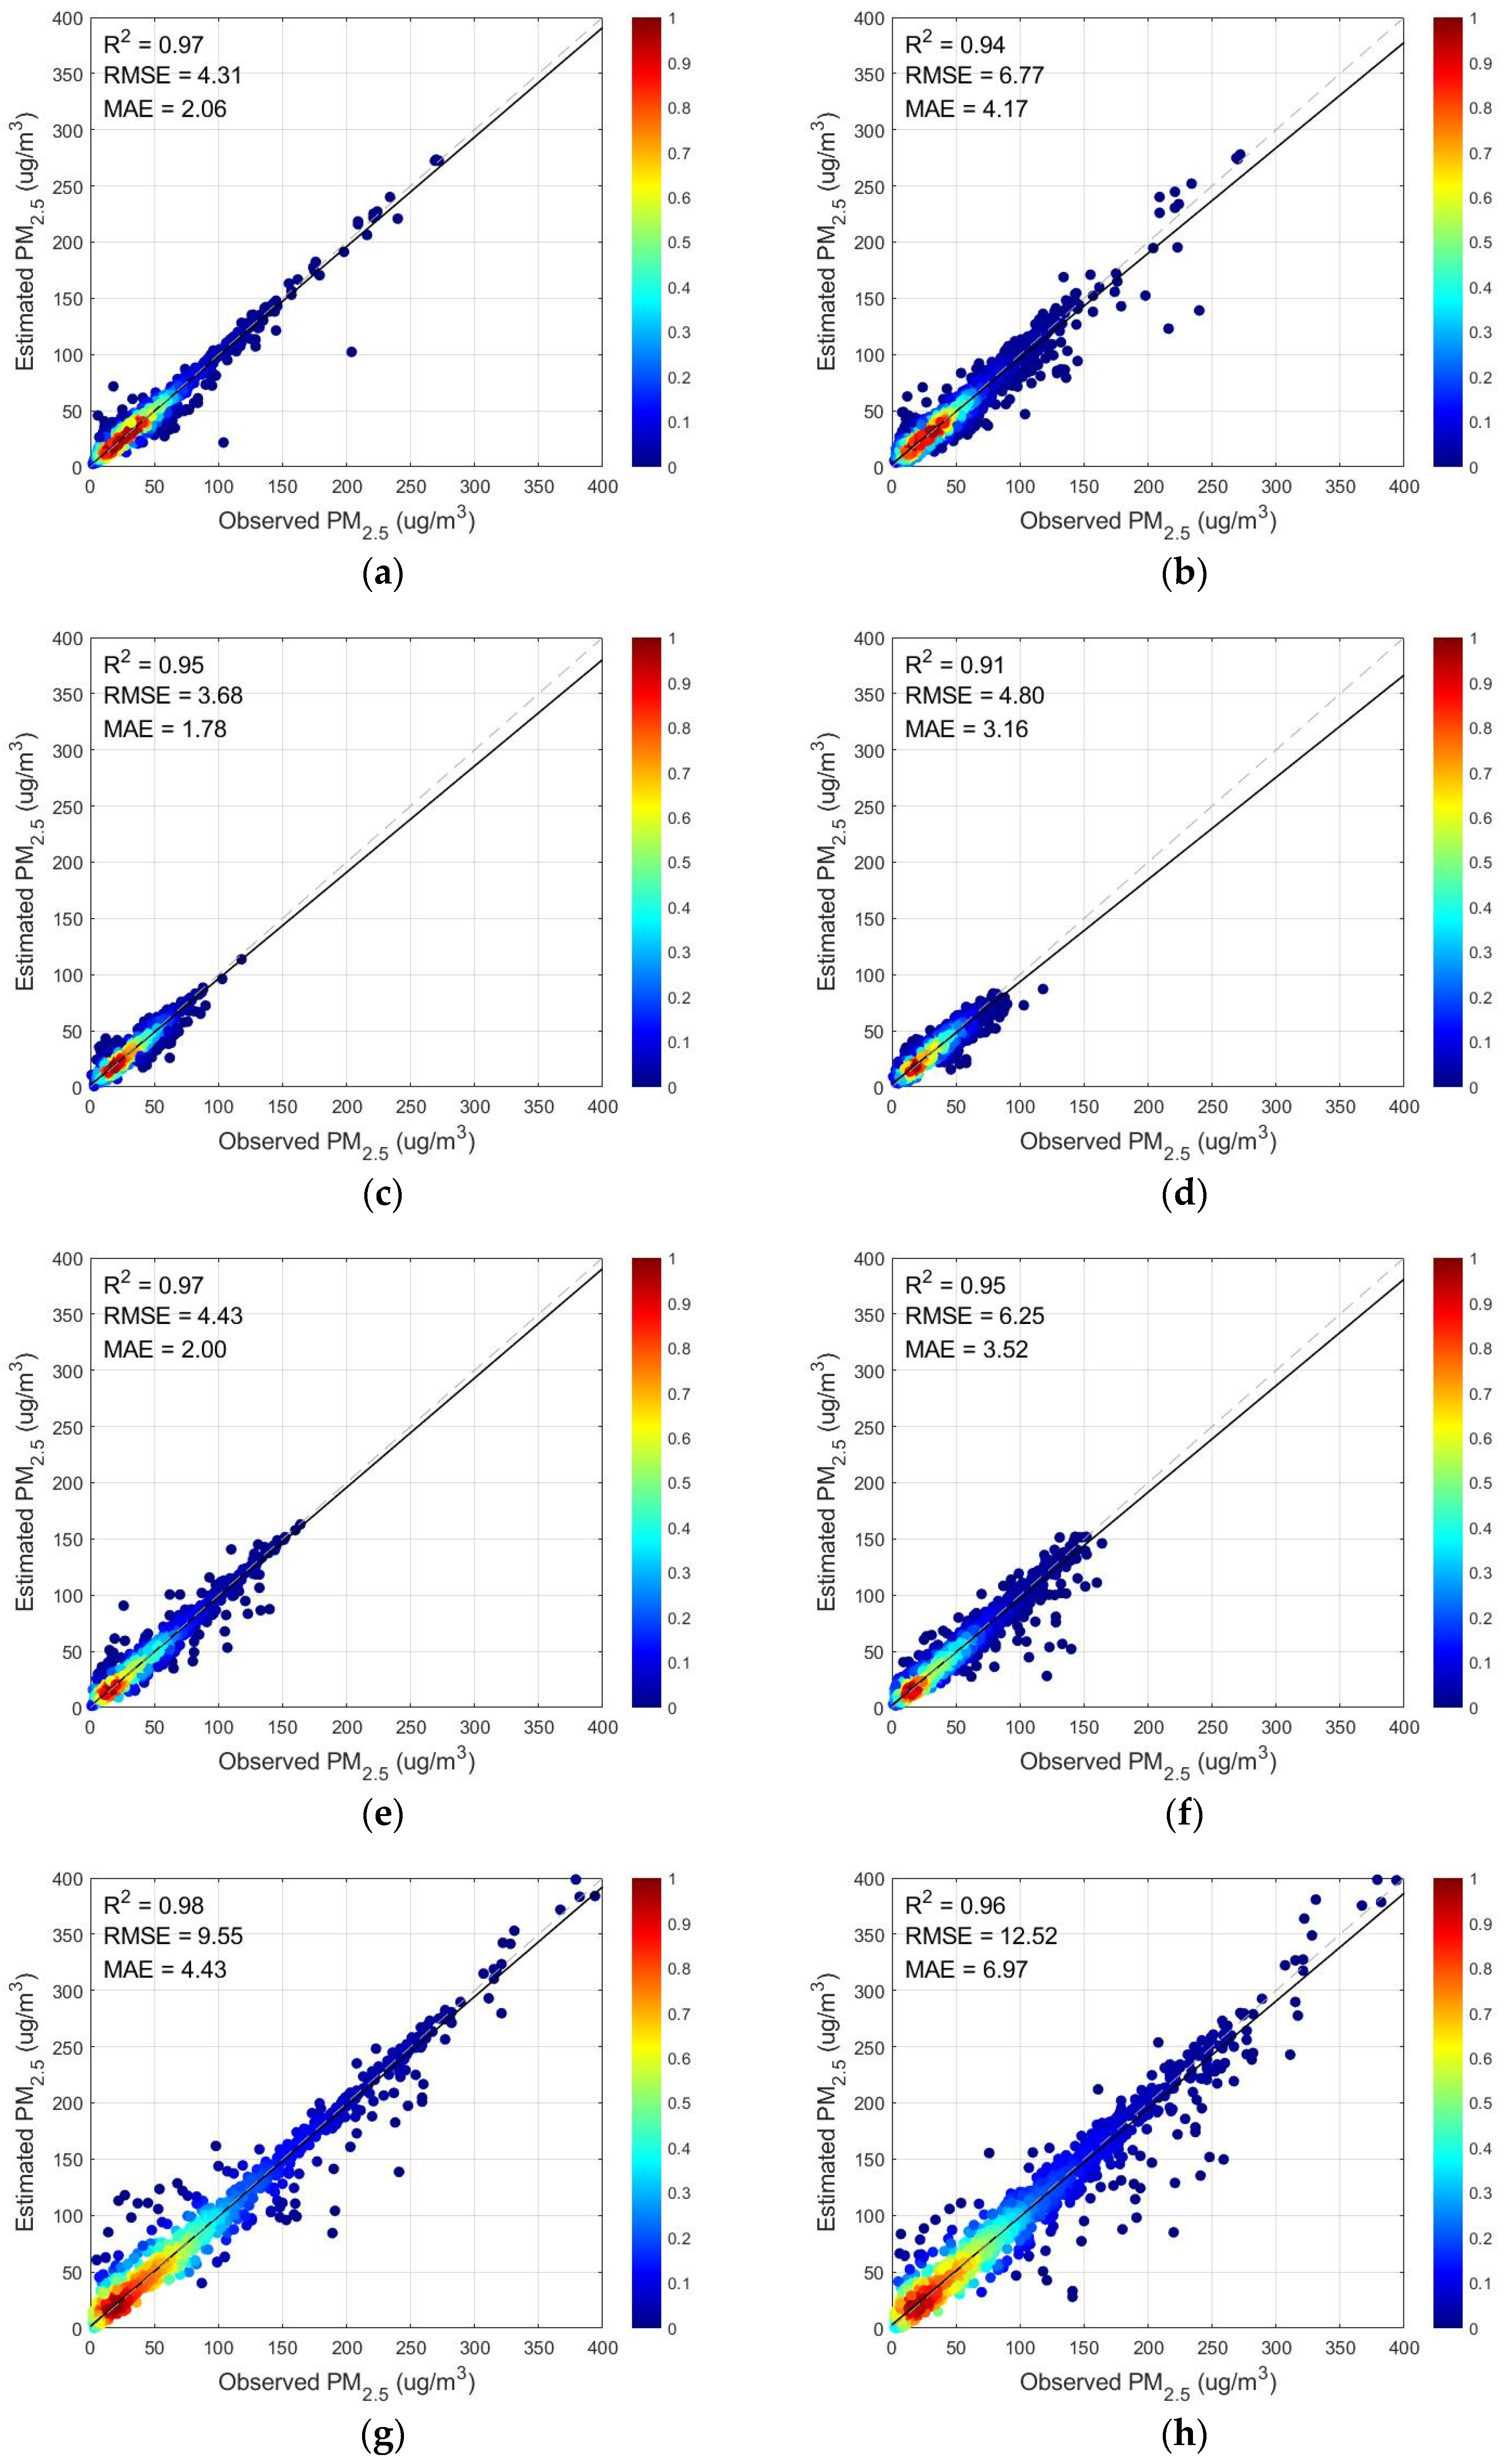
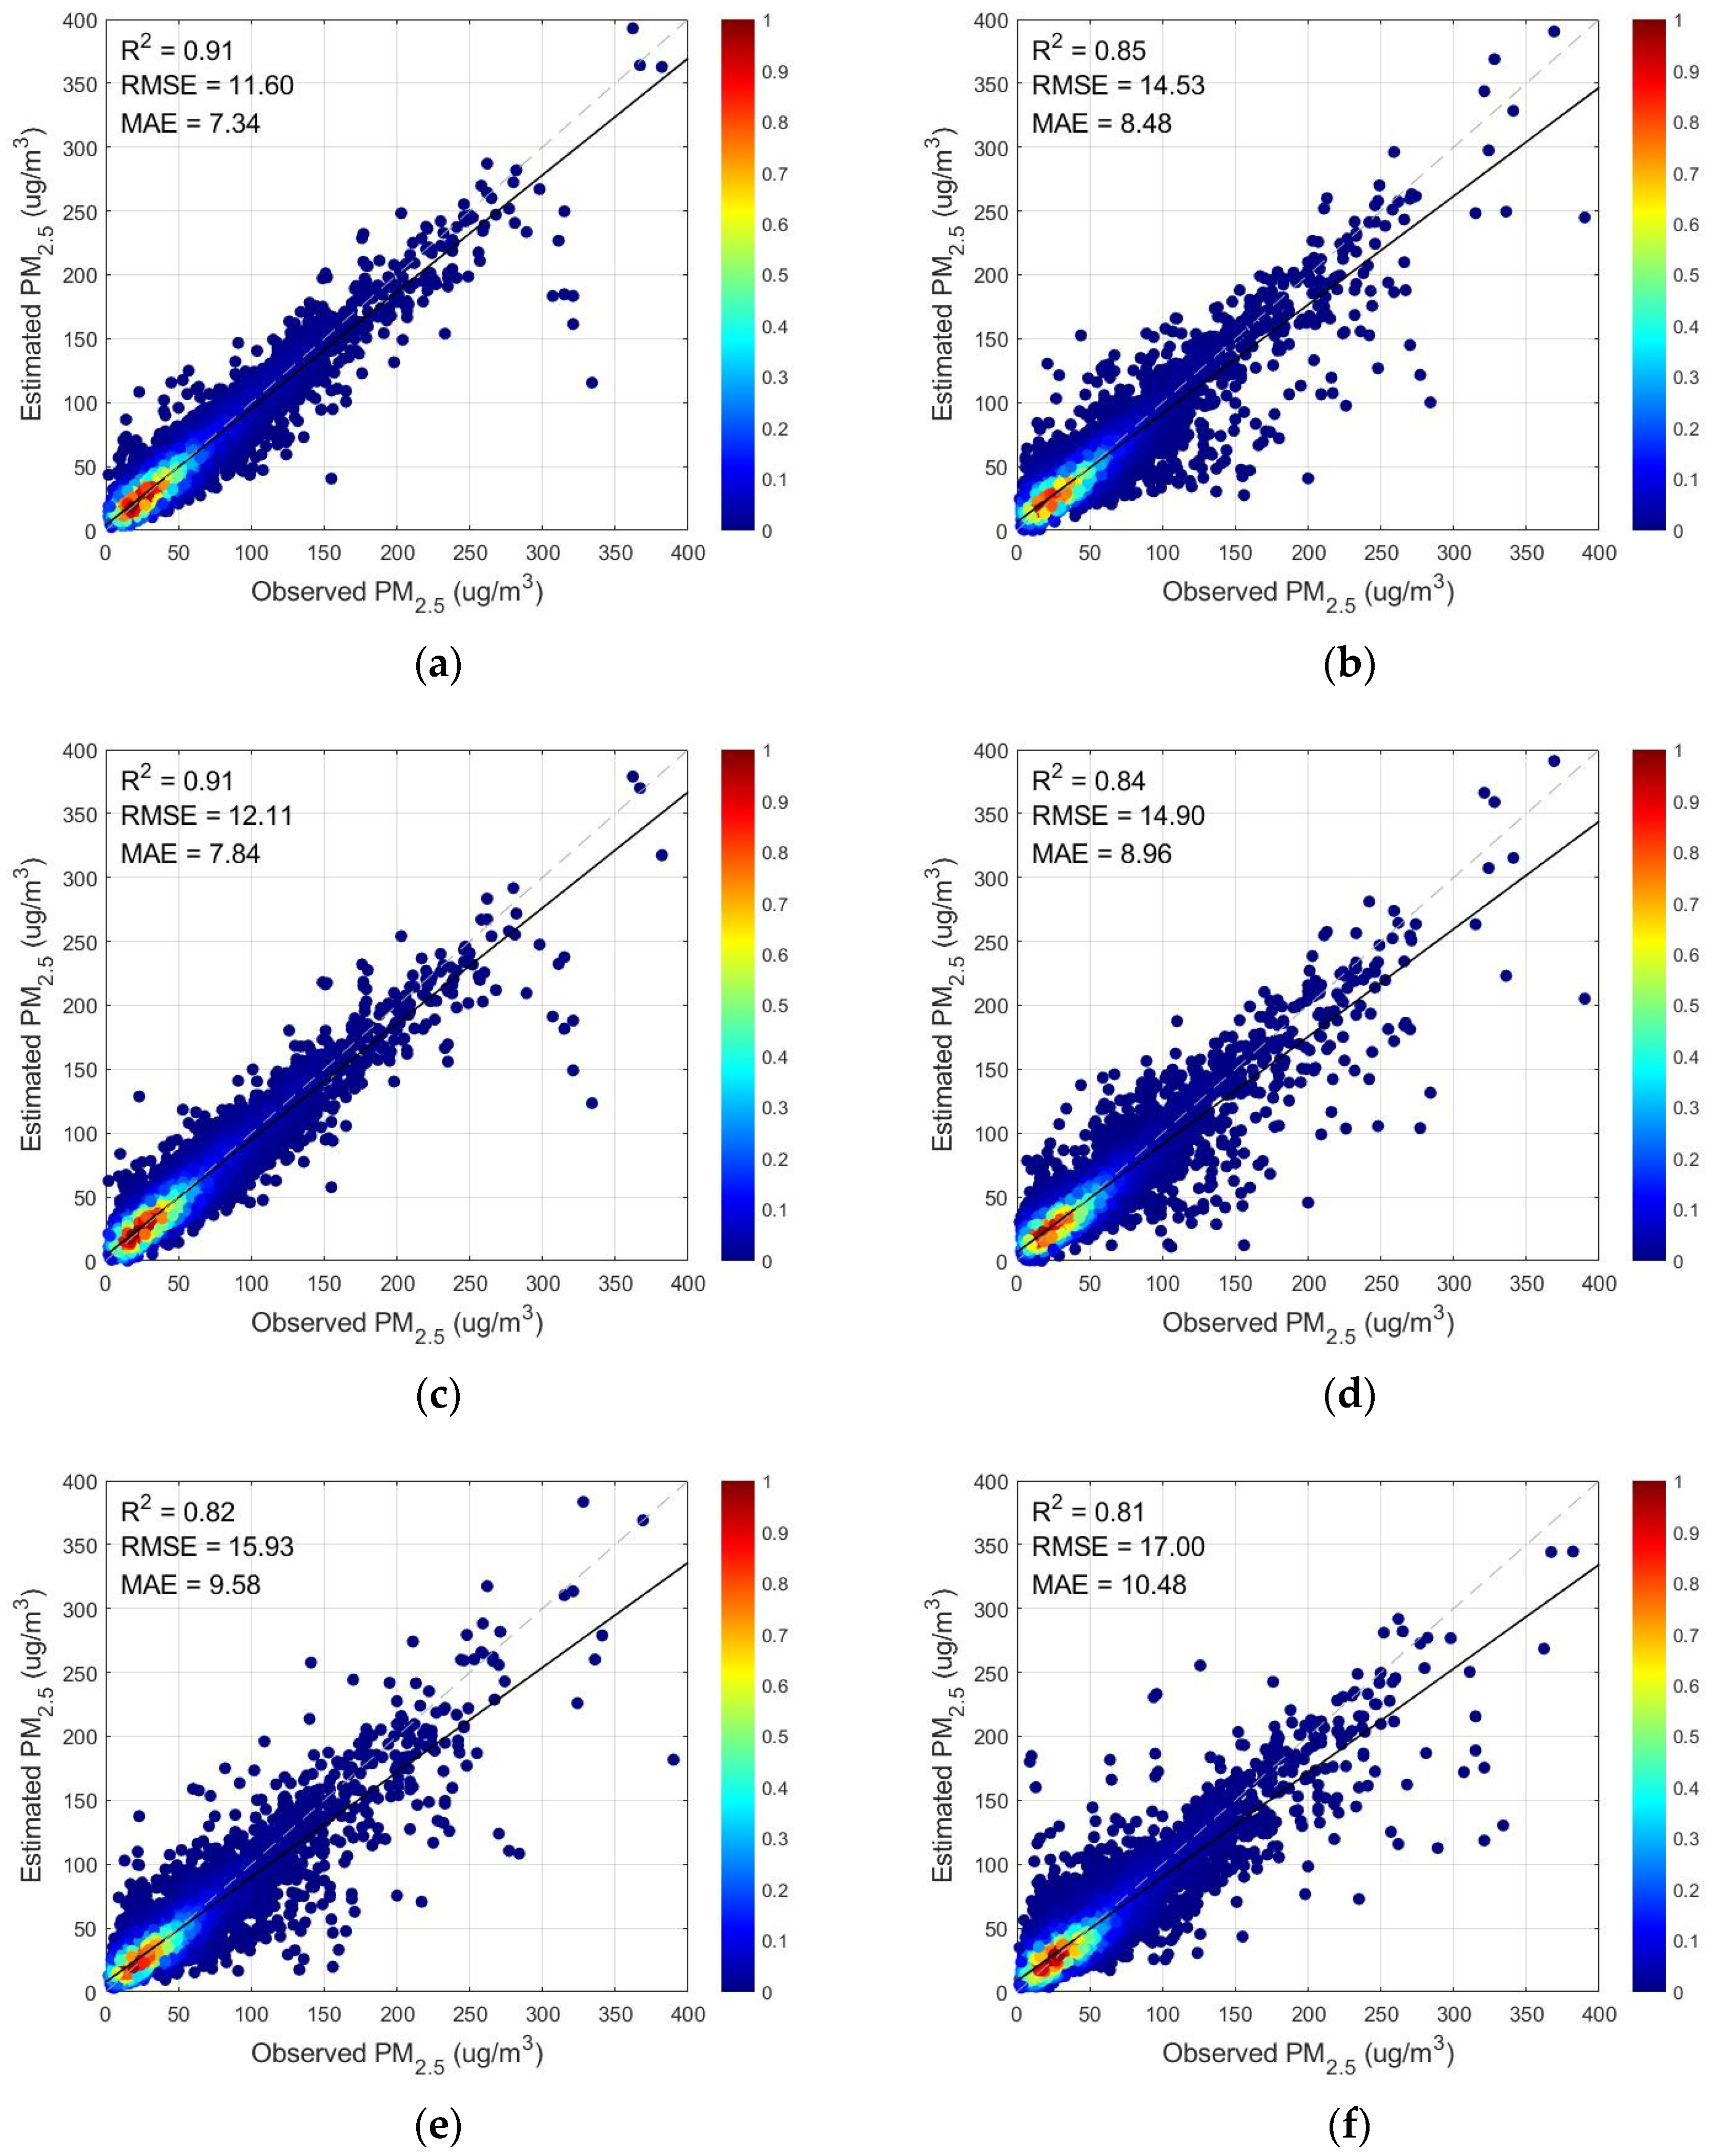
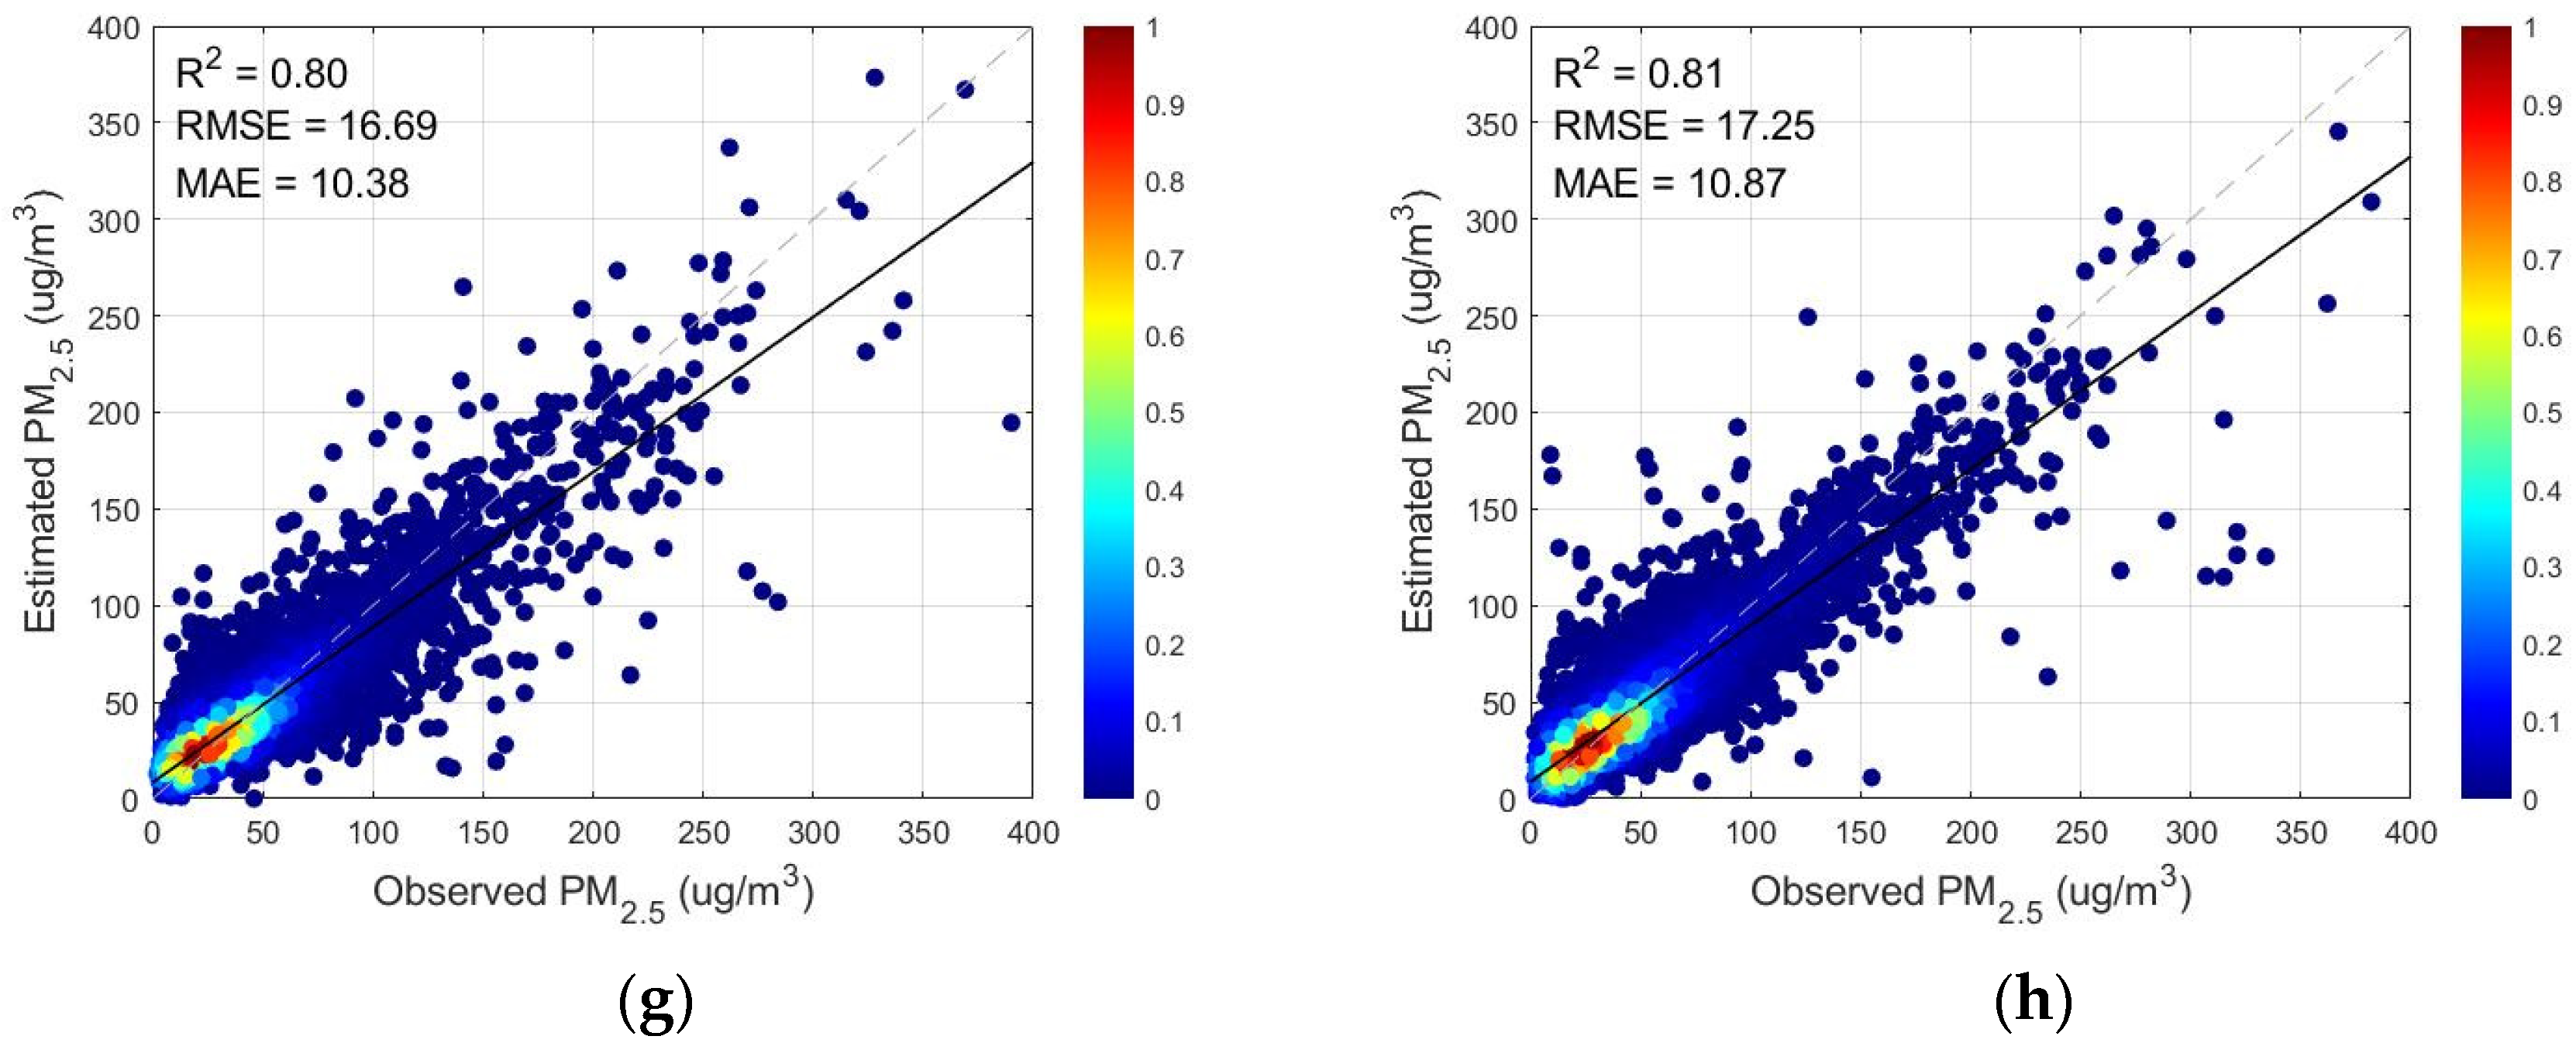
3.1.2. Analysis and Comparison of Models with Different Variables Entered
3.1.3. Analysis and Comparison of Different Models
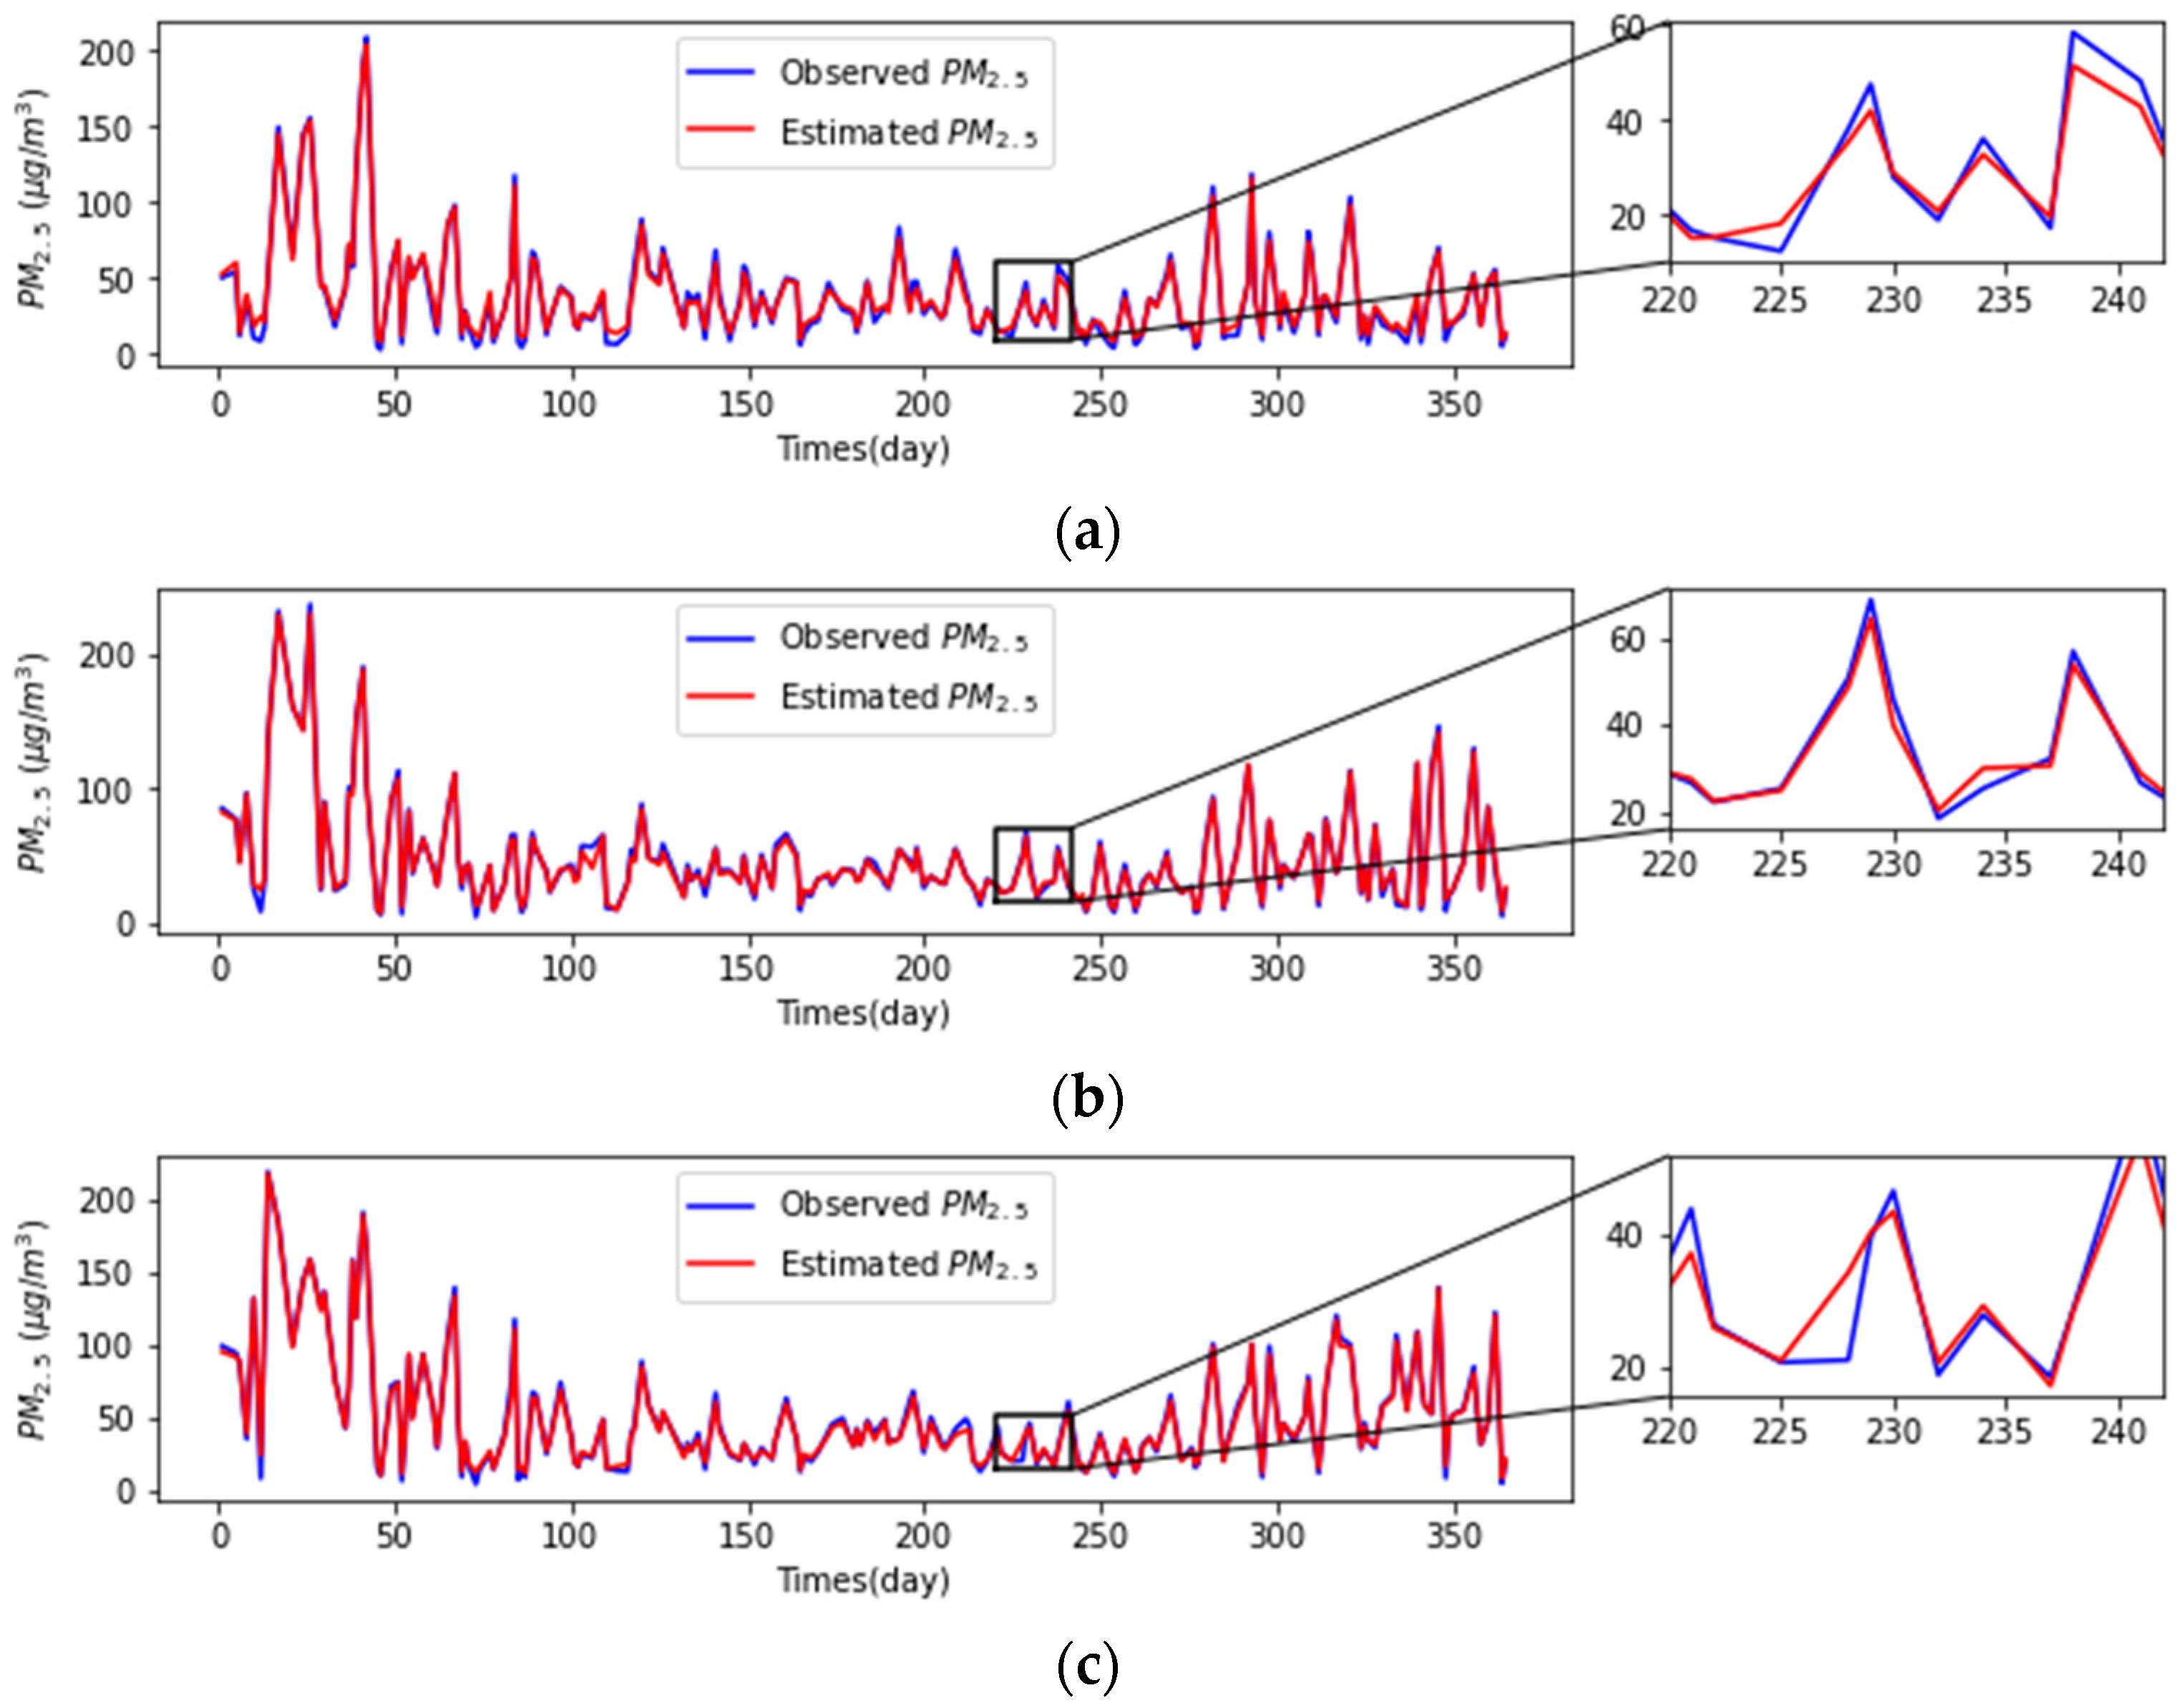
3.2. Spatial and Temporal Distribution of PM2.5 Concentrations
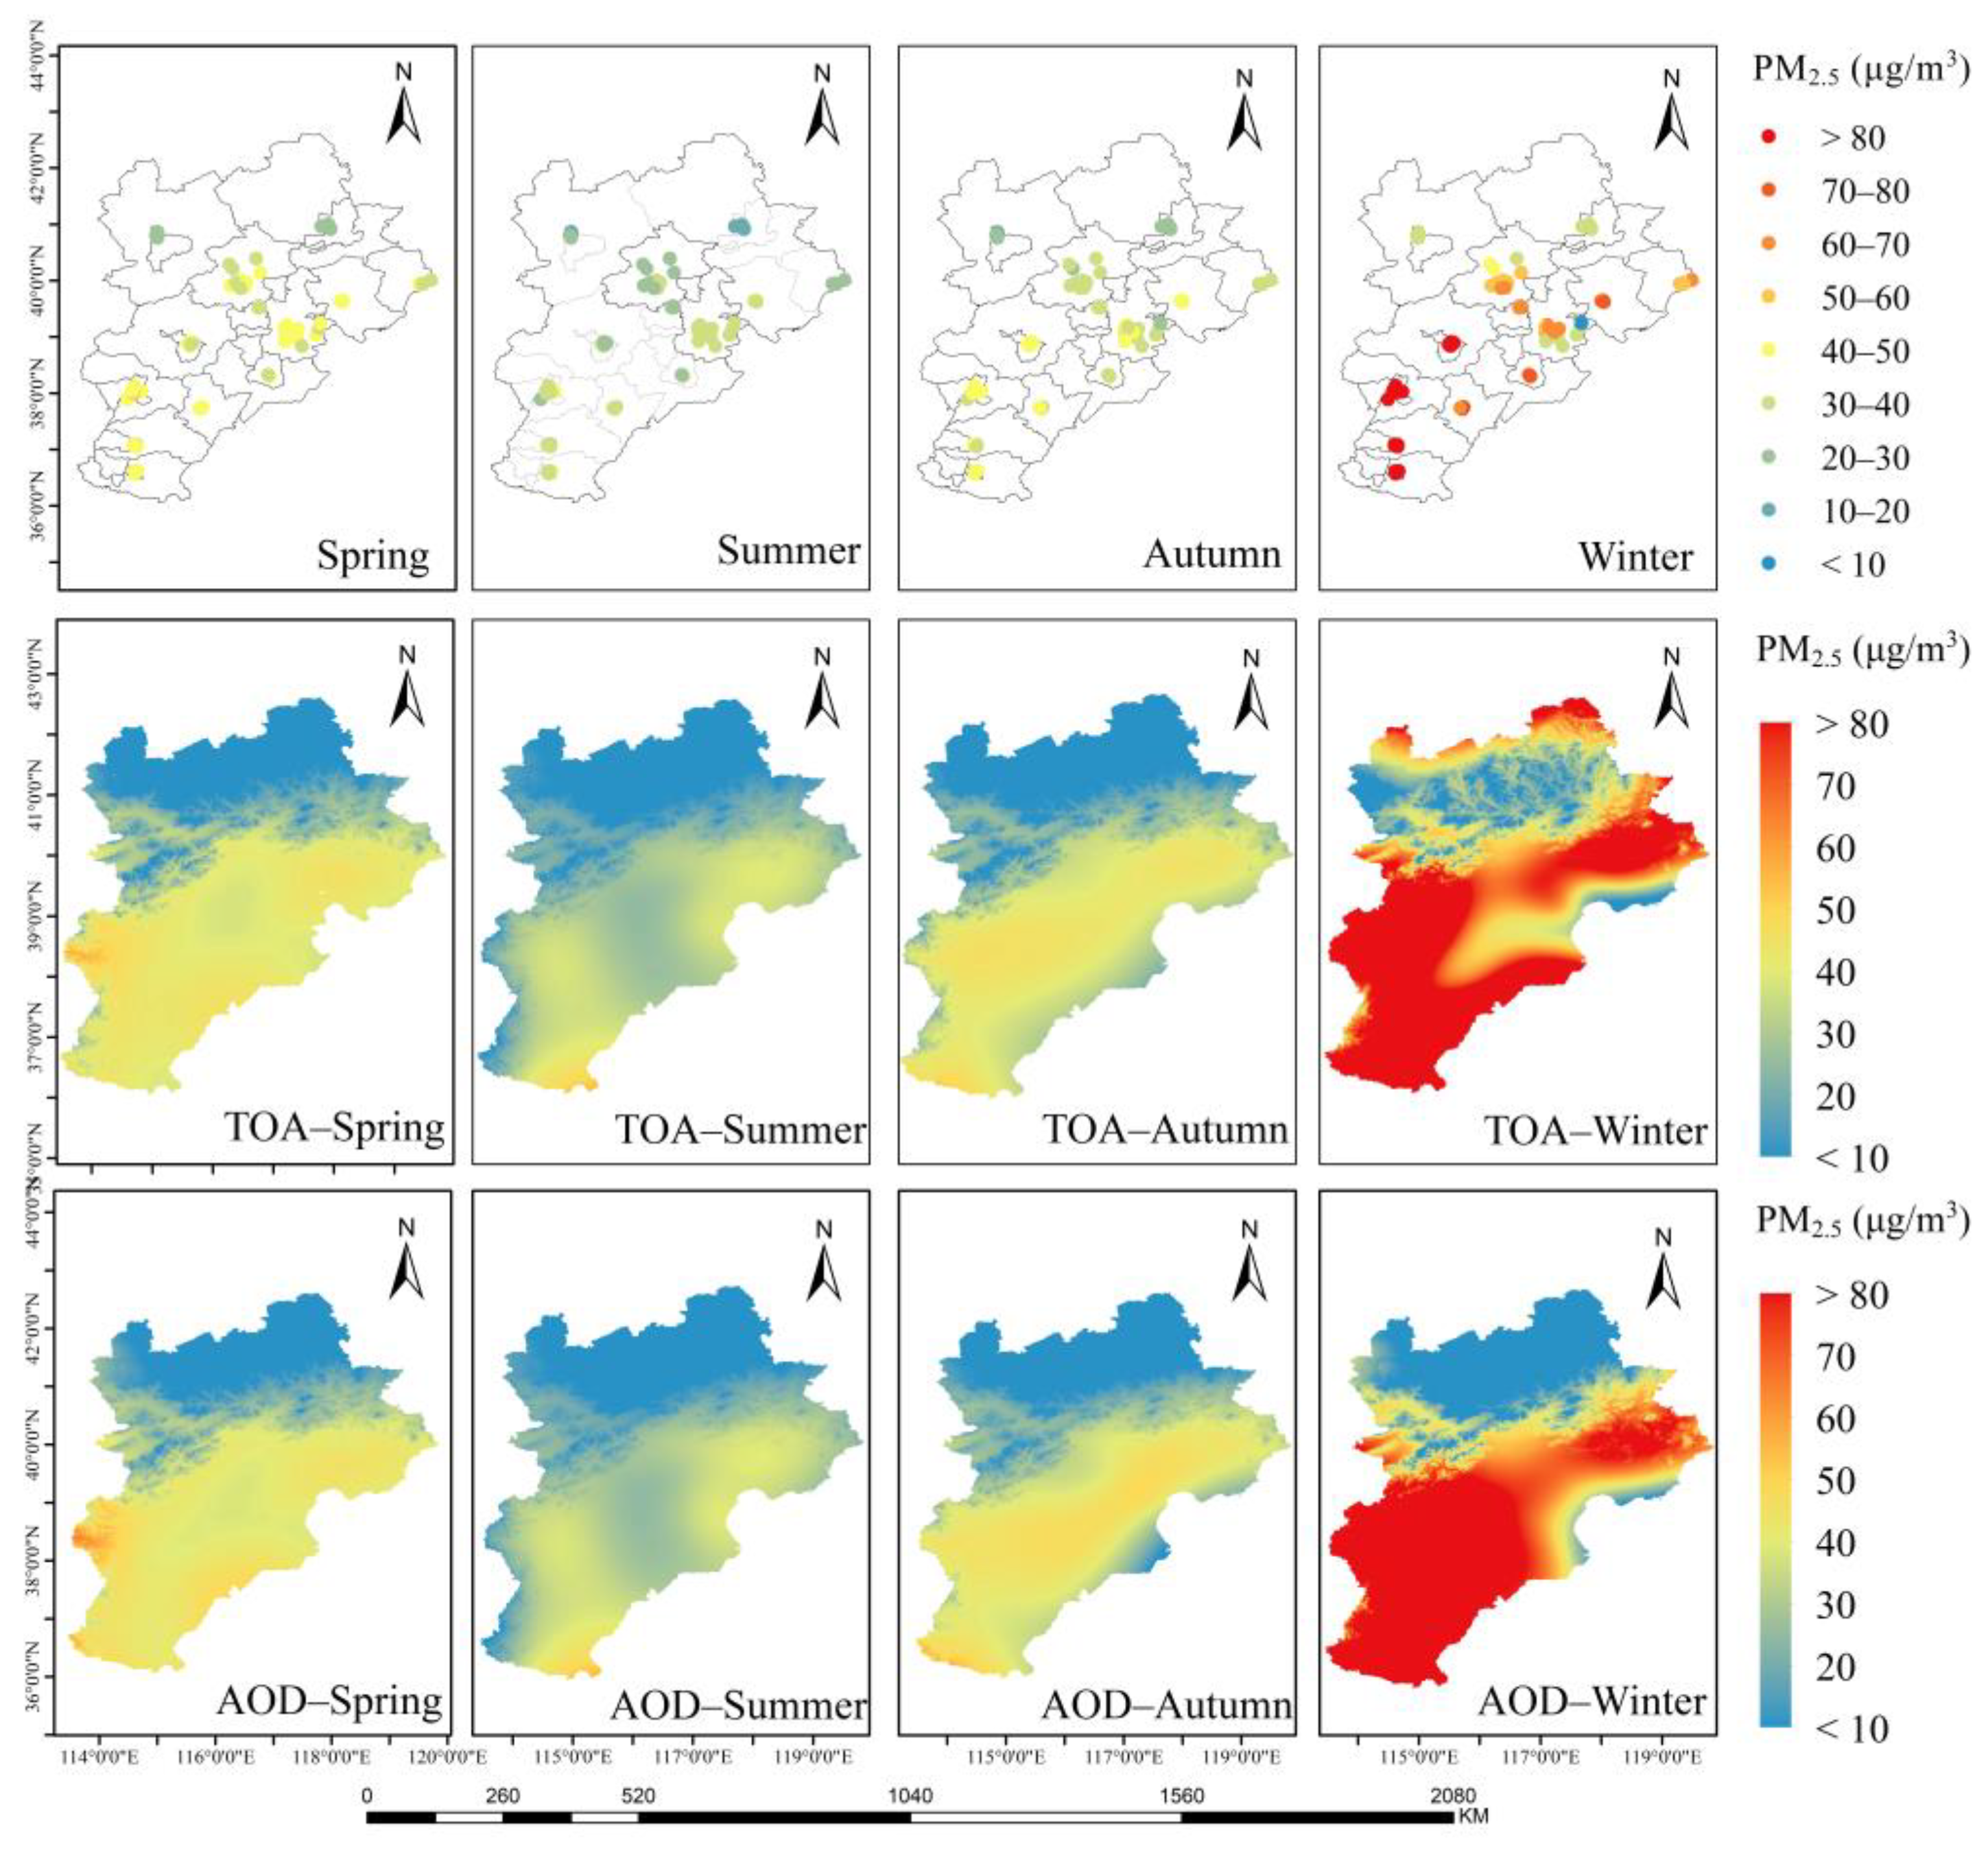
3.2.1. Seasonal Distribution
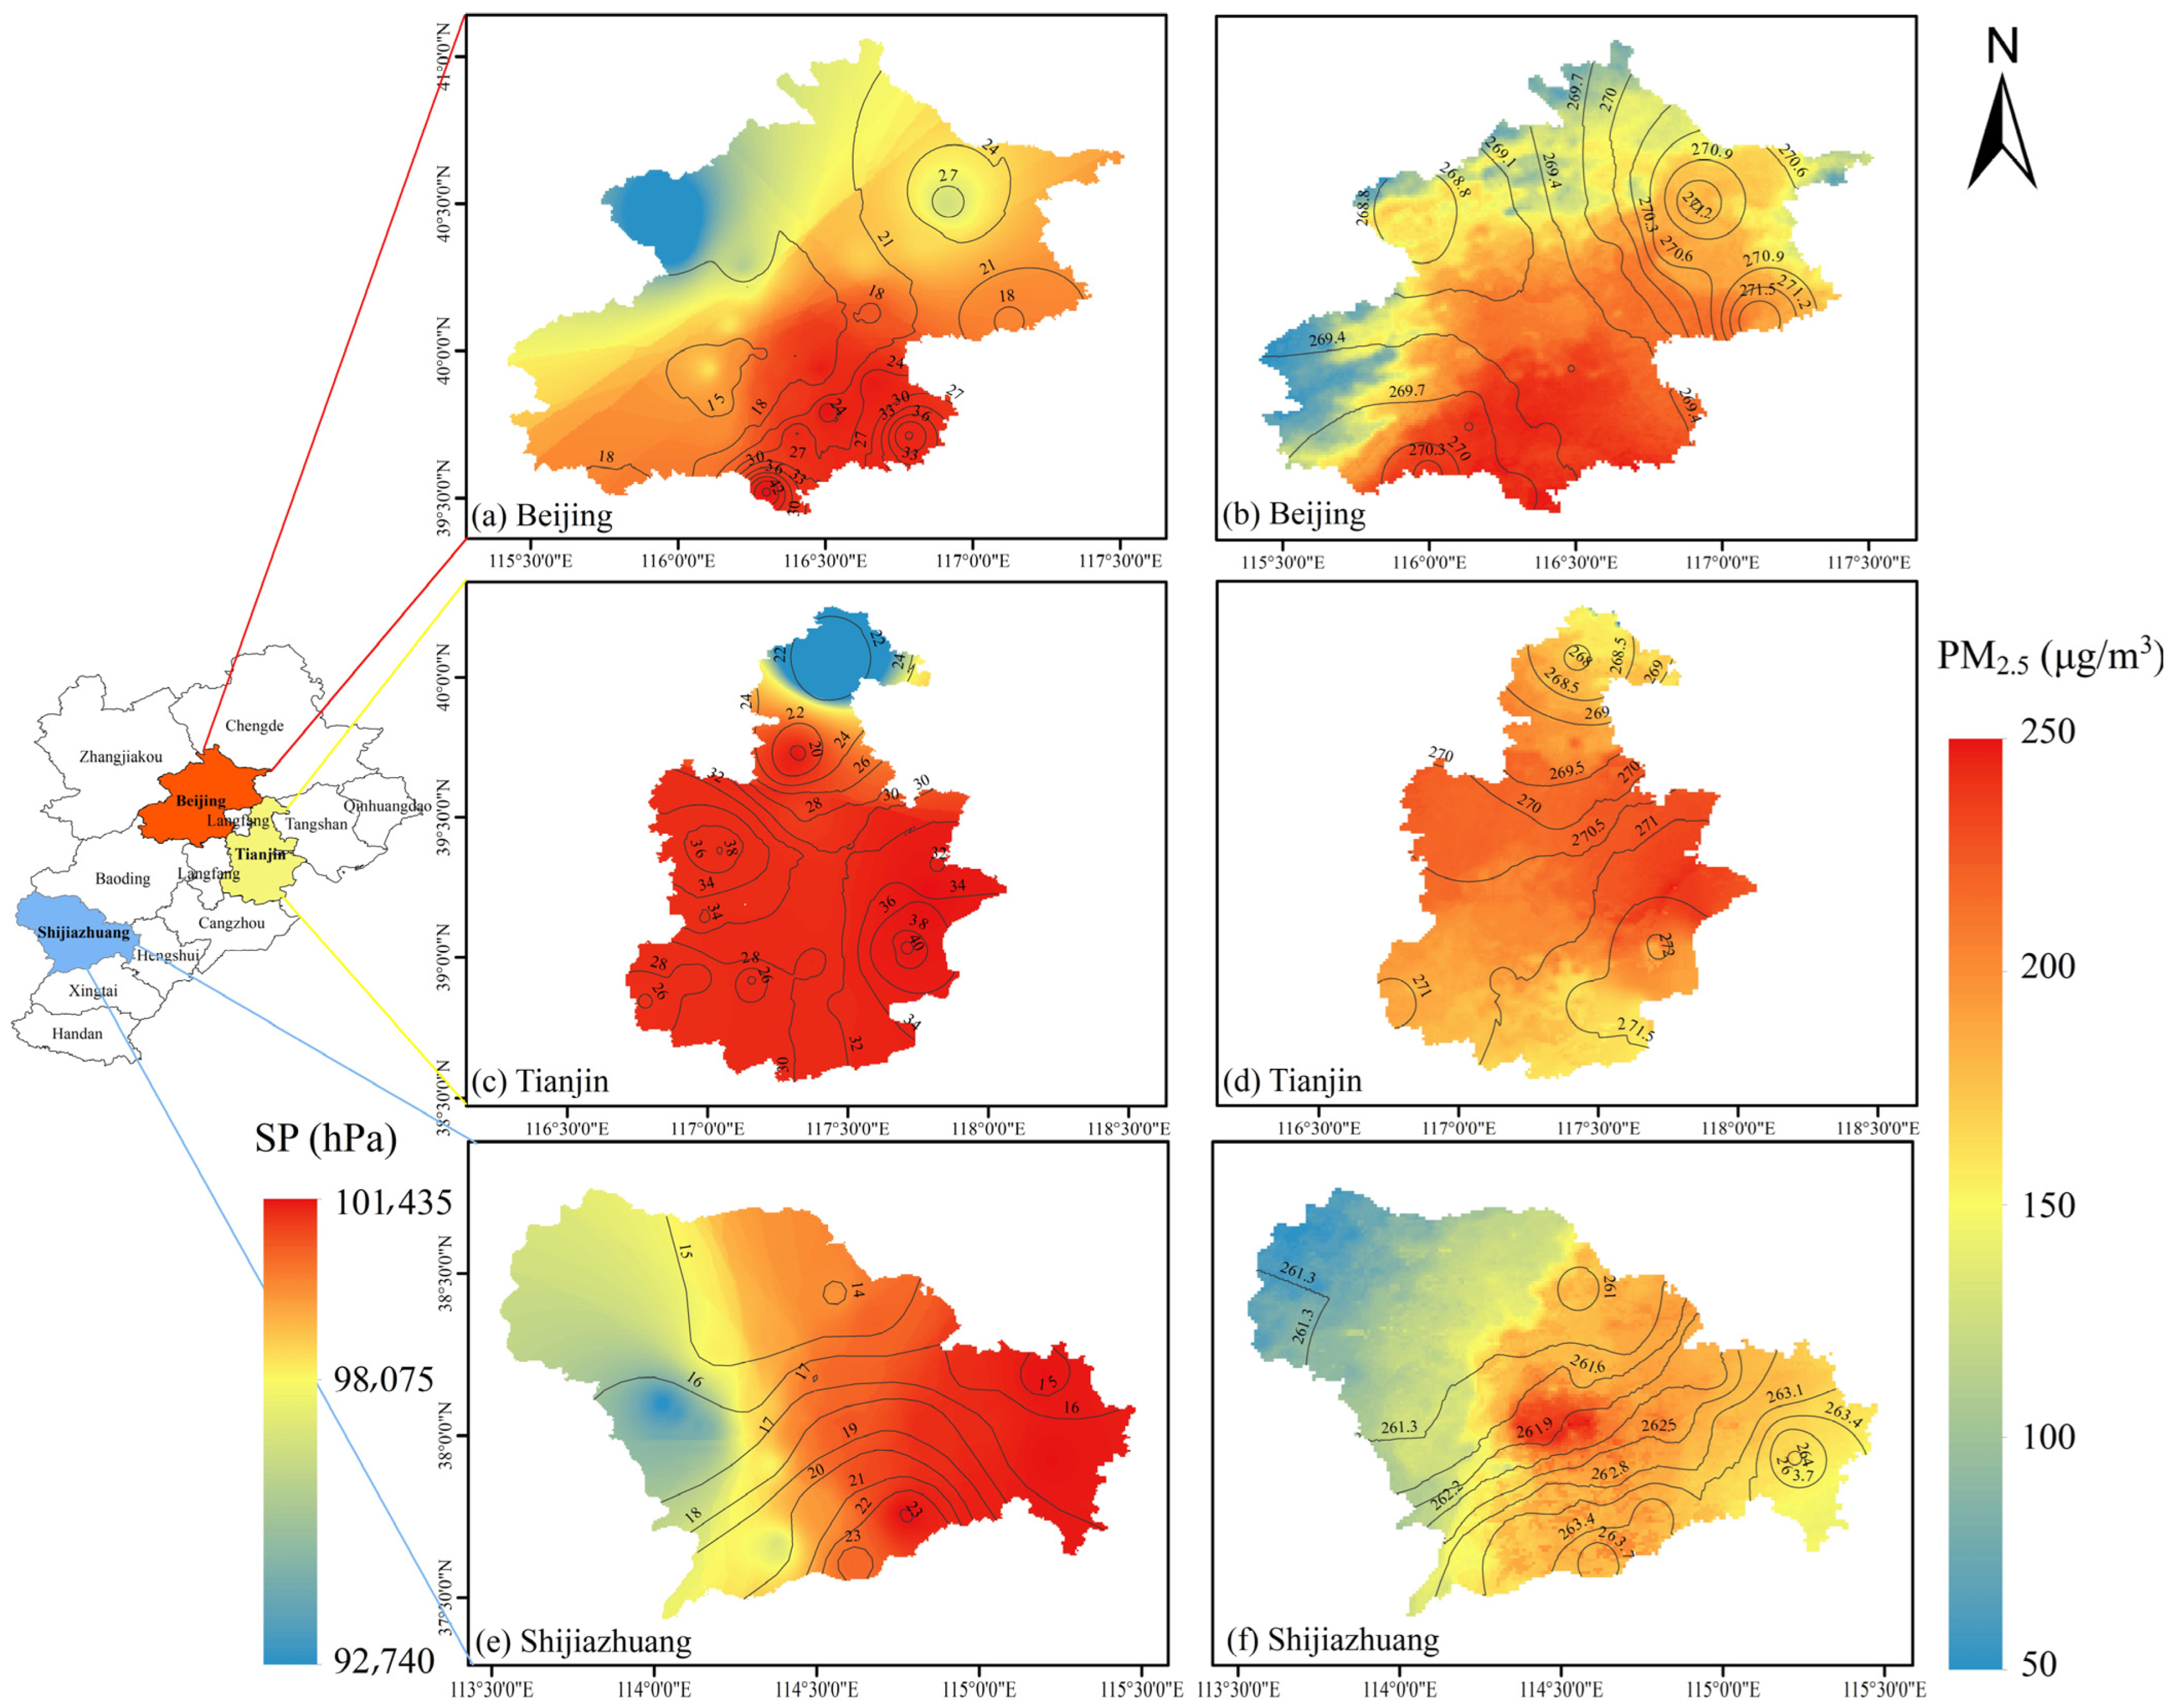
3.2.2. PM2.5 Concentrations in Selected Key Regions
4. Discussion
5. Conclusions
- (1)
- Using satellite TOAR instead of AOD to directly estimate PM2.5 concentrations enables a higher prediction accuracy to be obtained.
- (2)
- The hybrid learning model proposed in this study had high prediction accuracy and universality and was suitable for near-ground PM2.5 concentrations estimation: adding wavelet decomposition to the model extracted periodic features and random features of the original time series; using the fusion of two machine learning models not only took advantage of the minimum number of trees established by the random forest model but also took into account that the LightGBM model required less running memory and running time.
Author Contributions
Funding
Data Availability Statement
Conflicts of Interest
References
- Yang, L.; Xu, H.; Jin, Z. Estimating Ground-Level PM2.5 over a Coastal Region of China Using Satellite AOD and a Combined Model. J. Clean. Prod. 2019, 227, 472–482. [Google Scholar] [CrossRef]
- Fan, H.; Zhao, C.; Yang, Y. A Comprehensive Analysis of the Spatio-Temporal Variation of Urban Air Pollution in China during 2014–2018. Atmos. Environ. 2020, 220, 117066. [Google Scholar] [CrossRef]
- Song, Y.; Huang, B.; He, Q.; Chen, B.; Wei, J.; Mahmood, R. Dynamic Assessment of PM2.5 Exposure and Health Risk Using Remote Sensing and Geo-Spatial Big Data. Environ. Pollut. 2019, 253, 288–296. [Google Scholar] [CrossRef] [PubMed]
- Ebenstein, A.; Fan, M.; Greenstone, M.; He, G.; Zhou, M. New Evidence on the Impact of Sustained Exposure to Air Pollution on Life Expectancy from China’s Huai River Policy. Proc. Natl. Acad. Sci. USA 2017, 114, 10384–10389. [Google Scholar] [CrossRef] [PubMed] [Green Version]
- Chen, B.-Y.; Chen, C.-H.; Chuang, Y.-C.; Wu, Y.-H.; Pan, S.-C.; Guo, Y.L. Changes in the Relationship between Ambient Fine Particle Concentrations and Childhood Lung Function over 5 Years. Environ. Res. 2019, 179, 108809. [Google Scholar] [CrossRef]
- Wu, W.; Zhang, M.; Ding, Y. Exploring the Effect of Economic and Environment Factors on PM2.5 Concentration: A Case Study of the Beijing-Tianjin-Hebei Region. J. Environ. Manag. 2020, 268, 110703. [Google Scholar] [CrossRef]
- Bi, W.; Chen, K.; Xiao, Z.; Tang, M.; Zheng, N.; Yang, N.; Gao, J.; Li, Y.; Kong, J.; Xu, H. Health Benefit Assessment of China’s National Action Plan on Air Pollution in the Beijing-Tianjin-Hebei Area. Aerosol Air Qual. Res. 2019, 19, 383–389. [Google Scholar] [CrossRef]
- Ho, C.-C.; Chen, L.-J.; Hwang, J.-S. Estimating Ground-Level PM2.5 Levels in Taiwan Using Data from Air Quality Monitoring Stations and High Coverage of Microsensors. Environ. Pollut. 2020, 264, 114810. [Google Scholar] [CrossRef]
- Wu, J.; Li, T.; Zhang, C.; Cheng, Q.; Shen, H. Hourly PM 2.5 Concentration Monitoring With Spatiotemporal Continuity by the Fusion of Satellite and Station Observations. IEEE J. Sel. Top. Appl. Earth Obs. Remote Sens. 2021, 14, 8019–8032. [Google Scholar] [CrossRef]
- Dong, L.; Li, S.; Yang, J.; Shi, W.; Zhang, L. Investigating the Performance of Satellite-Based Models in Estimating the Surface PM2.5 over China. Chemosphere 2020, 256, 127051. [Google Scholar] [CrossRef]
- Ma, Z.; Hu, X.; Huang, L.; Bi, J.; Liu, Y. Estimating Ground-Level PM2.5 in China Using Satellite Remote Sensing. Environ. Sci. Technol. 2014, 48, 7436–7444. [Google Scholar] [CrossRef]
- Li, Y.; Yuan, S.; Fan, S.; Song, Y.; Wang, Z.; Yu, Z.; Yu, Q.; Liu, Y. Satellite Remote Sensing for Estimating PM2.5 and Its Components. Curr. Pollut. Rep. 2021, 7, 72–87. [Google Scholar] [CrossRef]
- He, Q.; Wang, M.; Yim, S.H.L. The Spatiotemporal Relationship between PM2.5 and Aerosol Optical Depth in China: Influencing Factors and Implications for Satellite PM2.5 Estimations Using MAIAC Aerosol Optical Depth. Atmos. Chem. Phys. 2021, 21, 18375–18391. [Google Scholar] [CrossRef]
- Zhang, T.; Zhu, Z.; Gong, W.; Zhu, Z.; Sun, K.; Wang, L.; Huang, Y.; Mao, F.; Shen, H.; Li, Z.; et al. Estimation of Ultrahigh Resolution PM2.5 Concentrations in Urban Areas Using 160 m Gaofen-1 AOD Retrievals. Remote Sens. Environ. 2018, 216, 91–104. [Google Scholar] [CrossRef]
- Xue, Y.; Li, Y.; Guang, J.; Tugui, A.; She, L.; Qin, K.; Fan, C.; Che, Y.; Xie, Y.; Wen, Y.; et al. Hourly PM2.5 Estimation over Central and Eastern China Based on Himawari-8 Data. Remote Sens. 2020, 12, 855. [Google Scholar] [CrossRef] [Green Version]
- Zeng, Q.; Chen, L.; Zhu, H.; Wang, Z.; Wang, X.; Zhang, L.; Gu, T.; Zhu, G.; Zhang, Y. Satellite-Based Estimation of Hourly PM2.5 Concentrations Using a Vertical-Humidity Correction Method from Himawari-AOD in Hebei. Sensors 2018, 18, 3456. [Google Scholar] [CrossRef] [Green Version]
- Tang, Y.; Deng, R.; Li, J.; Liang, Y.; Xiong, L.; Liu, Y.; Zhang, R.; Hua, Z. Estimation of Ultrahigh Resolution PM2.5 Mass Concentrations Based on Mie Scattering Theory by Using Landsat8 OLI Images over Pearl River Delta. Remote Sens. 2021, 13, 2463. [Google Scholar] [CrossRef]
- Wang, W.; Mao, F.; Du, L.; Pan, Z.; Gong, W.; Fang, S. Deriving Hourly PM2.5 Concentrations from Himawari-8 AODs over Beijing–Tianjin–Hebei in China. Remote Sens. 2017, 9, 858. [Google Scholar] [CrossRef] [Green Version]
- Mirzaei, M.; Amanollahi, J.; Tzanis, C.G. Evaluation of Linear, Nonlinear, and Hybrid Models for Predicting PM2.5 Based on a GTWR Model and MODIS AOD Data. Air Qual. Atmos. Health 2019, 12, 1215–1224. [Google Scholar] [CrossRef]
- He, Q.; Huang, B. Satellite-Based High-Resolution PM2.5 Estimation over the Beijing-Tianjin-Hebei Region of China Using an Improved Geographically and Temporally Weighted Regression Model. Environ. Pollut. 2018, 236, 1027–1037. [Google Scholar] [CrossRef] [PubMed]
- Chu, H.-J.; Bilal, M. PM2.5 Mapping Using Integrated Geographically Temporally Weighted Regression (GTWR) and Random Sample Consensus (RANSAC) Models. Environ. Sci. Pollut. Res. 2019, 26, 1902–1910. [Google Scholar] [CrossRef] [PubMed]
- Yan, X.; Zang, Z.; Jiang, Y.; Shi, W.; Guo, Y.; Li, D.; Zhao, C.; Husi, L. A Spatial-Temporal Interpretable Deep Learning Model for Improving Interpretability and Predictive Accuracy of Satellite-Based PM2.5. Environ. Pollut. 2021, 273, 116459. [Google Scholar] [CrossRef] [PubMed]
- Li, X.; Zhang, X. Predicting Ground-Level PM2.5 Concentrations in the Beijing-Tianjin-Hebei Region: A Hybrid Remote Sensing and Machine Learning Approach. Environ. Pollut. 2019, 249, 735–749. [Google Scholar] [CrossRef] [PubMed] [Green Version]
- Wei, J.; Li, Z.; Pinker, R.T.; Wang, J.; Sun, L.; Xue, W.; Li, R.; Cribb, M. Himawari-8-Derived Diurnal Variations in Ground-Level PM2.5 Pollution across China Using the Fast Space-Time Light Gradient Boosting Machine (LightGBM). Atmos. Chem. Phys. 2021, 21, 7863–7880. [Google Scholar] [CrossRef]
- Kim, S.-M.; Koo, J.-H.; Lee, H.; Mok, J.; Choi, M.; Go, S.; Lee, S.; Cho, Y.; Hong, J.; Seo, S.; et al. Comparison of PM2.5 in Seoul, Korea Estimated from the Various Ground-Based and Satellite AOD. Appl. Sci. 2021, 11, 10755. [Google Scholar] [CrossRef]
- Pu, Q.; Yoo, E.-H. Ground PM2.5 Prediction Using Imputed MAIAC AOD with Uncertainty Quantification. Environ. Pollut. 2021, 274, 116574. [Google Scholar] [CrossRef] [PubMed]
- Shen, H.; Li, T.; Yuan, Q.; Zhang, L. Estimating Regional Ground-Level PM2.5 Directly From Satellite Top-of-Atmosphere Reflectance Using Deep Belief Networks. J. Geophys. Res. Atmos. 2018, 123, 13,875–13,886. [Google Scholar] [CrossRef] [Green Version]
- Bai, H.; Zheng, Z.; Zhang, Y.; Huang, H.; Wang, L. Comparison of Satellite-Based PM2.5 Estimation from Aerosol Optical Depth and Top-of-Atmosphere Reflectance. Aerosol Air Qual. Res. 2021, 21, 200257. [Google Scholar] [CrossRef]
- Yang, L.; Xu, H.; Yu, S. Estimating PM2.5 Concentrations in Yangtze River Delta Region of China Using Random Forest Model and the Top-of-Atmosphere Reflectance. J. Environ. Manag. 2020, 272, 111061. [Google Scholar] [CrossRef]
- Yin, J.; Mao, F.; Zang, L.; Chen, J.; Lu, X.; Hong, J. Retrieving PM2.5 with High Spatio-Temporal Coverage by TOA Reflectance of Himawari-8. Atmos. Pollut. Res. 2021, 12, 14–20. [Google Scholar] [CrossRef]
- Zhao, G.; Huang, G.; He, H.; He, H.; Ren, J. Regional Spatiotemporal Collaborative Prediction Model for Air Quality. IEEE Access 2019, 7, 134903–134919. [Google Scholar] [CrossRef]
- Ding, Y.; Chen, Z.; Lu, W.; Wang, X. A CatBoost Approach with Wavelet Decomposition to Improve Satellite-Derived High-Resolution PM2.5 Estimates in Beijing-Tianjin-Hebei. Atmos. Environ. 2021, 249, 118212. [Google Scholar] [CrossRef]
- Wang, J.; He, L.; Lu, X.; Zhou, L.; Tang, H.; Yan, Y.; Ma, W. A Full-Coverage Estimation of PM2.5 Concentrations Using a Hybrid XGBoost-WD Model and WRF-Simulated Meteorological Fields in the Yangtze River Delta Urban Agglomeration, China. Environ. Res. 2022, 203, 111799. [Google Scholar] [CrossRef]
- Song, Z.; Chen, B.; Huang, Y.; Dong, L.; Yang, T. Estimation of PM2.5 Concentration in China Using Linear Hybrid Machine Learning Model. Atmos. Meas. Tech. 2021, 14, 5333–5347. [Google Scholar] [CrossRef]
- Liu, J.; Weng, F.; Li, Z. Satellite-Based PM2.5 Estimation Directly from Reflectance at the Top of the Atmosphere Using a Machine Learning Algorithm. Atmos. Environ. 2019, 208, 113–122. [Google Scholar] [CrossRef]
- Mehdizadeh, S.; Ahmadi, F.; Danandeh Mehr, A.; Safari, M.J.S. Drought Modeling Using Classic Time Series and Hybrid Wavelet-Gene Expression Programming Models. J. Hydrol. 2020, 587, 125017. [Google Scholar] [CrossRef]
- Khosravi, I.; Alavipanah, S.K. A Random Forest-Based Framework for Crop Mapping Using Temporal, Spectral, Textural and Polarimetric Observations. Int. J. Remote Sens. 2019, 40, 7221–7251. [Google Scholar] [CrossRef]
- Chen, C.; Zhang, Q.; Ma, Q.; Yu, B. LightGBM-PPI: Predicting Protein-Protein Interactions through LightGBM with Multi-Information Fusion. Chemom. Intell. Lab. Syst. 2019, 191, 54–64. [Google Scholar] [CrossRef]
- Zhong, J.; Zhang, X.; Gui, K.; Wang, Y.; Che, H.; Shen, X.; Zhang, L.; Zhang, Y.; Sun, J.; Zhang, W. Robust Prediction of Hourly PM2.5 from Meteorological Data Using LightGBM. Natl. Sci. Rev. 2021, 8, nwaa307. [Google Scholar] [CrossRef]
- Liang, W.; Luo, S.; Zhao, G.; Wu, H. Predicting Hard Rock Pillar Stability Using GBDT, XGBoost, and LightGBM Algorithms. Mathematics 2020, 8, 765. [Google Scholar] [CrossRef]
- Paul, D.; Goswami, A.K.; Chetri, R.L.; Roy, R.; Sen, P. Bayesian Optimization-Based Gradient Boosting Method of Fault Detection in Oil-Immersed Transformer and Reactors. IEEE Trans. Ind. Appl. 2022, 58, 1910–1919. [Google Scholar] [CrossRef]
- Hua, Z.; Sun, W.; Yang, G.; Du, Q. A Full-Coverage Daily Average PM2.5 Retrieval Method with Two-Stage IVW Fused MODIS C6 AOD and Two-Stage GAM Model. Remote Sens. 2019, 11, 1558. [Google Scholar] [CrossRef] [Green Version]
- He, Q.; Huang, B. Satellite-Based Mapping of Daily High-Resolution Ground PM2.5 in China via Space-Time Regression Modeling. Remote Sens. Environ. 2018, 206, 72–83. [Google Scholar] [CrossRef]
- Xue, W.; Zhang, J.; Zhong, C.; Li, X.; Wei, J. Spatiotemporal PM2.5 Variations and Its Response to the Industrial Structure from 2000 to 2018 in the Beijing-Tianjin-Hebei Region. J. Clean. Prod. 2021, 279, 123742. [Google Scholar] [CrossRef]
- Wei, J.; Huang, W.; Li, Z.; Xue, W.; Peng, Y.; Sun, L.; Cribb, M. Estimating 1-Km-Resolution PM2.5 Concentrations across China Using the Space-Time Random Forest Approach. Remote Sens. Environ. 2019, 231, 111221. [Google Scholar] [CrossRef]
- Xiao, Q.; Wang, Y.; Chang, H.H.; Meng, X.; Geng, G.; Lyapustin, A.; Liu, Y. Full-Coverage High-Resolution Daily PM2.5 Estimation Using MAIAC AOD in the Yangtze River Delta of China. Remote Sens. Environ. 2017, 199, 437–446. [Google Scholar] [CrossRef]


| Category | Variable | Spatial Resolution | Temporal Resolution |
|---|---|---|---|
| PM2.5 | daily-mean PM2.5 | — | day |
| Remote sensing data | TOAR, AOD, solar zenith, solar azimuth, sensor zenith, sensor azimuth | 1 km | day |
| 1 km | day | ||
| 1 km | day | ||
| Meteorological element data | Boundary Layer Height, Total Column of Water, Total Column Ozone, Surface Pressure, 2 m temperature, 10 m u-component of wind, 10 m v-component of wind | 0.25 | day |
| Auxiliary data | Elevation data | 1 km | year |
| Name | Meaning | Value |
|---|---|---|
| n_estimators | Tree number | 949 |
| max_depth | Maximum depth of tree | 24 |
| max_features | Number of tree features | 0.5 |
| min_samples_split | Conditions limiting the continuation of subtree division | 4 |
| min_samples_leaf | Minimum number of samples of leaf nodes | 4 |
| Name | Meaning | Value |
|---|---|---|
| num_boost_round | Iteration number | 1350 |
| max_depth | Maximum depth of tree | 16 |
| feature_fraction | Select the set scale feature to build tree | 0.84 |
| bagging_fraction | Proportion of data used in each iteration | 0.73 |
| min_child_weight | Sum of the minimum leaf node weights | 16 |
| reg_alpha | L1 Regularization | 0.27 |
| reg_lambda | L2 Regularization | 0.33 |
| learning_rate | Learning Rate | 0.01 |
| Feature | Wavelet Decomposition | Meteorological Elements | R2 | RMSE | MAE | |
|---|---|---|---|---|---|---|
| (a) | TOAR | yes | yes | 0.9138 | 11.6008 | 7.3444 |
| (b) | AOD | yes | yes | 0.8507 | 14.5302 | 8.4794 |
| (c) | TOAR | no | yes | 0.9061 | 12.1086 | 7.8400 |
| (d) | AOD | no | yes | 0.8430 | 14.8983 | 8.9637 |
| (e) | TOAR | yes | no | 0.8205 | 15.9296 | 9.6845 |
| (f) | AOD | yes | no | 0.8149 | 17.0038 | 10.4776 |
| (g) | TOAR | no | no | 0.8030 | 16.6905 | 10.3785 |
| (h) | AOD | no | no | 0.8095 | 17.2508 | 10.8727 |
| Model | R2 | RMSE | MAE |
|---|---|---|---|
| MLR | 0.2440 | 34.4142 | 23.3809 |
| GTWR | 0.3193 | 32.6560 | 21.7422 |
| RF 1 | 0.8892 | 13.1518 | 8.0969 |
| LightGBM | 0.8943 | 12.8470 | 8.5899 |
| WD 2 + XGBoost | 0.8897 | 13.1197 | 8.4524 |
| WD + CatBoost | 0.8801 | 13.6810 | 8.5159 |
| DBN | 0.8596 | 14.7267 | 9.7049 |
| This study | 0.9090 | 12.3642 | 7.3717 |
| Model | Primary Predictor | Spatial Resolution | Scale | Performance | Reference | ||
|---|---|---|---|---|---|---|---|
| R2 | RMSE | MAE | |||||
| Two-stage | AOD | 10 KM | YRD 1 | 0.78 | 19.18 | — | Hua et al. (2019) [42] |
| RF | AOD | 10 KM | BTH 2 | 0.84 | 25.32 | — | Li et al. (2019) [23] |
| GTWR | AOD | 3 KM | China | 0.80 | 18.00 | 12.03 | He et al. (2018) [43] |
| IGTWR | AOD | 3 KM | BTH | 0.84 | 27.84 | — | He et al. (2018) [20] |
| WT + XGBoost | AOD | 3 KM | YRD | 0.87 | 12.83 | 8.97 | Wang et al. (2022) [33] |
| LME | AOD | 1 KM | BTH | 0.85 | 21.49 | 15.26 | Xue et al. (2021) [44] |
| STRF | AOD | 1 KM | China | 0.85 | 15.57 | 9.77 | Wei et al. (2019) [45] |
| WT + CatBoost | AOD | 1 KM | BTH | 0.88 | 17.79 | — | Ding et al. (2021) [32] |
| SIDLM | TOAR | 3 KM | China | 0.70 | 15.30 | — | Yan et al. (2021) [22] |
| DBN | TOAR | 1 KM | Wuhan | 0.87 | 9.89 | — | Shen et al. (2018) [27] |
| This study | TOAR | 1 KM | BTH | 0.91 | 12.36 | 7.37 | — |
Publisher’s Note: MDPI stays neutral with regard to jurisdictional claims in published maps and institutional affiliations. |
© 2022 by the authors. Licensee MDPI, Basel, Switzerland. This article is an open access article distributed under the terms and conditions of the Creative Commons Attribution (CC BY) license (https://creativecommons.org/licenses/by/4.0/).
Share and Cite
Feng, Y.; Fan, S.; Xia, K.; Wang, L. Estimation of Regional Ground-Level PM2.5 Concentrations Directly from Satellite Top-of-Atmosphere Reflectance Using A Hybrid Learning Model. Remote Sens. 2022, 14, 2714. https://doi.org/10.3390/rs14112714
Feng Y, Fan S, Xia K, Wang L. Estimation of Regional Ground-Level PM2.5 Concentrations Directly from Satellite Top-of-Atmosphere Reflectance Using A Hybrid Learning Model. Remote Sensing. 2022; 14(11):2714. https://doi.org/10.3390/rs14112714
Chicago/Turabian StyleFeng, Yu, Shurui Fan, Kewen Xia, and Li Wang. 2022. "Estimation of Regional Ground-Level PM2.5 Concentrations Directly from Satellite Top-of-Atmosphere Reflectance Using A Hybrid Learning Model" Remote Sensing 14, no. 11: 2714. https://doi.org/10.3390/rs14112714
APA StyleFeng, Y., Fan, S., Xia, K., & Wang, L. (2022). Estimation of Regional Ground-Level PM2.5 Concentrations Directly from Satellite Top-of-Atmosphere Reflectance Using A Hybrid Learning Model. Remote Sensing, 14(11), 2714. https://doi.org/10.3390/rs14112714