Technical Note

Monitoring Raptor Movements with Satellite Telemetry and Avian Radar Systems: An Evaluation for Synchronicity

1
National Wildlife Research Center, USDA APHIS Wildlife Services, 6100 Columbus Avenue, Sandusky, OH 44870, USA
2
The Grainger College of Engineering, University of Illinois at Urbana-Champaign, 205 N. Mathews Avenue, Urbana, IL 61801, USA
3
USDA APHIS Wildlife Services, 3430 Constitution Avenue, Suite 121, Springfield, IL 62711, USA
4
USDA APHIS Wildlife Services, O’Hare International Airport, AMC Building, Room 421, Chicago, IL 60666, USA
5
USDA APHIS Wildlife Services, 1713 Commerce Court, Suite C, Columbia, MO 65202, USA
*
Author to whom correspondence should be addressed.
Remote Sens. 2022, 14(11), 2658; https://doi.org/10.3390/rs14112658
Submission received: 13 April 2022 / Revised: 21 May 2022 / Accepted: 26 May 2022 / Published: 2 June 2022
(This article belongs to the Special Issue Monitoring Bird Movements by Remote Sensing)

Abstract

:
Avian radar technologies have the potential to serve an important role in the quantification of bird movements and determining patterns of bird use in areas where human–wildlife conflicts might occur (e.g., airports, wind energy facilities). Ground-truthing studies are needed to help wildlife managers understand the biological meaning of radar information, as the capabilities and limitations of these technologies are relatively unknown. We conducted a study to evaluate the efficacy of three X-band marine radar sensors for tracking red-tailed hawks (Buteo jamaicensis) on or near the airfield at Chicago’s O’Hare International Airport from September 2010 to May 2014. Specific information regarding red-tailed hawk locations derived from satellite telemetry was used to determine how frequently the three radar sensors provided corresponding tracks of these avian targets (i.e., synchronized monitoring). We examined various factors (e.g., bird altitude and distance to the radar) to determine if they had any influence on the frequency of synchronicity between satellite telemetry locations and radar tracks. We found evidence that as the distance between a hawk and the radars increased, the radars’ ability to detect and track known avian targets decreased. Overall, the frequency of synchronization events for red-tailed hawks was low. Of the 1977 red-tailed hawk locations that should have been visible to the radar sensors, 51 of these bird movements were tracked by at least one of the radar sensors (2.6%). This study provides a new methodology for evaluating the performance of radar systems for tracking birds and determining what factors might influence overall performance.

Graphical Abstract

1. Introduction

The airspace provides an important habitat for a large diversity of plant and animal taxa, including birds and flying mammals [1]. Studying the in-flight movements of aerial organisms to gain ecological knowledge [2] or to assess the impacts of anthropogenic structures and vehicles upon aerial wildlife populations [3,4] remains an important and contemporary area of growth in ecological research (termed aeroecology; [2,5]). The acquisition of accurate data regarding the movements of aerial wildlife traditionally has been extremely challenging for ecologists, but the recent development of several technologies has created the potential for collecting and analyzing this invaluable information.
Advances in satellite telemetry have allowed for an unprecedented understanding of the large-scale migratory movements of a variety of birds and mammals [6,7,8,9]. Furthermore, global positioning system (GPS)-capable satellite telemetry equipment can also provide detailed information on the fine-scale local movement and habitat use patterns of wildlife within temporally or spatially defined periods and areas [10,11,12,13].
Bird movements have been tracked using radar technologies for many decades [14,15]. Military and civilian radar systems and networks have been used in many studies to examine the movement patterns of numerous bird species in a variety of environments [16,17,18,19,20]. Advances in information technology and automated processing of large digital datasets have led to the development of several commercially available avian radar systems. These systems are essentially marine radars with customized antennae, transceivers, and processing software designed for tracking individuals or groups of birds to a distance of up to 20 km (12.4 miles) from the radar [20,21].
There is considerable interest in using avian radar systems to gain ornithological information associated with contemporary human–wildlife conflicts, including bird mortalities associated with wind energy development [22,23,24,25] and human safety concerns associated with wildlife-aircraft collisions (wildlife strikes) [26,27,28,29]. Although avian radar systems have some apparent advantages, many aspects of the new technology remain poorly understood and relatively unevaluated [20].
Combining bird monitoring/tracking technologies, such as satellite telemetry and avian radar, has the potential to provide unique insights into avian movements in local areas of interest [30,31,32]. One study demonstrated that synchronous monitoring of vultures using satellite telemetry and an avian radar system was possible [33]. Advancing this idea further, we developed a study to evaluate the efficacy of three avian radar systems (i.e., validating the radars) for detecting and tracking red-tailed hawks (Buteo jamaicensis) that were being simultaneously tracked using global positioning system (GPS)-capable satellite telemetry units. To our knowledge, this novel approach has not been attempted prior to this effort.
We used an evaluation approach similar in concept to other radar evaluation studies [28,29,34,35] in that we used two independent datasets, one of the individual red-tailed hawk locations and the other a set of radar tracks, to determine the proportion of related observations (i.e., synchronized monitoring events) between the two methods. However, in our approach, we used red-tailed hawk locations provided by satellite telemetry [33] rather than visual observations of birds. The objectives of our study were to: (1) investigate the ability of commercially produced avian radar systems to track individual red-tailed hawks in a large, complex airport environment and (2) determine which variables influenced the radars’ ability to track these avian targets.

2. Materials and Methods

This study took place at Chicago’s O’Hare International Airport (ORD) in Chicago, Illinois, from 1 September 2010 to 5 May 2014. ORD (41°58′43″N, 87°54′17″W) and was operated by the Chicago Department of Aviation and encompassed approximately 2950 ha [36]. In 2010, there were over 67 million passengers and 882,612 aircraft operations at the airport, making ORD one of the largest and busiest civilian airports in the world [37,38].
The airport property is comprised of a variety of land covers, including pavement/buildings (1281 ha), grasslands (1375 ha), areas under construction (232 ha), and forest/shrublands (25 ha). In addition, numerous water features (e.g., retention ponds) and drainage areas are distributed throughout the ORD airfield [36]. The mean annual precipitation in the study area is 930 mm per year, with 56% typically falling as snow during October–April [39]. Average daily temperatures are 22.2 °C during summer and −4.1 °C during winter.
As part of a larger study, red-tailed hawks were live-captured on or near the airfield at ORD using a variety of standard live-trapping methods effective with this species [40]. The age of all captured red-tailed hawks was determined by plumage [41]. The hawks were banded with a U.S. Geological Survey (USGS) aluminum leg band on one leg and an alpha-numeric coded colored leg-band on the other leg. In total, 20 red-tailed hawks (12 after-second-year birds and 8 s-year birds) were live-captured and fitted with solar-powered GPS-capable satellite transmitters (30–g Solar Argos/GPS PTT-100; Microwave Telemetry Inc., Columbia, MD, USA) on or near ORD during 2010–2012. These units were programmed to operate at 2–h intervals between 05:00 and 23:00 h local standard time and thus provided information 10 times per day. For each individual telemetry location, the transmitter provides the latitude, longitude, and altitude (m) of where the bird was at that specific time. For each satellite telemetry location, we considered an error tolerance of ±20 m in Easting, Northing, and altitude (thus, we assume the true location of the bird was within a volume with these dimensions). All of the activities involving the red-tailed hawks were reviewed and approved by the USDA/APHIS/WS/National Wildlife Research Center’s Institutional Animal Care and Use Committee (QA-1750).
Using the location of the avian radar systems (on the ORD airfield) as a center point, we established a circle with a radius of 10 km around that location (Figure 1). We then queried all of the red-tailed hawk locations that were provided by the satellite transmitters that occurred within this spatial extent and built a new dataset that contained only hawk locations within the 10–km radius. We used the flight speed and altitude of each individual red-tailed hawk location to categorize the bird’s activity as either “not moving” (i.e., perched, on nest) or “in flight”. We defined a hawk location as the bird being “in flight” if the corresponding speed was ≥5 k/h and the altitude was >1 m [11]. All of the “not moving” red-tailed hawk locations were then parsed from the database. A total of 2244 individual red-tailed hawk locations provided by the satellite telemetry units met these criteria.
Using the beam geometry (Figure 2), the location of the radars, and the horizontal and vertical position of each hawk location, we determined whether or not the radar systems would have the opportunity to detect and track the individual hawk locations. Fifty-one individual red-tailed hawk locations were consequently removed from the dataset because it was determined that they did not occur within one of the radar beams (e.g., the location occurred at an altitude above all of the radar beams).
We hypothesized that climatic conditions, more specifically air temperature, might influence radar performance. Ambient air temperature (°C) at the time of each hawk satellite telemetry location was obtained from the National Oceanic and Atmospheric Administration’s O’Hare International Airport weather station (www.ncdc.noaa.gov, last accessed on 12 December 2017).
Our study used the same Accipiter® avian radar (AR) units [acquired from Accipiter Radar Technologies, Inc. (ARTI; Fonthill, ON, Canada)] as described in [29]. These radars consisted of a Furuno® 8252 X-band marine radar (Furuno Electric Company Ltd., Nishinomiya City, Japan). One radar sensor, designated as avian radar 1 (AR1), was equipped with parabolic dish antennae set at 2° above the horizon. The second radar sensor was equipped with a parabolic dish, one set at 4° (AR2-1), and the third sensor’s parabolic dish was set at 8° above the horizon (AR2-2). The altitude setting of these sensors allowed for different altitudinal coverage. The 3 radar sensors were mounted on top of 2 portable radar trailers (i.e., two sensors on one trailer and the third sensor on the second trailer), elevating them approximately 2.5 m above the ground. The radar trailers were located next to each other on the northwestern side of the airfield (41.993163, −87.934061) (Figure 1). Each dish antenna was set to rotate at 24 revolutions per min (approximately one rotation every 2.5 s). The radar sensors operated almost continuously from September 2010 to May 2014, except for short periods of time when equipment maintenance and repair were necessary. The AR1 and AR2-2 radar sensors were operated in short pulse mode, whereas the AR2-1 was in long pulse mode (which increases the range of detection) for the duration of the study [21].
Tracker.exe Software® (Version 6.7.7.7; Accipiter Radar Technologies, Inc., Fonthill, ON, Canada) was used to identify and display radar targets. To exclude fixed- and rotary-wing aircraft, we installed a filter to censor echoes that were traveling faster than a speed of 40 m/s. The radar recorded a plot when it received an echo from a potential avian target. If that same echo was recorded on the next 3 antenna revolutions, the plot was then recorded as a track, assigned an identifier, and the target was tracked until an echo was no longer detected. Time of observation (GMT), distance from radar (m), and target elevation (°) were recorded for each radar track. Radar plots and tracks were simultaneously displayed on a screen in the radar trailers (for immediate visual consideration) and automatically saved onto a computer hard drive (for later analyses).
We used the Trackdataviewer.exe® software (Version 6.7.7.7; Accipiter Radar Technologies, Inc., Fonthill, ON, Canada) and the radar track data obtained from the digital radar processors (i.e., the radar units) to produce data files in a CSV format for further analyses. We compared the radar and observer data using a stepwise filtering script written with program R [42]. This script greatly reduced the time needed to conduct the analyses, allowed buffers to be built into some parameters, and reduced the potential for human error. We conducted quality control efforts to ensure the script was functioning correctly. When developing the script that program R used to associate radar and red-tailed hawk satellite telemetry location data, buffers were included to address potential bias associated with satellite telemetry or radar tracking location error. For example, the program analyzed radar data from 60 s before to 60 s after each red-tailed hawk location occurred, as referenced by the satellite telemetry data. For each hawk satellite telemetry location, we considered an error tolerance of ±20 m in Easting, Northing, and altitude. We used error tolerances of ±2° in azimuth, ±1% of the distance from the radar, and ±2° in altitude of each hawk location relative to the radar units to establish a volume of airspace that was then evaluated for the presence of a radar track. Based on these buffers, program R produced a figure that displayed the area of possible detection by the radar, any radar tracks that were in that area, and the red-tailed hawk location provided by the satellite telemetry units.
When compared to the red-tailed hawk locations provided by the satellite telemetry data, radar tracks were classified as either “NO_SYNCHRONIZATION” (coded as 0) for instances in which an individual hawk location that could have potentially been tracked by radar but no radar data were correlated to that observation, or “SYNCHRONIZATION” (coded as 1) in which a radar track (presumed to be the red-tailed hawk) was tracked within the buffers of the red-tailed hawk location. These data were then saved as CSV files that were reviewed for quality assurance.
Synchronized monitoring was coded as a binary response variable, with 0 representing instances in which an individual hawk location that could have been tracked by radar but no radar data were correlated to that observation and 1 representing a radar track (presumed to be the red-tailed hawk) within the buffers of the hawk location as determined by satellite telemetry. We developed a set of candidate models and then evaluated those models using Akaike’s Information Criterion adjusted for a small sample size AICc [43]. We used binomial logistic regression in program R Version 3.2.1 [42] to model radar tracks (matching) as a function of four fixed factors: Altitude (i.e., the estimated flight altitude in m of the hawk), Distance (i.e., the estimated distance in km of the hawk from the radar unit), Angle (i.e., the calculated inclination from the radar in degrees), and Temperature (i.e., the ambient air temperature in °C). We built regression models that used all 3 radar sensors working together, as well as models for each of the 3 radar sensors independently. We considered models with ∆AICc ≤ 2 to be competing candidate models [43]. Model-averaging techniques using the R package AICcmodavg [44] were used to generate model-averaged parameter estimates for all models that had an AICc < 10 from the top model [45]. We developed effect plots for variables that were important in influencing the performance of all 3 radars combined, as well as the AR1, AR2-1, and AR2-2 radars independently [46].

3. Results

There was a total of 1977 red-tailed hawk locations that could have been tracked by one or more of the radar sensors. When considering each individual radar sensor independently, there were 1643 (83% of the total), 292 (15%), and 43 (2%) red-tailed hawk locations that could have been tracked by the AR1 radar sensor, the AR2-1 radar sensor, and the AR2-2 radar sensor, respectively.

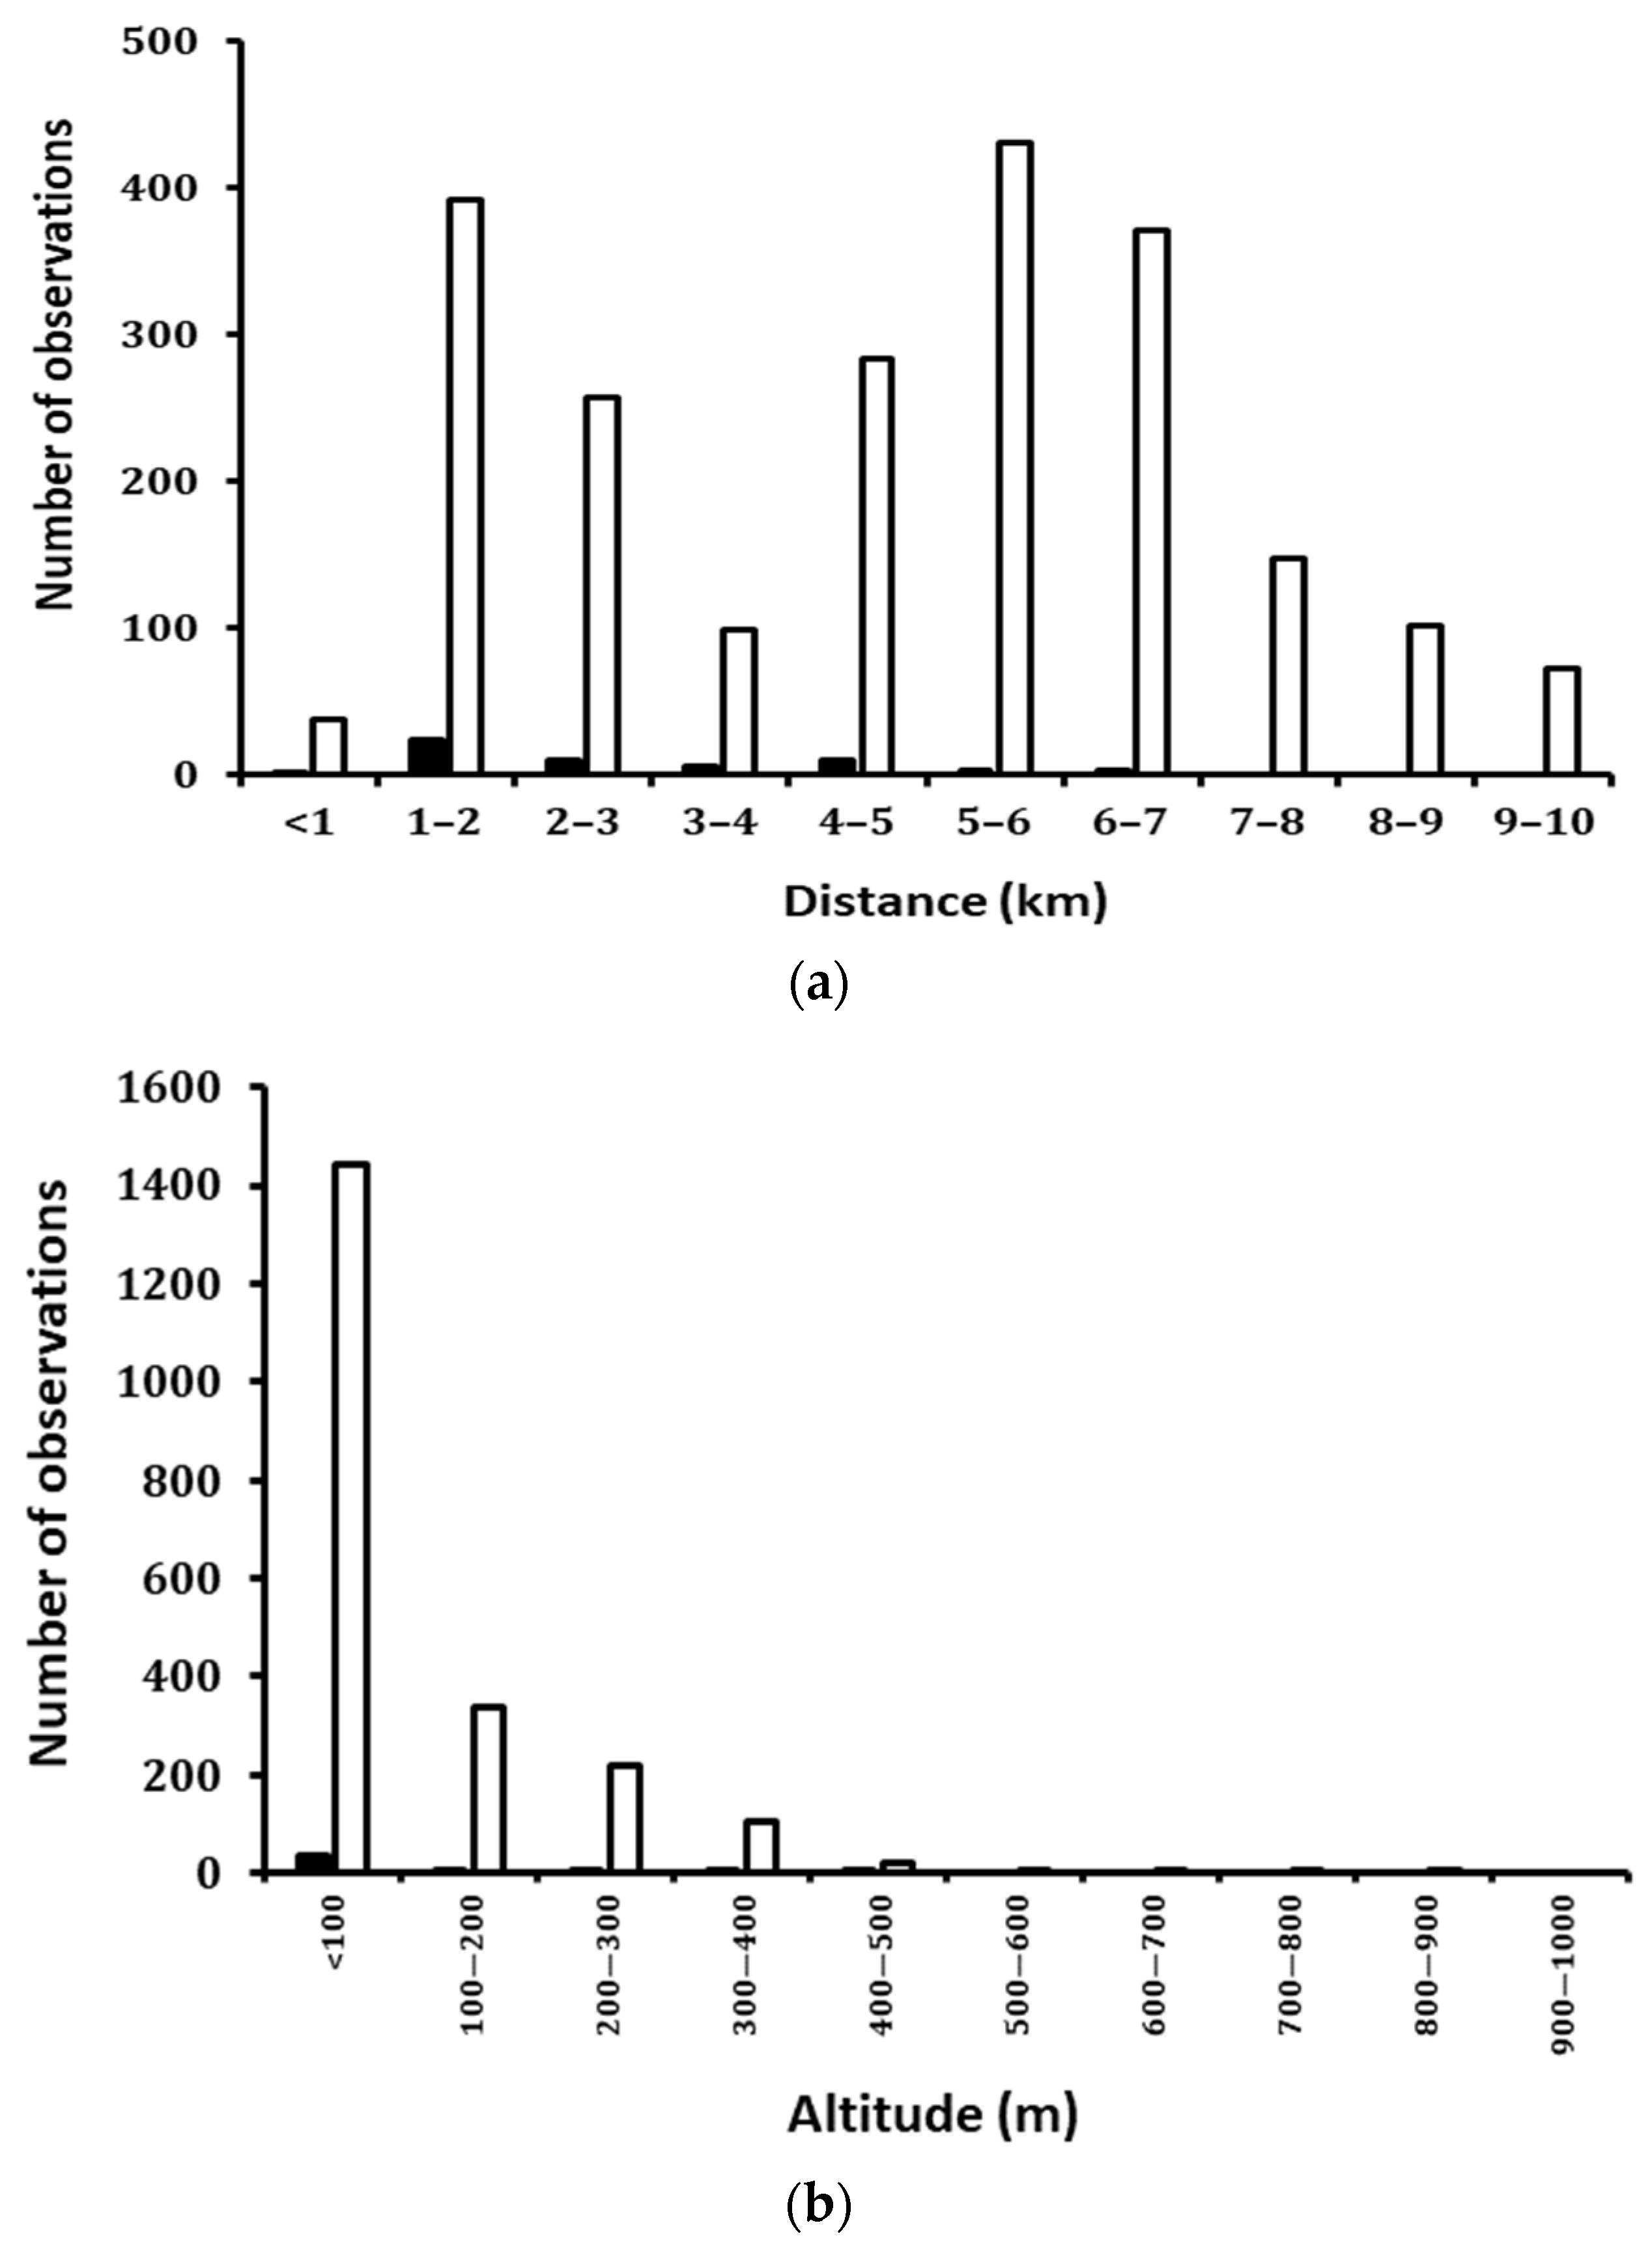
3.1. Overall Satellite Telemetry and Radar Track Syncronization

Of the 1977 red-tailed hawk locations that should have been visible to the radar sensors, 51 of these bird movements were tracked by at least one of the radar sensors (2.6%). Confirmed tracks of red-tailed hawks (i.e., synchronization events) were from 0 9 to 6.9 km from the radars and were 5 to 545 m in altitude. Although one-half (49%) of the red-tailed hawk locations were within 5 km of the radars, 89% of the synchronized monitoring events occurred within this same distance (Figure 3a). Most red-tailed hawk locations (84%) provided by the satellite telemetry were at or below 200 m in altitude, whereas 81% of the confirmed radar tracks were also at or below 200 m (Figure 3b).
The two top-ranked models, with Akaike weights (wi) = 0.30 and 0.22, respectively, included distance and angle or only distance as important factors that influenced the performance of all three radars (Table 1). Two other models were <2 ΔAICc units of the top model. All four of the models included distance as an important factor (Table 2). As the distance of the red-tailed hawk from the radar units increased, the percentage of successful tracking events by the three radars decreased (Table 2; Figure 4).

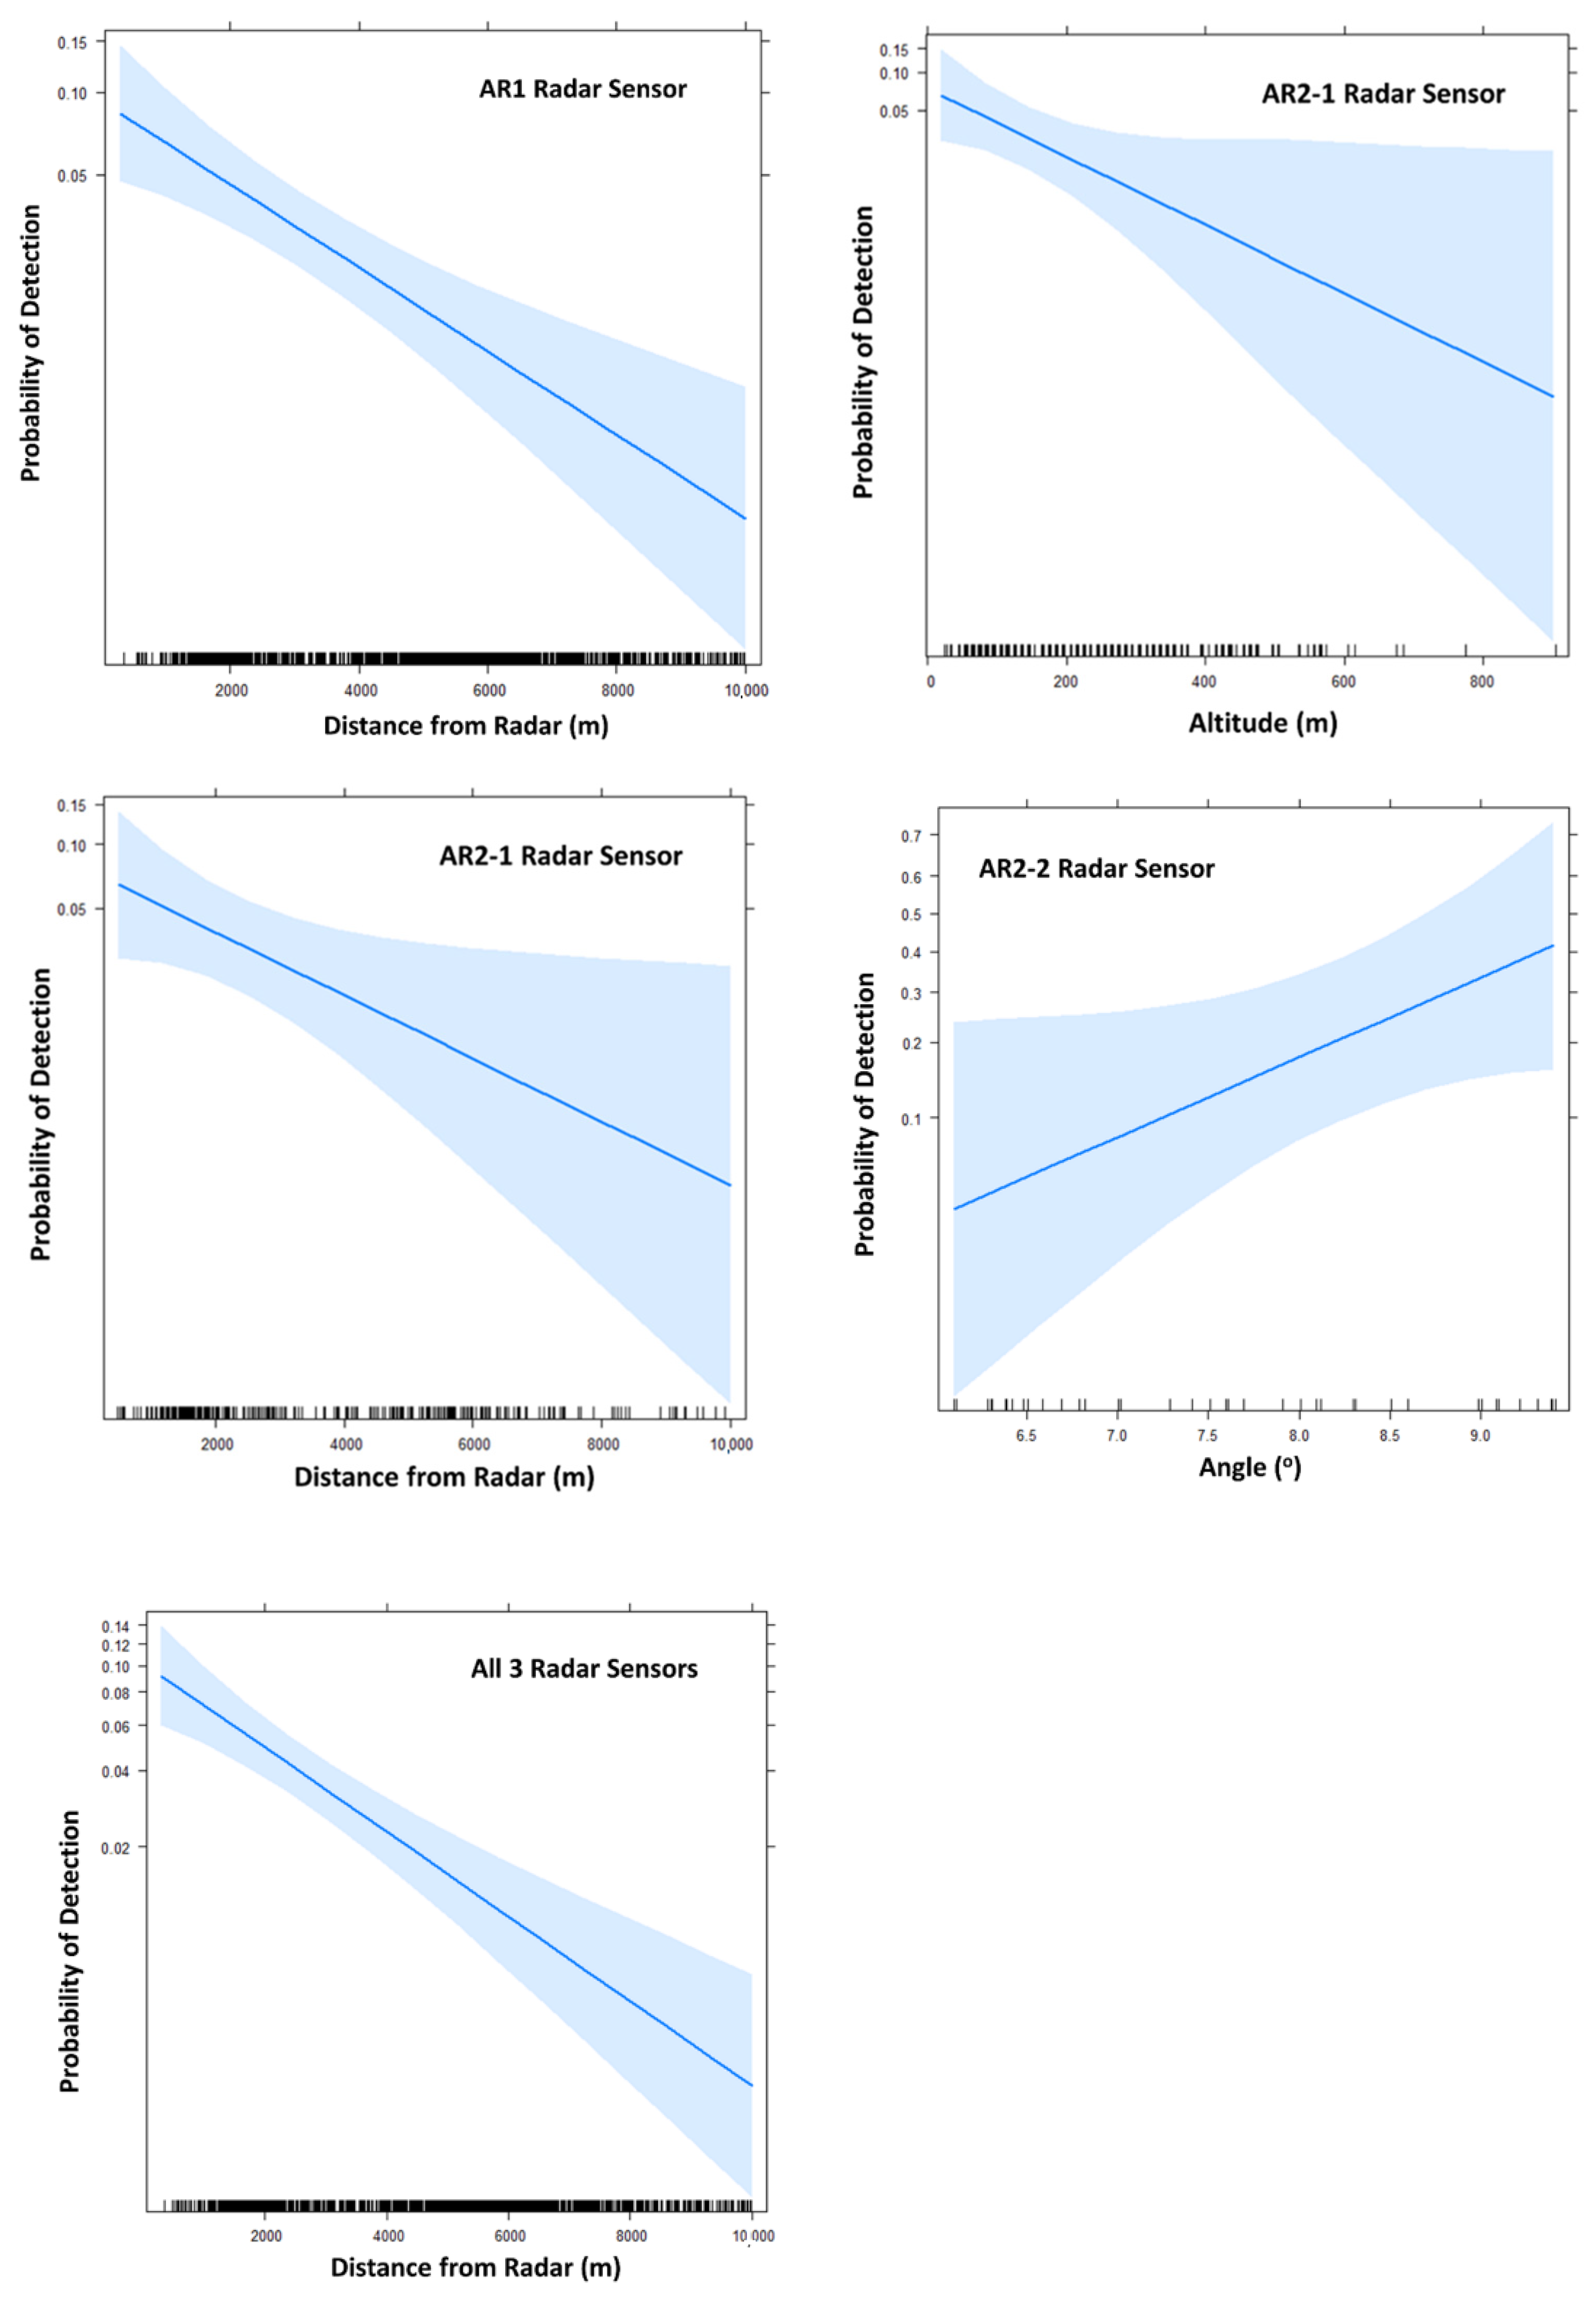
3.2. Performance of the AR1 Radar

The AR1 radar had parabolic dish antennae set at 2° above the horizon. Of the 1643 red-tailed hawk locations that should have been visible to this radar sensor, 36 of these locations were tracked by the AR1 unit (2.2%). The top-ranked model, with a wi of 0.30, included distance and angle as the important factors that influenced the performance of the AR1 radar (Table 1). Two other models (one that included distance and altitude and one that included only distance) were <2 ΔAICc units of the top model. As the distance of the red-tailed hawk from the AR1 unit increased, the percentage of successful tracking events decreased (Table 2; Figure 4).

3.3. Performance of the AR2-1 Radar

The AR2-1 radar had parabolic dish antennae set at 4° above the horizon. Of the 292 red-tailed hawk locations that should have been visible to this radar sensor, nine of these locations were tracked by the AR2-1 unit (3.1%). The top-ranked model with Akaike weight (wi) = 0.23 included altitude as the only important factor that influenced the performance of the AR2-1 radar (Table 1). The nearest competing model, with a wi of 0.17, included distance as the only important factor. Two other models (one that included distance and altitude and one that included altitude and angle) were <2 ΔAICc units of the top model. As the distance of the red-tailed hawk from the AR2-1 unit increased, the percentage of successful tracking events by the three radars decreased (Table 2; Figure 4). Moreover, as the flight altitude of the red-tailed hawk increased, the percentage of successful tracking events decreased (Table 2; Figure 4)

3.4. Performance of the AR2-2 Radar

The AR2-2 radar had parabolic dish antennae set at 8° above the horizon. Of the 43 red-tailed hawk locations visible to this radar sensor, seven of these locations were tracked by the AR2-2 unit (16.7%). The top-ranked model, with a wi of 0.24, included angle as the only important factor that influenced the performance of the AR2-2 radar (Table 1). The nearest competing model, with a wi of 0.2 and within <1.5 ΔAICc units of the top-ranked model, included angle and temperature. As the angle associated with the AR2-2 radar increased (i.e., as the bird drew closer to the high edge of the radar beam), the proportion of successful tracking events increased (Table 2; Figure 4).

4. Discussion

Red-tailed hawks are one of the most abundant raptors in North America [47], and their relatively large body mass (average of ~1.1 kg [41]) makes them a high risk for damaging hawk-aircraft collisions [48,49,50]. From 1990 to 2020, red-tailed hawks accounted for over $42.9 million USD in reported costs, 22,755 h of aircraft downtime, and were involved in 446 collisions with civilian aircraft that resulted in damage in the USA [51]. In addition, the relatively large body mass of these birds should increase the ability of radar systems to detect them due to their relatively larger radar cross-section [25,52,53].
Overall, the synchronization rate for red-tailed hawks was lower than we had expected based on the findings of other studies that involved avian radars and used visual sampling techniques [28,29,34,35]. One study evaluated the ability of a commercially available S-band radar with an array antenna (i.e., Merlin Aircraft Birdstrike Avoidance Radar™, DeTect, Inc., Panama City, FL, USA) to track avian targets near an airport [28]. These researchers reported that the avian radar detected and tracked red-tailed hawks 49% of the time these birds transited through their observation area. Another study that used the same three radar systems and location as this study found that approximately 16% of the red-tailed hawks observed during their study were detected and tracked by one or more radars [29].
Very few published studies have investigated the ability of radar to detect avian targets and what factors may influence target tracking. We found evidence that the distance an individual hawk is from the radar unit has some influence on whether or not the radar sensor tracks that bird, a finding that is consistent with other radar validation studies. A previous study found that the AR1 radar sensor lost efficacy when a bird was ≥4 km from the radar, whereas the efficacy of the AR2-1 and AR2-2 radar sensors declined when birds were only ≥2 km from the radar [29]. Another study reported the efficacy of the radar system they evaluated decreased considerably when birds were more than 3.7 km from the radar. Similarly, in their evaluation of a different radar system (i.e., Merlin Aircraft Birdstrike Avoidance Radar™) in a marine environment, a third study [35] reported its operational range for single waterbirds was 1.5 km from the radar unit. We found similar results related to distance limitations of the three radar systems during this study.
The other factors we evaluated (i.e., target altitude, angle, and air temperature) had limited or no influence on the performance of the avian radars. Only the AR2-1 radar sensor’s performance was related to the flight altitude of the hawks. Contrary to our expectations and the findings of a previous study [29], the ability of the AR2-1 radar to detect and track the hawks actually decreased with increasing bird altitude, although the AR2-2 radar was more effective when the hawks were in the upper portions of the radar beam relative to the lower portions of the same radar beam. We suspect challenges with ground clutter are considerable within the environment at our study location [25,29], and perhaps this factor was more problematic in the lower parts of the AR2-2 radar beam.
Our study is the first effort (that we are aware of) to examine the efficacy of three different radar sensors for tracking individual birds that are simultaneously being tracked using satellite telemetry. We found that the AR2-2 radar (set at the highest level above the horizon) performed over six times as well as the other two radar sensors within the conditions of our evaluation, although only 2% of the total red-tailed hawk locations occurred within the beam of the AR2-2 radar sensor. Ground clutter might be an important negative influence and thus could have resulted in the overall poor radar performance in detecting and tracking red-tailed hawks in our study.
Red-tailed hawks are typically solitary when in flight, although their migratory periods in spring and fall would be a notable exception [41]. Consequently, the findings from our study are applicable to other bird species that are also solitary flyers. Other radar validation studies suggest that flocks of birds are more often detected and tracked by radars than birds that typically fly individually [28,54,55,56]. Our approach to evaluating radar performance could be applied to such situations by tagging one or more individuals within a flock of birds that consistently move as a group e.g., Canada geese (Branta canadensis); [11,12], individual telemetry locations would be representative of the bird flock’s location and thus might be synchronized with radar detections and tracks.
In this study, we found relatively low synchronization rates between two independent remote sensing technology-based sources of data regarding the presence of red-tailed hawk flight patterns and airspace use at ORD. However, the performance of these radar systems might be higher when considering other large-bodied birds that pose a risk to safe aircraft operations at ORD and other airports.
Remote sensing technologies, including both satellite telemetry and avian radar systems, would appear to have a potential role in quantifying spatial and temporal patterns of birds within airport environments. We foresee the need for considerable future research and scientific evaluations of these technologies to allow for a clear understanding of how these tools can be most effectively and appropriately used. Ultimately, these technologies could provide wildlife managers with the situation-specific information necessary to most effectively deploy integrated wildlife damage management programs that use a variety of non-lethal and lethal tools to reduce the risk of bird-aircraft collisions (or solve other human-wildlife conflict challenges).
We encourage future studies and other well-designed evaluations of these radar systems—as well as other commercially available avian radars—in a variety of physical environments (e.g., coastal locations, mountainous areas, highly urbanized environments) are essential for providing ecologists with a full understanding of the advantages and limitations of using avian radar systems to quantify bird movements [57]. Although the performance of avian radar systems will be highly system-, setting-, site, and bird species-specific, the methodology we present here will enable efforts to be replicated at other locations (e.g., airports, wind energy facilities) and with other avian radar systems. We encourage other ecologists interested in using avian radar systems to gain ornithological knowledge to evaluate radar performance using the methodology we developed, in addition to other validation techniques.

Author Contributions

Conceptualization, B.E.W., S.F.B. and C.K.P.; methodology, B.E.W. and C.K.P.; software, D.M. and S.M.; validation, B.E.W., D.M. and S.M.; formal analysis, B.E.W. and C.K.P.; writing—original draft preparation, B.E.W.; writing—review and editing, S.F.B., T.L.G. and C.K.P.; project administration, T.L.G.; funding acquisition, S.F.B. All authors have read and agreed to the published version of the manuscript.

Funding

This research was funding by the Federal Aviation Administration (FAA), the City of Chicago (Chicago’s O’Hare International Airport), and the University of Illinois at Urbana-Champaign. This research was supported [in part] by the intramural research program of the U.S. Department of Agriculture, Wildlife Services.

Data Availability Statement

All of the data for this study are archived at the U.S. Department of Agriculture’s Wildlife Services National Wildlife Research Center.

Acknowledgments

Opinions expressed in this manuscript do not necessarily reflect current FAA policy decisions governing the control of wildlife on or near airports. We are grateful to G. Martinelli, M. Rice, A. Spencer, R. Swearingin, and J. Wisdom for assistance in the field.

Conflicts of Interest

The authors declare no conflict of interest.

References

  1. Diehl, R.H. The airspace is habitat. Trends Ecol. Evol. 2013, 28, 377–379. [Google Scholar] [CrossRef] [PubMed]
  2. Womack, A.M.; Bohannan, B.J.M.; Green, J.L. Biodiversity and biogeography of the atmosphere. Philos. Trans. R. Soc. B Biol. Sci. 2010, 365, 3645–3653. [Google Scholar] [CrossRef] [PubMed] [Green Version]
  3. Lambertucci, S.A.; Shepard, E.L.C.; Wilson, R.P. Human-wildlife conflicts in a crowded airspace. Science 2015, 348, 502–504. [Google Scholar] [CrossRef] [PubMed]
  4. Davy, C.M.; Ford, A.T.; Fraser, K.C. Aeroconservation for the fragmented skies. Conserv. Lett. 2017, 10, 773–780. [Google Scholar] [CrossRef]
  5. Kunz, T.H.; Gauthreaux, S.A., Jr.; Hristov, N.I.; Horn, J.W.; Jones, G.; Kalko, E.K.V.; Larkin, R.P.; McCracken, G.F.; Swartz, S.M.; Srygley, R.B.; et al. Aeroecology: Probing and modeling the aerospace. Integr. Comp. Biol. 2008, 48, 1–11. [Google Scholar] [CrossRef] [Green Version]
  6. Fancy, S.G.; Pank, L.F.; Whitten, K.R.; Regelin, W.L. Seasonal movements of caribou in arctic Alaska as determined by satellite. Can. J. Zool. 1989, 67, 644–650. [Google Scholar] [CrossRef] [Green Version]
  7. Jouventin, P.; Weimerskirsch, H. Satellite tracking of wandering albatross. Nature 1990, 343, 746–748. [Google Scholar] [CrossRef]
  8. Andrews, R.D.; Pitman, R.L.; Ballance, L.T. Satellite tracking reveals distinct movement patterns of Type B and Type C killer whales in the southern Ross Sea, Antarctica. Polar Biol. 2008, 31, 1461–1468. [Google Scholar] [CrossRef]
  9. Martell, M.S.; Bierregaard, R.O., Jr.; Washburn, B.E.; Elliott, J.E.; Henny, C.J.; Kennedy, R.; MacLeod, I. The spring migration of adult North American Ospreys. J. Raptor Res. 2014, 48, 309–324. [Google Scholar] [CrossRef] [Green Version]
  10. Washburn, B.E.; Martell, M.S.; Bierregaard, R.O., Jr.; Henny, C.J.; Dorr, B.S.; Olexa, T.J. Wintering ecology of adult North American Ospreys. J. Raptor Res. 2014, 48, 325–333. [Google Scholar] [CrossRef] [Green Version]
  11. Rutledge, M.E.; Moorman, C.E.; Washburn, B.E.; DePerno, C.S. Analyzing resident Canada goose movements to reduce the risk of goose-aircraft collisions at suburban airports. J. Wildl. Manag. 2015, 79, 1185–1191. [Google Scholar] [CrossRef] [Green Version]
  12. Dorak, B.E.; Ward, M.P.; Eichholz, M.W.; Washburn, B.E.; Lyons, T.P.; Hagy, H.M. Survival and habitat selection of Canada geese during autumn and winter in metropolitan Chicago, USA. Condor Ornithol. Appl. 2017, 119, 787–799. [Google Scholar] [CrossRef] [Green Version]
  13. Holland, A.E.; Byrne, M.E.; Bryan, A.L.; DeVault, T.L.; Rhoades, O.E., Jr.; Beasley, J.C. Fine-scale assessment of home ranges and activity patterns for resident black vultures (Coragyps airatus) and turkey vultures (Cathartes aura). PLoS ONE 2017, 12, e0179819. [Google Scholar] [CrossRef] [PubMed]
  14. Lack, D.; Varley, G.C. Detection of birds by radar. Nature 1945, 156, 446. [Google Scholar] [CrossRef]
  15. Eastwood, E. Radar Ornithology; Meuthuen Press: London, UK, 1967.
  16. Cooper, B.A.; Day, R.H.; Ritchie, R.J.; Cranor, C.L. An improved marine radar system for studies of bird migration. J. Field Ornithol. 1991, 62, 367–377. [Google Scholar]
  17. Deng, J.; Frederick, P. Nocturnal flight behavior of waterbirds in close proximity to a transmission power line in the Florida Everglades. Waterbirds 2001, 24, 419–424. [Google Scholar] [CrossRef]
  18. Hamer, T.E.; Cooper, B.A.; Ralph, C.J. Use of radar to study the movements of Marbled Murrelets at inland sites. Northwest. Nat. 1995, 76, 73–78. [Google Scholar] [CrossRef]
  19. Bertram, D.F.; Cowen, L.; Burger, A.E. Use of radar for monitoring colonial burrow-nesting seabirds. J. Field Ornithol. 1999, 70, 145–157. [Google Scholar]
  20. Gauthreaux, S.A., Jr.; Schmidt, P.M. Application of radar technology to monitor hazardous birds at airports. In Wildlife in Airport Environments: Preventing Animal–Aircraft Collisions through Science-Based Management; DeVault, T.L., Blackwell, B.F., Belant, J.L., Eds.; Johns Hopkins University Press: Baltimore, MD, USA, 2013; pp. 141–151. [Google Scholar]
  21. Beason, R.C.; Nohara, T.J.; Weber, P. Beware the Boojum: Caveats and strengths of avian radar. Hum.-Wildl. Interact. 2013, 7, 16–46. [Google Scholar]
  22. Harmata, A.R.; Podruzny, K.M.; Zelenak, J.L.; Morrison, M.L. Using marine surveillance radar to study bird movements and impact assessment. Wildl. Soc. Bull. 1999, 24, 44–52. [Google Scholar]
  23. Desholm, M.; Kahler, J. Avian collision risk at an offshore wind farm. Biol. Lett. 2005, 1, 296–298. [Google Scholar] [CrossRef] [PubMed]
  24. Krijgsveld, K.L.; Akershock, K.; Schenk, F.; Djik, F.; Dirksen, S. Collision risk of birds with modern large wind turbines. Ardea 2009, 97, 357–366. [Google Scholar] [CrossRef]
  25. May, R.; Steinheim, Y.; Kvaløy, R.; Vang, R.; Hannssen, F. Performance test of an off-the-shelf automated radar tracking system. Ecol. Evol. 2017, 7, 5930–5938. [Google Scholar] [CrossRef] [PubMed]
  26. van Belle, J.V.; Shamoun-Baranes, J.; Loon, E.V.; Bouten, W. An operational model predicting autumn bird migration intensities for flight safety. J. Appl. Ecol. 2007, 44, 864–874. [Google Scholar] [CrossRef]
  27. Coates, P.S.; Casazza, M.L.; Halstead, B.J.; Fleskes, J.P.; Laughlin, J.A. Using avian radar to examine relationships among avian activity, bird strikes, and meteorological factors. Hum.-Wildl. Interact. 2011, 5, 249–268. [Google Scholar]
  28. Gerringer, M.B.; Lima, S.L.; DeVault, T.L. Evaluation of an avian radar system in a Midwestern landscape. Wildl. Soc. Bull. 2016, 40, 150–159. [Google Scholar] [CrossRef] [Green Version]
  29. Phillips, A.C.; Majumdar, S.; Washburn, B.E.; Mayer, D.; Swearingin, R.; Herricks, E.; Guerrant, T.L.; Beckerman, S.F.; Pullins, C.K. Efficacy of avian radar systems for tracking birds on the airfield of a large international airport. Wildl. Soc. Bull. 2018, 42, 476–477. [Google Scholar] [CrossRef] [Green Version]
  30. Robinson, W.D.; Bowlin, M.S.; Bisson, I.; Shamoun-Barnes, J.; Thorup, K.; Diehl, R.H.; Kunz, T.H.; Mabey, S.; Winkler, D.W. Integrating concepts and technologies to advance the study of bird migration. Front. Ecol. Environ. 2010, 8, 354–361. [Google Scholar] [CrossRef] [Green Version]
  31. Bridge, E.S.; Thorup, K.; Bowlin, M.S.; Chilson, P.B.; Diehl, R.H.; Fleron, R.W.; Harti, P.; Kays, R.; Kelly, J.F.; Robinson, W.D.; et al. Technology on the move: Recent and forthcoming innovations for tracking migratory birds. Bioscience 2011, 61, 698. [Google Scholar] [CrossRef] [Green Version]
  32. Nilsson, C.; Dokter, A.; Schmid, B.; Scacco, M.; Verlinden, L.; Bäckman, J.; Haase, G.; Dell’Omo, G.; Chapman, J.W.; Leijnse, H.; et al. Field validation of radar systems for monitoring bird migration. J. Appl. Ecol. 2018, 55, 2552–2564. [Google Scholar] [CrossRef]
  33. Beason, R.C.; Humphrey, J.S.; Meyers, N.E.; Avery, M.L. Synchronous monitoring of vulture movements with satellite telemetry and avian radar. J. Zool. 2010, 282, 157–162. [Google Scholar] [CrossRef] [Green Version]
  34. Brand, M.; Key, G.; Herricks, E.; King, R.; Nohara, J.T.; Gauthreaux, S., Jr.; Begier, M.; Bowser, C.; Beason, R.; Swift, J.; et al. Integration and Validation of Avian Radars (IVAR). Environmental Security Technology Certification Program Final Report for Project SI–2000723; SPAWAR Systems Center-Pacific: San Diego, CA, USA, 2011. [Google Scholar]
  35. Dokter, A.M.; Baptist, M.J.; Ens, B.J.; Krijgsveld, K.L.; van Loon, E. Bird radar validation in the field by time-referenced line-transect surveys. PLoS ONE 2013, 8, e74129. [Google Scholar] [CrossRef] [PubMed]
  36. Chicago Department of Aviation. Chicago O’Hare International Airport Wildlife Hazard Management Plan; City of Chicago, Department of Aviation, Chicago O’Hare International Airport: Chicago, IL, USA, 2014.
  37. McMillen, D.P. Airport expansions and property values: The case of Chicago’s O’Hare Airport. J. Urban Econ. 2004, 55, 627–640. [Google Scholar] [CrossRef]
  38. Airports Council International. Passenger Traffic 2010 Final; Airports Council International: Montréal, QC, Canada, 2011; Available online: http://www.aci.aero/Data’Centre/Annual-Traffic-Data/Passengers/2010-final (accessed on 2 April 2018).
  39. Calsyn, D.E.; Reinhardt, L.P.; Ryan, K.A.; Wollenweber, J.L. Soil Survey of Cook County, Illinois; U.S. Department of Agriculture, Natural Resources Conservation Service: Washington, DC, USA, 2012.
  40. Bloom, P.H.; Clark, W.S.; Kidd, J.W. Capture techniques. In Raptor Research and Management Techniques; Bird, D.M., Bildstein, K.L., Eds.; Hancock House Publishers: Blaine, WA, USA, 2007; pp. 221–236. [Google Scholar]
  41. Preston, C.R.; Beane, R.D. Account 52: Red-tailed hawk (Buteo jamaicensis). In The Birds of North America; Poole, A., Gill, F., Eds.; The Academy of Natural Sciences: Philadelphia, PA, USA; The American Ornithologists’ Union: Washington, DC, USA, 2009.jamaicensis). In The Birds of North America; Poole, A., Gill, F., Eds.; The American Ornithologists’ Union: Washington, DC, USA; The Academy of Natural Sciences: Philadelphia, PA, USA, 2009. [Google Scholar]
  42. R Core Team. R: A Language and Environment for Statistical Computing; R Foundation for Statistical Computing: Vienna, Austria, 2015; Available online: http://www.R-project.org/ (accessed on 8 March 2021).
  43. Burnham, K.P.; Anderson, D.R. Model Selection and Multimodel Inference: A Practical Information-Theoretic Approach, 2nd ed.; Springer: New York, NY, USA, 2002. [Google Scholar]
  44. Mazerolle, M.J. AICcmodaveg: Model Selection and Mulitmodel Inference Based on (Q)AIC(c). R Package Version 2.0-3. 2015. Available online: http://CRAN.R-project.org/package=AICcmodavg/ (accessed on 12 June 2018).
  45. Symonds, M.R.E.; Moussaili, A. A brief guide to model selection, multimodel inference, and model averaging in behavioural ecology using Akaike’s information criterion. Behav. Ecol. Sociobiol. 2011, 65, 13–21. [Google Scholar] [CrossRef]
  46. Fox, J. Effects displays in R for generalized linear models. J. Stat. Softw. 2003, 8, 1–27. [Google Scholar] [CrossRef] [Green Version]
  47. Rosenberg, K.V.; Kennedy, J.A.; Dettmers, R.; Ford, R.P.; Reynolds, D.; Alexander, J.D.; Beardmore, C.J.; Blancher, P.J.; Bogart, R.E.; Butcher, G.S.; et al. Partners in Flight Landbird Conservation Plan: 2016 Revision for Canada and Continental United States; Partners in Flight Science Committee: Washington, DC, USA, 2016. [Google Scholar]
  48. Dolbeer, R.A.; Wright, S.E. Safety management systems: How useful will the FAA National Wildlife Strike Database be? Hum.–Wildl. Confl. 2009, 3, 167–178. [Google Scholar]
  49. DeVault, T.L.; Belant, J.L.; Blackwell, B.F.; Seamans, T.W. Interspecific variation in wildlife hazards to aircraft: Implications for airport wildlife management. Wild. Soc. Bull. 2011, 35, 394–402. [Google Scholar] [CrossRef] [Green Version]
  50. DeVault, T.L.; Blackwell, B.F.; Seamans, T.W.; Begier, M.J.; Kougher, J.D.; Washburn, J.E.; Miller, P.R.; Dolbeer, R.A. Estimating interspecific economic risk of bird strikes with aircraft. Wildl. Soc. Bull. 2018, 42, 94–101. [Google Scholar] [CrossRef] [Green Version]
  51. Dolbeer, R.A.; Begier, M.J.; Miller, P.R.; Weller, J.R.; Anderson, A.L. Wildlife Strikes to Civilian Aircraft in the United States 1990−2020; Federal Aviation Administration, Wildlife Aircraft Strike Database Serial Report Number 27; Department of Transportation, Federal Aviation Administration, Airport Safety: Washington, DC, USA, 2021.
  52. Nohara, T.J.; Beason, R.C.; Weber, P. Using radar cross-section to enhance situational awareness tools for airport avian radars. Hum.-Wildl. Interact. 2011, 5, 210–217. [Google Scholar]
  53. McCann, D.L.; Bell, P.S. Visualizing the aspect-dependent radar cross section of seabirds over a tidal energy test site using a commercial marine radar system. Int. J. Mar. Energy 2017, 17, 56–63. [Google Scholar] [CrossRef]
  54. Desholm, M.; Fox, A.D.; Beasley, P.D.L.; Kahlert, J. Remote techniques for counting and estimating the number of bird-wind turbine collisions at sea: A review. Ibis 2006, 148, 76–89. [Google Scholar] [CrossRef]
  55. Plonczkier, P.; Simms, I.C. Radar monitoring of migrating pink-footed geese: Behavioural responses to offshore wind farm development. J. Appl. Ecol. 2012, 49, 1187–1194. [Google Scholar] [CrossRef]
  56. Urmy, S.S.; Warren, J.D. Quantitative ornithology with a commercial marine radar: Standard-target calibration, target detection and tracking, and measurements of echoes from individuals and flocks. Methods Ecol. Evol. 2017, 8, 800–809. [Google Scholar] [CrossRef] [Green Version]
  57. Stepanian, P.M.; Chilson, P.B.; Kelly, J.F. An introduction to radar image processing in ecology. Methods Ecol. Evol. 2014, 5, 730–738. [Google Scholar] [CrossRef] [Green Version]
Figure 1. Location of the 3 radar sensors (designated by a star) in relation to the airfield at Chicago’s O’Hare International Airport, USA. The circular lines represent an area around the radars with a 10–km radius (denoted in yellow).
Remotesensing 14 02658 g001
Figure 2. Graphical representation of the beam geometry of the AR1, AR2-1, and AR2-2 radar sensors used during a study at Chicago’s O’Hare International Airport, USA, during September 2010–May 2014.
Remotesensing 14 02658 g002
Figure 3. The distribution of the number of red-tailed hawk locations derived from satellite telemetry that were determined to be in the beam of one or more of three radars and were not associated with a radar track (white bars) and well as the number of locations that were associated with a radar track (black bars) with respect to (a) the distance of the hawk from the radars (in km) and (b) the altitude of the hawk (in m) during a study at Chicago’s O’Hare International Airport, USA, from September 2010 to May 2014.
Remotesensing 14 02658 g003
Figure 4. Effects plots for variables found to be important in influencing the performance of the AR1, AR2-1, and AR2-2 radars for red-tailed hawks during a study at Chicago’s O’Hare International Airport, USA, from September 2010 to May 2014. These graphs visualize the partial slope for a given factor when the other predictors are held fixed (represented by the dark blue line). The blue shaded area is a pointwise confidence band for the fitted values, based on standard errors computed from the covariance matrix of the fitted regression coefficients.
Remotesensing 14 02658 g004
Table 1. Top logistic regression models of red-tailed hawk locations among three radar sensors (AR1, AR2-1, and AR2-2), ranked by Akaike’s Information Criterion adjusted for small sample size (AICc), predicting radar track (matching) during a study at Chicago’s O’Hare International Airport from September 2010 to May 2014.
ModelK aLL bAICc c∆AICc dwi eCumulative AICc Weight
AR1 radar
Distance + Angle3–156.72319.460.000.300.30
Distance + Altitude3–157.10320.220.760.210.51
Distance2–158.51321.031.570.140.65
AR2–1 radar
Altitude2–37.4879.000.000.230.23
Distance2–37.7679.560.560.170.40
Altitude + Angle3–37.4480.971.970.090.49
Distance + Altitude3–37.4580.991.990.080.57
AR2–2 radar
Angle2–16.6837.670.000.240.24
Angle + Temperature3–16.2039.031.350.120.36
All radars combined
Distance + Angle3–217.57441.140.000.300.30
Distance2–218.86441.730.580.220.52
Distance + Altitude + Angle4–217.22442.471.320.150.68
Distance + Altitude3–218.50443.001.860.120.80
a No. parameters in model. b LL, log likelihood. c Akaike’s Information Criterion adjusted for small sample sizes. d Difference in AICc compared with lowest AICc model. e Model weight.
Table 2. Model-averaged parameter estimates with unconditional standard errors (SE) and 95% confidence intervals (LCL, UCL) for radar track (matching) during a study at Chicago’s O’Hare International Airport from September 2010 to May 2014.
ParameterEstimateSELCLUCL
AR1 radar unit
Intercept–1.560.70–2.93–0.19
Distance<–0.001<0.001<–0.001<–0.001
AR2–1 radar unit
Intercept–2.160.62–3.70–0.62
Distance<–0.001<0.001<–0.001<–0.001
Altitude–0.010.01–0.020.00
AR2–2 radar unit
Intercept–7.543.41–14.22–0.86
Angle0.850.53–0.191.90
All radars combined
Intercept–2.120.27–3.14–1.10
Distance<–0.001<0.001<–0.001<–0.001
Publisher’s Note: MDPI stays neutral with regard to jurisdictional claims in published maps and institutional affiliations.

