Article

Evolution Analysis of Ecological Networks Based on Spatial Distribution Data of Land Use Types Monitored by Remote Sensing in Wuhan Urban Agglomeration, China, from 2000 to 2020

1
School of Resource and Environmental Sciences, Wuhan University, Wuhan 430079, China
2
Key Laboratory of Geographic Information System, Ministry of Education, Wuhan University, Wuhan 430079, China
3
Collaborative Innovation Center for Geospatial Information Technology, Wuhan University, Wuhan 430079, China
*
Author to whom correspondence should be addressed.
Remote Sens. 2022, 14(11), 2618; https://doi.org/10.3390/rs14112618
Submission received: 10 April 2022 / Revised: 26 May 2022 / Accepted: 28 May 2022 / Published: 30 May 2022
(This article belongs to the Special Issue Landscape Ecology in Remote Sensing)

Abstract

:
Construction and protection of ecological networks (ENs) is considered to be an effective means to curb habitat fragmentation and strengthen landscape connectivity. In this study, a complete evaluation framework of ENs based on “quality–function–structure” was proposed to support the formulation of protection strategies for ENs. First, we built the ENs of Wuhan urban agglomeration (WUA) from 2000 to 2020 based on the advantages of circuit theory and remote sensing data of land use monitoring. The results showed that land development activities are an important driving force for the temporal and spatial evolution of global ENs. Forest fragmentation, transitional urban expansion, and agricultural reclamation were important inducements for the shrinkage of ecological sources. They may also increase the resistance of species migration, which will lead to qualitative change and even fracture of ecological corridors. Second, circuit theory, centrality index, and complex network theory were applied to evaluate the quality defects, functional connectivity, and topology characteristics of ENs in WUA, respectively, from 2000 to 2020. The results showed that the antagonism between ecological corridors and land development activities led to ecological quality defects (ecological barriers and pinchpoints). Different land development models had differential effects on centrality indexes. Moreover, the main trunk in the northern Dabie Mountains and the southern Mufu mountains was developed, while the secondary trunks were abundant in the middle of WUA. Finally, we proposed protection strategies for ENs based on the coupling of the “quality–function–structure” of WUA in 2020. It is suggested that all ecological sources must be included in nature reserves to prevent natural or manmade erosion. The key areas to be repaired were determined through the quality evaluation of ecological corridors. The priority of construction and protection of ecological corridors was determined by coupling two topological structures and functions. We argue that specific protection strategies and directions can be determined according to the construction objectives of local ENs.

Graphical Abstract

1. Introduction

In the past decades, rapid urbanization and agricultural expansion have changed the structure and function of ecosystems more dramatically than ever [1]. High-intensity human activities lead to habitat erosion and fragmentation, which is considered to be the main driving force of biodiversity loss and ecosystem degradation [2,3]. According to the theory of island biogeography, habitat fragmentation is a process in which large-scale species groups are divided into multiple ecological isolated islands [4], which may hinder material circulation, energy flow, and information transmission. Habitat fragmentation restricts the continuity and integrity of ecosystems, which in turn poses great threats to ecosystem services and human well-being. The construction of ecological networks (ENs) is a process of connecting broken habitats with ecological corridors and closely connecting them into a network system [5,6]. Therefore, the protection for ENs is considered to be an effective means to curb habitat fragmentation and protect biodiversity.
In early studies, ENs were defined as a group of ecosystems with similar types, which are connected into a spatially coherent system through a biological flow [7]. ENs derived from biodiversity conservation have been gradually recognized as an implementation tool for nature conservation planning [7,8]. In the 1990s, urban greenways similar to ENs were defined as linear open spaces connecting nature reserves, recreational parks, and cultural landscapes [9,10,11]. Currently, the greenway is still widely used in ecological planning and construction as an entity EN that takes into account the functions of nature protection, aesthetics, recreation, and culture. For decades, the research and practice of ENs have gradually expanded from the initial biodiversity protection and urban greenway to green infrastructure [12,13], ecological security pattern [14,15], and so on. In recent years, with the introduction of landscape ecology theory, the concept and method of ecological security pattern have gradually become the mainstream of ENs research. Moreover, the basic research paradigm of “identification of ecological source-construction of ecological resistance surface-extraction of ecological corridor” has been formed [16,17]. Although the connotation of ENs in relevant studies in different periods had different emphases, most of them emphasized the natural process and characteristics and paid attention to the protection of landscape connectivity and ecological services.
Currently, EN research can be roughly divided into construction and evaluation. In the construction of ENs, the above-mentioned basic paradigm is widely used in the extraction of ENs. According to this research paradigm, the basic elements of ENs are composed of ecological sources and ecological corridors [5], namely, ecological nodes and edges. Ecological sources are habitat patches of great significance for maintaining the integrity, connectivity, and stability of ecosystems [18]. Generally, ecological sources can be determined according to the spatial distribution of focus species [19,20]. However, the distribution data of focus species are often difficult to obtain, and the screening of ecological sources based on land cover types has become an acceptable alternative method [21,22]. In recent years, morphological spatial pattern analysis (MSPA) has also been widely used because it can determine the ecological sources that play an important role in landscape connection from the grid scale [23,24]. Ecological resistance surface is considered as the cost of species migration between ecological sources, reflecting the potential trend of species movement [16,17]. In some previous studies, ecological resistance surface is determined according to the subjective assignment of habitat types, which has strong subjectivity and poor accuracy. Some scholars also introduced the habitat quality corrected by NDVI and night light index as the ecological resistance surface [25]. An ecological corridor is a narrow and long strip channel for species migration between ecological sources [16]. The minimum cumulative resistance model (MCR) is a recognition method of minimum-cost corridor considering landscape heterogeneity and connectivity, which has high operability [26]. Although the MCR model can identify the optimal path and direction of species migration, it ignores the characteristics of random walk of species and cannot determine the spatial scope of ecological corridors [25]. The application of circuit theory derived from physics effectively makes up for these defects and is gradually used in the identification of ecological corridors. According to the circuit theory, the direction of ecological corridors is determined by simulating the random walk of biological flow, and the range of ecological corridors is determined by the cumulative resistance threshold of current [27,28].
The research of EN evaluation mainly involves quality, function, and structure. The quality evaluation of ENs focuses on the ecological attributes of ecological sources and corridors, such as ecological sensitivity [29], ecological abundance [30], landscape pattern index [31], landscape components [32], etc. Moreover, with the introduction of circuit theory, barriers and pinchpoints that hinder ecological flow can also be identified and used to detect the quality defects of ENs [33,34]. The core function of ENs is to connect long-distance habitat patches. Therefore, landscape connectivity indexes such as circularity (α), node corridor ratio (β), and connectivity (γ) [6,35] are widely used in the functional evaluation of ENs. However, the above indexes are mainly global indexes, which cannot evaluate the importance of local ENs to the overall connectivity. Currently, the structural evaluation of ENs includes self-structure and external structure according to the evaluation object. In terms of the self-structure of ENs, some scholars believe that extremely long corridors are vulnerable to external erosion, and suggest appropriately increasing ecological sources as stepping stones for species migration [36,37]. In terms of the external structure of ENs, the blind areas with sparse distribution of ENs have gradually attracted the attention of some scholars [38,39]. Essentially, these structural evaluation methods are still the maintenance and strengthening of EN connectivity, but they often ignore the topological features that are extremely important to the stability of ENs. With the development of graph theory, minimum spanning tree [40,41] and community detection [42,43] are gradually applied to explore the structural characteristics of complex network systems. Referring to the structural analysis of complex networks, it will make the structural exploration and hierarchical protection of ENs possible.
In summary, the research on the construction of ENs has been relatively abundant, but there are still the following defects in the evaluation. First, existing studies of ENs often focus on the evaluation from a single perspective [29,31,32], which lacks a comprehensive evaluation framework. Second, the evaluation of functional connectivity for ENs is usually limited to global indicators [6,35] and pays less attention to targeted local indicators. Meanwhile, the existing structural evaluation of ENs often ignores the topological characteristics. Finally, there has always been a large knowledge gap between the evaluation and protection strategies of ENs. Therefore, the general objective of our study is to achieve the evaluation and protection of ENs. The specific objectives are to solve the following scientific issues. (1) How to effectively and comprehensively evaluate the evolution characteristics of ENs? (2) How to combine ecological attributes and topology for the characteristic evaluation of ENs? (3) How to formulate corresponding protection strategies according to the evaluation of ENs?
To achieve the above objectives, the following contributions have been made in this study, which are also innovations of this study. (1) First, a complete evaluation framework of ENs based on “quality–function–structure” was proposed to analyze the evolution characteristics of ENs in WUA. (2) Circuit theory [27,28], centrality index [44], and complex network theory [45] were, respectively, applied to identify the quality defects, evaluate the local functional connectivity, and explore the topology of ENs. (3) The evaluation framework was committed to supporting the formulation of protection strategies for ENs.

2. Materials and Methods

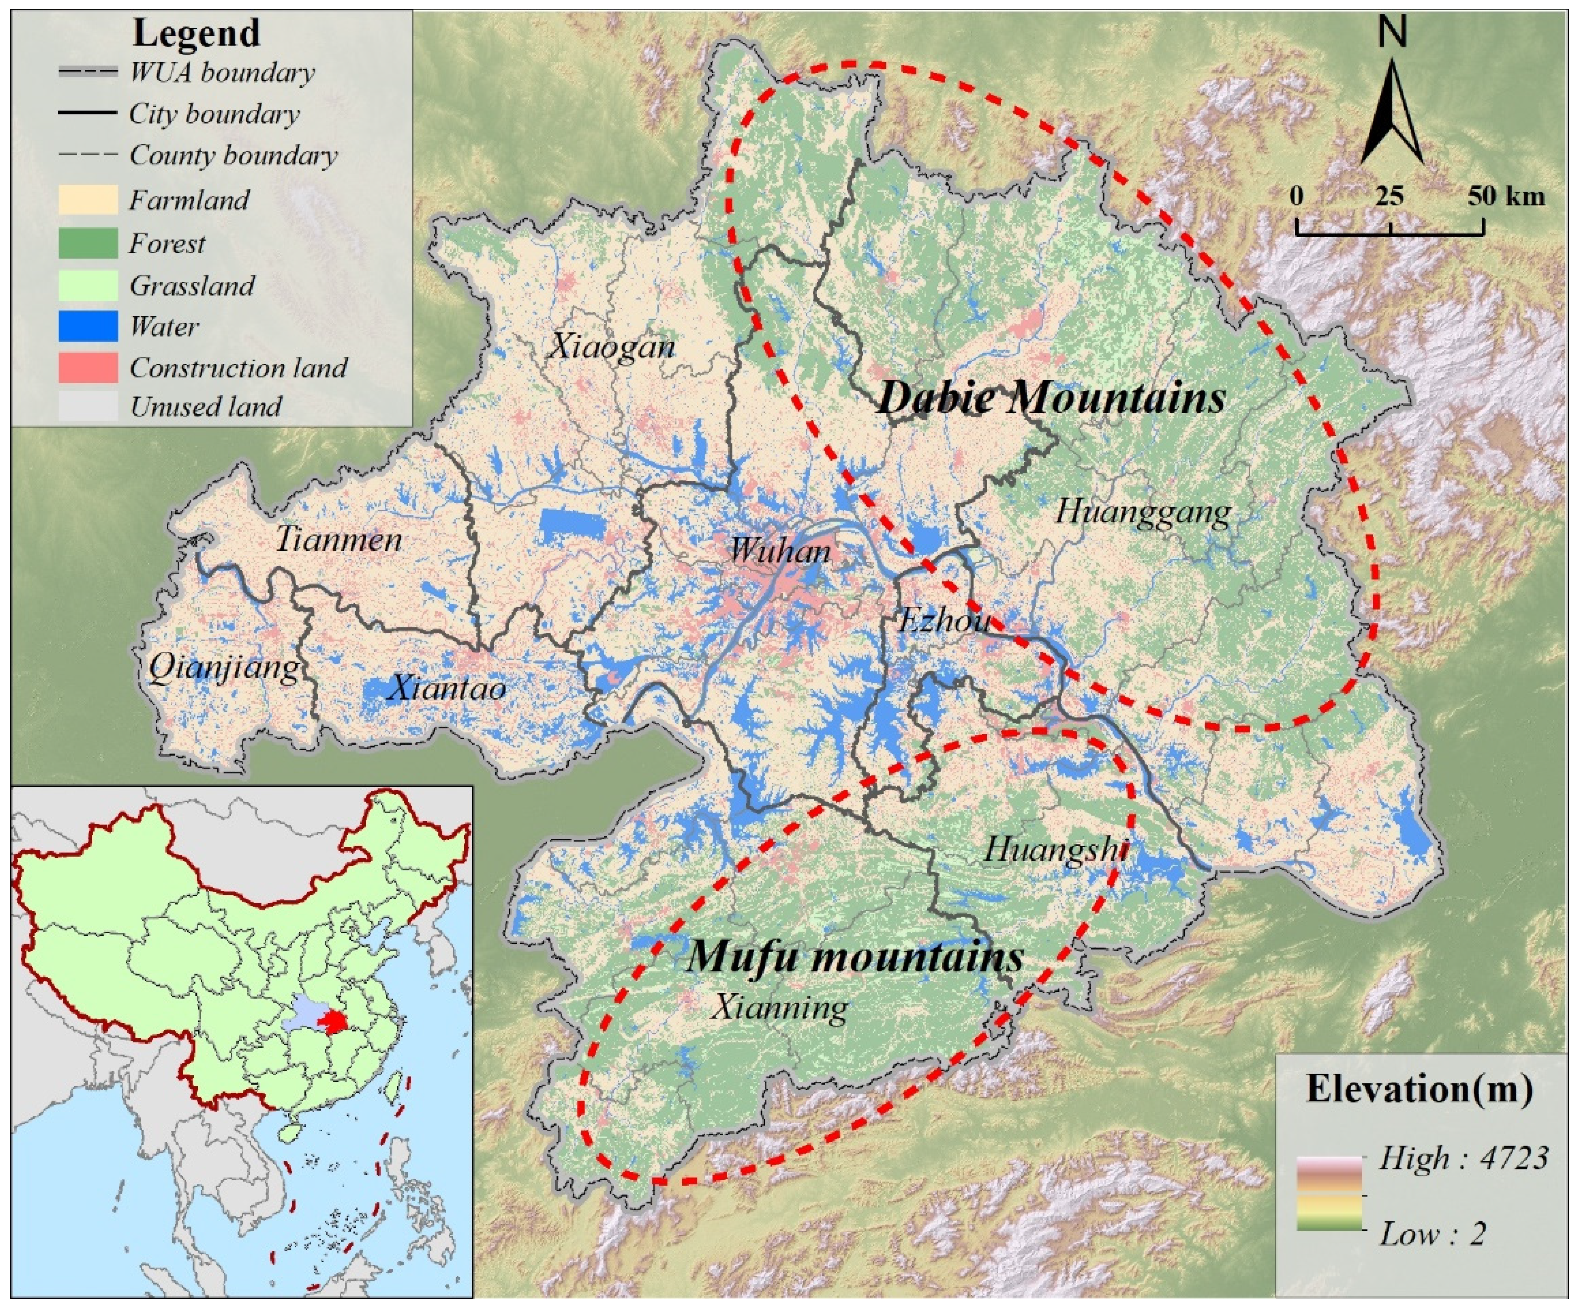
2.1. Study Area and Data Sources

Wuhan urban agglomeration (WUA) is located in the middle reaches of the Yangtze River, which is an urban consortium composed of Wuhan, Huangshi, Ezhou, Xiaogan, Huanggang, Xianning, Xiantao, Tianmen, and Qianjiang (Figure 1). WUA is not only the core area of economic development in Hubei Province but also an important strategic fulcrum for the rise of central China. WUA covers approximately 57,909 square kilometers, of which ecological land (forest, grassland, water, wetland, etc.) [46] accounts for 43%. The vast virgin forests in the northern Dabie Mountains and the southern Mufu mountains provide large-scale habitats and potential corridors for species migration. However, the rapid advancement of urbanization and industrialization has led to the erosion of species habitats by the sprawl of construction lands, and the phenomenon of ecological islets has gradually emerged. Therefore, it is necessary to explore the structural and functional evolution of ENs in WUA, which aims to guide the protection of biodiversity and ecological integrity [47,48].
The multi-source spatial data applied in this study mainly include (1) spatial distribution data of land use types monitored by remote sensing (LUTRS) in 2000, 2010, and 2020, obtained from Resources and Environment Science and Data Center (https://www.resdc.cn/Datalist1.aspx?FieldTyepID=1,3, accessed on 2 March 2022). The dataset was generated through man–machine interactive interpretation based on Landsat TM and Landsat OLI images of the United States, with an initial spatial resolution of 30 m. According to the attributes of land resources, land use types are categorized into farmland, forest, grassland, water, construction land, and unused land; (2) Landsat8 OLI images obtained on February 18 and 29 April 2020, with row and column numbers of 122/39, 123/39, respectively (https://www.gscloud.cn/search, accessed on 5 April 2022); (3) administrative division data of WUA extracted from the land survey project of Natural Resources Department of Hubei Province; (4) digital elevation model (DEM) data obtained from Geospatial Data Cloud (https://www.gscloud.cn/search, accessed on 2 March 2022); (5) normalized difference vegetation index (NDVI) dataset of WUA in 2000, 2010, and 2020 extracted from MODIS/Terra Vegetation Indices 16-Day L3 Global 250 m SIN Grid (MOD13Q1), which was downloaded from LAADS DAAC of NASA (https://ladsweb.modaps.eosdis.nasa.gov/search/order/1/MOD13Q1--6, accessed on 2 March 2022). It should be noted that all raster data were resampled to 100 m × 100 m resolution and all data were consistently projected to CGCS2000_3_Degree_GK_Zone_38. This coordinate system takes GCS China Geodetic Coordinate System 2000 as the geographic coordinate system and Gauss Kruger of zone 38 in 3-degree zoning as the projection coordinate system.

2.2. Methodology

A research framework for the evolution of ENs was developed in this study, including the following two parts. On the one hand, we built the ENs of WUA from 2000 to 2020 based on the advantages of circuit theory and remote sensing data of land use monitoring. On the other hand, circuit theory [27,28], centrality index [44], and complex network theory [45] were introduced to build a complete evaluation framework of ENs based on “quality–function–structure”. The application of this framework realized the evolution analysis of ENs in WUA from 2000 to 2020. This evaluation framework was committed to supporting the formulation of protection strategies for ENs.

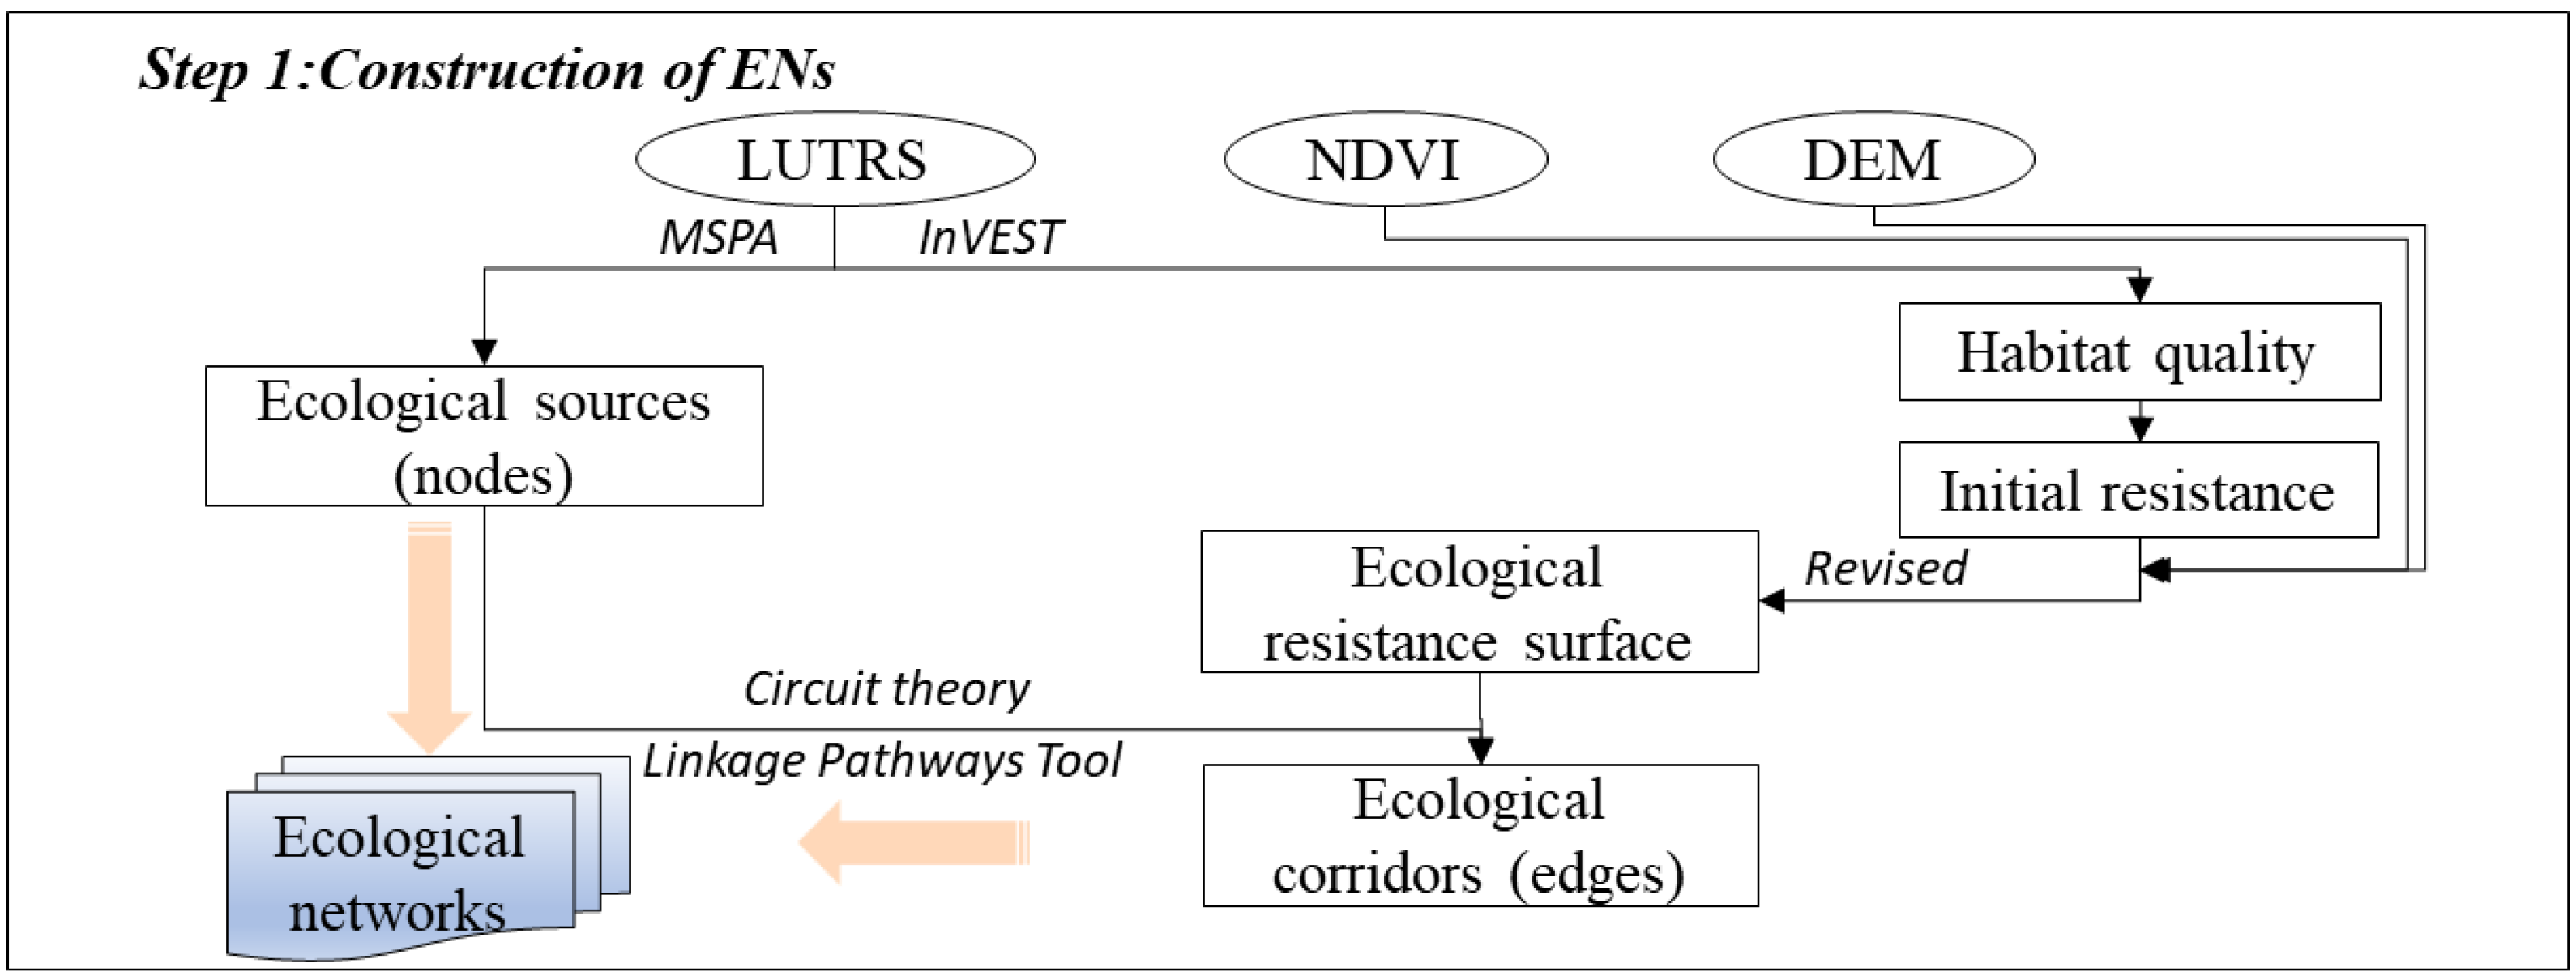
2.2.1. Construction of ENs
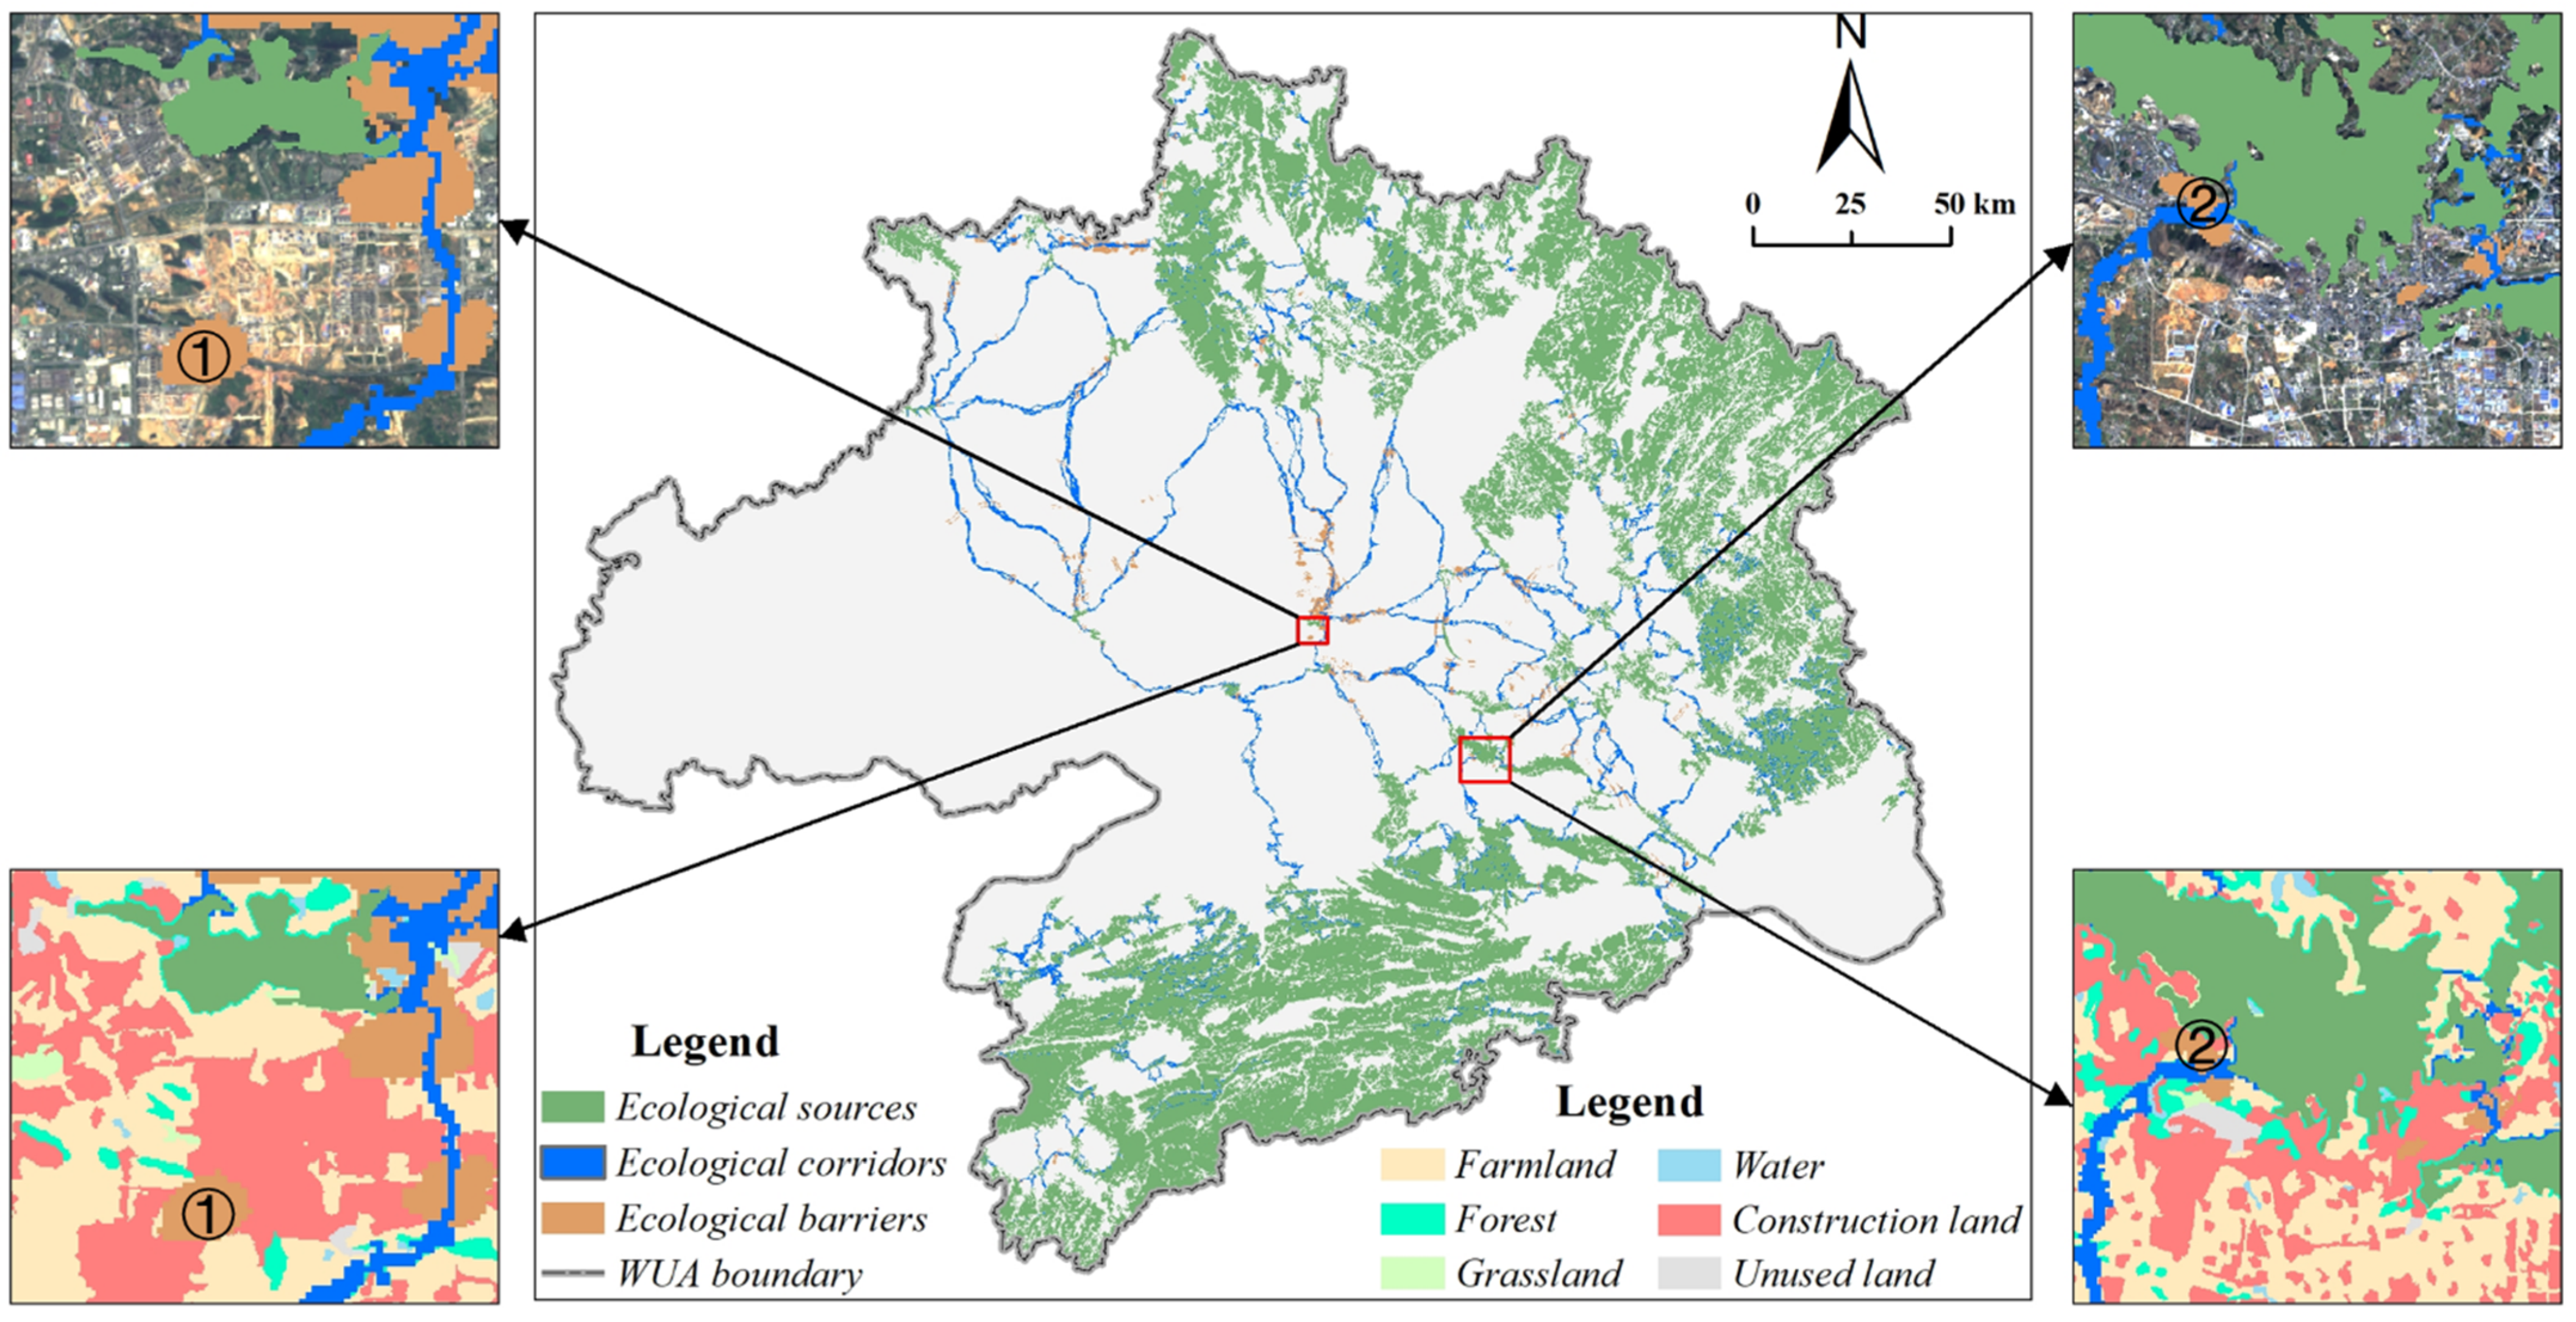
Landscape ecology studies the spatial pattern and ecological process of the ecosystem, which emphasizes maintaining landscape connectivity through ecological management [49,50]. Constructing ENs is considered to be a classical method to strengthen landscape connectivity [51]. ENs are potential paths for species to cross heterogeneous landscapes, including ecological nodes, ecological edges, and the connection between them. Ecological sources are abstracted as ecological nodes, and ecological corridors are abstracted as ecological edges [52]. Therefore, the basic paradigm of “identification of ecological sources-construction of ecological resistance surface-extraction of ecological corridors” was applied to identify ENs in this study [16,17] (Figure 2).
(1)
Identification of ecological sources
According to the theory of island biogeography, large-scale species habitats act as “species pools” of surrounding habitats [53]. Therefore, we regarded the large-scale habitats that play an important role in landscape connection as ecological sources. The extraction of ecological lands, the measurement of ecosystem services, and morphological spatial pattern analysis (MSPA) are common methods for identifying ecological sources [21,22,23,24]. Compared with the first two methods, MSPA focuses on identifying the connectivity of landscape components, which is widely used in the extraction of ecological sources [23,24]. The Guidos Toolbox based on MSPA is a method of mining image structure and connectivity based on the mathematical morphology algorithm [54]. In this study, Guidos Toolbox [54] was applied to conduct the MSPA analysis of spatial distribution data of land use types monitored by remote sensing in WUA from 2000 to 2020. First, forests, grasslands, and grasslands were regarded as foreground elements because they are more suitable as habitats for terrestrial species. Other land types were regarded as background elements. Second, eight neighborhood method of Guidos Toolbox was applied to extract the landscape components of core, islet, performance, edge, bridge, loop, and branch [55] based on the input of foreground and background elements. The core is the large-scale habitat patch in the landscape elements, which is of great significance to the habitat and migration of species [55]. Finally, core patches higher than the optimal area threshold (4 km2) were regarded as ecological sources (see more details in Appendix A for identification of optimal area threshold for ecological sources).
(2)
Construction of ecological resistance surface
Ecological resistance surface represents the resistance cost of heterogeneous landscapes to species migration between ecological sources [16]. In some previous studies, ecological resistance surface was determined according to the subjective assignment of habitat types [56,57], which has strong subjectivity and poor accuracy. The habitat quality generated based on the InVEST model considers the suitability of different habitat types and the extent of habitat degradation [58], which is suitable for the construction of ecological resistance surfaces. In this study, the initial resistance value was set according to the habitat quality of the terrestrial ecosystem assessed by spatial distribution data of land use types monitored by remote sensing (see more details in Appendix B for calculation process of habitat quality for the terrestrial ecosystem). Considering the impact of topography and vegetation on species migration, topographic index and NDVI index were used to correct the initial resistance surface. The specific formula is as follows:
R c o r r e c t = ( T i i T i m + 1 N D V I i N D V I m ) × R i n i t i a l 2
R i n i t i a l = 1 H M
T i i = l n   [ ( E i E m + 1 ) × ( S i S m + 1 ) ]
where R c o r r e c t and R i n i t i a l represent the corrected resistance surface and initial resistance surface, respectively; T i i and N D V I i represent the topographic index and normalized vegetation index, respectively; T i m and N D V I m are the mean value of the topographic index and normalized vegetation index for land type m , respectively;   E i and S i represent the elevation and slope, respectively; E m and S m are the mean elevation and slope of land type m , respectively.
(3)
Extraction of ecological corridors
Ecological corridors are not only banded channels connecting ecological sources [16] but also important carriers of material circulation, energy flow, and information transmission in the ecosystem. The traditional MCR model can identify the optimal path and direction of species migration, but it cannot determine the spatial scope of the ecological corridor [25]. Referring to frontier studies [27,28], the circuit theory derived from physics was applied to identify the direction and spatial range of ecological corridors in this study. According to circuit theory [27,28], ENs are regarded as circuit structures. Ecological sources and ecological resistance surfaces are regarded as circuit nodes and resistance surfaces, respectively, while biological flows are regarded as random walk processes of electrons. The direction of ecological corridors is determined by simulating the random walk of biological flow, and the range of ecological corridors is determined by the cumulative resistance threshold of the current [25]. In this study, the Linkage Pathways Tool of the Linkage Mapper [28], based on circuit theory, was used to output ecological corridors between ecological sources based on the input of ecological sources and ecological resistance surface.

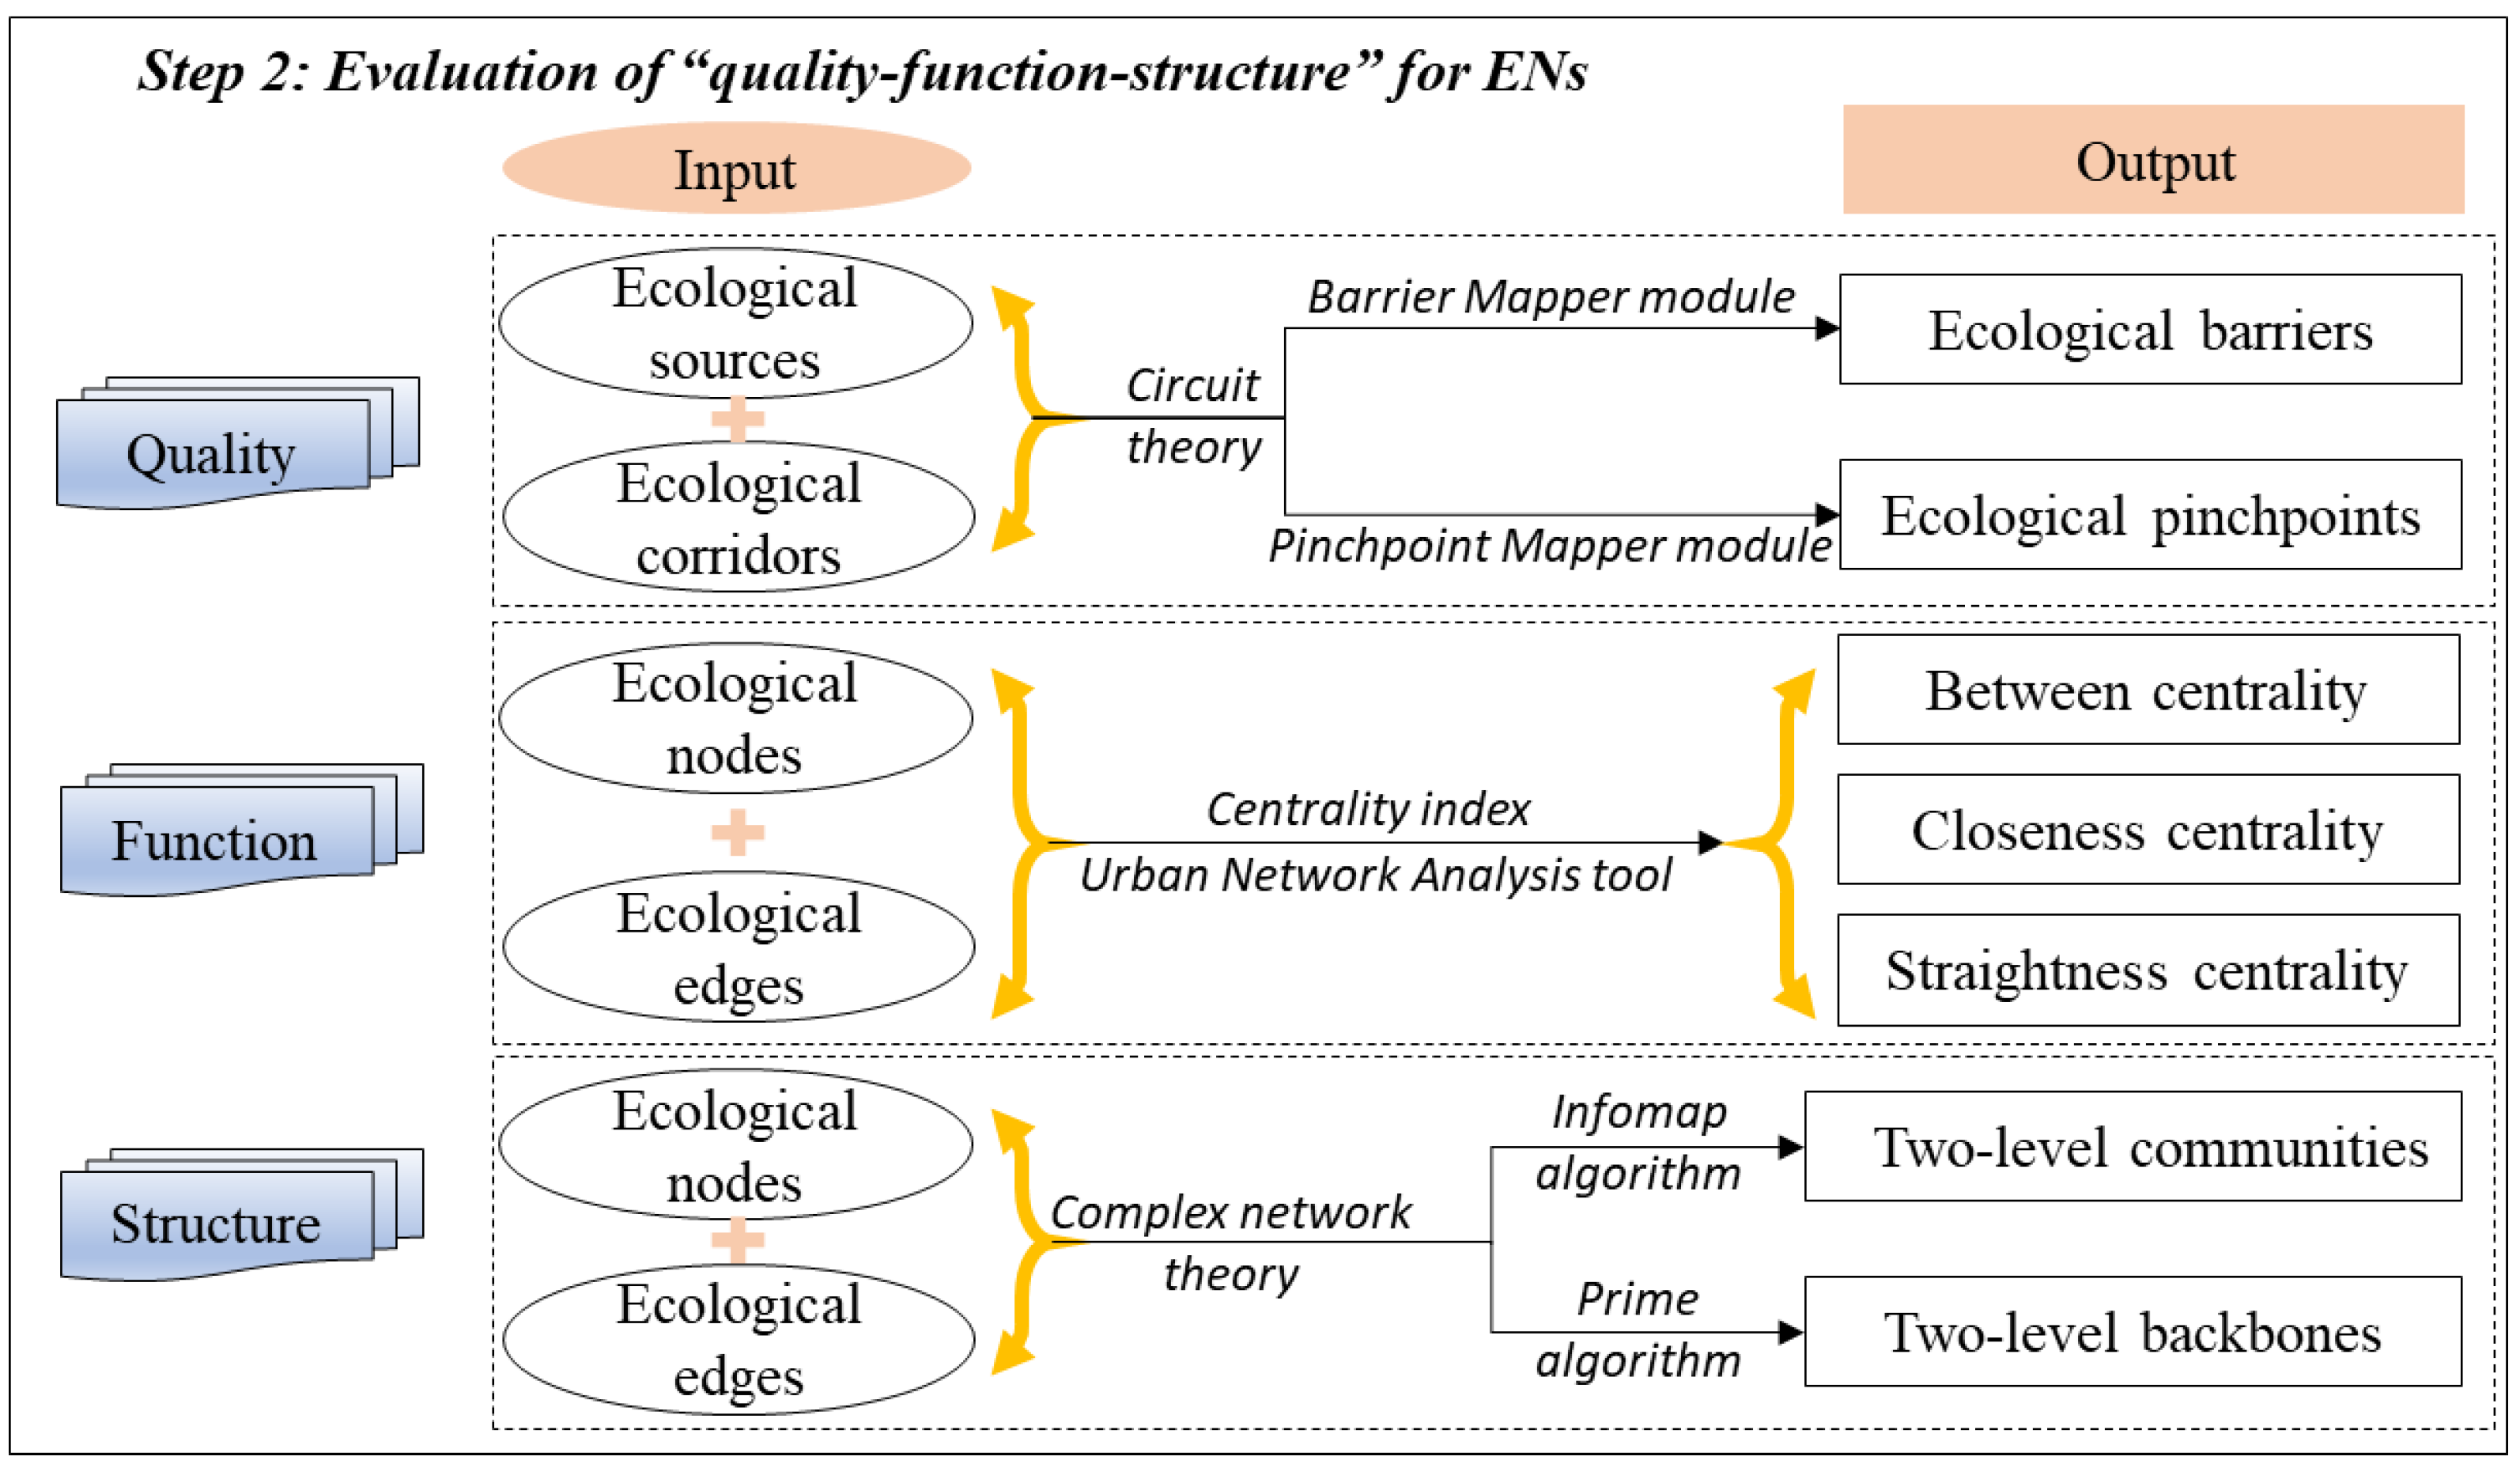
2.2.2. Evaluation of “Quality–Function–Structure” for ENs

Existing evaluation of ENs often focuses on a single perspective [29,31,32], which lacks a comprehensive evaluation framework that can be directly applied to the planning of ENs. In this study, circuit theory, centrality index, and complex network theory were introduced to build a complete evaluation framework of ENs (Figure 3). Ecological barriers and pinchpoints were regarded as quality defects of ENs. Between centrality, closeness centrality, and straightness centrality were used to evaluate the connectivity function of ENs. The topology of complex networks was applied to evaluate the structural characteristics of ENs, including community and backbone structure.

(1) Quality Evaluation of ENs

With the prevalence of urban sprawl and agricultural expansion, ENs are often eroded by impervious surfaces and farmlands, which leads to inherent quality defects. Previous studies on quality evaluation focused on the ecological attributes of ENs [29,30,31,32] and could not detect the quality defects of ENs that hinder biological flow. Therefore, the quality evaluation of ENs focused on identifying the quality defects that hinder ecological connectivity, which were regarded as the key restoration and protection areas of ENs, including ecological barriers and pinchpoints.
Ecological barriers refer to the non-habitats that hinder the ecological flow, which leads to the detour or meander of ecological corridors. Removing barriers will reduce the cost of ecological connectivity in these regions and increase the possibility of biological flows. According to circuit theory, the recovery value of cumulative current reflects the benefit after removing barriers. According to the circuit theory, areas with the highest recovery value of accumulated current in ecological corridors are called barriers [34], which make corridors circuitous or redundant. The Barrier Mapper module [34] of Linkage Mapper software was used to identify ecological barriers based on the input of ecological sources and ecological resistance surface. Ecological pinchpoints refer to the narrow parts of ecological corridors, which are the bottleneck and irreplaceable areas of species migration. According to circuit theory, the current density reflects the net migration of random walkers [33]. The narrow areas with the highest current density in ecological corridors are called pinchpoints, which are bottlenecks of species migration. The Pinchpoint Mapper module [33] of Linkage Mapper software was used to identify pinchpoints based on the input of ecological sources and ecological resistance surface.

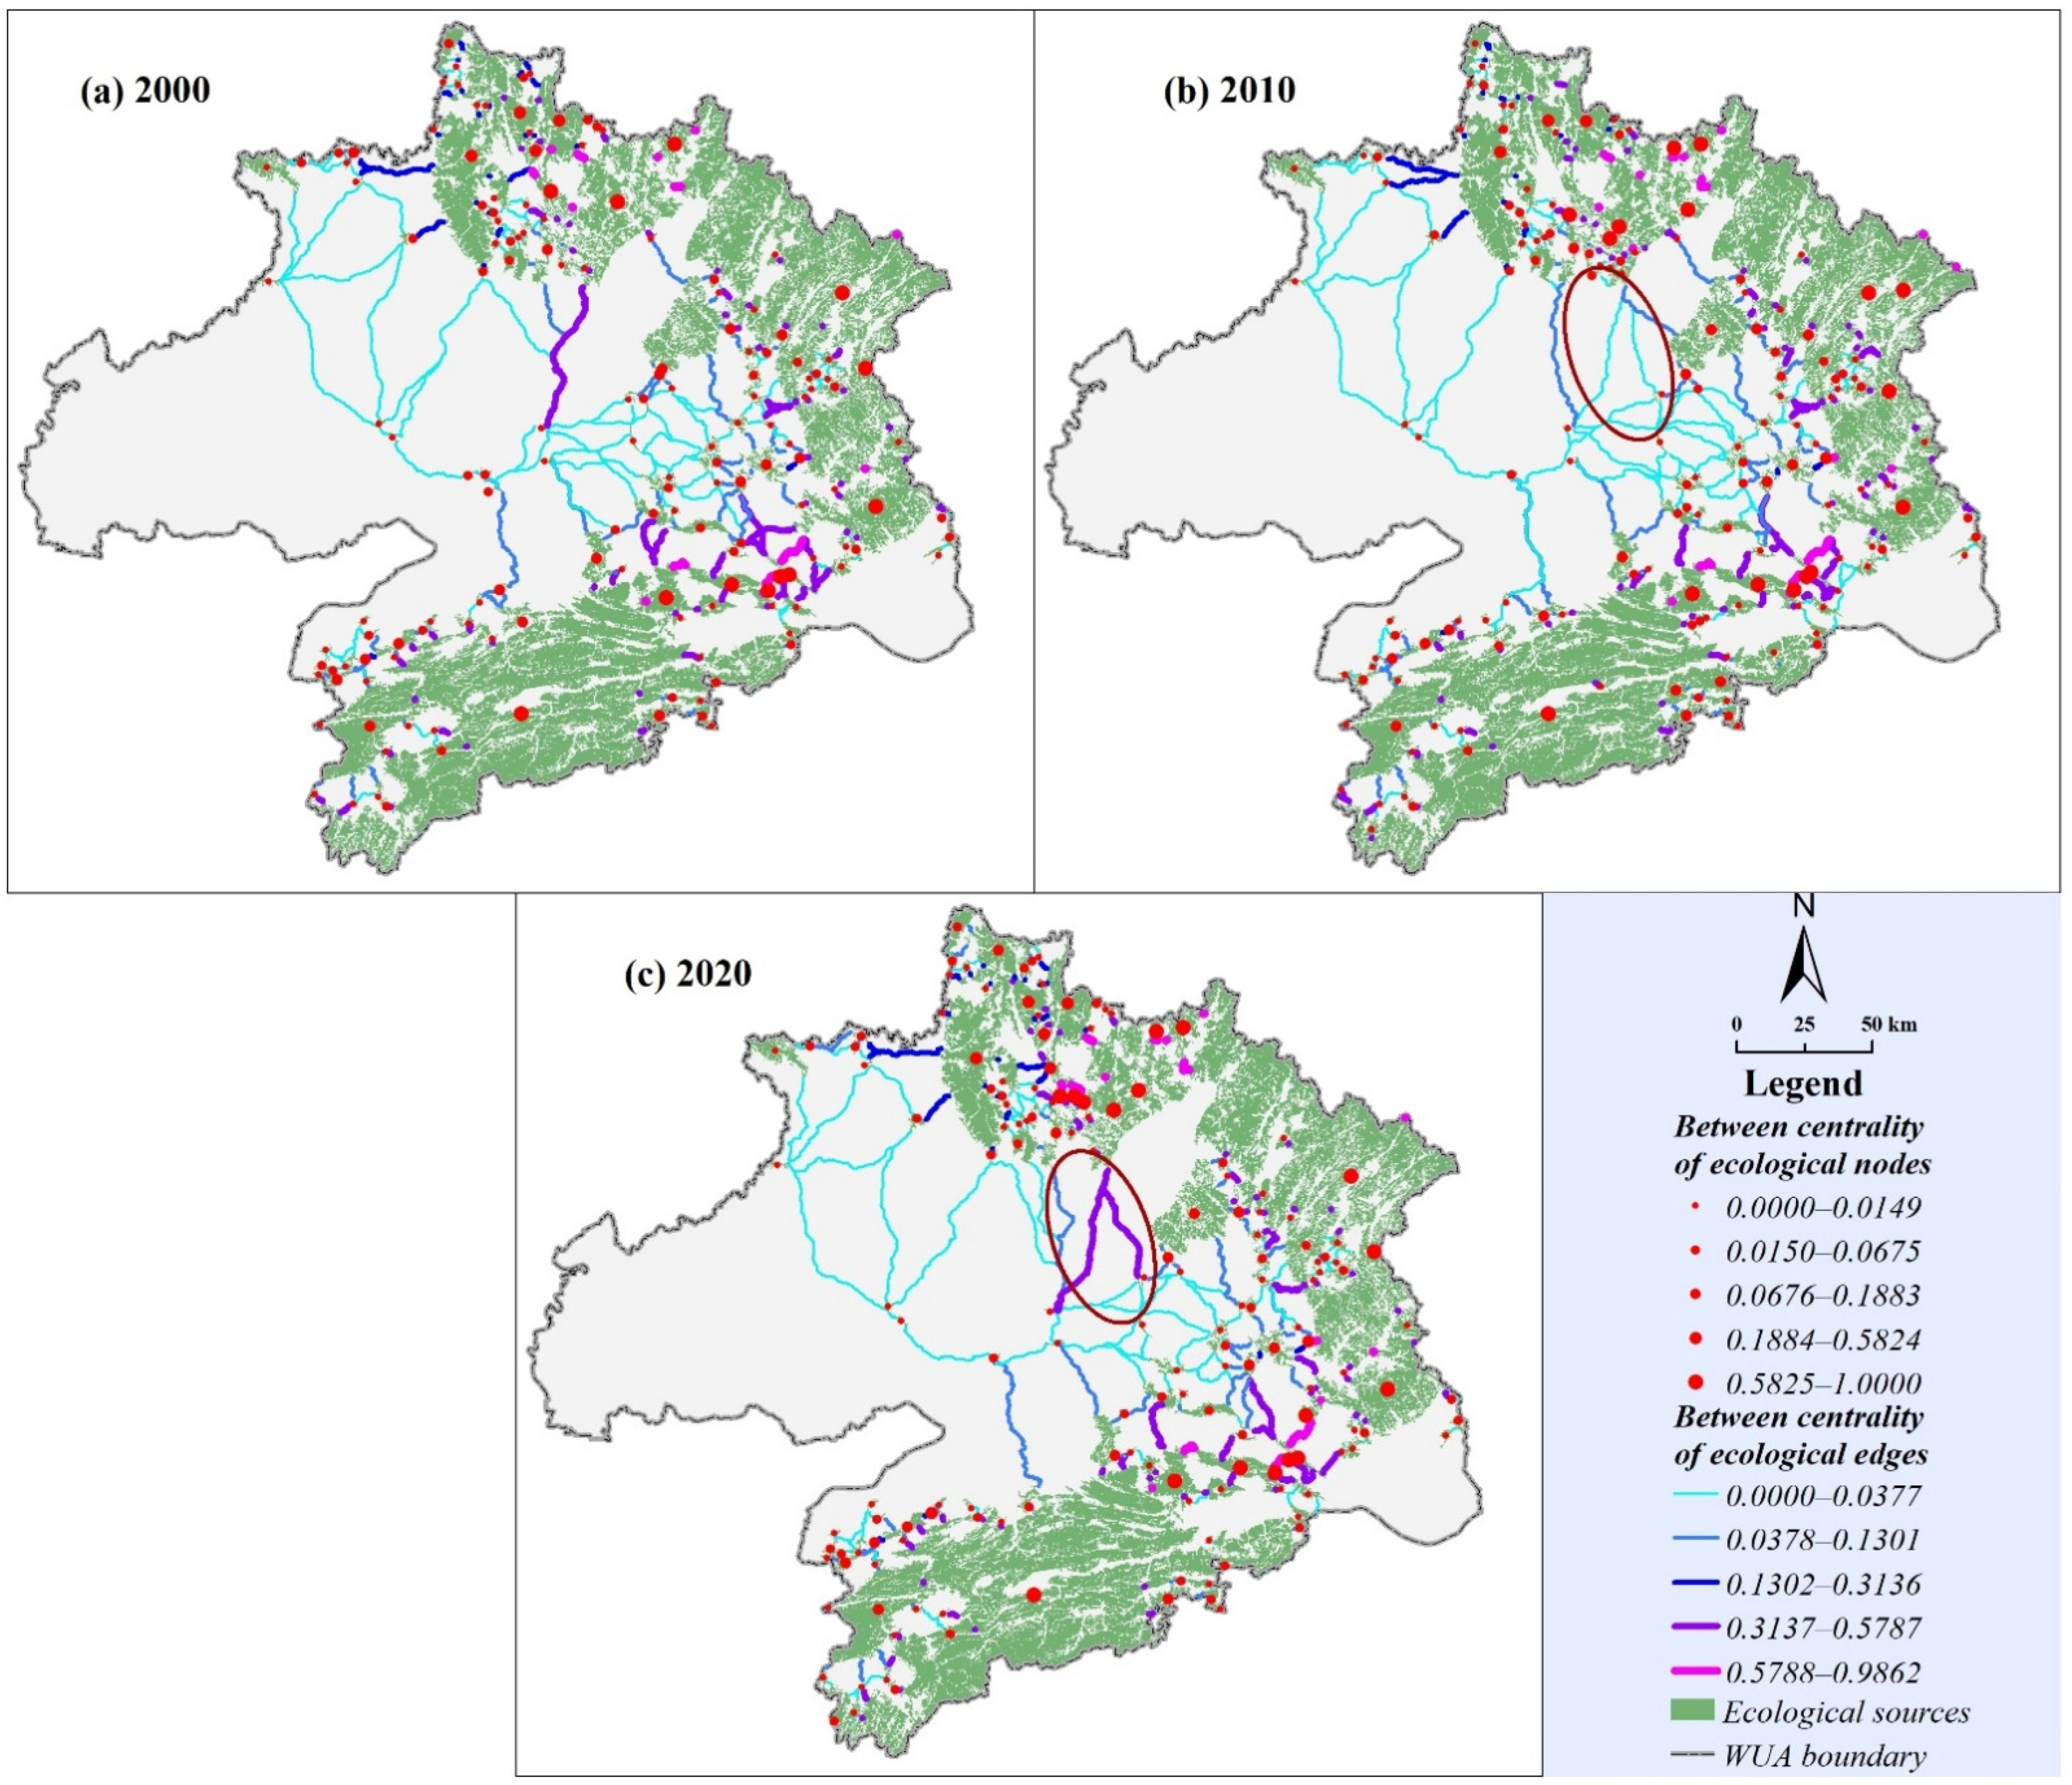
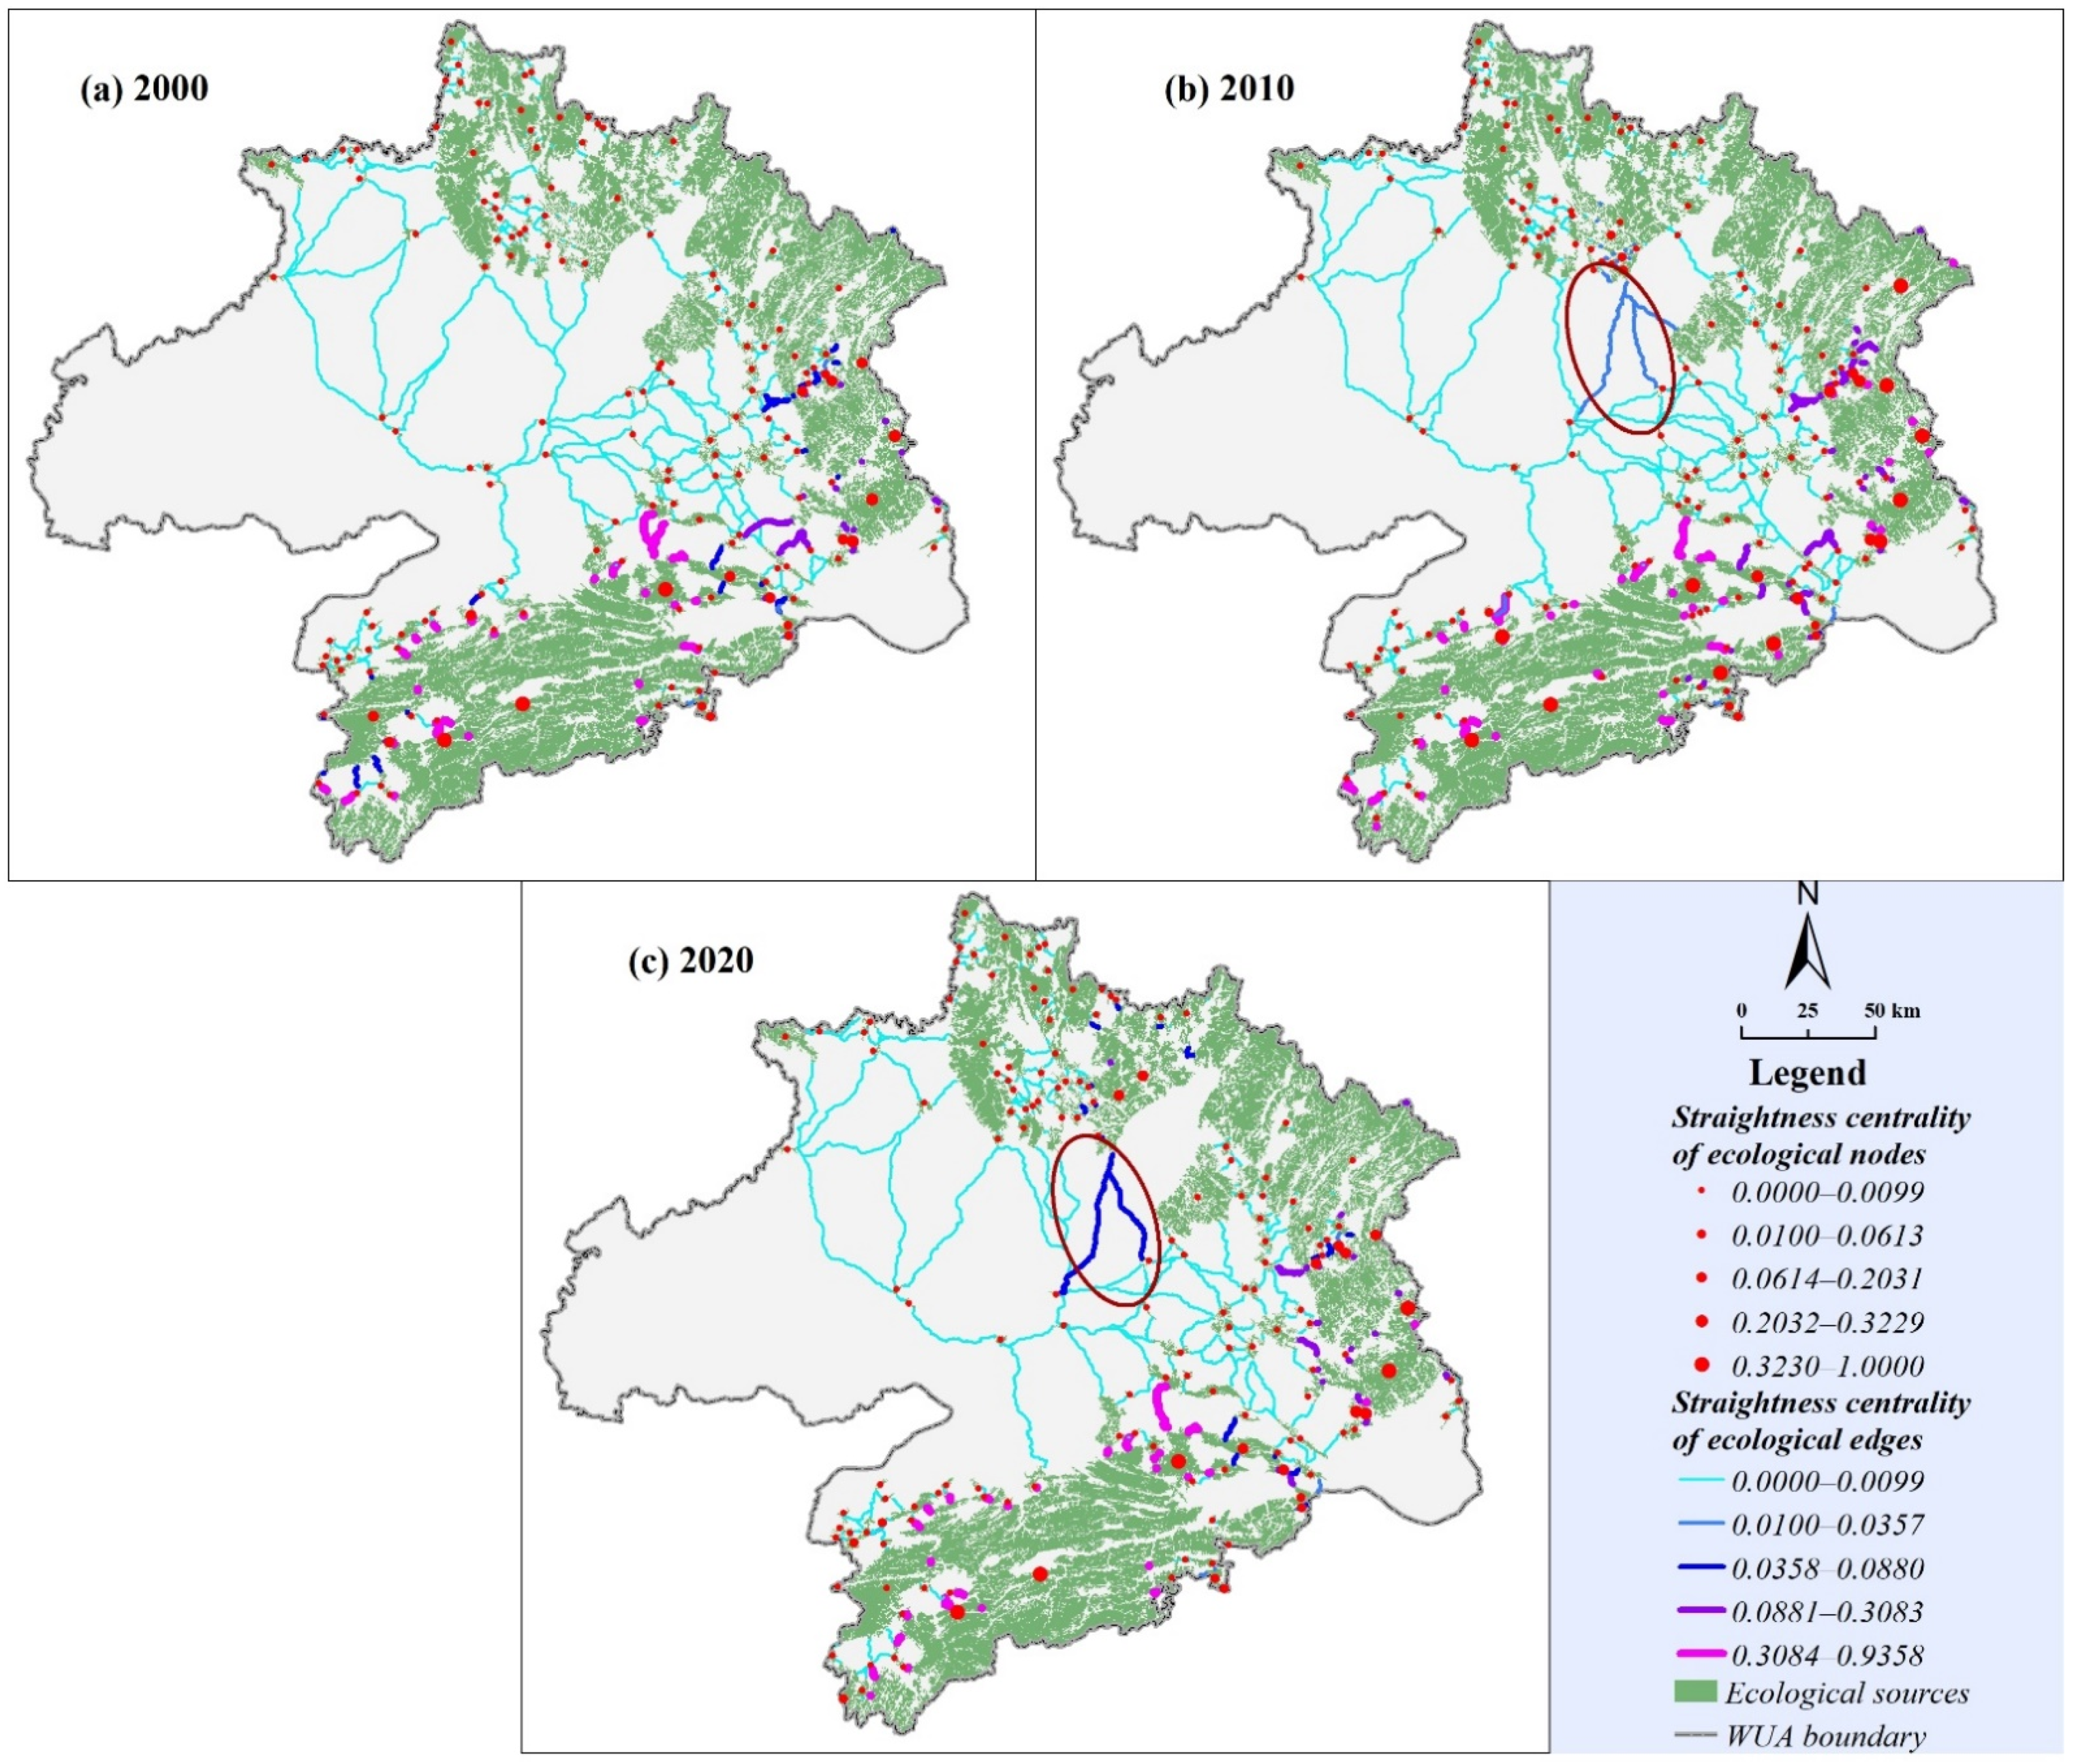
(2) Functional Evaluation of ENs

The core function of ENs is to connect spatially distant habitat patches. Compared with the global connectivity index such as circularity (α), node corridor ratio (β), and connectivity (γ) [6,35], the centrality index can reflect the importance of local network elements to the connectivity of the whole network [59]. In this study, Urban Network Analysis tool (UNA) [44] was applied to measure the betweenness, closeness, and straightness centrality of ENs based on the input of ecological nodes (ecological sources) and edges (ecological corridors), which aims to evaluate the connectivity function of ENs. Between centrality and closeness centrality measure the transit function and relative accessibility of nodes in the network, respectively. Straightness centrality reflects the access efficiency between nodes and other nodes [60,61,62]. It should be noted that the measurement result is the centrality of ecological nodes. The mean value of node centrality at both ends of the edge was taken as the edge centrality. The calculation formula for three centrality indexes is as follows:
B e ( i ) n o r m a = j , m G { i } , d ( i , j ) a [ n j m ( i ) n j m × j ] j G { i } , d ( i , j ) a ( j 1 ) j G { i } , d ( i , j ) a × j
C l ( i ) n o r m a = j G { i } , d ( i , j ) a j j G { i } , d ( i , j ) a d ( i , j ) × j
S t r ( i ) n o r m a = j G { i } , d ( i , j ) a [ d E u c l ( i , j ) d ( i , j ) × j ] j G { i } , d ( i , j ) a × j
where B e ( i ) n o r m a , C l ( i ) n o r m a , and S t r ( i ) n o r m a represent the normalized betweenness centrality, closeness centrality, and straightness centrality of node i , respectively, when the search radius is r ; G { i } is the subset of node-set G with node i removed;   d ( i , j ) is the minimum cost-weighted distance between node i and j ; n j m ( i ) is the number of paths with the minimum cost-weighted distance from node j to m through node i ; n j m is the number of paths with the minimum cost-weighted distance between node j and m ; d E u c l ( i , j ) is the Euclidean distance between node i and j .

(3) Structural Evaluation of ENs

Network phenomena are complex systems that generally exist in nature and human society [45]. Complex network theory applies the method of abstracting the real world to describe the connection behavior of complex systems in nature and human society. ENs are spatially connected complex systems similar to other complex networks, which are significant to reduce landscape fragmentation and curb biodiversity loss [48]. With the development of complex network modeling, it is possible to express the characteristics of ENs by complex network analysis [63]. Topology is an important research content of complex networks which typically includes community and tree structure. Analyzing the topological characteristics of ENs is conducive to exploring the key and redundant components of ENs, which is still rare in existing studies. The loss of key structures may have a worse impact on ENs than redundant components [41]. Therefore, complex network theory [45] was applied to explore community structure and tree structure in this study, which aims to provide scientific recommendations for protection strategies of ENs.
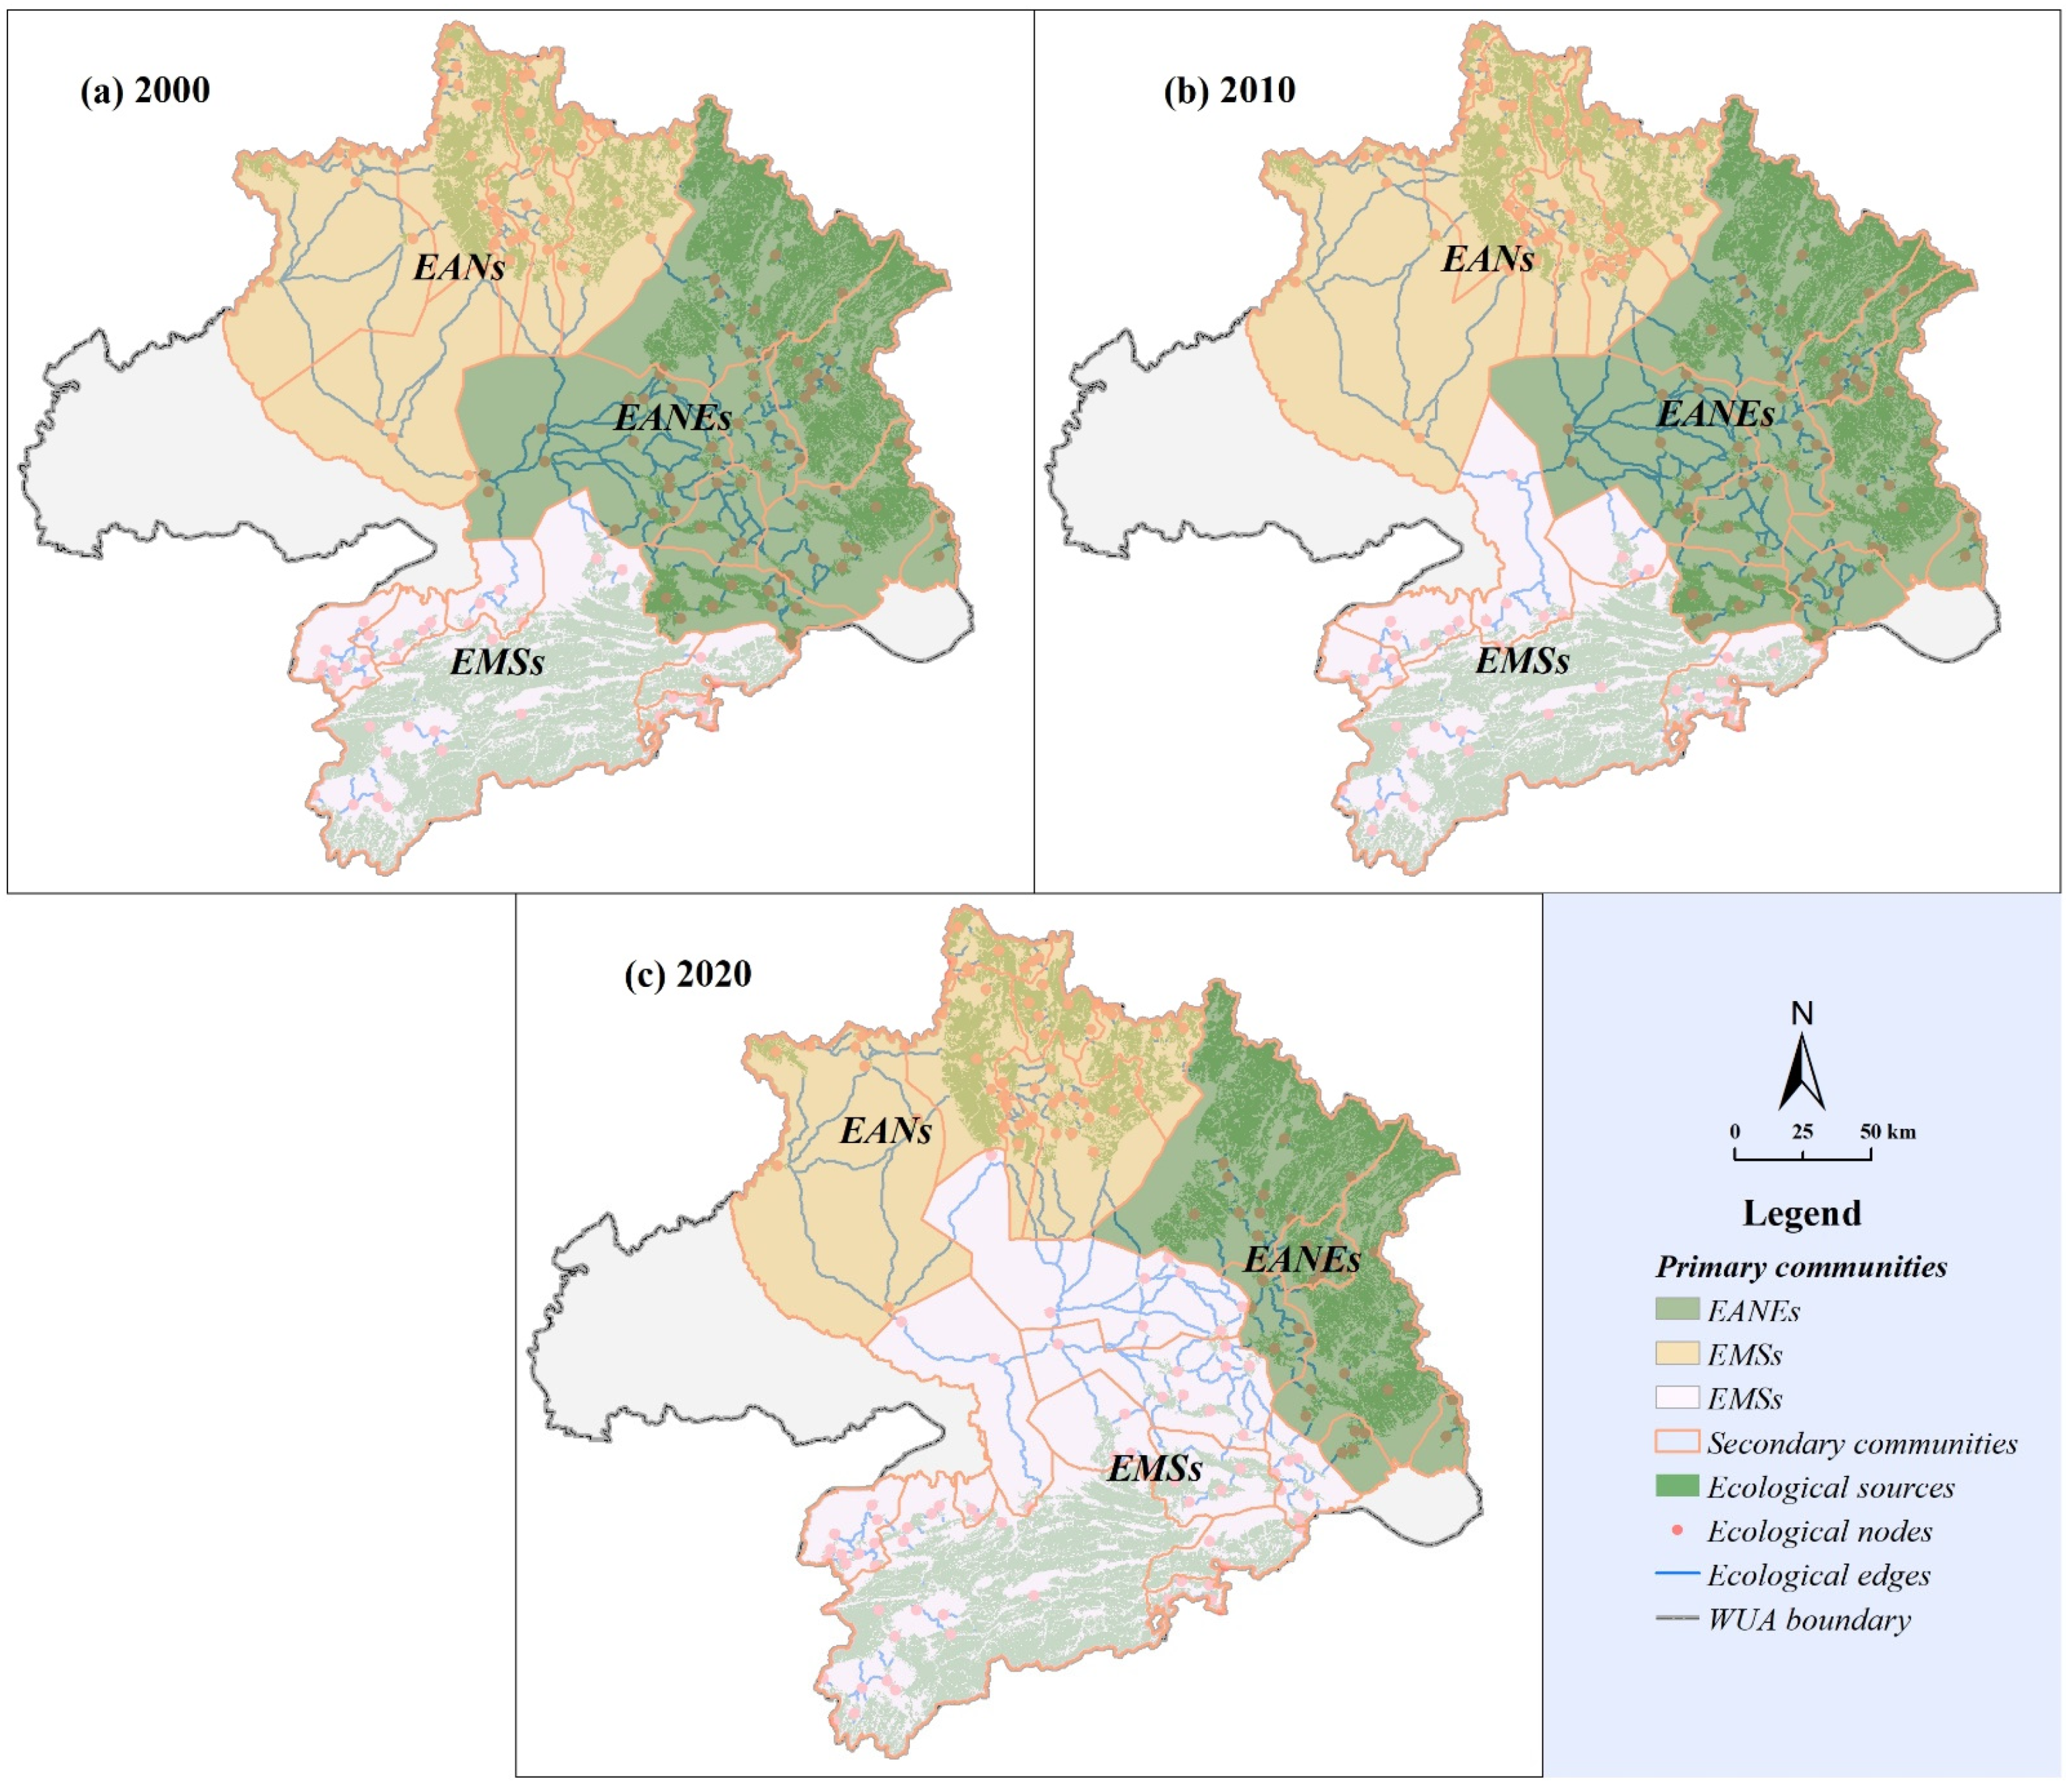
Community structure of ENs
Complex networks are usually composed of several communities. Nodes in the same community are closely connected, but the communities are loosely connected [64]. Community detection reveals the internal interaction characteristics of complex network systems, which is an important basis for explaining and studying the formation principle of network structure and agglomeration behavior [45]. The community detection algorithm was applied to explore the general connections within ENs, which may be conducive to revealing the hidden community structure of ENs.
In this study, the classical Infomap algorithm was used to identify the community structure of ENs. Infomap is a network clustering algorithm based on the map equation, which identifies communities in the network by combining random walk and information compression [42,65]. The basic principle of the Infomap algorithm is to use double-layer Huffman coding to describe the sequence of node codes for network information flow, and then search the path with the shortest coding length by random walks (see reference [43] for specific schematic diagram). The first layer of double-layer Huffman coding is community coding, and the second layer is node coding in the community [42,43]. This method has two characteristics. One is that the coding of nodes in different communities is reusable, which can greatly compress the length of information description. The other is that the access probability of the node is inversely correlated with the code length of the node. Nodes in the network community are closely connected, which means that the access probability of nodes is high, and the total coding length of random walks in the community is relatively short. In this study, we implemented two-level community detection of ecological nodes in Infomap Online (https://www.mapequation.org/infomap/, accessed on 20 March 2022). Furthermore, Thiessen polygons were applied to determine the boundaries of all two-level communities to explore the community structure of ENs.
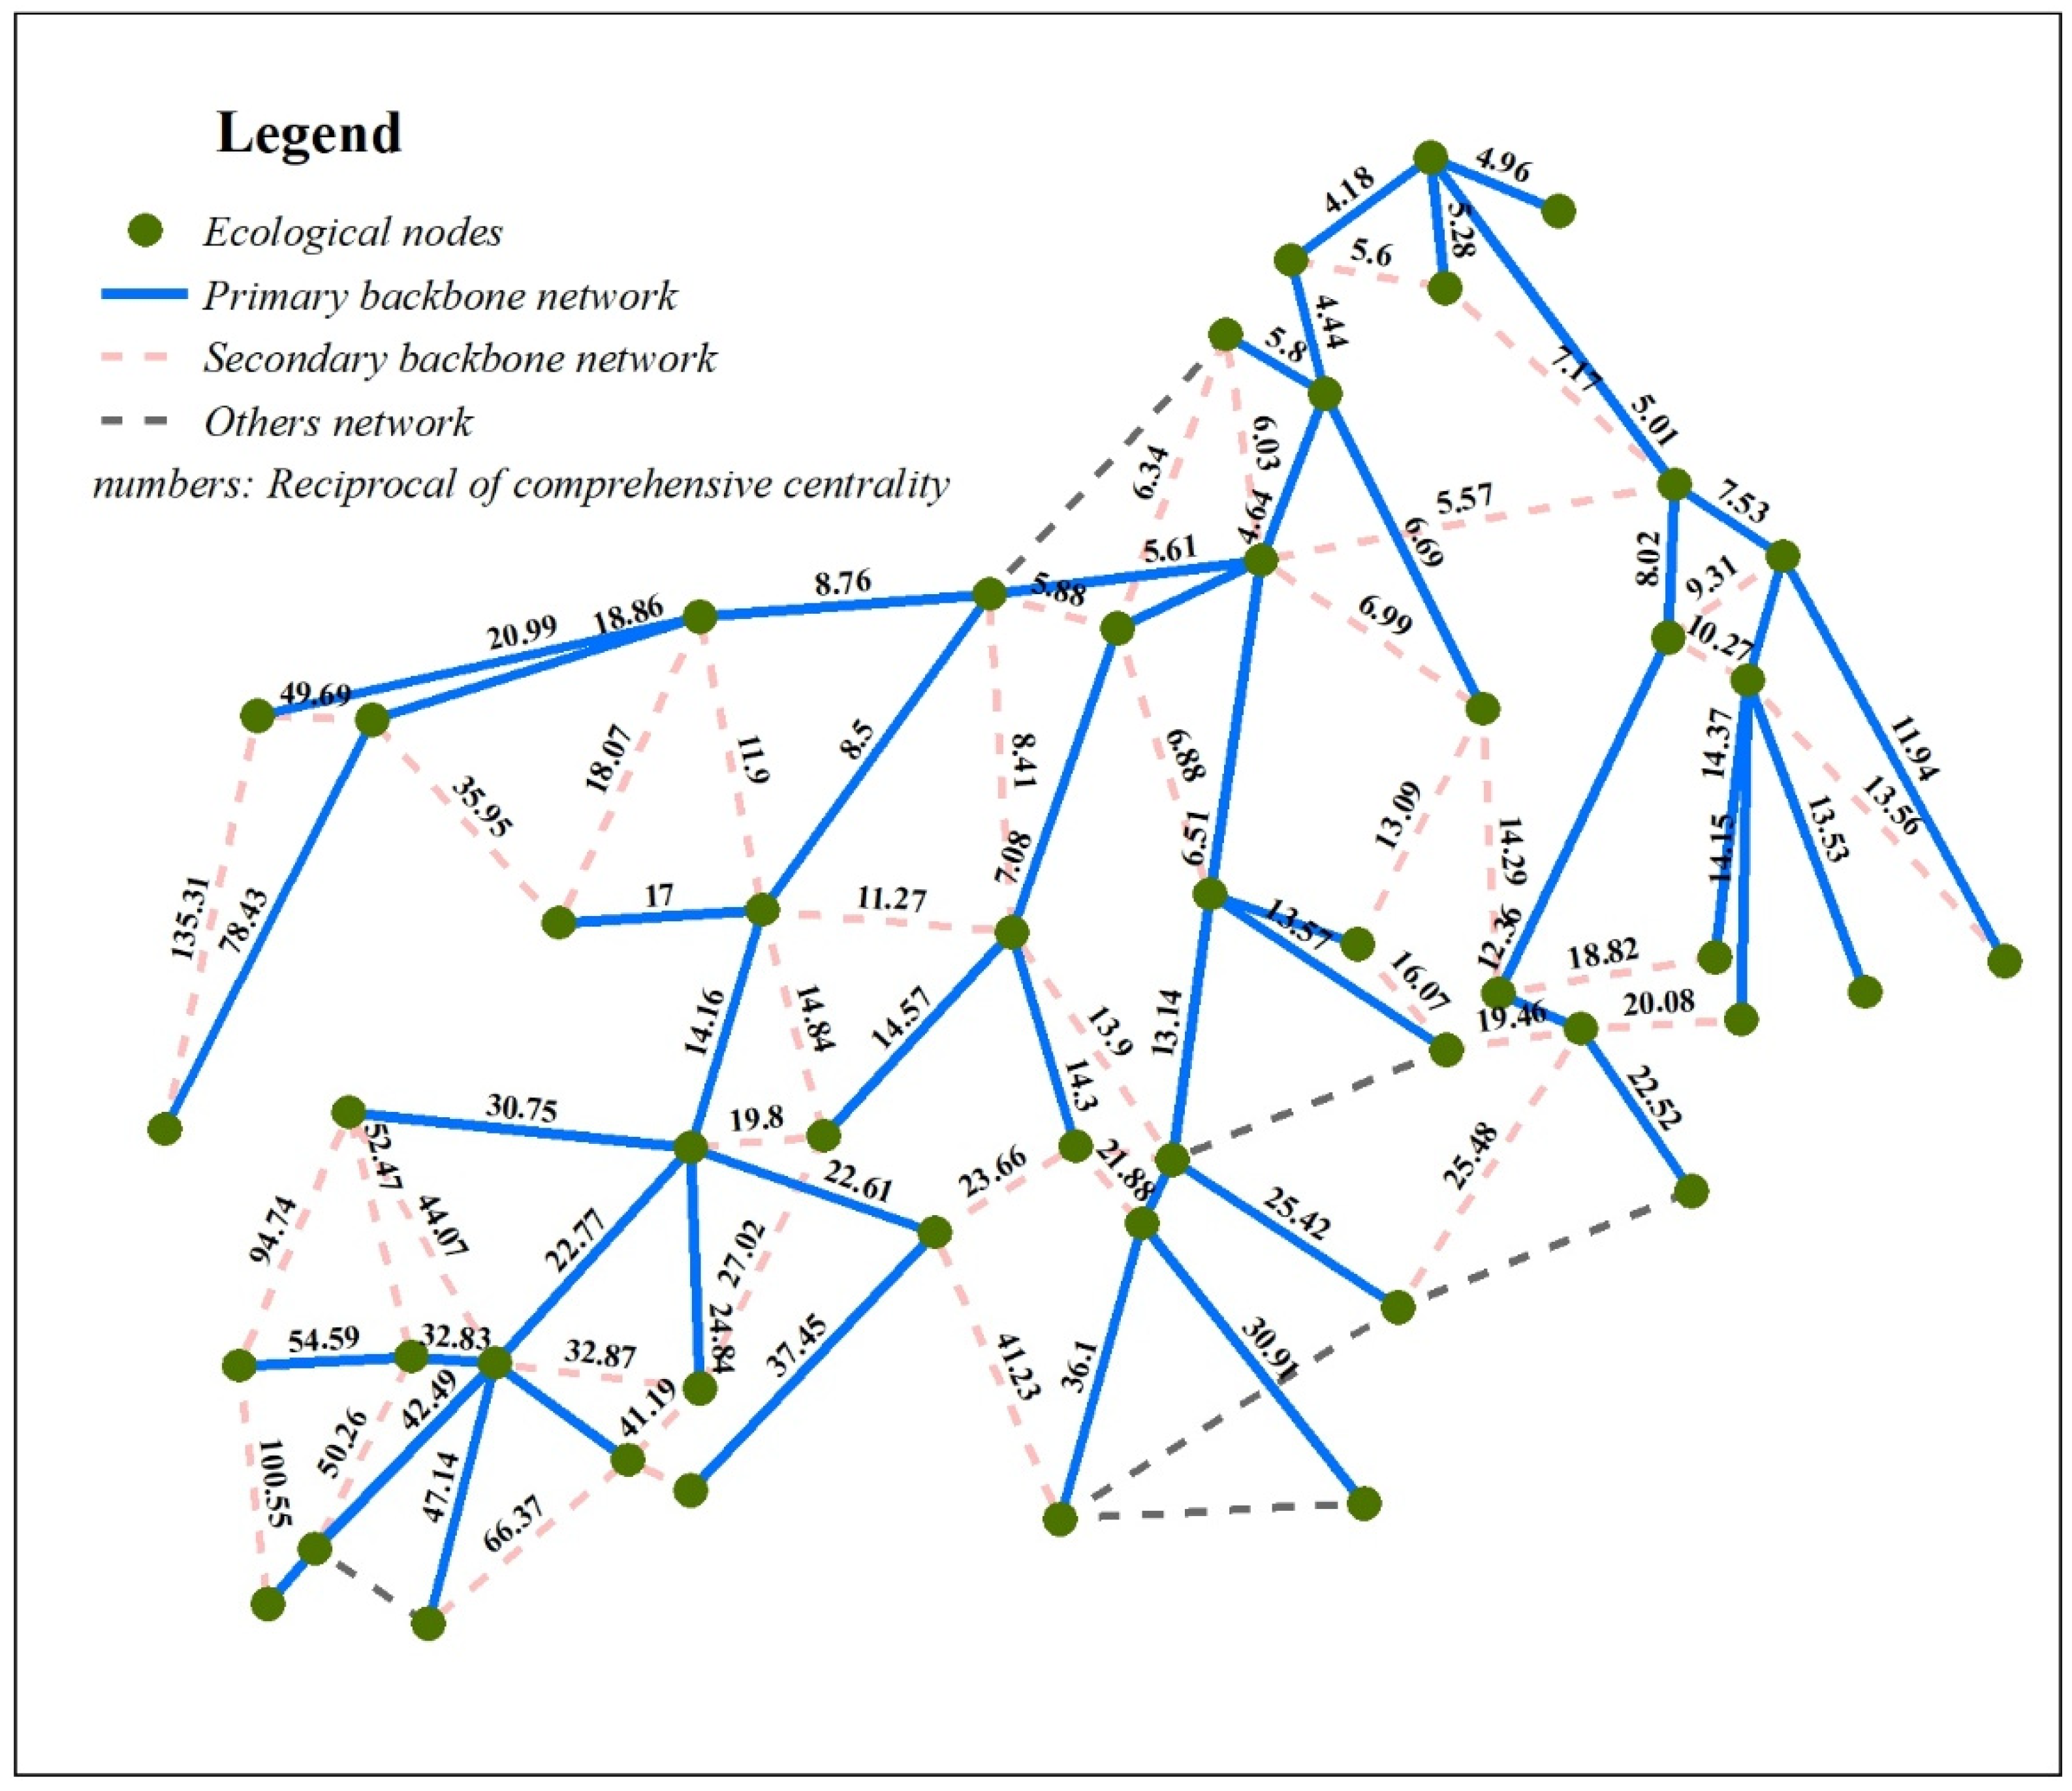
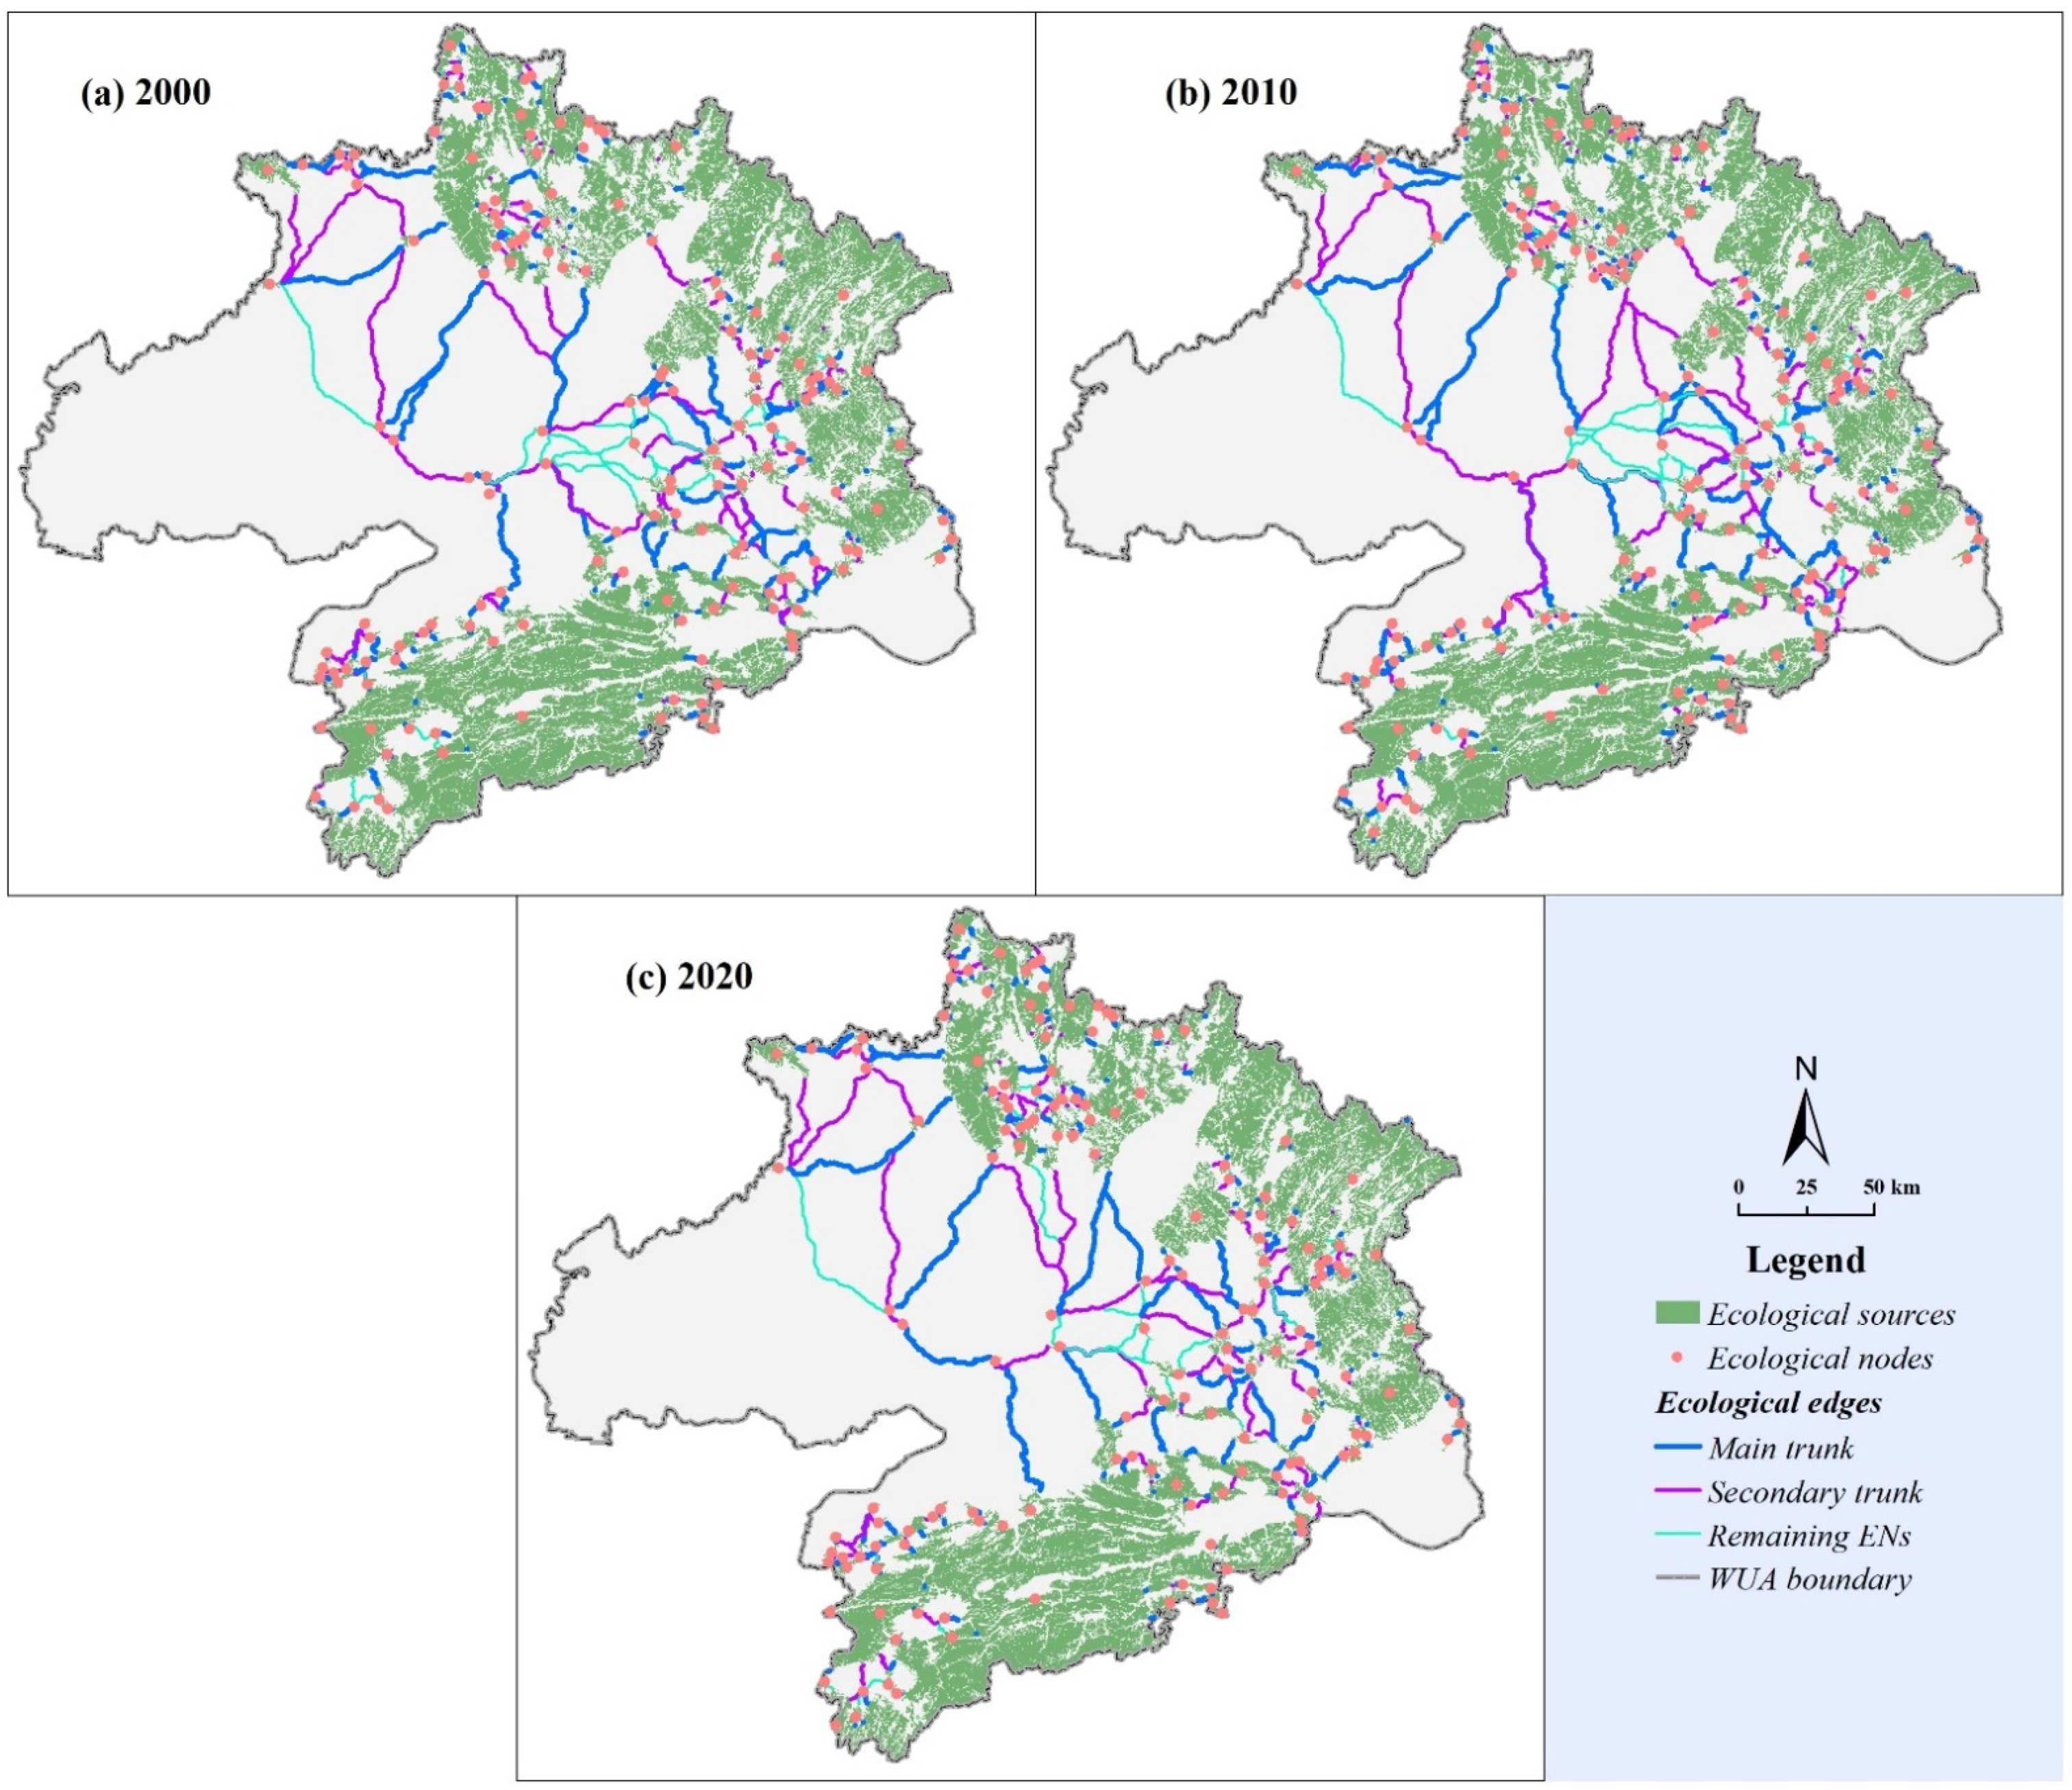
Backbone structure of ENs
A connected graph without cycles is called a tree, which is the most concise and important structure in complex networks [66]. The minimum spanning tree is the support tree with the minimum weighted sum in the network, which makes the simple backbone structure of a complex network established. MST has the following properties [67]. ① All nodes are connected. ② There is no circular structure. ③ The connection cost is the lowest. ④ The number of edges is one less than the number of nodes. Therefore, MST is considered the backbone component of a complex network, which can be realized by the Prim algorithm. MST algorithm was applied to explore the general connections within ENs, which may be conducive to revealing the hidden backbone structure of ENs.
According to the above principles, the reciprocal of comprehensive centrality was taken as the connection cost (numbers above the edges in Figure 4). Comprehensive centrality was the mean value of between, closeness, and straightness centrality in Functional Evaluation of ENs. Furthermore, the classic Prim algorithm [68] was applied to identify the MST of ENs based on Python3.7. The MST of global ENs was taken as the primary backbone network (blue thick line in Figure 4), and the MST of remaining ENs except the primary backbone network was taken as the secondary backbone network (pink dotted line in Figure 4).

3. Results

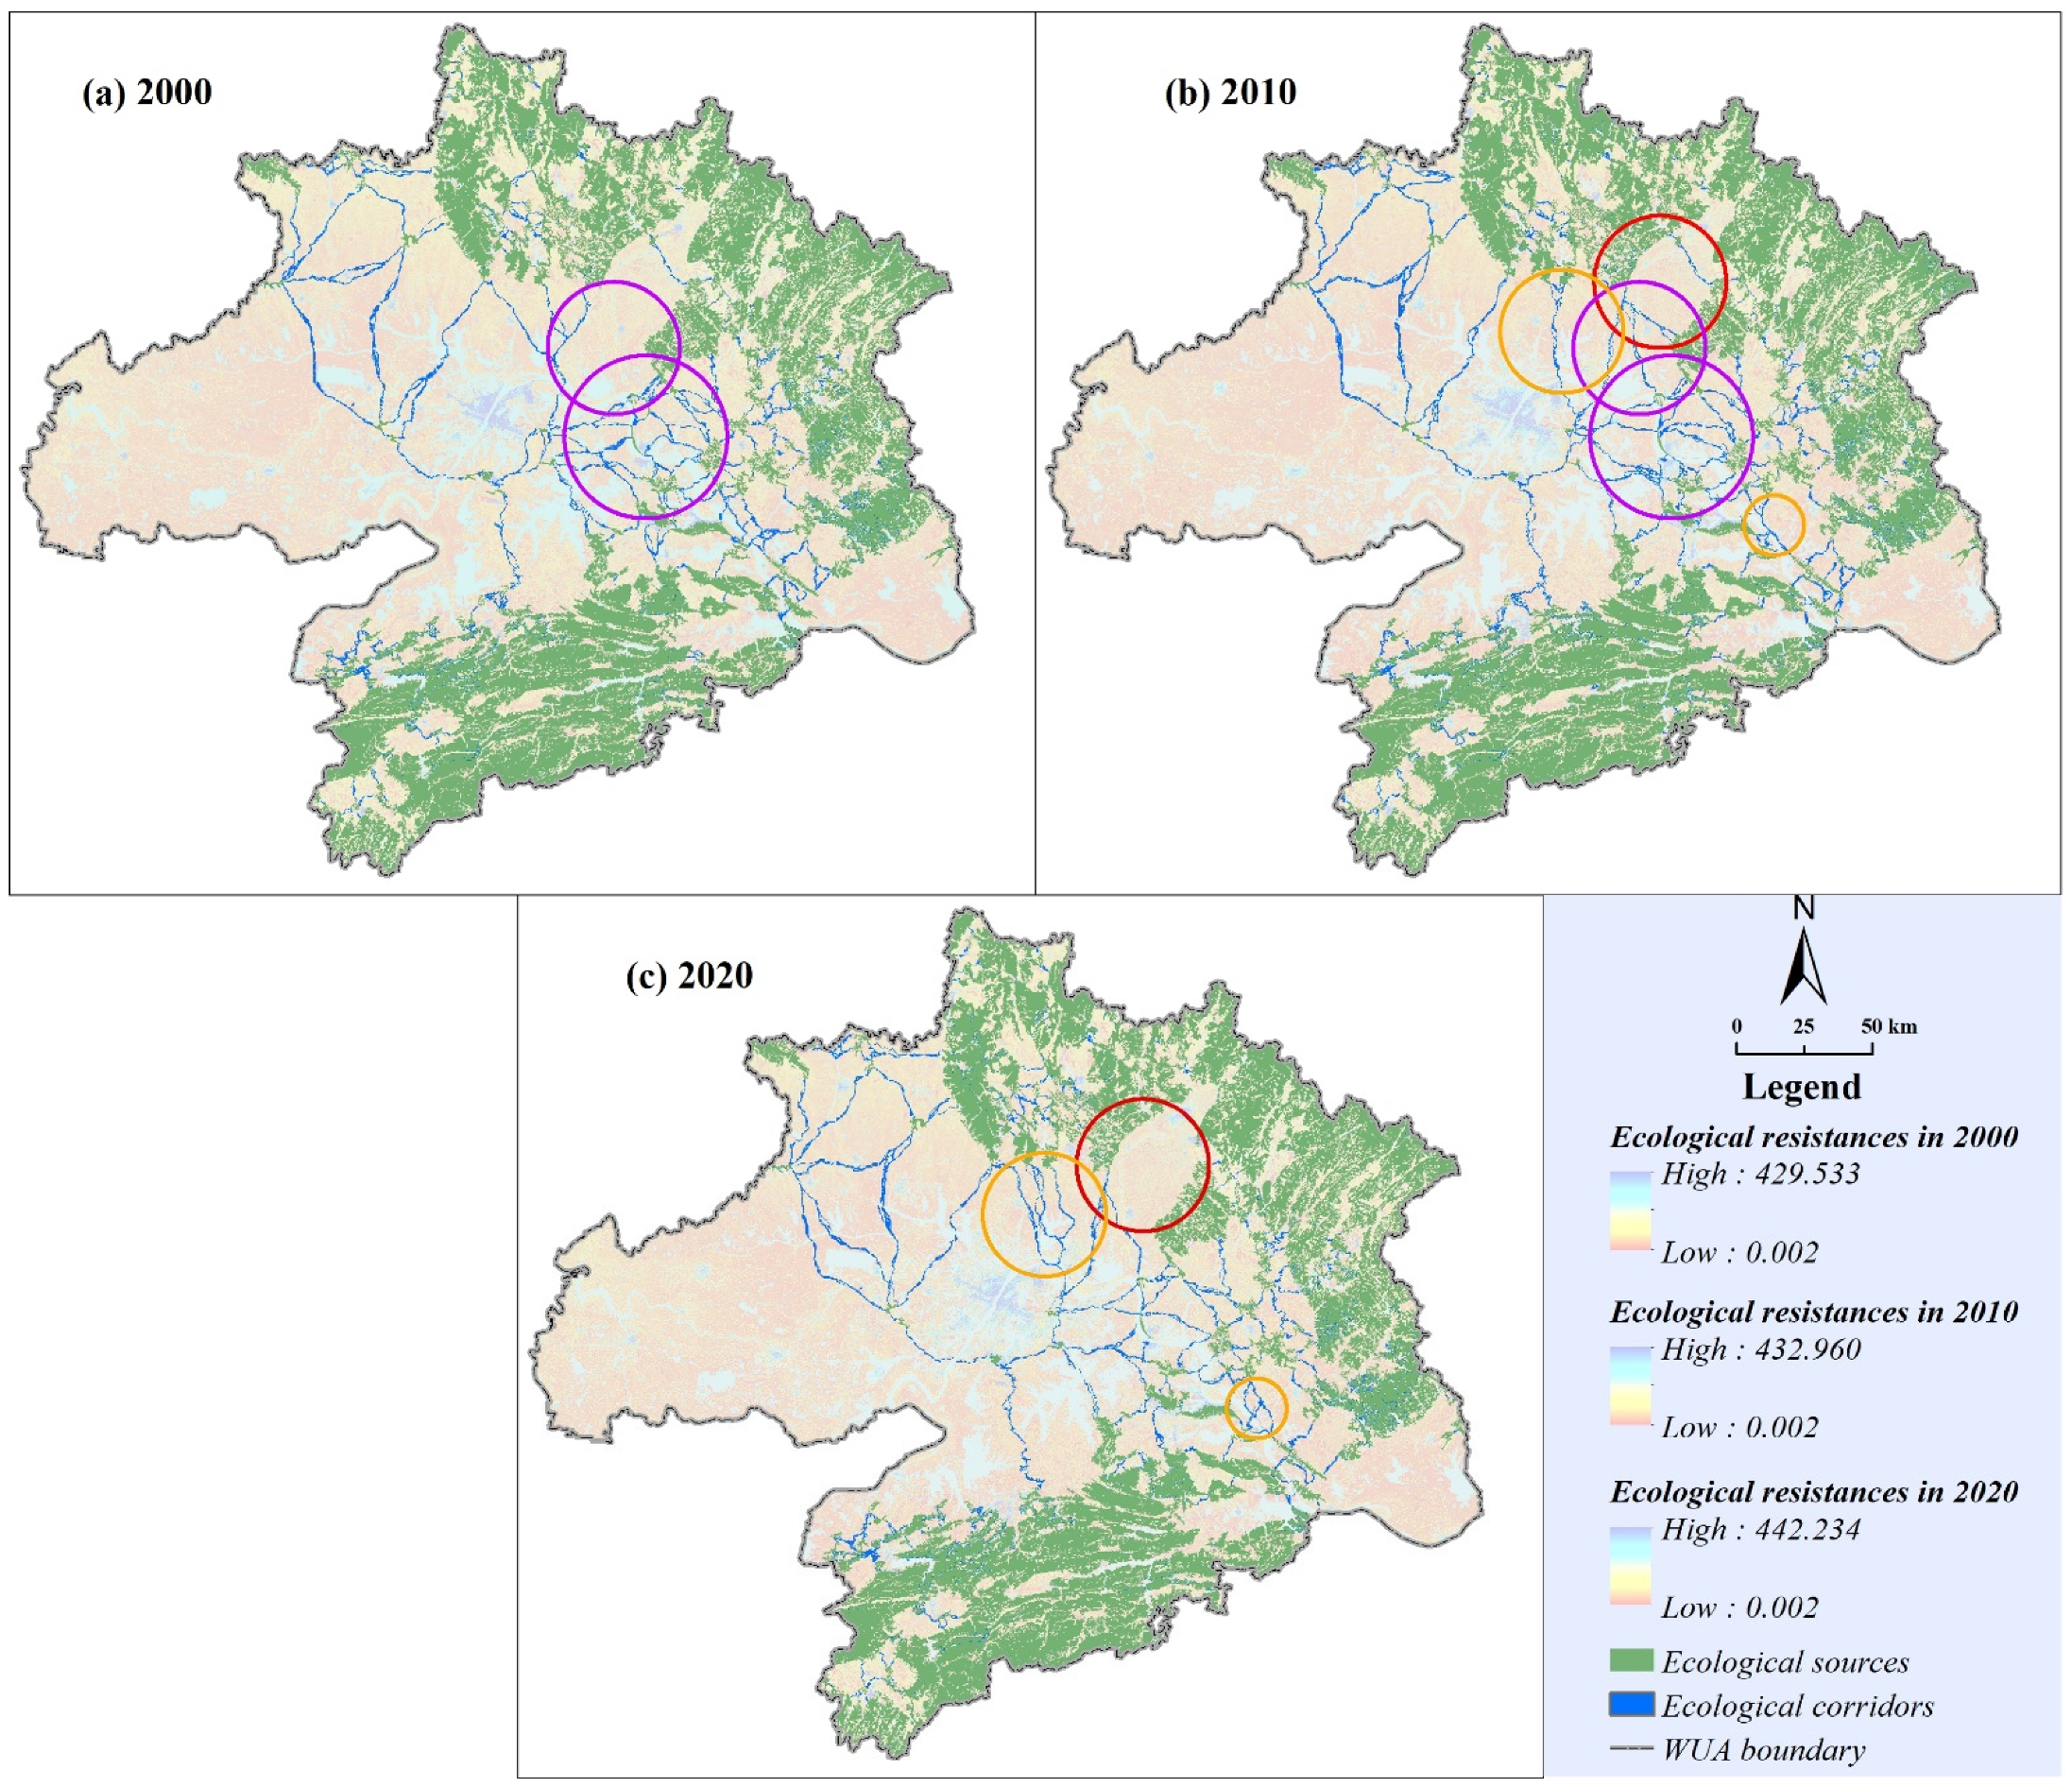
3.1. Spatial–Temporal Evolution of ENs

Ecological sources of WUA were mainly distributed in the northern and northeastern Dabie Mountains and Southern Mufu mountains (Figure 5), which was consistent with the spatial distribution reported in paper [48]. There was no great change in the spatial distribution pattern of ecological sources from 2000 to 2020. However, the total area of ecological sources decreased from 14,922.64 km2 to 14,843.44 km2 and then to 14,659.47 km2. Forests accounted for an extremely high proportion of inflow ecological sources from 2000–2020 (Table 1). Meanwhile, forests accounted for a relatively high proportion of outflow ecological sources (Table 1). This phenomenon is due to the fragmentation of local forests, which makes it difficult to accumulate into large-scale ecological sources. It also can be found that about 36.34% and 52.75% of outflow ecological sources turned to farmlands or construction lands, respectively, from 2000 to 2010 and from 2010 to 2020 by overlaying the data of ecological sources in different years (Table 1). High-value areas of ecological resistance of WUA were mainly distributed in the main urban areas of Wuhan and the central urban areas of all counties (Figure 5). With the rapid expansion of urban areas, the high-value range of ecological resistance gradually spread to the periphery from 2000 to 2020. In the past two decades, the ecological resistance value also increased significantly, and the mean resistance increased from 32.66 to 35.32.
The spatial scope of ecological corridors was determined according to the ecological sources and ecological resistance surface (Figure 5). In terms of scale, the total area of ecological corridors was 3170.44 km2, 3617.08 km2, and 3487.99 km2, respectively (Table 2) in 2000, 2010, and 2020. In terms of composition, the proportion of forest in ecological corridors increased from 71.60% to 75.34%, and the proportion of farmland decreased from 25.43% to 21.84%, from 2000 to 2020 (Table 2). This phenomenon showed that the proportion of pure natural habitat in ecological corridors has increased significantly, which benefits from the implementation of ecological protection policies. In terms of distribution, ecological corridors of WUA were widely distributed, which effectively connect the important ecological sources of the Mufu mountains and Dabie Mountains. The distribution of ecological corridors extracted in this study was generally consistent with that reported in papers [14,48]. However, there were great differences in the density of local corridors, which was mainly due to the difference in the screening threshold of ecological sources. The shape of ecological corridors in the central region of WUA tended to be straight from 2000 to 2010 (purple circles in Figure 5a,b), which benefits from the significant increase of vegetation coverage and the reduction of cumulative resistance in these areas. The number of corridors in the yellow circles of Figure 5b,c increased significantly from 2010 to 2020, which provided multiple alternative channels for species migration. However, two important corridors were lost between the large-scale sources in the northern Dabie Mountains (red circles in Figure 5b,c).

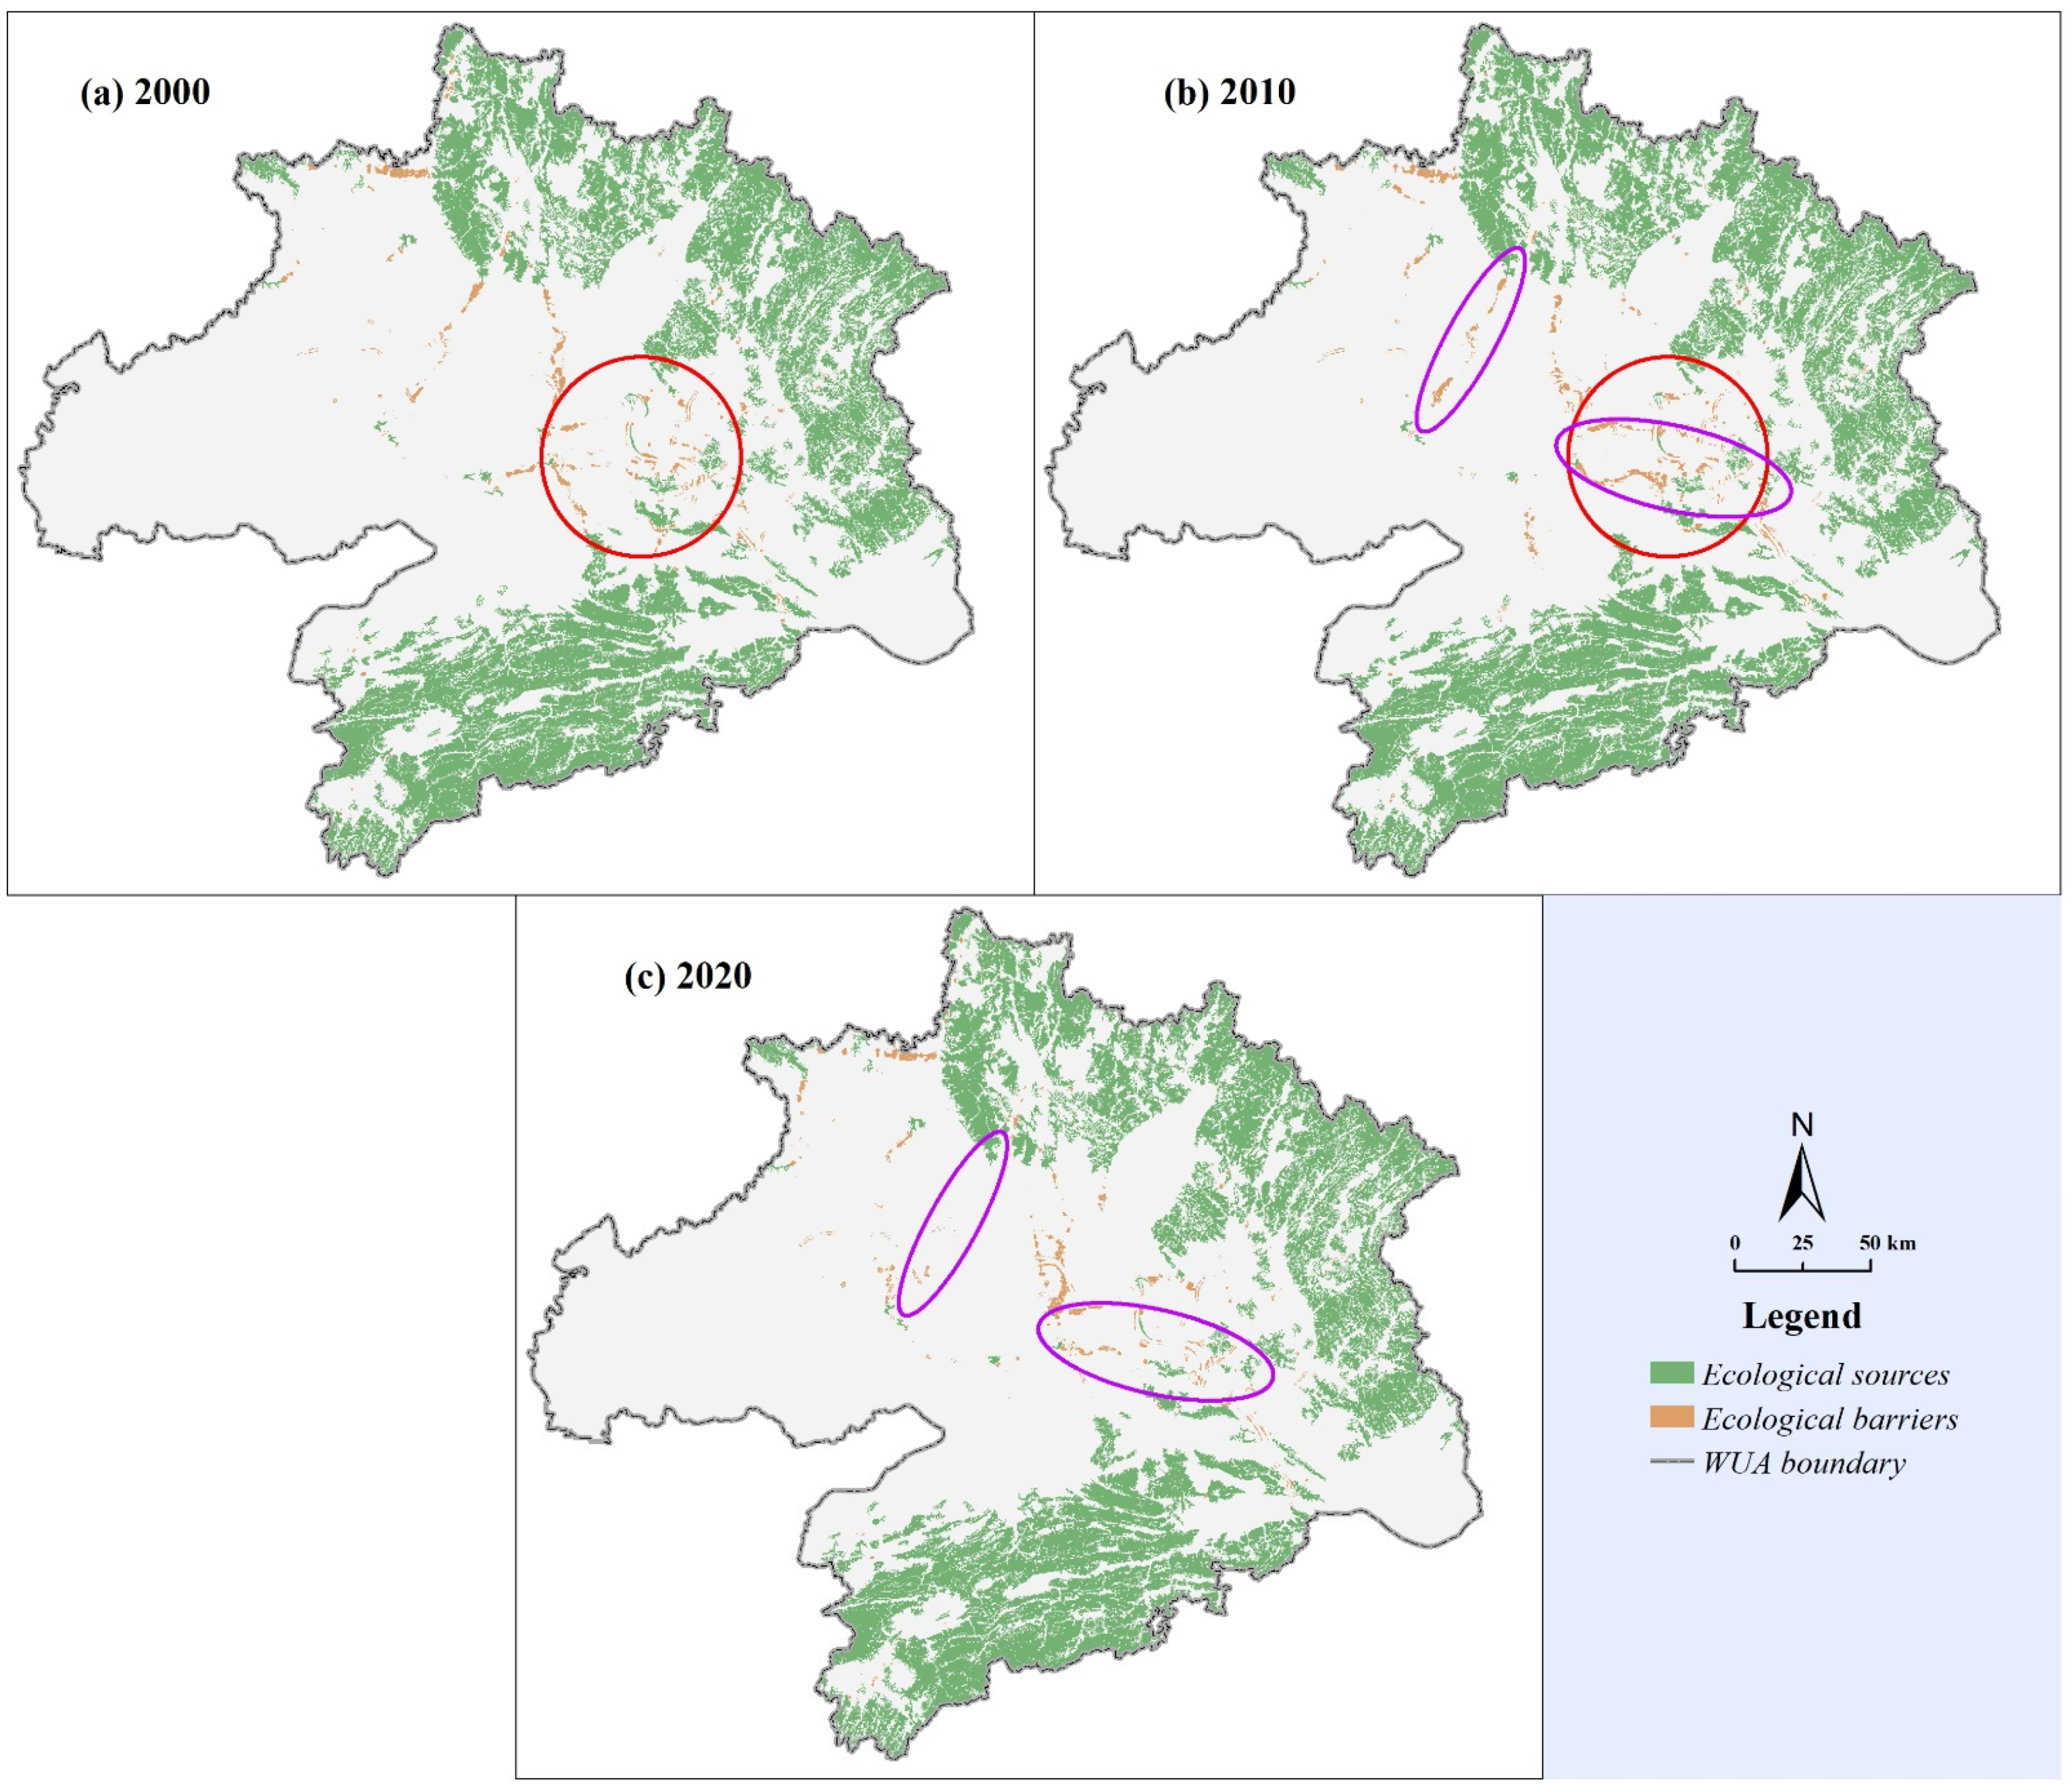
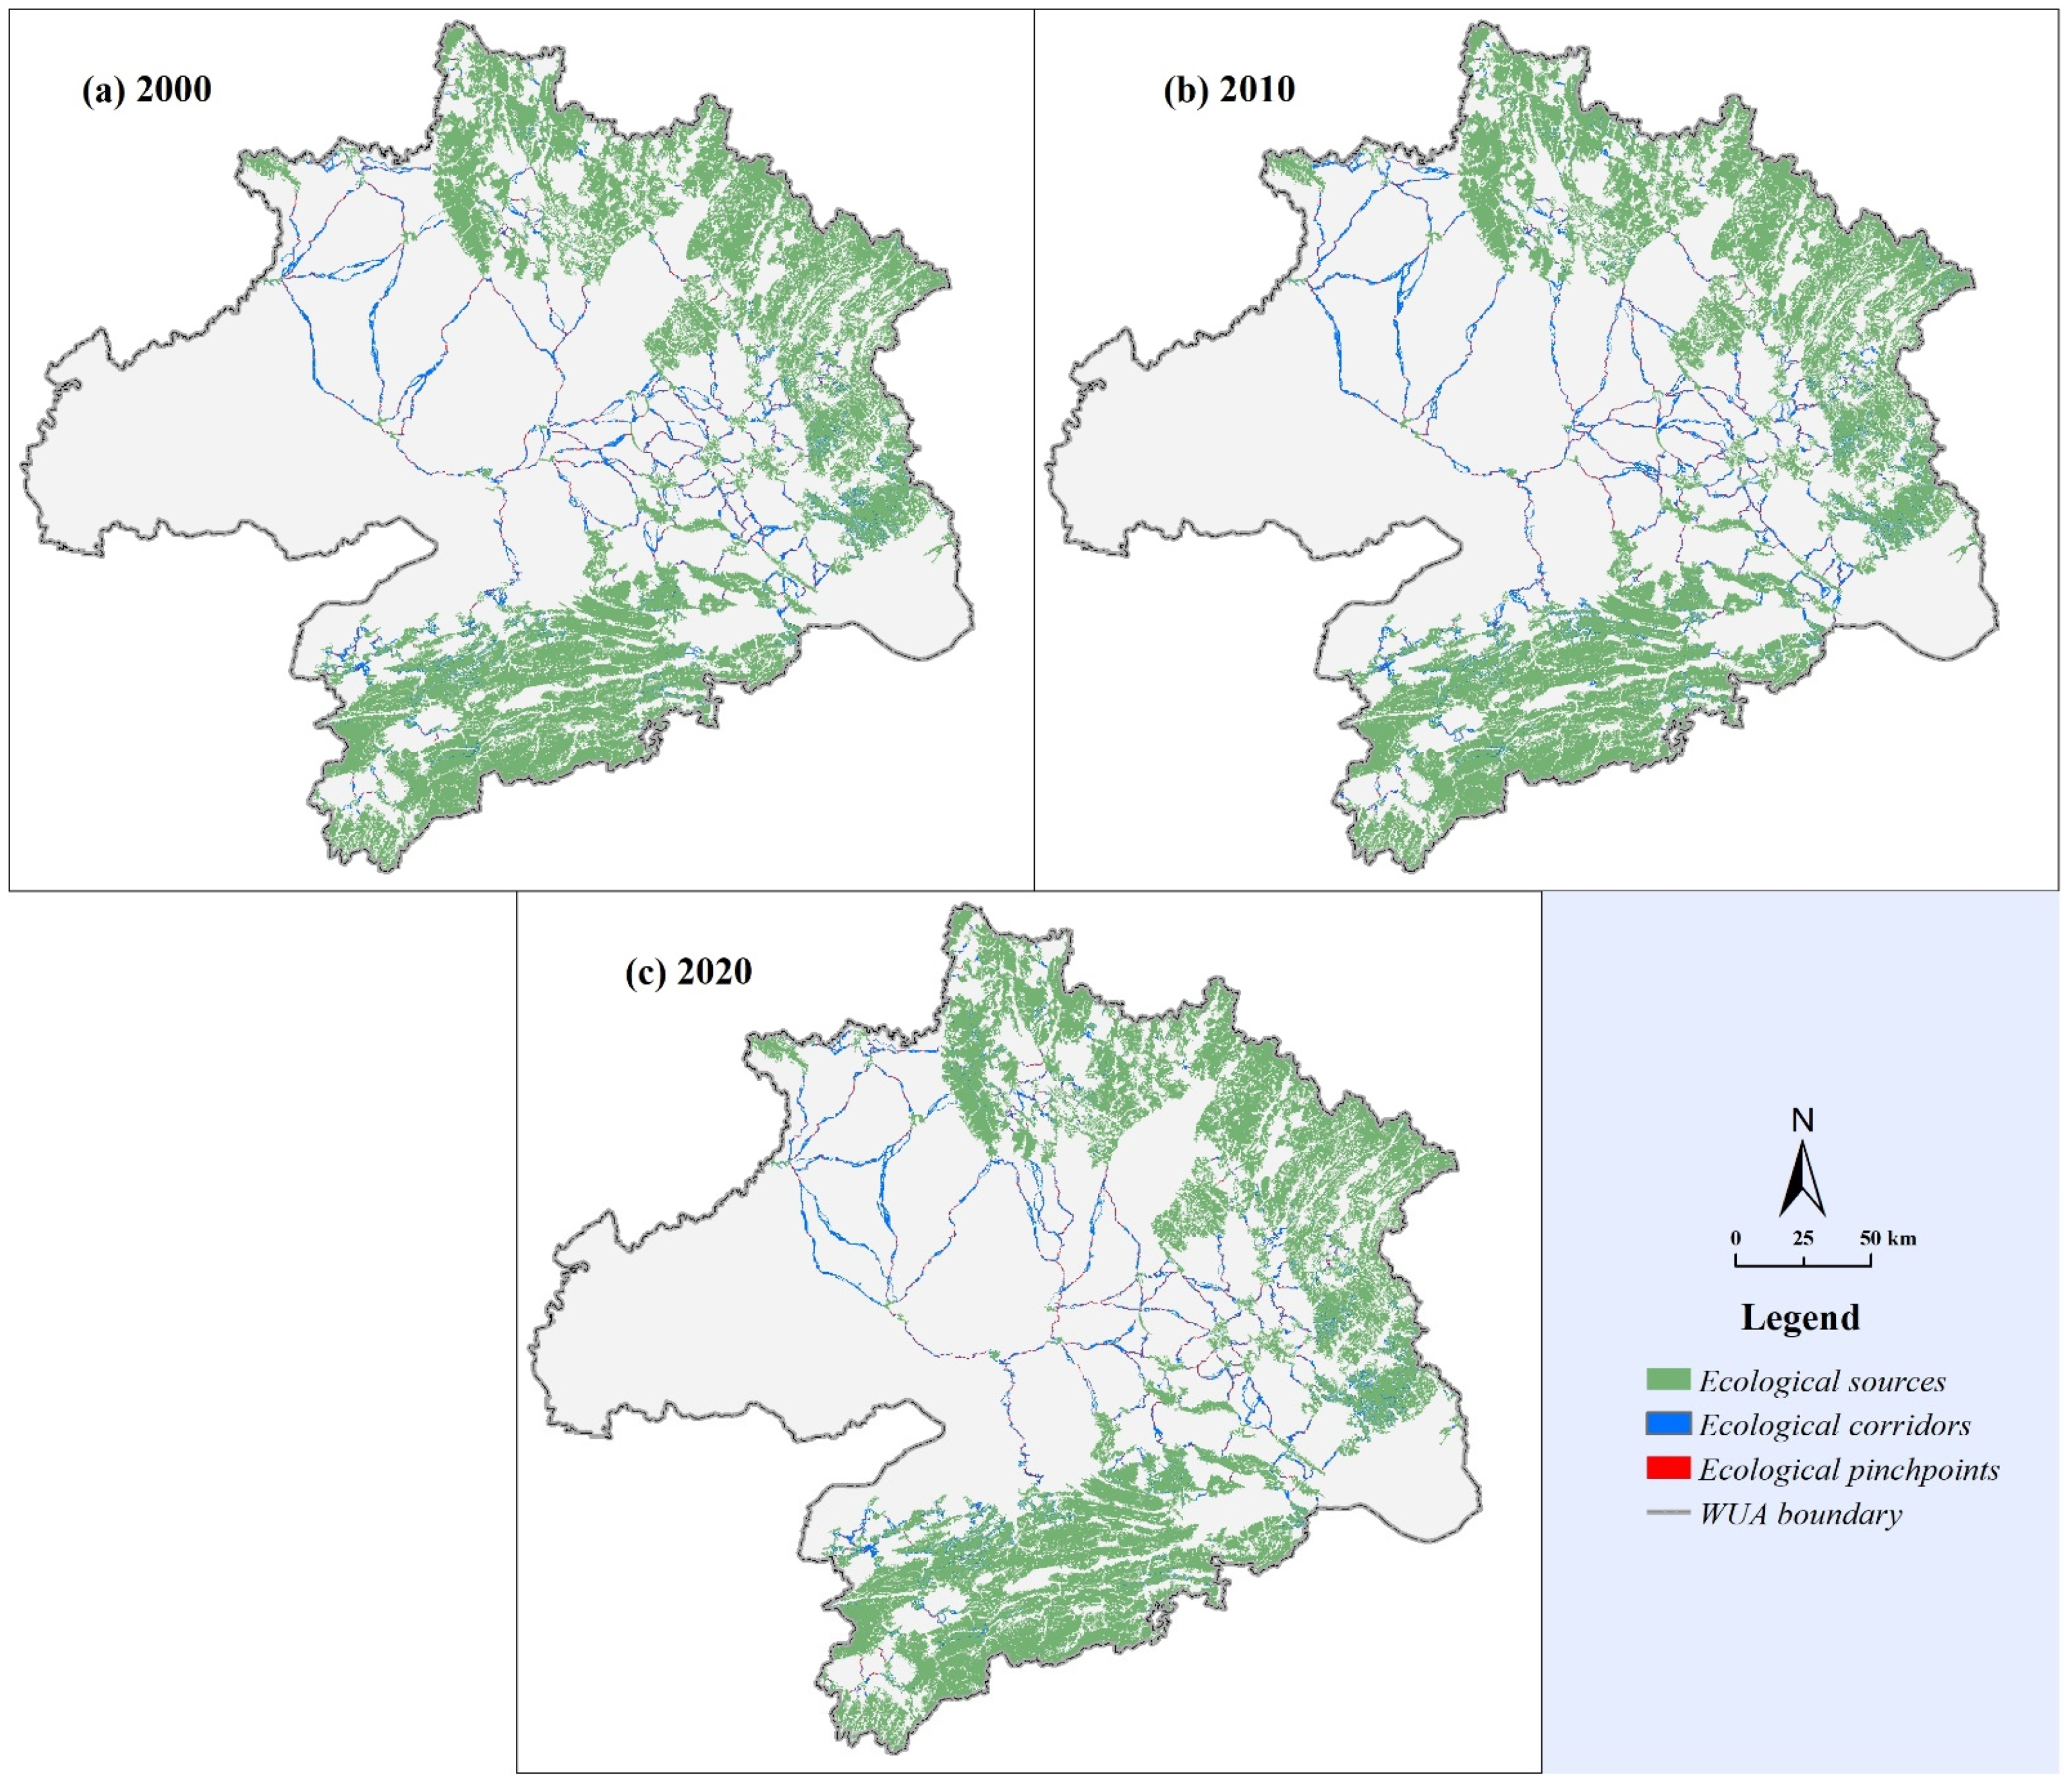
3.2. Quality Evaluation of ENs

Ecological barriers refer to the non-habitats that hinder the ecological flow in the ecological corridors, which leads to the detour or meander of ecological corridors [34] (see more details in Appendix C for verification of quality defects for ENs). Ecological barriers of WUA were identified according to the cumulative current recovery value. In terms of scale, the scale of ecological barriers showed a trend of increasing first and then decreasing from 2000 to 2020 (Table 3). In terms of composition, ecological barriers were mainly composed of farmlands and construction lands, accounting for about 90% of the total area of barriers. The proportion of farmlands among ecological barriers decreased from 83.25% to 74.25% and the proportion of construction lands increased from 10.09% to 17.33% from 2000 to 2020 (Table 3). In terms of distribution, ecological barriers of WUA were mainly distributed in the east of Wuhan, the north of Xiaogan, and the junction of Ezhou and Huanggang (Figure 6). Impervious surfaces or farmlands in these areas were densely distributed, resulting in broken and rugged ecological corridors passing through ecological obstacles. The distribution of ecological barriers in the east of WUA became more and more intensive from 2000 to 2010 (red circles in Figure 6a,b), which indicates that the ecological corridors in this area were greatly threatened by urban expansion. The scope of ecological barriers in purple ellipses of Figure 6b,c has shrunk significantly from 2010 to 2020, indicating that the implementation of ecological protection policies has effectively blocked the diversion of ecological corridors caused by non-habitat erosion.
Ecological pinchpoints refer to the narrow parts of ecological corridors, which are the bottleneck and irreplaceable areas of species migration [33] (see more details in Appendix C for verification of quality defects for ENs). Pinchpoints in the ENs of WUA were identified according to the current density. Figure 7 shows that pinchpoints are usually located in ecological corridors around the built-up area. When ecological corridors crossed built-up areas, they were often squeezed into narrow and irreplaceable channels by dense impervious surfaces. Pinchpoints are vulnerable to erosion, which will lead to the fracture of ecological corridors and the stagnation of biological flow. The total area of ecological pinchpoints is about 222 km2 without significant fluctuation from 2000 to 2020. Ecological pinchpoints are the self-attributes of ecological corridors, and the change of their spatial distribution is also synchronized with ecological corridors.

3.3. Functional Evaluation of ENs

Between centrality and closeness centrality measure the transit function and relative accessibility of nodes in the network, respectively. Straightness centrality reflects the access efficiency between nodes and other nodes [60,61,62].
ENs with three high centrality indexes were mainly distributed in the southern Mufu mountains (Figure 8, Figure 9 and Figure 10). Large-scale virgin forests in these areas provided abundant habitats and accessible corridors for species migration, and the ecological components (nodes and edges) had strong accessibility, accessibility efficiency, and connection functions. The three types of centrality in the central and western regions were extremely low. The central region is the core area of urban development for WUA, while the western region mainly undertakes the function of agricultural production. Large-scale construction and agricultural activities were bound to hinder biological flow, which led to sparse and low-quality ENs. Between centrality and closeness centrality in the north of WUA was relatively high, which means that many habitats and ecological corridors in the northern Dabie Mountains wove dense ENs. Meanwhile, large-scale drylands and forests in the Dabie Mountains were intertwined, and the cumulative resistance of ecological corridors passing through them was also relatively high, resulting in relatively low straightness centrality. Moreover, it can be observed that the three centrality indexes show a very uncoordinated distribution pattern in the east of WUA. The distribution of small-scale habitats in these areas was dense and compact, resulting in high closeness centrality. However, habitats in these areas were surrounded by farmlands, and the biological flow resistance was relatively high, resulting in relatively low between centrality and straightness centrality.
The overall distribution of three centrality indexes for ENs was relatively stable from 2000 to 2020, and there are some performance changes in local areas. Due to the erosion of ecological sources and the reduction of vegetation coverage, two ecological corridors with high closeness centrality have been lost in the northern Dabie Mountains (Figure 9). In addition, between centrality and straightness centrality of the two corridors in the central region have been significantly improved (Figure 8b,c and Figure 10b,c). These areas were located in the urban–rural fringe, and the composition of land types was relatively complex. However, with the increase of vegetation coverage, the biological flow resistance decreased significantly, which greatly improved the transfer function and access efficiency of ENs.

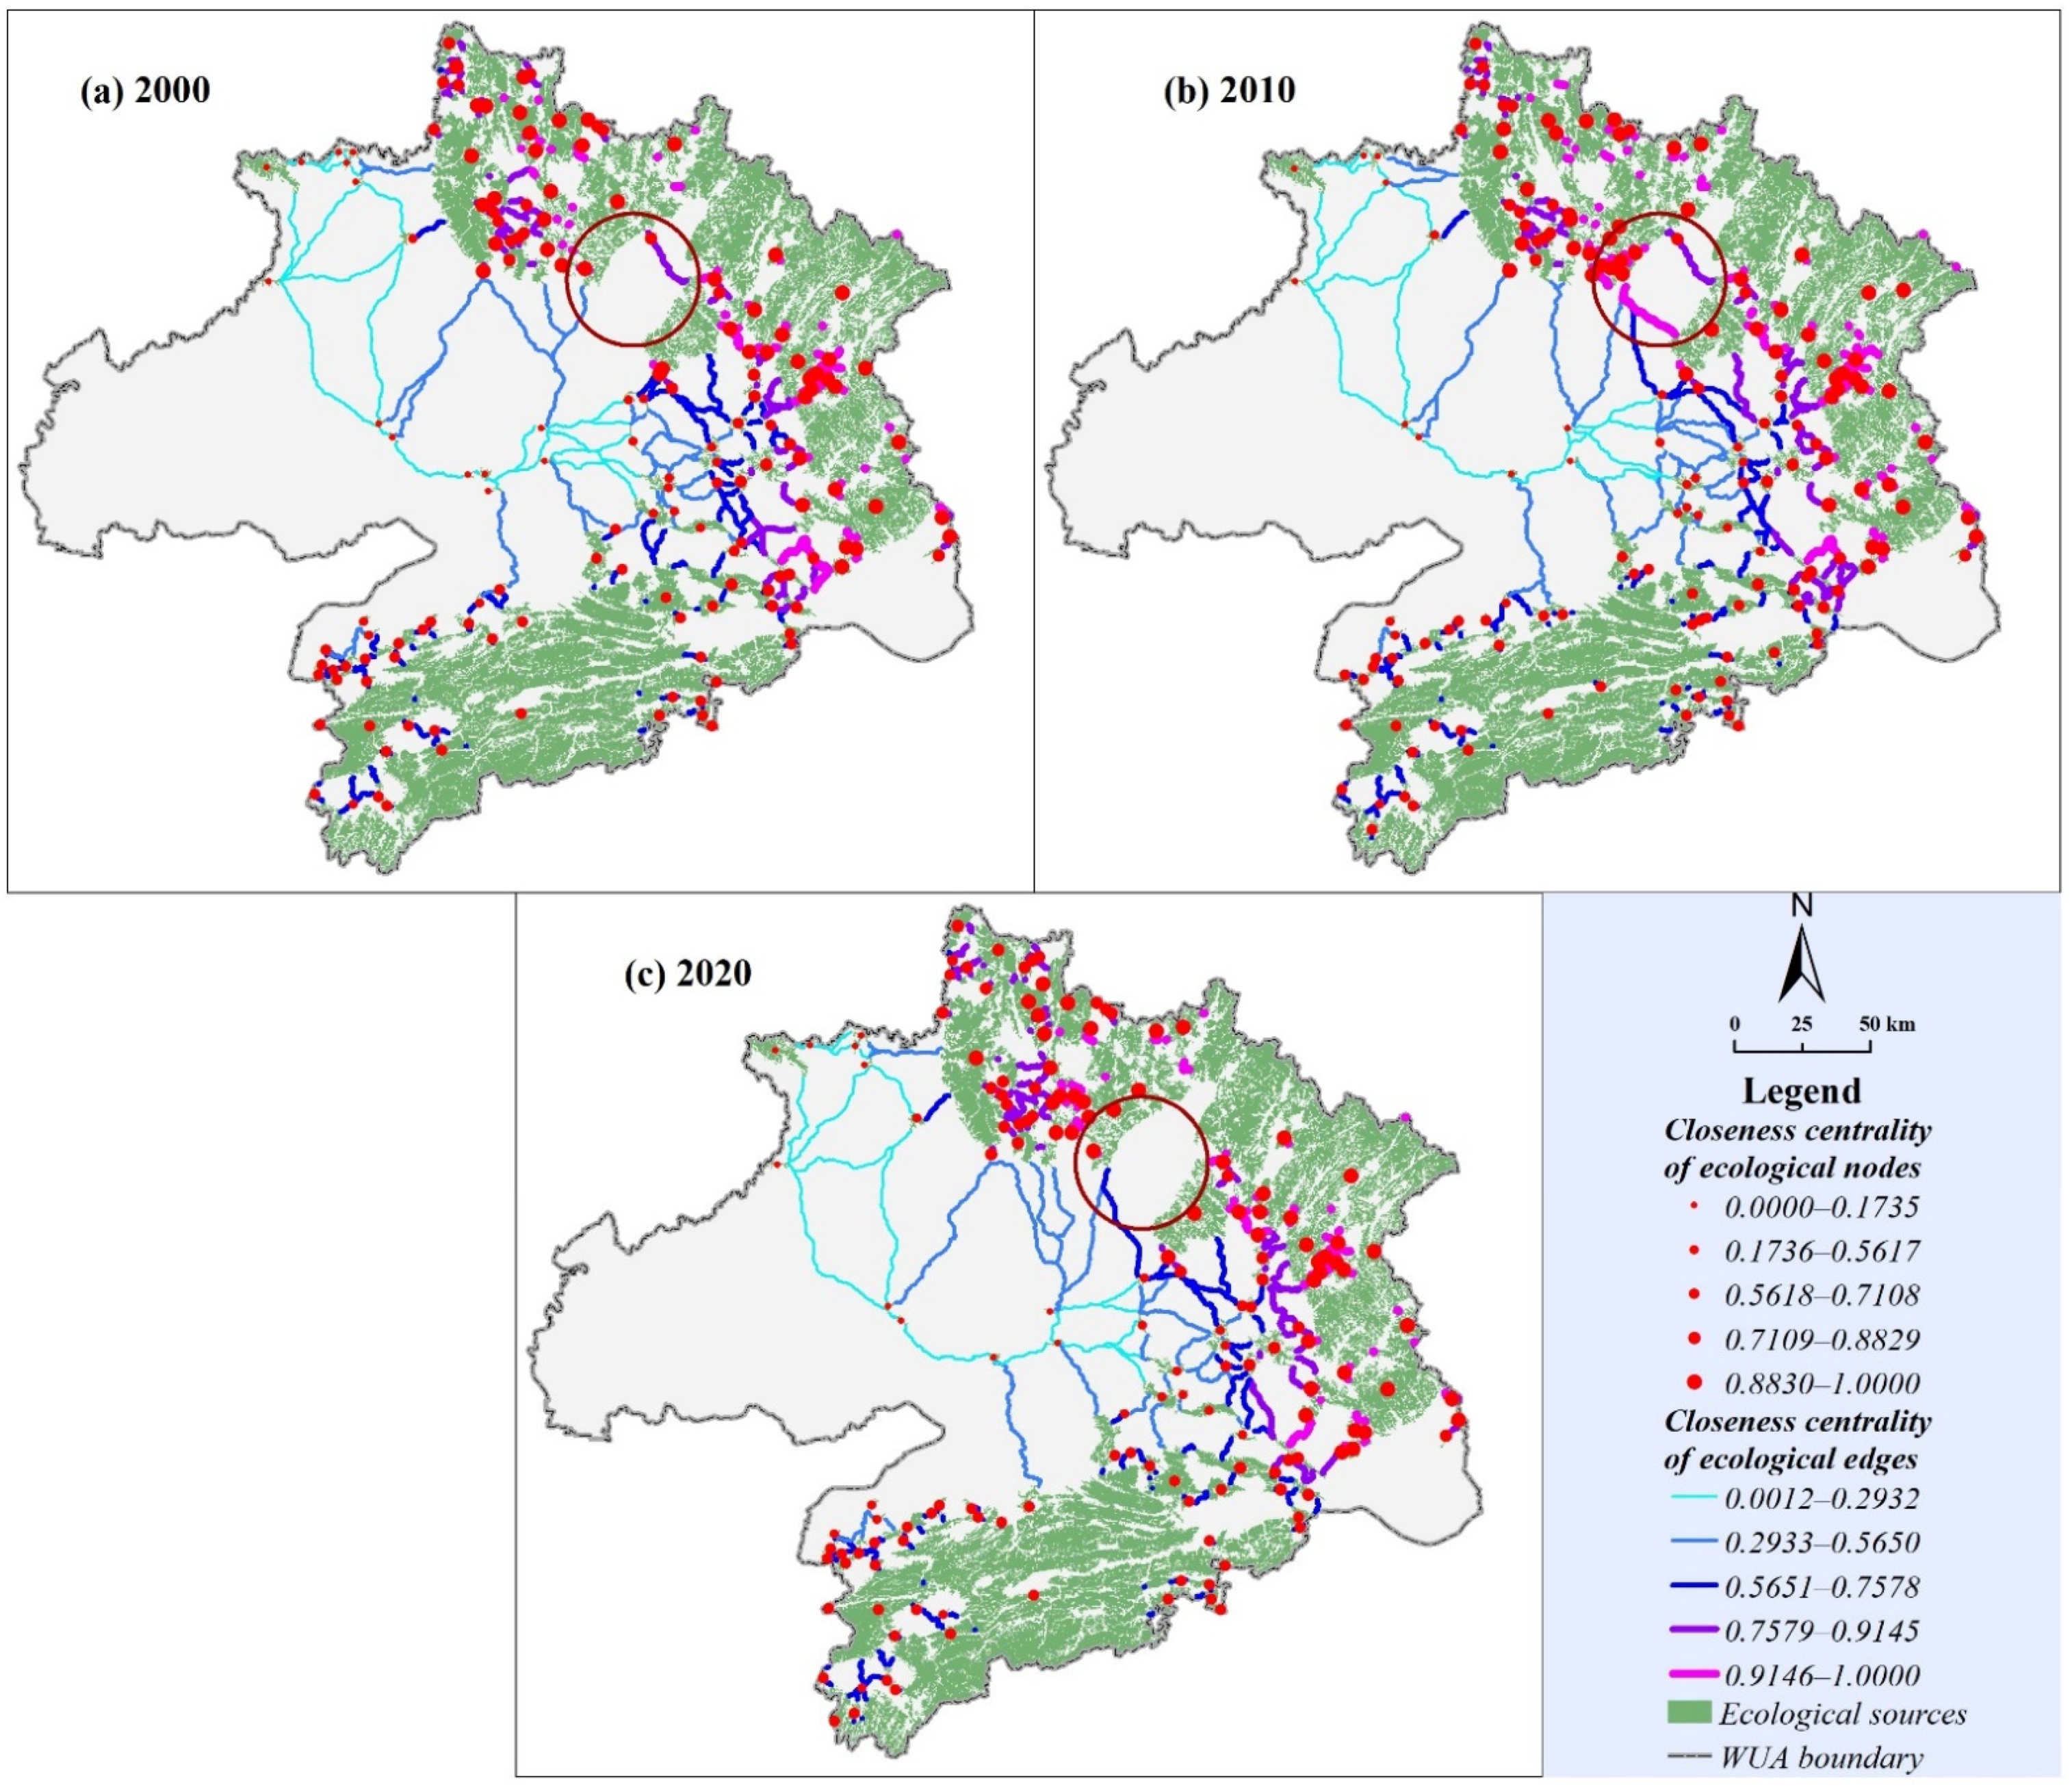
3.4. Structural Evaluation of ENs

According to the recognition result of ENs, two-level ecological communities of WUA were constructed by using the Infomap algorithm and Thiessen polygon. In Figure 11, ecological sources and corridors in the communities of ENs are expressed by ecological nodes and edges. In this study, three primary ecological communities were divided, and 22, 23, and 24 secondary communities were subdivided in 2000, 2010, and 2020, respectively (Figure 11). Primary ecological communities included the ecological sub-region of agroforestry in the north of WUA(EANs), the ecological sub-region of agroforestry in the northeast of WUA(EANEs), and the ecological sub-regions of Mufu mountains in the south of WUA(EMSs). EANs and EANEs covered part of the Dabie Mountains, respectively, indicating that there are weak areas of ecological connectivity in the Dabie Mountains. EANs and EANEs also covered high-quality farmlands in the northeast and central parts of WUA, respectively, which indicates that the forest and farmland ecosystem in these areas were strongly connected. EMSs covered large-scale virgin forests and connecting corridors in the south of WUA. The scope of EANs changed slightly from 2000 to 2020. EANEs showed a trend of shrinking to the north, while EMSs showed a trend of expanding to the north, which means that the ecological connectivity between the farmland ecosystem in the central part of WUA and the Dabie Mountains was weakened, and the connectivity with Mufu mountains was gradually strengthened.
According to the recognition result of ENs, the backbone structure of ENs for WUA was identified by using the Prim algorithm. In Figure 12, the backbone structure of ENs is expressed by ecological nodes and edges (abstract ecological sources and corridors). The blue and purple thick lines represent the main trunk with high comprehensive centrality and the secondary trunk with high comprehensive centrality, respectively (Figure 12). The main trunk of WUA was a fully connected network, which was widely distributed in various regions and played an important role in effectively connecting the habitat patches in the whole region. In 2000, 2010, and 2020, the edge number of the main trunk was 155, 160, and 159, respectively. Since the remaining ENs, except the main trunk, were not fully connected networks, the identified secondary trunks of WUA were the minimum spanning tree of each sub-network. In 2000, 2010, and 2020, the number of secondary trunks was 16, 16, and 15, respectively, and the edge number of secondary trunks was 114, 118, and 115, respectively. Secondary trunks were the supplement of the main trunk, which were mainly distributed in the middle of WUA. This indicates that the accessibility of ENs in the middle was relatively high, that is, there were abundant alternative routes for species migration. The main trunk in the northern Dabie Mountains and the southern Mufu mountains was developed, while the secondary trunk was sparse, which means that ENs in these areas were dense and important, but there was a lack of alternative ecological paths.

4. Discussion

4.1. Enlightenment from the Evolution of “Quality–Function–Structure” for ENs

4.1.1. Spatial–Temporal Response of Global ENs to Land Development

Global ENs had significant spatial and temporal responses to land development activities, which was mainly reflected in the spatial distribution and evolution of ENs. Affected by the distribution of natural habitats and land development, the distribution pattern of ENs was often extremely uneven (Figure 5) [35,69]. In this study, we found that ENs of WUA were mainly large-scale virgin forests distributed in the northern Dabie Mountains, the southern Mufu mountains, and between them, which was consistent with previous studies [46,48]. Moreover, it was observed that there were large-scale ecological blind zones in the west of WUA and Wuhan. The west of WUA is dominated by agricultural production, and the distribution of farmland is extremely intensive. Wuhan is the core city of Hubei Province and even the Yangtze River economic belt, where urban construction activities are extremely active. Intensive land development activities led to the lack of large-scale ecological sources, resulting in ecological blind zones. However, we argue that ecological blind zones have an obvious scale effect. Scale effect refers to the fact that research results will be different when the spatial unit used for analysis changes [70,71]. In this study, 100 m × 100 m raster was the suitable scale for the study of ecological blind zones in WUA. However, small and medium-sized agroforestry ENs and urban green infrastructure can be identified on a finer spatial scale, which can play a transmission role as the capillary of ENs.
Furthermore, we found that land development activities were an important driving force for the evolution of ENs. It can be found that forests accounted for a relatively high proportion of outflow ecological sources and about 36.34% and 52.75% of outflow ecological sources turned to farmlands or construction lands, respectively, from 2000 to 2010 and from 2010 to 2020 (Table 1). This means that forest fragmentation, agricultural expansion, and urban sprawl were important inducements leading to the shrinkage of ecological sources. Although farmland is not suitable for large-scale species habitats, the proportion of farmland in the composition of ecological corridors exceeded 20% from 2000 to 2020 (Table 2). This indicates that the farmland ecosystem has a certain function of carrying species migration in ENs. Moreover, we also observed that there were two main reasons for the loss of ecological corridors in the past two decades. On the one hand, transitional urban expansion and agricultural reclamation increased the resistance to species migration, which led to qualitative changes and even fractures of ecological corridors. On the other hand, the loss of ecological sources made the existence of ecological corridors meaningless (red circles in Figure 5b,c). This means that the loss of ecological sources was relatively destructive, and the loss of ecological corridors was more likely.

4.1.2. Spatial–Temporal Response of Local ENs to Land Development

Local ENs had significant spatial and temporal responses to land development activities, which was mainly reflected in the evolution of the quality, function, and structure of ENs.
First, we argue that quality defects of ENs often stem from the antagonism between ecological corridors and land development. This view was proved by the fact that ecological barriers and pinchpoints were mainly distributed in the middle of WUA, with relatively developed urbanization, and the north, with relatively developed agriculture (Figure 6 and Figure 7). Ecological barriers were often expressed as planar (farmlands, residences, etc.) or linear features (roads, railways, etc.). The proportion of low-quality farmlands in the composition of ecological barriers all exceeded 74% from 2000 to 2020 (Table 3). Meanwhile, the proportion of construction lands in the composition of ecological barriers increased from 10.09% to 17.33% (Table 3), indicating that ecological corridors were increasingly threatened by urban sprawl. Ecological pinchpoints were narrow sections of ecological corridors squeezed by construction lands or low-quality farmlands [33]. The situation of ecological pinchpoints had not improved significantly from 2000 to 2020. As the bottleneck of ecological corridors, ecological pinchpoints are likely to cause the rupture of ecological corridors and eventually lead to ecological barriers. Therefore, we draw an extended conclusion that the difference between ecological pinchpoints and barriers lies in the threat of land development to ecological corridors, and ecological pinchpoints are the precondition for the occurrence of ecological barriers.
Second, it also can be observed that different land development models had different effects on centrality indexes. Simple urban construction or agricultural reclamation had a negative impact on the centrality of ENs, which was demonstrated by the low centrality of all three categories in the middle and west of WUA (Figure 8, Figure 9 and Figure 10). Northern Dabie Mountains were crisscrossed by forests and farmlands, which led to higher cumulative ecological resistance and lower straightness centrality (Figure 10). A large number of ecological sources in the east were surrounded by farmlands, which led to rugged ecological corridors and low between and straightness centrality (Figure 8 and Figure 10). In the past two decades, with the gradual increase of vegetation coverage and the reduction of ecological flow resistance in the middle of WUA, between and straightness centrality of two key corridors have significantly improved.
Finally, it can be found that there was a strong connection between the agricultural and forest ecosystems of WUA. EANs and EANEs were composed of local Dabie Mountains and high-quality farmlands, which shows that these regions have broad prospects for building agroforestry ENs. We argue that the relationship between agricultural and forest ecosystems is dynamic, which was manifested in the antagonism between adjacent ecological communities under the background of land use change. Ecological connectivity between the farmland ecosystem in the middle of WUA and the Dabie Mountains was weakened, and the connectivity with the Mufu mountains was gradually strengthened from 2000 to 2020, which directly led to the occupation of the south of EANEs by EMSs (Figure 11b,c). According to the identification results of backbone structure for ENs, it can be found that the main and secondary trunk of ENs had differential utility. ENs in southern Mufu mountains and northern Dabie Mountains were mostly identified as the main trunk, which means that ENs in these areas were dense and irreplaceable. Land development activities in the middle and east of WUA were relatively active, resulting in the sparse main trunk of ENs. However, dense small-scale ecological sources in these areas contributed to the relatively developed secondary trunks, which provided abundant alternative paths for species migration.

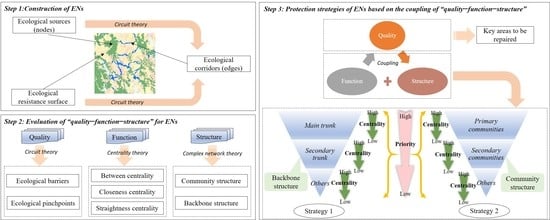
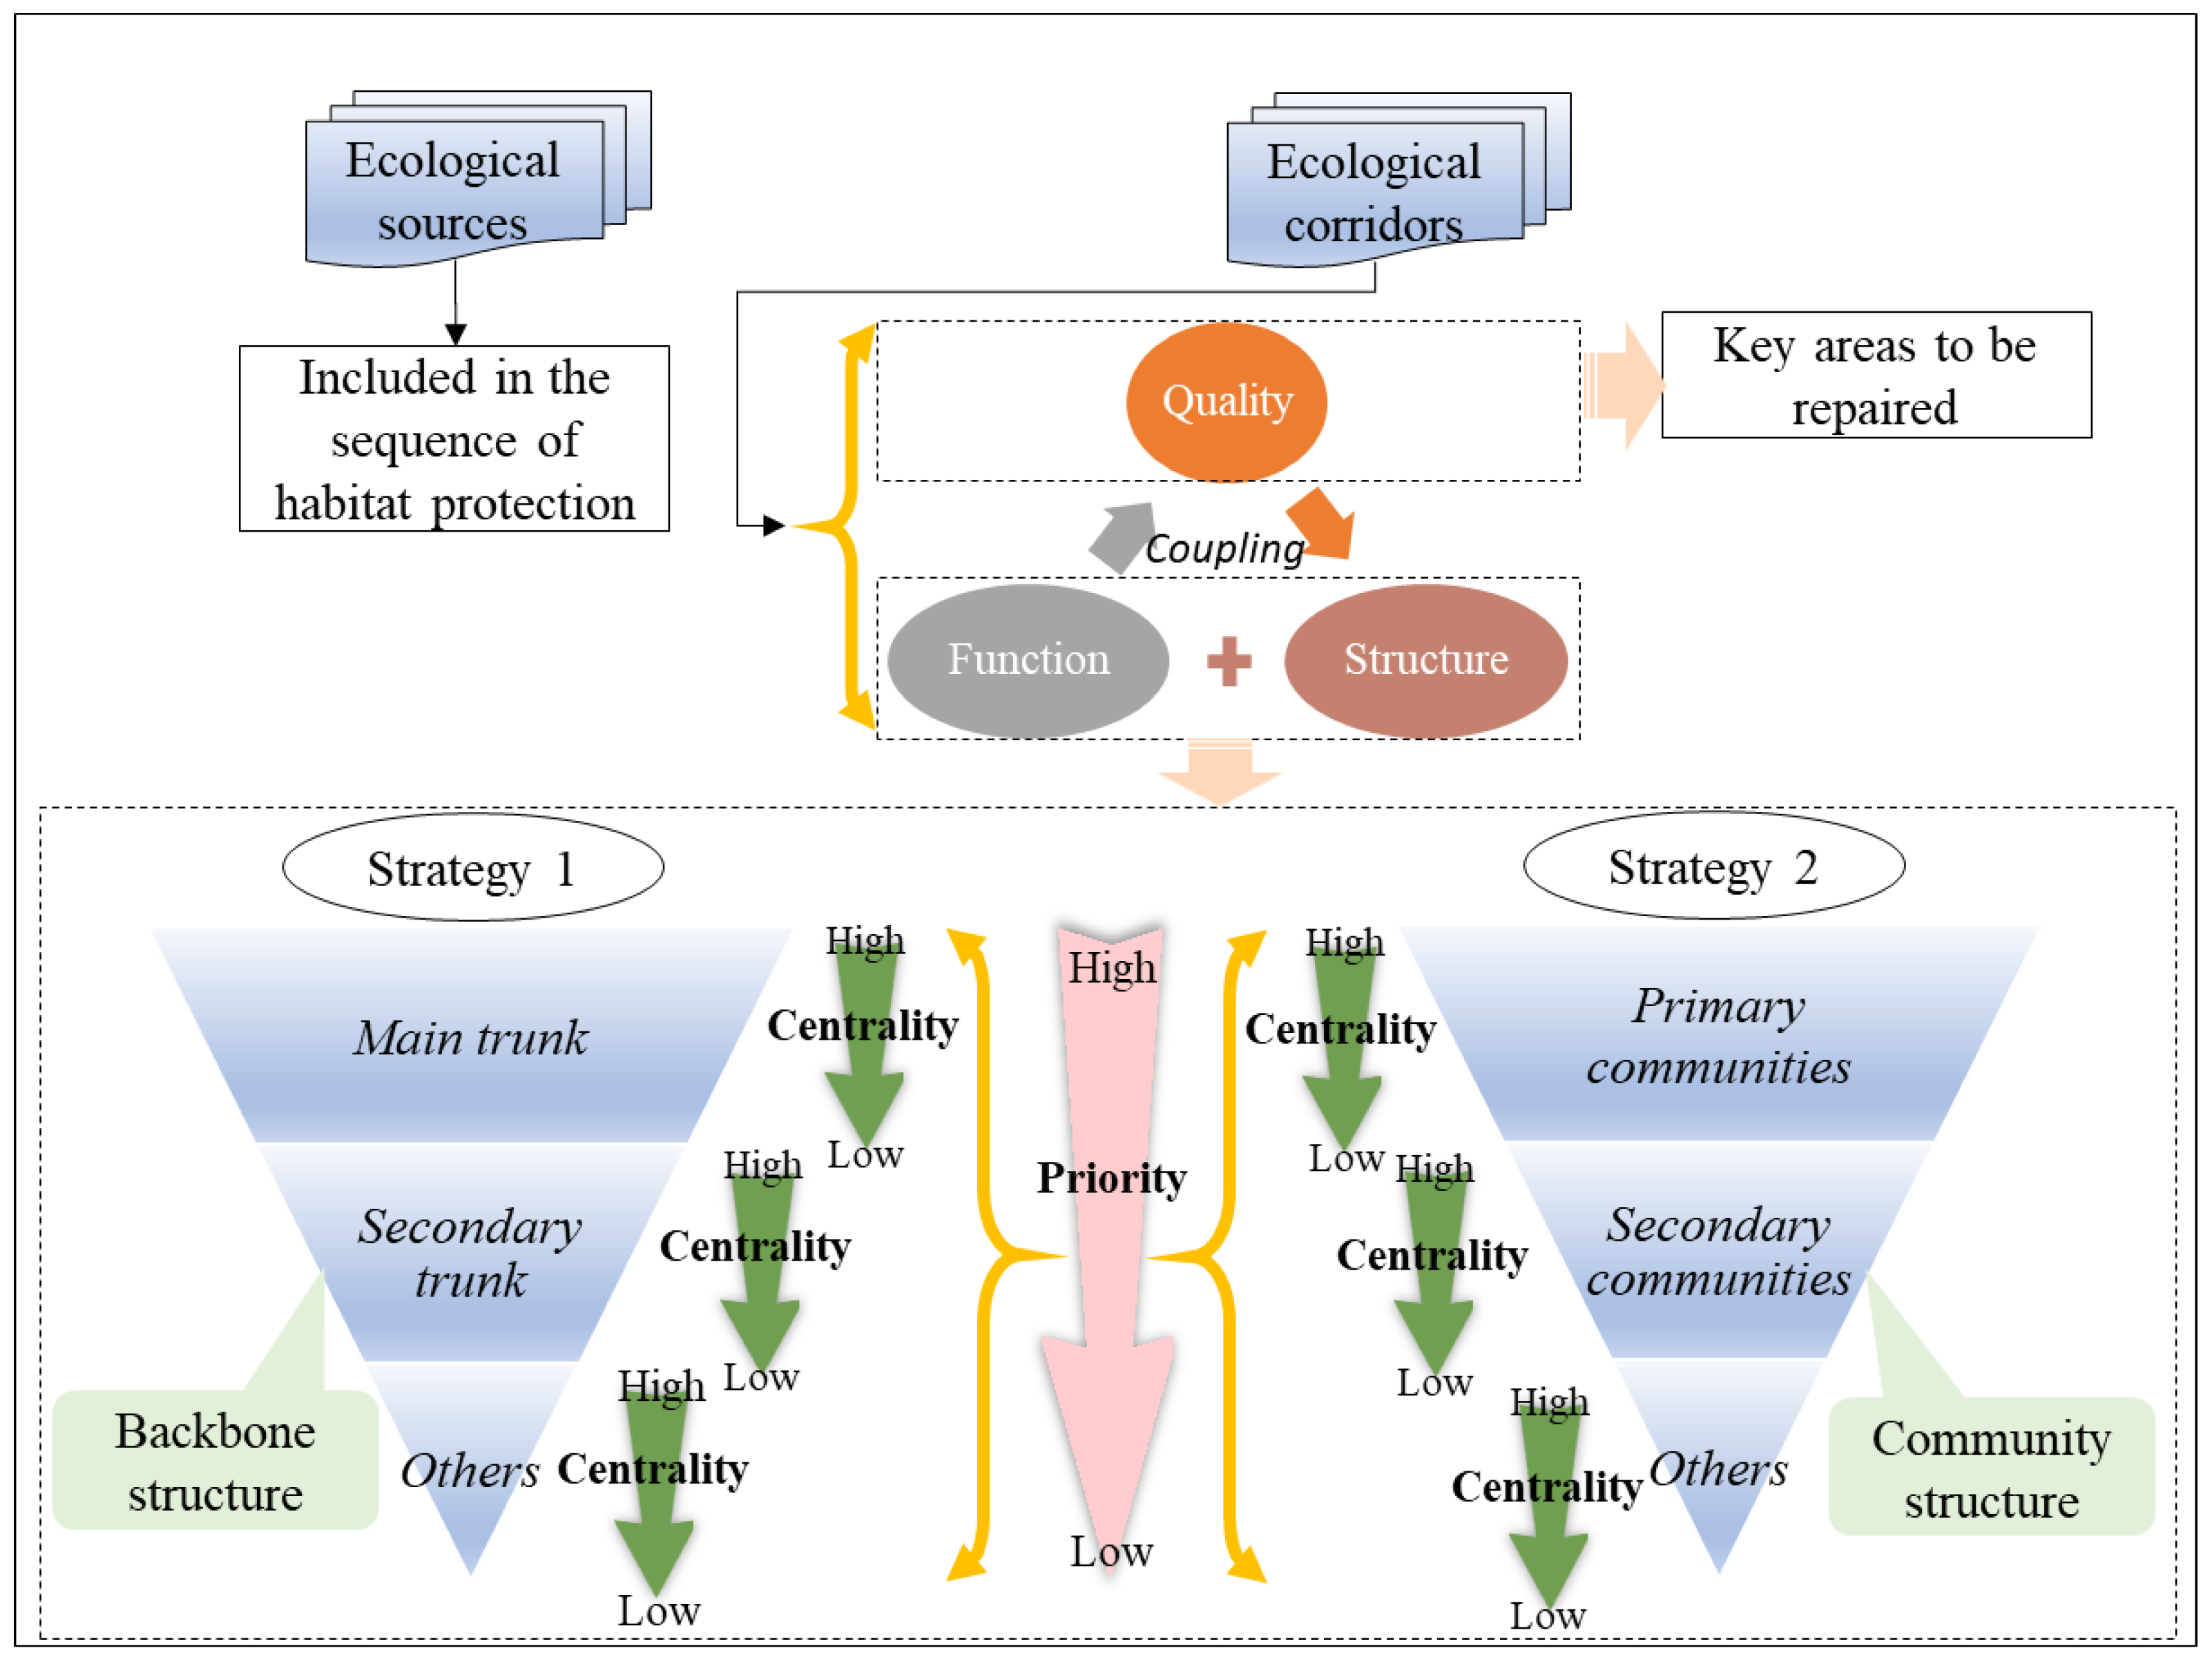
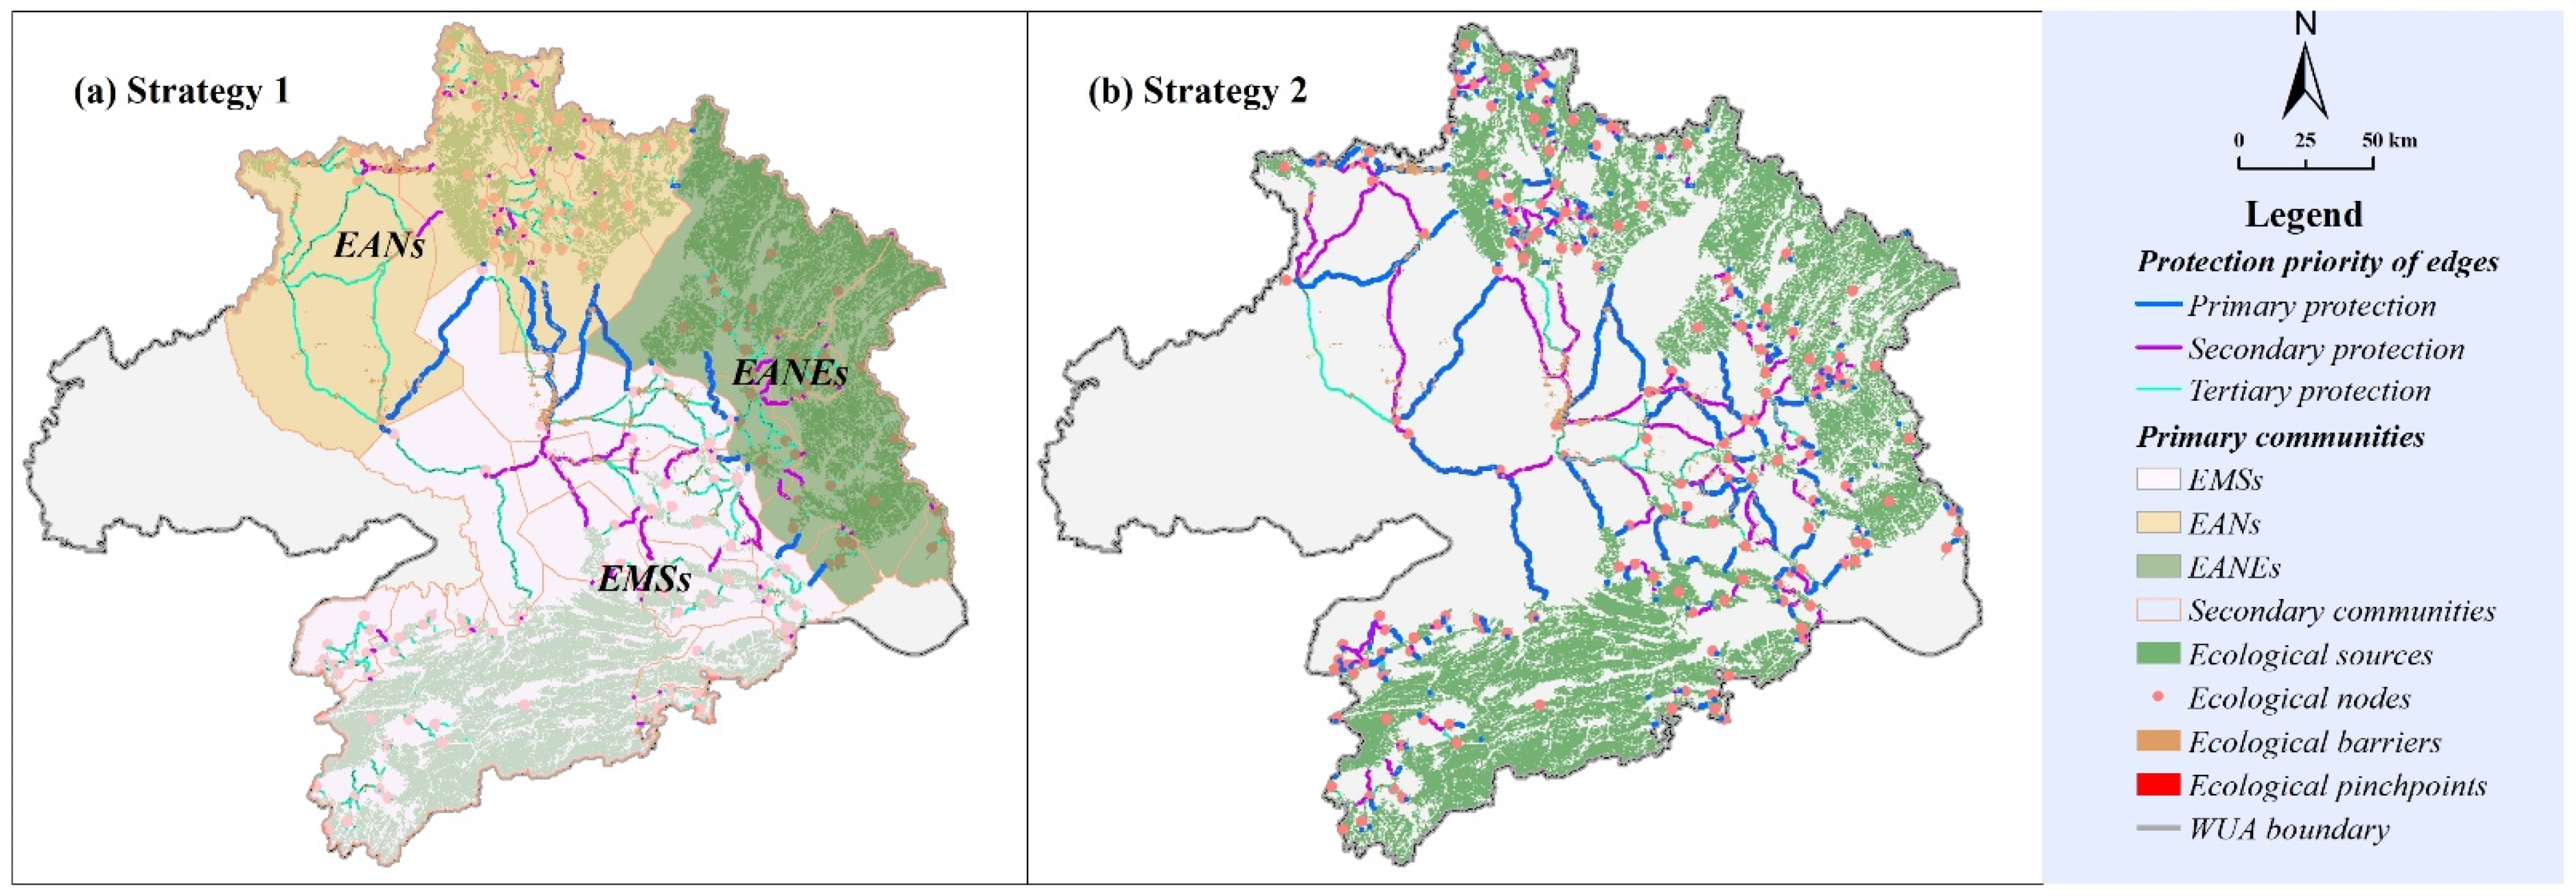
4.2. Protection Strategies of ENs Based on the Coupling of “Quality–Function–Structure”

How to formulate corresponding protection strategies according to the evaluation of ENs? This has become an important issue for planners and policymakers. They expect to guide the orderly connection of ecological sources through proactive planning to ensure the stability of material circulation, energy flow, and information transmission.
Protection strategies of ENs need to include the protection of ecological nodes (ecological sources) and ecological edges (ecological corridors) (Figure 13). We propose that all ecological sources should be gradually and orderly included in the sequence of habitat protection to prevent natural or manmade erosion. Then the level of ecological protection will be further determined according to the detailed field survey (scale, species, structure, etc.) of ecological sources. The quality, function, and structure characteristics should be fully considered in the protection of ecological corridors. In this study, we proposed two protection strategies for ecological corridors based on the coupling of the “quality–function–structure” of WUA in 2020 (Figure 14). The key areas to be repaired were determined through the quality evaluation of ecological corridors. The priority of construction and protection of ecological corridors was determined by coupling two topological structures and functions. Two protection strategies are described as follows.
Strategy 1 is a protection mode that comprehensively considers the quality defects, community structure, and centrality function of ecological corridors (Figure 14a). This model gives priority to repairing the barriers and pinchpoints (Table 4) of ecological corridors and protecting the ecological corridors connecting adjacent ecological communities. Ecological corridors with priority protection are key components of maintaining the connectivity between ecological communities. Once these corridors are eroded, the connection between ecological communities will be directly cut off, which is the main inducement for the gradual formation of ecological isolated islands. Ecological corridors between primary ecological communities and secondary ecological communities were given primary and secondary protection priority, respectively, that is, the thick blue and purple lines in Figure 14a. The remaining ecological corridors were given tertiary protection priority. Moreover, priority should be given to the construction and protection of components with high comprehensive centrality within the ecological corridors at the same level.
Strategy 2 is a protection mode that comprehensively considers the quality defects, backbone structure, and centrality function of ecological corridors (Figure 13b). Except for the quality restoration of ecological corridors (Table 4), this model gives priority to the protection of ecological corridors that connect as many ecological sources as possible at the lowest cost. Ecological corridors with priority protection are conducive to maintaining both the backbone structure and strong transmission components of ENs. Once these corridors are eroded, it will greatly increase the resistance cost of biological flow and reduce the landscape connectivity. The main trunk and secondary trunk of ecological corridors were given primary and secondary protection priority, respectively, that is, the thick blue and purple lines in Figure 13b. The remaining ecological corridors were given tertiary protection priority. Moreover, priority should be given to the construction and protection of components with high comprehensive centrality within the main trunk, secondary trunk, and remaining ecological corridors.

4.3. Advances, Limitations, and Directions for Future Work

In this study, a complete evaluation framework of ENs was proposed to support the formulation of protection strategies for ENs. The specific advantages include the following: first, the evaluation framework makes up for the singleness of the previous evaluation perspective of ENs [29,31,32]. Second, circuit theory [27,28], centrality index [44], and complex network theory [45] were applied to realize the above framework, which provides a new perspective for understanding the characteristics of ENs. Finally, protection strategies for ENs based on the evaluation framework bridge the knowledge gap between ENs evaluation and planning, which may be conducive to the management of ENs.
However, this study has some limitations. First, the evaluation and protection of ENs in this study only involved terrestrial ecosystems and have not been applied to aquatic ecosystems. This will be our further research direction in the future. Another issue is the effectiveness of protection strategies for ENs. Subsequent studies should continue to measure the protection effectiveness of ENs against external attacks under different strategies, which will provide reliability verification for ecological planning.

5. Conclusions

The multi-scale research on the construction of ENs has been relatively abundant [23,57,63]. However, the evaluation of ENs not only has the defect of a single perspective [29,31,32] but also lacks attention to the topology, which often leads to the lack of effective guidance for the protection of ENs. In this study, we attempted to make up for the above defects, and the specific contributions are as follows. (1) A complete evaluation framework of ENs was proposed to analyze the evolution characteristics of ENs in WUA. The integrity of this framework will be conducive to providing scientific suggestions for ecological planning. (2) We attempted to integrate circuit theory [27,28], centrality index [44], and complex network theory [45] into our study, which is a great supplement to previous studies on ENs evaluation. (3) The evaluation framework was committed to supporting the formulation of protection strategies for ENs, which bridges the knowledge gap between protection and evaluation for ENs. According to the implementation of the research framework, we have summarized many meaningful enlightenments and implications, as follows.
(1)
Regulating land development activities will be conducive to maintaining the global stability of ENs. Forest fragmentation, transitional urban expansion, and agricultural reclamation were important inducements for the shrinkage of ecological sources. They may also increase the resistance of species migration, which will lead to qualitative change and even fracture of ecological corridors.
(2)
Regulating land development activities will be conducive to strengthening the local connectivity of ENs. On the one hand, the antagonism between ecological corridors and land development activities led to ecological quality defects. On the other hand, the topology analysis of complex networks can be used to extract the key components of ENs to avoid being occupied by land development activities. Therefore, it is crucial for ecological connectivity to repair the weak sections of ENs and protect the key ENs.
(3)
The coupling “quality–function–structure” provides the possibility for the differential protection of ENs. The key areas to be repaired can be determined through the quality evaluation of ENs, and the priority of construction and protection for ENs may be determined through the coupling of topology and function.
(4)
The proposed research framework has strong applicability and potential. Goal 15 (Life on Land) of the Sustainable Development Goals (SDGs) aims to protect, restore, and promote the sustainable use of terrestrial ecosystems [72]. However, in the inevitable high-intensity construction rhythm of the “Anthropocene”, the gradually isolated ecosystems may lead to the loss of human well-being or biological homogenization [73,74]. ENs are effective means to curb the islanding of the ecosystem by maintaining ecological connectivity [6]. The research framework in this study comprehensively considers the quality defects, main functions, and topology of ENs, which can be applied to the research and planning of multi-scale ENs. In the future, the research framework will be further extended to the study of aquatic ecosystems and the effectiveness of protection strategies for ENs. Therefore, we believe that this research framework has strong applicability and potential in the realization of Goal 15 of the SDGs [72].

Author Contributions

Conceptualization, Y.L. (Yanchi Lu) and Y.L. (Yaolin Liu); methodology, Y.L. (Yanchi Lu); software, Y.L. (Yanchi Lu) and D.H.; validation, Y.L. (Yaolin Liu) and Y.L. (Yanfang Liu); formal analysis, Y.L. (Yanchi Lu) and D.H.; investigation, Y.L. (Yanfang Liu) and D.H.; resources, Y.L. (Yanfang Liu); data curation, Y.L. (Yanchi Lu) and D.H.; writing—original draft preparation, Y.L. (Yanchi Lu); writing—review and editing, Y.L. (Yaolin Liu) and D.H.; visualization, Y.L. (Yanchi Lu); supervision, Y.L. (Yaolin Liu); project administration, Y.L. (Yaolin Liu) and Y.L. (Yanfang Liu); funding acquisition, Y.L. (Yaolin Liu) and Y.L. (Yanfang Liu). All authors have read and agreed to the published version of the manuscript.

Funding

This research was funded by the National Key Research and Development Program (Grant No. 2017YFB0503505) and National Natural Science Foundation of China (Grant No. 41771432).

Data Availability Statement

Spatial distribution data of land use types monitored by remote sensing (LUTRS) in 2000, 2010, and 2020, obtained from Resources and Environment Science and Data Center (https://www.resdc.cn/Datalist1.aspx?FieldTyepID=1,3, accessed on 2 March 2022); digital elevation model (DEM) data obtained from Geospatial Data Cloud (https://www.gscloud.cn/search, accessed on 2 March 2022); normalized difference vegetation index (NDVI) dataset of WUA in 2000, 2010, and 2020 extracted from MODIS/Terra Vegetation Indices 16-Day L3 Global 250 m SIN Grid (MOD13Q1), which was downloaded from LAADS DAAC of NASA (https://ladsweb.modaps.eosdis.nasa.gov/search/order/1/MOD13Q1--6, accessed on 2 March 2022).

Acknowledgments

We are immensely grateful to the editor and “anonymous” reviewers for their comments on the manuscript.

Conflicts of Interest

The authors declare no conflict of interest.

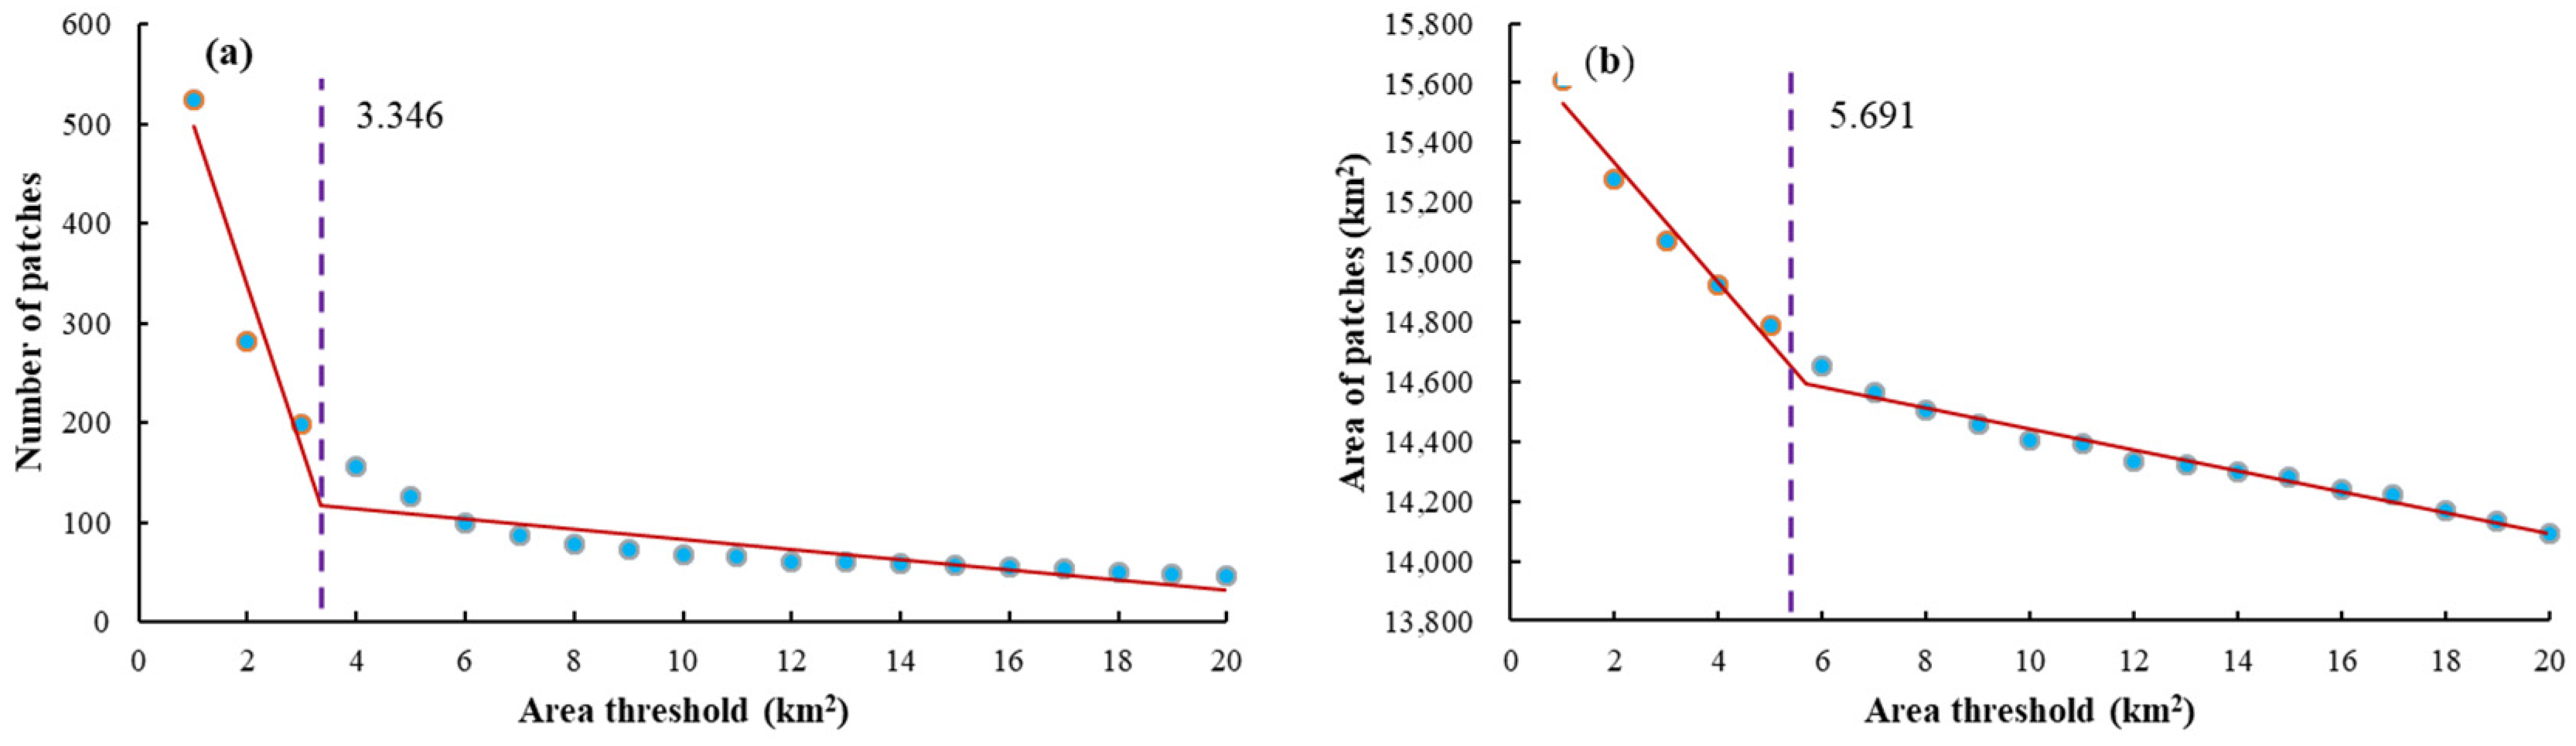
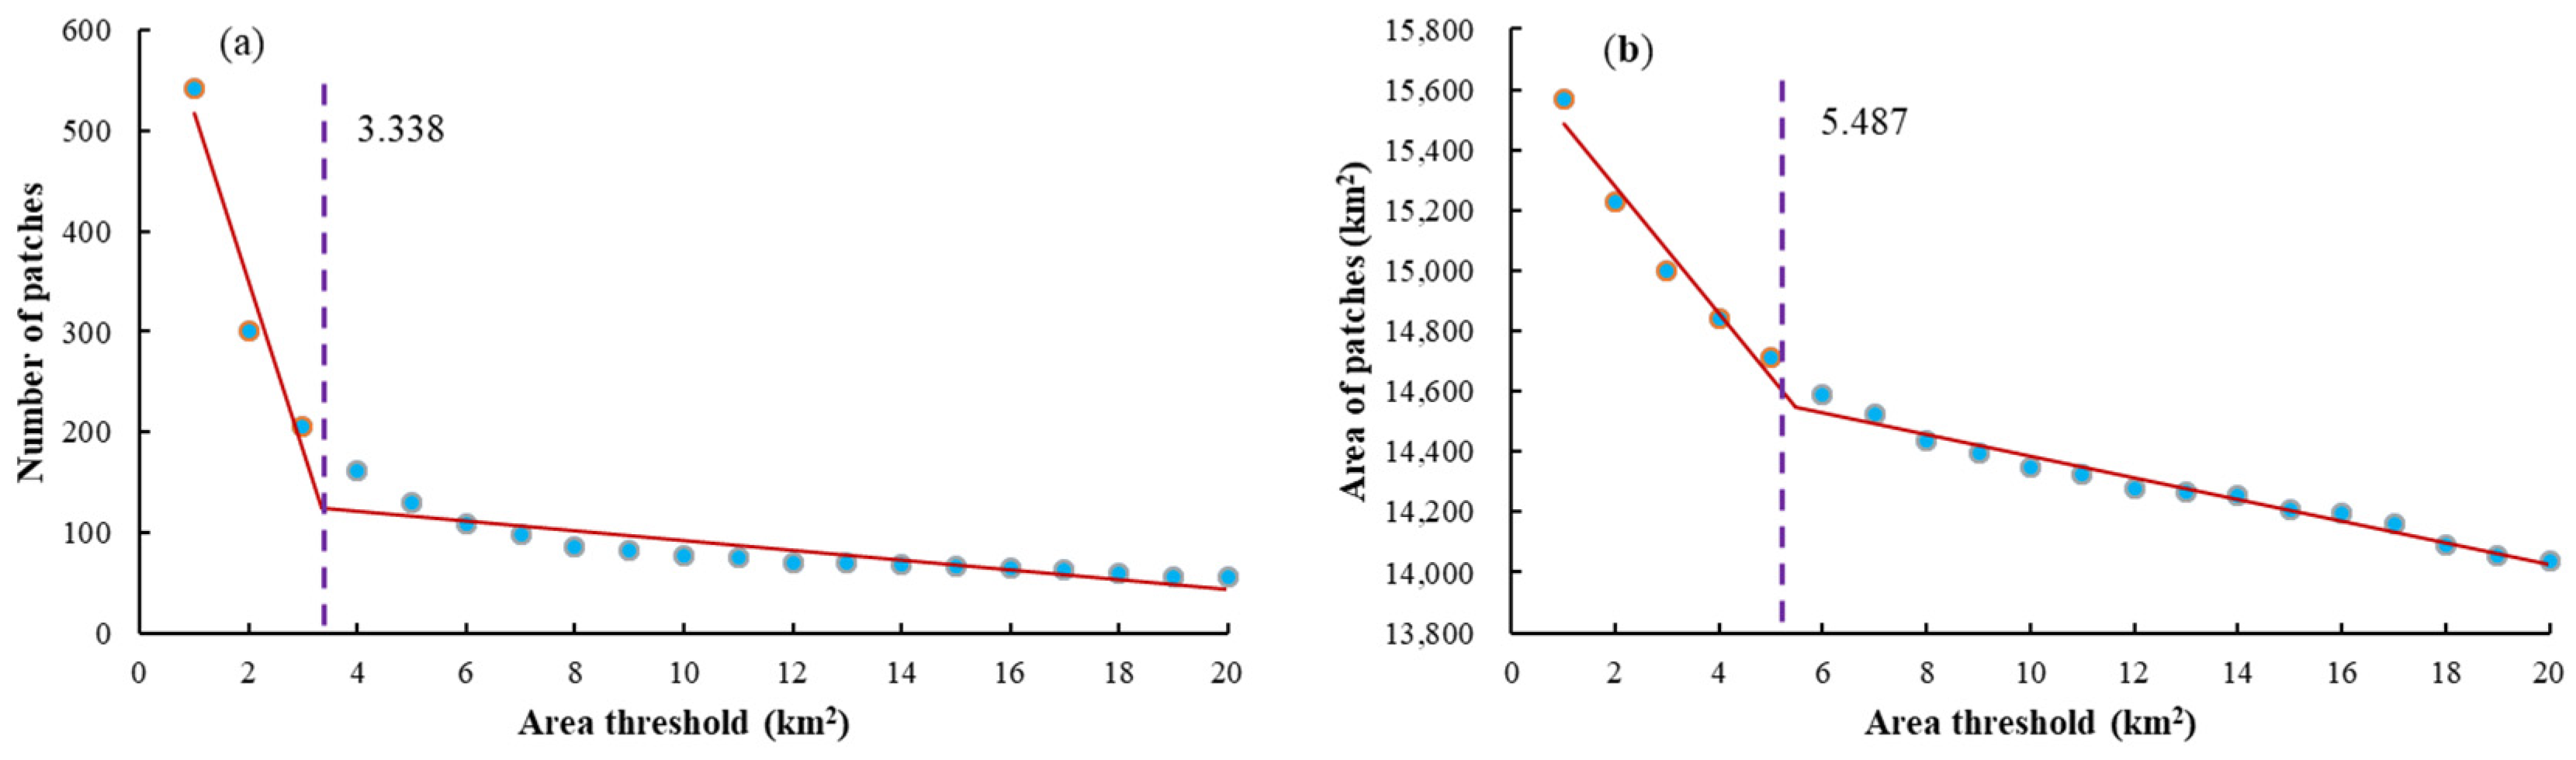
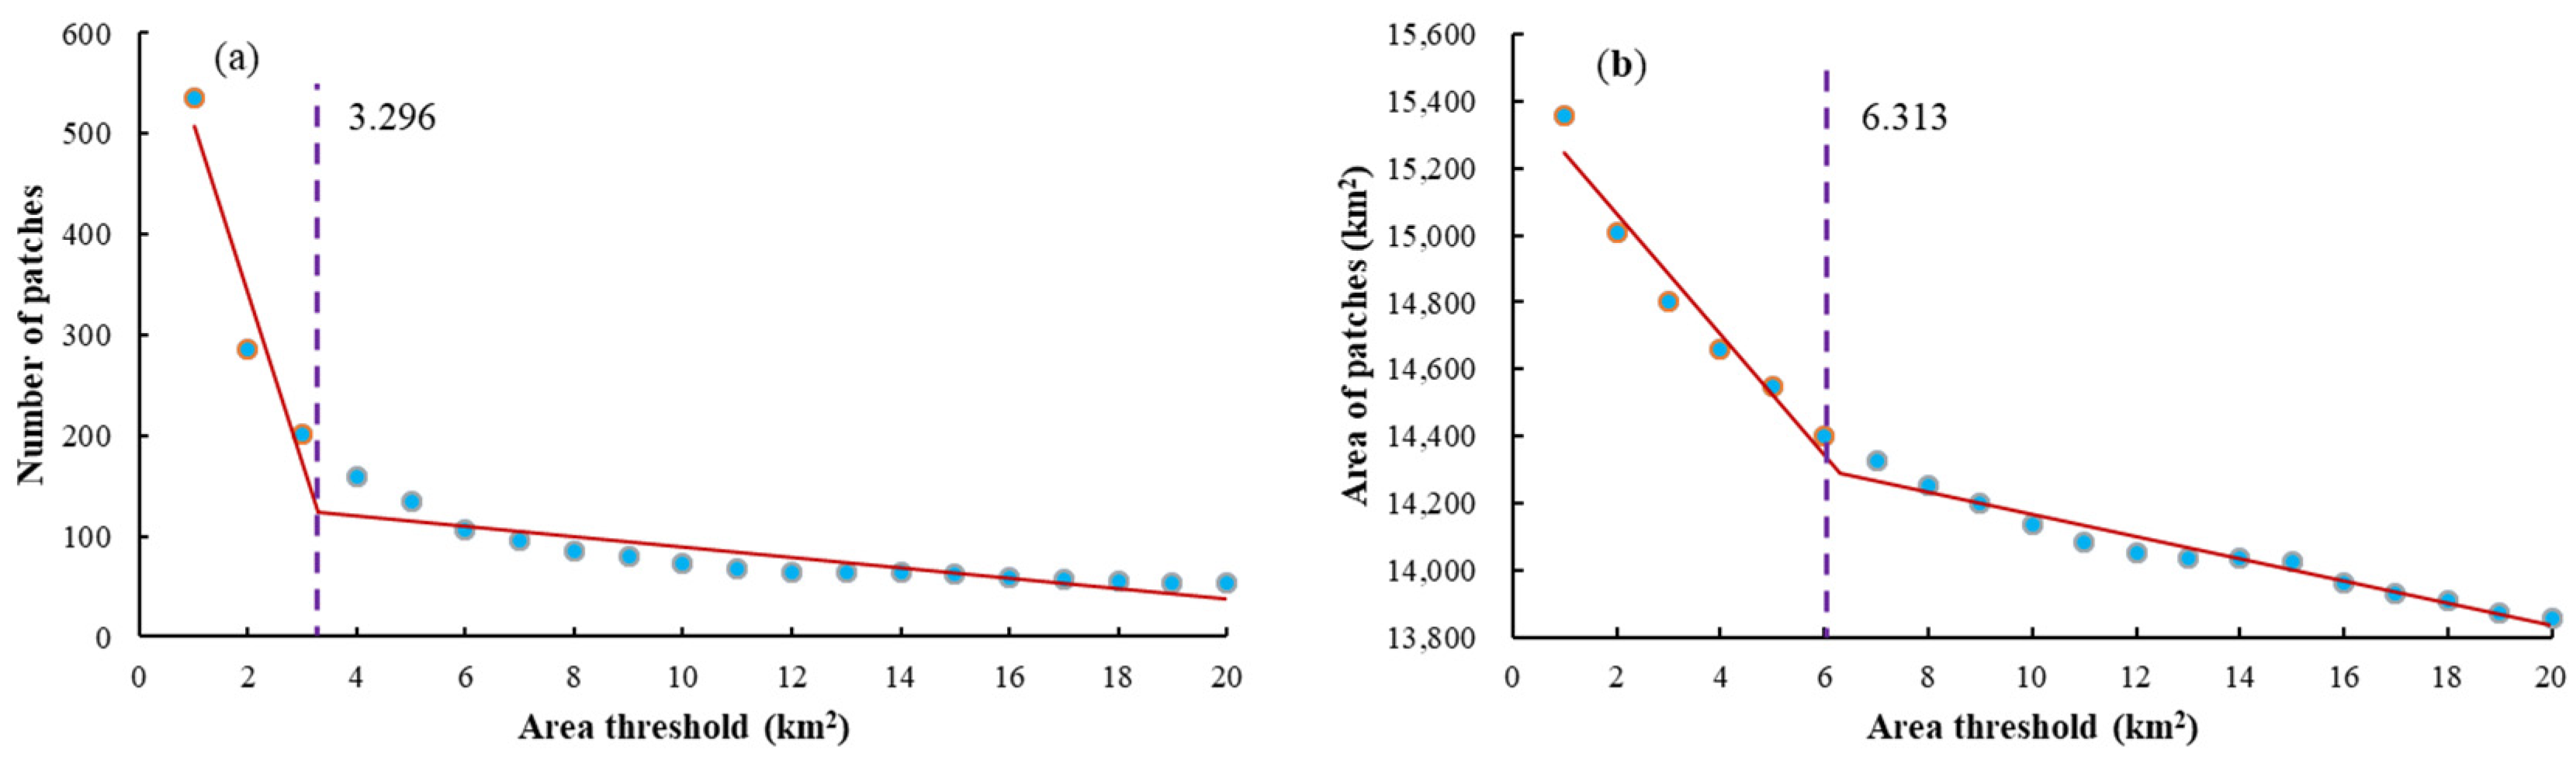
Appendix A. Identification of Optimal Area Threshold for Ecological Sources

Breakpoints are abrupt mutation points in a set of data, which may represent transitions between different states [75]. Breakpoint detection in ecological data will contribute to exploring the change threshold of ecosystems. In this study, the optimal area threshold for the screening of ecological sources in WUA was identified through the breakpoint detection between the area threshold and scale (number and area) of core patches [76].
First, the number and total area of core patches higher than each area threshold were counted at the step size of 1 km2. We used the Segmented package [77] in R to conduct piecewise linear regression to identify breakpoints as the initial area threshold. From the perspective of the relationship between the area threshold and the number of core patches, when the area threshold is lower than the breakpoint value, many broken and fine patches may be included in ecological sources. Therefore, Figure A1a, Figure A2a and Figure A3a show that the optimal area threshold in 2000, 2010, and 2020 should be greater than 3.346 km2, 3.338 km2, and 3.296 km2, respectively. From the perspective of the relationship between the area threshold and the total area of core patches, when the area threshold is higher than the breakpoint value, some important large-scale ecological patches will be lost. Therefore, Figure A1b, Figure A2b and Figure A3b show that the optimal area threshold in 2000, 2010, and 2020 should be less than 5.691 km2, 5.487 km2, and 6.313 km2, respectively. To maintain the consistency of our study in different years, we argue that the optimal area threshold should be between 3.346 km2 and 5.487 km2. Furthermore, we adjusted the initial area threshold according to the distribution map of the ecological red line (only referring to the habitats of terrestrial ecosystems) issued by Hubei provincial government (http://hbj.wuhan.gov.cn/fbjd_19/xxgkml/zwgk/zrst/202001/t20200107_575869.html, accessed on 5 April 2022). We found that when the area threshold was adjusted to 4 km2, the identified ecological sources included as many terrestrial habitats as possible in the ecological red line. Finally, 4 km2 was determined as the optimal area threshold for the screening of ecological sources in WUA.
Figure A1. Number (a) and area (b) of ecological sources under different area thresholds in 2000.
Remotesensing 14 02618 g0a1
Figure A2. Number (a) and area (b) of ecological sources under different area thresholds in 2010.
Remotesensing 14 02618 g0a2
Figure A3. Number (a) and area (b) of ecological sources under different area thresholds in 2020.
Remotesensing 14 02618 g0a3

Appendix B. Calculation Process of Habitat Quality for Terrestrial Ecosystem

In this study, the habitat quality module of InVEST model [58] was applied to generate a habitat quality map of terrestrial ecosystems, and the calculation formula is as follows:
H M x j = H x j × ( 1 ( D x j z D x j z + k z ) )
D x j = r = 1 R y = 1 Y r ( ω r r = 1 R ω r ) × r y × i r x y × β x × S j r
i r x y = 1 ( d x y d r m a x )     i f   l i n e a r
i r x y = e x p ( ( 2.99 d r m a x ) d x y )     i f   e x p o n e n t i a l
where H M x j represents the habitat quality of pixel x with a specific habitat type j; H x j and D x j are the habitat suitability of terrestrial ecosystem (Table A1) and extent of habitat degradation, respectively; k and z are the half-saturation constant and proportional constant, respectively; ω r is the weight of the threat factor (Table A2); r y is the threat factor value (0 or 1); i r x y is the impact of threat factor r of pixel x on the habitat of pixel y, which is described by linear or exponential decay functions in space [71]; β x is the accessibility; S j r is the relative sensitivity of habitat type j to threat factor r (Table A1); d x y is the distance between pixel x and y; d r m a x is the maximum influence distance of threat factor r (Table A2).
Table A1. Habitat suitability of terrestrial ecosystem and relative sensitivity to threats.
Habitats Suitability   ( H x j ) Relative   Sensitivity   to   Threats   ( S j r )
TownRuralOthers
Paddy field0.70.50.40.3
Dryland0.60.50.40.3
Woodland110.90.8
Shrub wood0.90.80.70.6
Sparse woodland0.80.70.60.5
Other woodland0.80.60.50.5
High coverage grassland0.70.70.60.5
Medium coverage grassland0.70.60.50.5
Low coverage grassland0.70.60.50.3
Water00.90.80.6
Unused land 0.10.50.40.3
Town0000
Rural0000
Other construction land0000
Table A2. Relative weight, maximum influence distance, and decay function of threats.
Threat Weight   ( ω r ) Maximum   Influence   Distance   ( d r m a x ) Decay Function
Town110exponential
Rural0.65exponential
Other construction land0.53linear

Appendix C. Verification of Quality Defects for ENs

We combined Landsat 8 OLI images and land use data of WUA to verify the quality defects of ENs, namely, ecological barriers and pinchpoints.
Ecological barriers refer to the non-habitats that hinder the ecological flow in the ecological corridors, which leads to the detour or meander of ecological corridors [34]. Figure A4 shows two typical ecological barriers of WUA in 2020. The upper left and lower left of Figure A4, respectively, show the background of remote sensing and land use distribution for ecological barrier ①. It can be found that the ecological barrier ① was located at the junction of urban and rural areas, which hindered the biological flow between ecological sources. If the three-dimensional green passage crossing the ecological barrier ① can be built, a new ecological corridor will be dredged (red dotted line in Figure A4). The upper right and lower right of Figure A4, respectively, show the background of remote sensing and land use distribution for ecological barrier ②. It can be found that ecological barrier ② was a piece of construction land close to an ecological source, which led to the extrusion and distortion of the adjacent ecological corridor. If the vegetation coverage of ecological barrier ② can be properly increased, the fracture of narrow and rugged ecological corridors can be prevented.
Figure A4. Verification of typical ecological barriers in 2020.
Remotesensing 14 02618 g0a4
Ecological pinchpoints refer to the narrow parts of ecological corridors, which are the bottleneck and irreplaceable areas of species migration [33]. Figure A5 shows two typical ecological pinchpoints of WUA in 2020. The upper left and lower left of Figure A5, respectively, show the background of remote sensing and land use distribution for ecological pinchpoint ①. The upper right and lower right of Figure A5, respectively, show the background of remote sensing and land use distribution for ecological pinchpoint ②. It can be found that ecological pinchpoints ① and ② were narrow ecological corridors squeezed by dense impervious surfaces and farmlands, respectively. Therefore, ecological pinchpoints are vulnerable to erosion, which will lead to the fracture of ecological corridors and the stagnation of biological flow. We argue that the ecological pinchpoint is the fortress of biological flow and should be strictly protected to prevent natural or manmade erosion.
Figure A5. Verification of typical ecological pinchpoints in 2020.
Remotesensing 14 02618 g0a5

References

  1. Li, G.; Fang, C.; Li, Y.; Wang, Z.; Sun, S.; He, S.; Qi, W.; Bao, C.; Ma, H.; Fan, Y.; et al. Global Impacts of Future Urban Expansion on Terrestrial Vertebrate Diversity. Nat. Commun. 2022, 13, 1628. [Google Scholar] [CrossRef]
  2. Xu, J.; Wang, J.; Xiong, N.; Chen, Y.; Sun, L.; Wang, Y.; An, L. Analysis of Ecological Blockage Pattern in Beijing Important Ecological Function Area, China. Remote Sens. 2022, 14, 1151. [Google Scholar] [CrossRef]
  3. Mendes, C.B.; Prevedello, J.A. Does Habitat Fragmentation Affect Landscape-Level Temperatures? A Global Analysis. Landsc. Ecol. 2020, 35, 1743–1756. [Google Scholar] [CrossRef]
  4. Syst, G.I. The Theory of Island Biogeography; Princeton University Press: Princeton, NJ, USA, 2014. [Google Scholar]
  5. Fang, M.; Si, G.; Yu, Q.; Huang, H.; Huang, Y.; Liu, W.; Guo, H. Study on the Relationship between Topological Characteristics of Vegetation Ecospatial Network and Carbon Sequestration Capacity in the Yellow River Basin, China. Remote Sens. 2021, 13, 4926. [Google Scholar] [CrossRef]
  6. Huang, L.; Wang, J.; Cheng, H. Spatiotemporal Changes in Ecological Network Resilience in the Shandong Peninsula Urban Agglomeration. J. Clean. Prod. 2022, 339, 130681. [Google Scholar] [CrossRef]
  7. Opdam, P.; Steingröver, E.; van Rooij, S. Ecological Networks: A Spatial Concept for Multi-Actor Planning of Sustainable Landscapes. Landsc. Urban Plan. 2006, 75, 322–332. [Google Scholar] [CrossRef]
  8. Jongman, R.H.G. Nature Conservation Planning in Europe: Developing Ecological Networks. Landsc. Urban Plan. 1995, 32, 169–183. [Google Scholar] [CrossRef]
  9. Linden-Ward, B. Greenways for America. Landsc. J. 1992, 11, 196–197. [Google Scholar] [CrossRef]
  10. Jongman, R.H.G.; Külvik, M.; Kristiansen, I. European Ecological Networks and Greenways. Landsc. Urban Plan. 2004, 68, 305–319. [Google Scholar] [CrossRef]
  11. Fabos, J.G. Introduction and Overview: The Greenway Movement, Uses and Potentials of Greenways. Landsc. Urban Plan. 1995, 33, 1–13. [Google Scholar] [CrossRef]
  12. Furberg, D.; Ban, Y.; Mörtberg, U. Monitoring Urban Green Infrastructure Changes and Impact on Habitat Connectivity Using High-Resolution Satellite Data. Remote Sens. 2020, 12, 3072. [Google Scholar] [CrossRef]
  13. Staccione, A.; Candiago, S.; Mysiak, J. Mapping a Green Infrastructure Network: A Framework for Spatial Connectivity Applied in Northern Italy. Environ. Sci. Policy 2022, 131, 57–67. [Google Scholar] [CrossRef]
  14. Fan, F.; Wen, X.; Feng, Z.; Gao, Y.; Li, W. Optimizing Urban Ecological Space Based on the Scenario of Ecological Security Patterns: The Case of Central Wuhan, China. Appl. Geogr. 2022, 138, 102619. [Google Scholar] [CrossRef]
  15. Wang, X.; Wen, Y.; Liu, X.; Wen, D.; Long, Y.; Zhao, P.; Liu, P.; Zhong, J. Protection Effect and Vacancy of the Ecological Protection Redline: A Case Study in Guangdong–Hong Kong–Macao Greater Bay Area, China. Remote Sens. 2021, 13, 5171. [Google Scholar] [CrossRef]
  16. Peng, J.; Yang, Y.; Liu, Y.; Hu, Y.; Du, Y.; Meersmans, J.; Qiu, S. Linking Ecosystem Services and Circuit Theory to Identify Ecological Security Patterns. Sci. Total Environ. 2018, 644, 781–790. [Google Scholar] [CrossRef] [Green Version]
  17. Peng, J.; Pan, Y.; Liu, Y.; Zhao, H.; Wang, Y. Linking Ecological Degradation Risk to Identify Ecological Security Patterns in a Rapidly Urbanizing Landscape. Habitat Int. 2018, 71, 110–124. [Google Scholar] [CrossRef]
  18. Peng, J.; Zhao, S.; Dong, J.; Liu, Y.; Meersmans, J.; Li, H.; Wu, J. Applying Ant Colony Algorithm to Identify Ecological Security Patterns in Megacities. Environ. Model. Softw. 2019, 117, 214–222. [Google Scholar] [CrossRef] [Green Version]
  19. Pierik, M.E.; Dell’Acqua, M.; Confalonieri, R.; Bocchi, S.; Gomarasca, S. Designing Ecological Corridors in a Fragmented Landscape: A Fuzzy Approach to Circuit Connectivity Analysis. Ecol. Indic. 2016, 67, 807–820. [Google Scholar] [CrossRef]
  20. Puri, M.; Srivathsa, A.; Karanth, K.K.; Patel, I.; Kumar, N.S. Links in a Sink: Interplay between Habitat Structure, Ecological Constraints and Interactions with Humans Can Influence Connectivity Conservation for Tigers in Forest Corridors. Sci. Total Environ. 2022, 809, 151106. [Google Scholar] [CrossRef]
  21. Dai, L.; Liu, Y.; Luo, X. Integrating the MCR and DOI Models to Construct an Ecological Security Network for the Urban Agglomeration around Poyang Lake, China. Sci. Total Environ. 2021, 754, 141868. [Google Scholar] [CrossRef]
  22. Fu, B.; Liu, J.; Zhang, J.; Wu, X.; Wang, J. Service Accessibility of Ecological Nodes: An Exploratory Way to Enhance Network Connectivity in a Study Case of Wu’an, China. Ecol. Inform. 2022, 69, 101589. [Google Scholar] [CrossRef]
  23. Huang, X.; Wang, H.; Shan, L.; Xiao, F. Constructing and Optimizing Urban Ecological Network in the Context of Rapid Urbanization for Improving Landscape Connectivity. Ecol. Indic. 2021, 132, 108319. [Google Scholar] [CrossRef]
  24. Zhang, R.; Zhang, Q.; Zhang, L.; Zhong, Q.; Liu, J.; Wang, Z. Identification and Extraction of a Current Urban Ecological Network in Minhang District of Shanghai Based on an Optimization Method. Ecol. Indic. 2022, 136, 108647. [Google Scholar] [CrossRef]
  25. Huang, L.; Wang, J.; Fang, Y.; Zhai, T.; Cheng, H. An Integrated Approach towards Spatial Identification of Restored and Conserved Priority Areas of Ecological Network for Implementation Planning in Metropolitan Region. Sustain. Cities Soc. 2021, 69, 102865. [Google Scholar] [CrossRef]
  26. Liang, C.; Zeng, J.; Zhang, R.-C.; Wang, Q.-W. Connecting Urban Area with Rural Hinterland: A Stepwise Ecological Security Network Construction Approach in the Urban–Rural Fringe. Ecol. Indic. 2022, 138, 108794. [Google Scholar] [CrossRef]
  27. McRae, B.H.; Beier, P. Circuit Theory Predicts Gene Flow in Plant and Animal Populations. Proc. Natl. Acad. Sci. USA 2007, 104, 19885–19890. [Google Scholar] [CrossRef] [Green Version]
  28. McRae, B.H.; Dickson, B.G.; Keitt, T.H.; Shah, V.B. Using Circuit Theory to Model Connectivity in Ecology, Evolution, and Conservation. Ecology 2008, 89, 2712–2724. [Google Scholar] [CrossRef]
  29. Hong, W.; Guo, R.; Su, M.; Tang, H.; Chen, L.; Hu, W. Sensitivity Evaluation and Land-Use Control of Urban Ecological Corridors: A Case Study of Shenzhen, China. Land Use Policy 2017, 62, 316–325. [Google Scholar] [CrossRef]
  30. Jiang, Y.; Shi, T.; Gu, X. Healthy Urban Streams: The Ecological Continuity Study of the Suzhou Creek Corridor in Shanghai. Cities 2016, 59, 80–94. [Google Scholar] [CrossRef]
  31. Morandi, D.T.; de Jesus França, L.C.; Menezes, E.S.; Machado, E.L.M.; da Silva, M.D.; Mucida, D.P. Delimitation of Ecological Corridors between Conservation Units in the Brazilian Cerrado Using a GIS and AHP Approach. Ecol. Indic. 2020, 115, 106440. [Google Scholar] [CrossRef]
  32. dos Santos, A.R.; Araújo, E.F.; Barros, Q.S.; Fernandes, M.M.; de Moura Fernandes, M.R.; Moreira, T.R.; de Souza, K.B.; da Silva, E.F.; Silva, J.P.M.; Santos, J.S.; et al. Fuzzy Concept Applied in Determining Potential Forest Fragments for Deployment of a Network of Ecological Corridors in the Brazilian Atlantic Forest. Ecol. Indic. 2020, 115, 106423. [Google Scholar] [CrossRef]
  33. McRae, B.H. Pinchpoint Mapper User Guide; The Nature Conservancy: Seattle, WA, USA, 2012. [Google Scholar]
  34. McRae, B.H.; Hall, S.A.; Beier, P.; Theobald, D.M. Where to Restore Ecological Connectivity? Detecting Barriers and Quantifying Restoration Benefits. PLoS ONE 2012, 7, e52604. [Google Scholar] [CrossRef] [PubMed]
  35. Hou, Q.; Du, Y.; Dong, W.; Zeng, Z.; Zhang, L.; Duan, Y.; Hou, X. Smart City Oriented Ecological Corridor Layout of Sanshui River Basin in Arid Area of Loess Plateau. Sustain. Energy Technol. Assess. 2021, 44, 100993. [Google Scholar] [CrossRef]
  36. Luo, Y.; Wu, J.; Wang, X.; Peng, J. Using Stepping-Stone Theory to Evaluate the Maintenance of Landscape Connectivity under China’s Ecological Control Line Policy. J. Clean. Prod. 2021, 296, 126356. [Google Scholar] [CrossRef]
  37. Zhao, S.; Ma, Y.; Wang, J.; You, X. Landscape Pattern Analysis and Ecological Network Planning of Tianjin City. Urban For. Urban Green. 2019, 46, 126479. [Google Scholar] [CrossRef]
  38. Zhang, X.; Jin, X.; Han, B.; Sun, R.; Liang, X.; Li, H.; Zhou, Y. Identification and Optimization of Ecological Network in the Plain Area of the Lower Yangtze River: A Case Study of Jintan District, Changzhou. Acta Ecol. Sin. 2021, 41, 13. [Google Scholar]
  39. Yu, Q.; Yue, D.; Wang, Y.; Kai, S.; Fang, M.; Ma, H.; Zhang, Q.; Huang, Y. Optimization of Ecological Node Layout and Stability Analysis of Ecological Network in Desert Oasis: A Typical Case Study of Ecological Fragile Zone Located at Deng Kou County (Inner Mongolia). Ecol. Indic. 2018, 84, 304–318. [Google Scholar] [CrossRef]
  40. Pop, P.C. The Generalized Minimum Spanning Tree Problem: An Overview of Formulations, Solution Procedures and Latest Advances. Eur. J. Oper. Res. 2020, 283, 1–15. [Google Scholar] [CrossRef]
  41. Luo, Y.; Wu, J. Linking the Minimum Spanning Tree and Edge Betweenness to Understand Arterial Corridors in an Ecological Network. Landsc. Ecol. 2021, 36, 1549–1565. [Google Scholar] [CrossRef]
  42. Rosvall, M.; Axelsson, D.; Bergstrom, C.T. The Map Equation. Eur. Phys. J. Spec. Top. 2009, 178, 13–23. [Google Scholar] [CrossRef]
  43. Martin, R.; Bergstrom, C.T. Maps of Random Walks on Complex Networks Reveal Community Structure. Proc. Natl. Acad. Sci. USA 2008, 105, 1118–1123. [Google Scholar] [CrossRef] [Green Version]
  44. Sevtsuk, A.; Mekonnen, M. Urban Network Analysis: A New Toolbox for Measuring City Form in ArcGIS. Simul. Ser. 2012, 44, 133–145. [Google Scholar]
  45. Guo, J.; Chen, X.; Zhang, C. Theory and Application of Complex Network Modeling; Science Press: Alexandria, Australia, 2004. [Google Scholar]
  46. Yang, J.; Zeng, C.; Cheng, Y. Spatial Influence of Ecological Networks on Land Use Intensity. Sci. Total Environ. 2020, 717, 137151. [Google Scholar] [CrossRef] [PubMed]
  47. Correa Ayram, C.A.; Mendoza, M.E.; Etter, A.; Pérez-Salicrup, D.R. Effect of the Landscape Matrix Condition for Prioritizing Multispecies Connectivity Conservation in a Highly Biodiverse Landscape of Central Mexico. Reg. Environ. Chang. 2019, 19, 149–163. [Google Scholar] [CrossRef]
  48. Wang, T.; Li, H.; Huang, Y. The Complex Ecological Network’s Resilience of the Wuhan Metropolitan Area. Ecol. Indic. 2021, 130, 108101. [Google Scholar] [CrossRef]
  49. Dickson, B.G.; Albano, C.M.; McRae, B.H.; Anderson, J.J.; Theobald, D.M.; Zachmann, L.J.; Sisk, T.D.; Dombeck, M.P. Informing Strategic Efforts to Expand and Connect Protected Areas Using a Model of Ecological Flow, with Application to the Western United States. Conserv. Lett. 2017, 10, 564–571. [Google Scholar] [CrossRef]
  50. Wimberly, M.C.; Narem, D.M.; Bauman, P.J.; Carlson, B.T.; Ahlering, M.A. Grassland Connectivity in Fragmented Agricultural Landscapes of the North-Central United States. Biol. Conserv. 2018, 217, 121–130. [Google Scholar] [CrossRef]
  51. De Montis, A.; Caschili, S.; Mulas, M.; Modica, G.; Ganciu, A.; Bardi, A.; Ledda, A.; Dessena, L.; Laudari, L.; Fichera, C.R. Urban–Rural Ecological Networks for Landscape Planning. Land Use Policy 2016, 50, 312–327. [Google Scholar] [CrossRef]
  52. De Montis, A.; Ganciu, A.; Cabras, M.; Bardi, A.; Peddio, V.; Caschili, S.; Massa, P.; Cocco, C.; Mulas, M. Resilient Ecological Networks: A Comparative Approach. Land Use Policy 2019, 89, 104207. [Google Scholar] [CrossRef]
  53. Simberloff, D.S.; Abele, L.G. Island Biogeography Theory and Conservation Practice. Science 1976, 191, 285–286. [Google Scholar] [CrossRef] [Green Version]
  54. Soille, P.; Vogt, P. Morphological Segmentation of Binary Patterns. Pattern Recognit. Lett. 2009, 30, 456–459. [Google Scholar] [CrossRef]
  55. Carlier, J.; Moran, J. Landscape Typology and Ecological Connectivity Assessment to Inform Greenway Design. Sci. Total Environ. 2019, 651, 3241–3252. [Google Scholar] [CrossRef] [PubMed]
  56. Shi, F.; Liu, S.; Sun, Y.; An, Y.; Zhao, S.; Liu, Y.; Li, M. Ecological Network Construction of the Heterogeneous Agro-Pastoral Areas in the Upper Yellow River Basin. Agric. Ecosyst. Environ. 2020, 302, 107069. [Google Scholar] [CrossRef]
  57. Cui, L.; Wang, J.; Sun, L.; Lv, C. Construction and Optimization of Green Space Ecological Networks in Urban Fringe Areas: A Case Study with the Urban Fringe Area of Tongzhou District in Beijing. J. Clean. Prod. 2020, 276, 124266. [Google Scholar] [CrossRef]
  58. Sharp, R.; Chaplin-kramer, R.; Wood, S.; Guerry, A.; Ricketts, T.; Nelson, E.; Ennaanay, D.; Wolny, S.; Olwero, N.; Vigerstol, K.; et al. InVEST 3.2.0 User’s Guide; The Natural Capital Project, The Nature Conservancy, and World Wildlife Fund; Stanford University: Stanford, CA, USA; University of Minnesota: Minneapolis, MN, USA, 2015. [Google Scholar]
  59. Yin, C.; Liu, Y.; Wei, X. Study on the Multi-Scale Relationship between Road Network Centerality and Social Economic Activities Distribution in Wuhan. Hum. Geogr. 2017, 32, 104–112. (In Chinese) [Google Scholar] [CrossRef]
  60. Wei, B.; Deng, Y. A Cluster-Growing Dimension of Complex Networks: From the View of Node Closeness Centrality. Phys. A Stat. Mech. Its Appl. 2019, 522, 80–87. [Google Scholar] [CrossRef]
  61. Joo, H.; Kim, H.S.; Kim, S.; Sivakumar, B. Complex Networks and Integrated Centrality Measure to Assess the Importance of Streamflow Stations in a River Basin. J. Hydrol. 2021, 598, 126280. [Google Scholar] [CrossRef]
  62. Lin, G.; Chen, X.; Liang, Y. The Location of Retail Stores and Street Centrality in Guangzhou, China. Appl. Geogr. 2018, 100, 12–20. [Google Scholar] [CrossRef]
  63. Mu, H.; Li, X.; Ma, H.; Du, X.; Huang, J.; Su, W.; Yu, Z.; Xu, C.; Liu, H.; Yin, D.; et al. Evaluation of the Policy-Driven Ecological Network in the Three-North Shelterbelt Region of China. Landsc. Urban Plan. 2022, 218, 104305. [Google Scholar] [CrossRef]
  64. Gaaff, A.; Reinhard, S. Incorporating the Value of Ecological Networks into Cost–Benefit Analysis to Improve Spatially Explicit Land-Use Planning. Ecol. Econ. 2012, 73, 66–74. [Google Scholar] [CrossRef]
  65. Yao, Y.; Wang, J.; Hong, Y.; Qian, C.; Guan, Q.; Liang, X.; Dai, L.; Zhang, J. Discovering the Homogeneous Geographic Domain of Human Perceptions from Street View Images. Landsc. Urban Plan. 2021, 212, 104125. [Google Scholar] [CrossRef]
  66. Xu, J. Graph Theory and Its Application; China University of Science and Technology Press: Hefei, China, 2004. [Google Scholar]
  67. Patel, N.; Patel, K.M. Enhancement of Minimum Spanning Tree. In Advances in Intelligent Systems and Computing; Springer: Berlin, Germany, 2016. [Google Scholar]
  68. Prim, R.C. Shortest Connection Networks and Some Generalizations. Bell Syst. Tech. J. 1957, 4, 53–57. [Google Scholar] [CrossRef]
  69. Zhang, R.; Zhang, L.; Zhong, Q.; Zhang, Q.; Ji, Y.; Song, P.; Wang, Q. An Optimized Evaluation Method of an Urban Ecological Network: The Case of the Minhang District of Shanghai. Urban For. Urban Green. 2021, 62, 127158. [Google Scholar] [CrossRef]
  70. Lu, Y.; Liu, Y.; He, H.; Chen, F.; Wang, L.; Liu, Y. Diagnosing Degradation Risks of Ecosystem Services in Wuhan, China from the Perspective of Land Development: Identification, Measurement and Regulation. Ecol. Indic. 2022, 136, 108580. [Google Scholar] [CrossRef]
  71. Zhang, Y.; Liu, Y.; Zhang, Y.; Liu, Y.; Zhang, G.; Chen, Y. On the Spatial Relationship between Ecosystem Services and Urbanization: A Case Study in Wuhan, China. Sci. Total Environ. 2018, 637–638, 780–790. [Google Scholar] [CrossRef] [PubMed]
  72. United Nations. Transforming Our World: The 2030 Agenda for Sustainable Development; Working Paper; eSocialSciences: Navi Mumbai, India, 2015.
  73. Zhang, S.; Zhang, Q.; Yan, Y.; Han, P.; Liu, Q. Island Biogeography Theory Predicts Plant Species Richness of Remnant Grassland Patches in the Agro-Pastoral Ecotone of Northern China. Basic Appl. Ecol. 2021, 54, 14–22. [Google Scholar] [CrossRef]
  74. Vergara, P.M.; Pizarro, J.; Castro, S.A. An Island Biogeography Approach for Understanding Changes in Compositional Similarity at Present Scenario of Biotic Homogenization. Ecol. Modell. 2011, 222, 1964–1971. [Google Scholar] [CrossRef]
  75. Zhang, X.; Jin, X.; Liang, X.; Ren, J.; Han, B.; Liu, J.; Fan, Y.; Zhou, Y. Implications of Land Sparing and Sharing for Maintaining Regional Ecosystem Services: An Empirical Study from a Suitable Area for Agricultural Production in China. Sci. Total Environ. 2022, 820, 153330. [Google Scholar] [CrossRef]
  76. Jiang, H.; Peng, J.; Dong, J.; Zhang, Z.; Xu, Z.; Meersmans, J. Linking Ecological Background and Demand to Identify Ecological Security Patterns across the Guangdong-Hong Kong-Macao Greater Bay Area in China. Landsc. Ecol. 2021, 36, 2135–2150. [Google Scholar] [CrossRef]
  77. Vito, M. Segmented: An R Package to Fit Regression Models with Broken-Line Relationships. R News 2008, 3, 343–344. [Google Scholar]
Figure 1. Administrative divisions, spatial distribution data of land use types for Wuhan Metropolis (WUA) in 2020.
Remotesensing 14 02618 g001
Figure 2. Construction of ENs in WUA.
Remotesensing 14 02618 g002
Figure 3. Evaluation of “quality–function–structure” for ENs in WUA.
Remotesensing 14 02618 g003
Figure 4. Schematic diagram of backbone structure for ENs.
Remotesensing 14 02618 g004
Figure 5. Spatial distribution of ENs in 2000, 2010, and 2020.
Remotesensing 14 02618 g005
Figure 6. Spatial distribution of ecological barriers in 2000, 2010, and 2020.
Remotesensing 14 02618 g006
Figure 7. Spatial distribution of ecological pinchpoints in 2000, 2010, and 2020.
Remotesensing 14 02618 g007
Figure 8. Spatial distribution of between centrality in 2000, 2010, and 2020.
Remotesensing 14 02618 g008
Figure 9. Spatial distribution of closeness centrality in 2000, 2010, and 2020.
Remotesensing 14 02618 g009
Figure 10. Spatial distribution of straightness centrality in 2000, 2010, and 2020.
Remotesensing 14 02618 g010
Figure 11. Spatial distribution of community structure for ENs in 2000, 2010, and 2020.
Remotesensing 14 02618 g011
Figure 12. Spatial distribution of backbone structure for ENs in 2000, 2010, and 2020.
Remotesensing 14 02618 g012
Figure 13. Protection of ENs based on the coupling of “quality–function–structure”.
Remotesensing 14 02618 g013
Figure 14. Protection strategies of ecological corridors in WUA.
Remotesensing 14 02618 g014
Table 1. Outflow and inflow of ecological sources from 2000 to 2020.
Outflow of
Ecological Sources
2000–20102010–2020
Area (km2)PercentageArea (km2)Percentage
Farmland53.5315.69%159.8636.39%
Forest192.2556.34%190.0043.25%
Grassland12.483.66%9.662.20%
Water12.323.61%7.331.67%
Construction land70.4820.65%71.8516.36%
Unused land0.180.05%0.600.14%
Total341.25100.00%439.30100.00%
Inflow of
Ecological Sources
2000–20102010–2020
Area (km2)PercentageArea (km2)Percentage
Forest256.0197.69%240.8094.31%
Grassland6.052.31%14.535.69%
Total262.05100.00%255.33100.00%
Table 2. Composition of land use types for ecological corridors in 2000, 2010, and 2020.
Land Use Types200020102020
Area (km2)PercentageArea (km2)PercentageArea (km2)Percentage
Farmland806.1625.43%829.1122.92%761.8321.84%
Forest2270.1871.60%2686.6374.28%2627.8475.34%
Grassland59.131.87%61.331.70%57.661.65%
Water26.810.85%27.920.77%27.230.78%
Construction land7.980.25%11.880.33%13.330.38%
Unused land0.180.01%0.210.01%0.100.00%
Total3170.44100%3617.08100%3487.99100%
Table 3. Composition of land use types for ecological barriers in 2000, 2010, and 2020.
Land Use Types200020102020
Area (km2)PercentageArea (km2)PercentageArea (km2)Percentage
Farmland421.7783.25%414.1778.36%330.0074.25%
Forest19.253.80%21.994.16%18.834.24%
Grassland4.580.90%5.631.07%8.531.92%
Water9.221.82%9.381.77%9.542.15%
Construction land51.1010.09%76.9614.56%77.0217.33%
Unused land0.710.14%0.410.08%0.530.12%
Total506.63100.00%528.54100.00%444.45100.00%
Table 4. Quality defects and restoration strategies of ecological corridors in WUA.
TypesCharacteristicsStrategies
Ecological barriersNon-habitat patches hindering ecological flows.
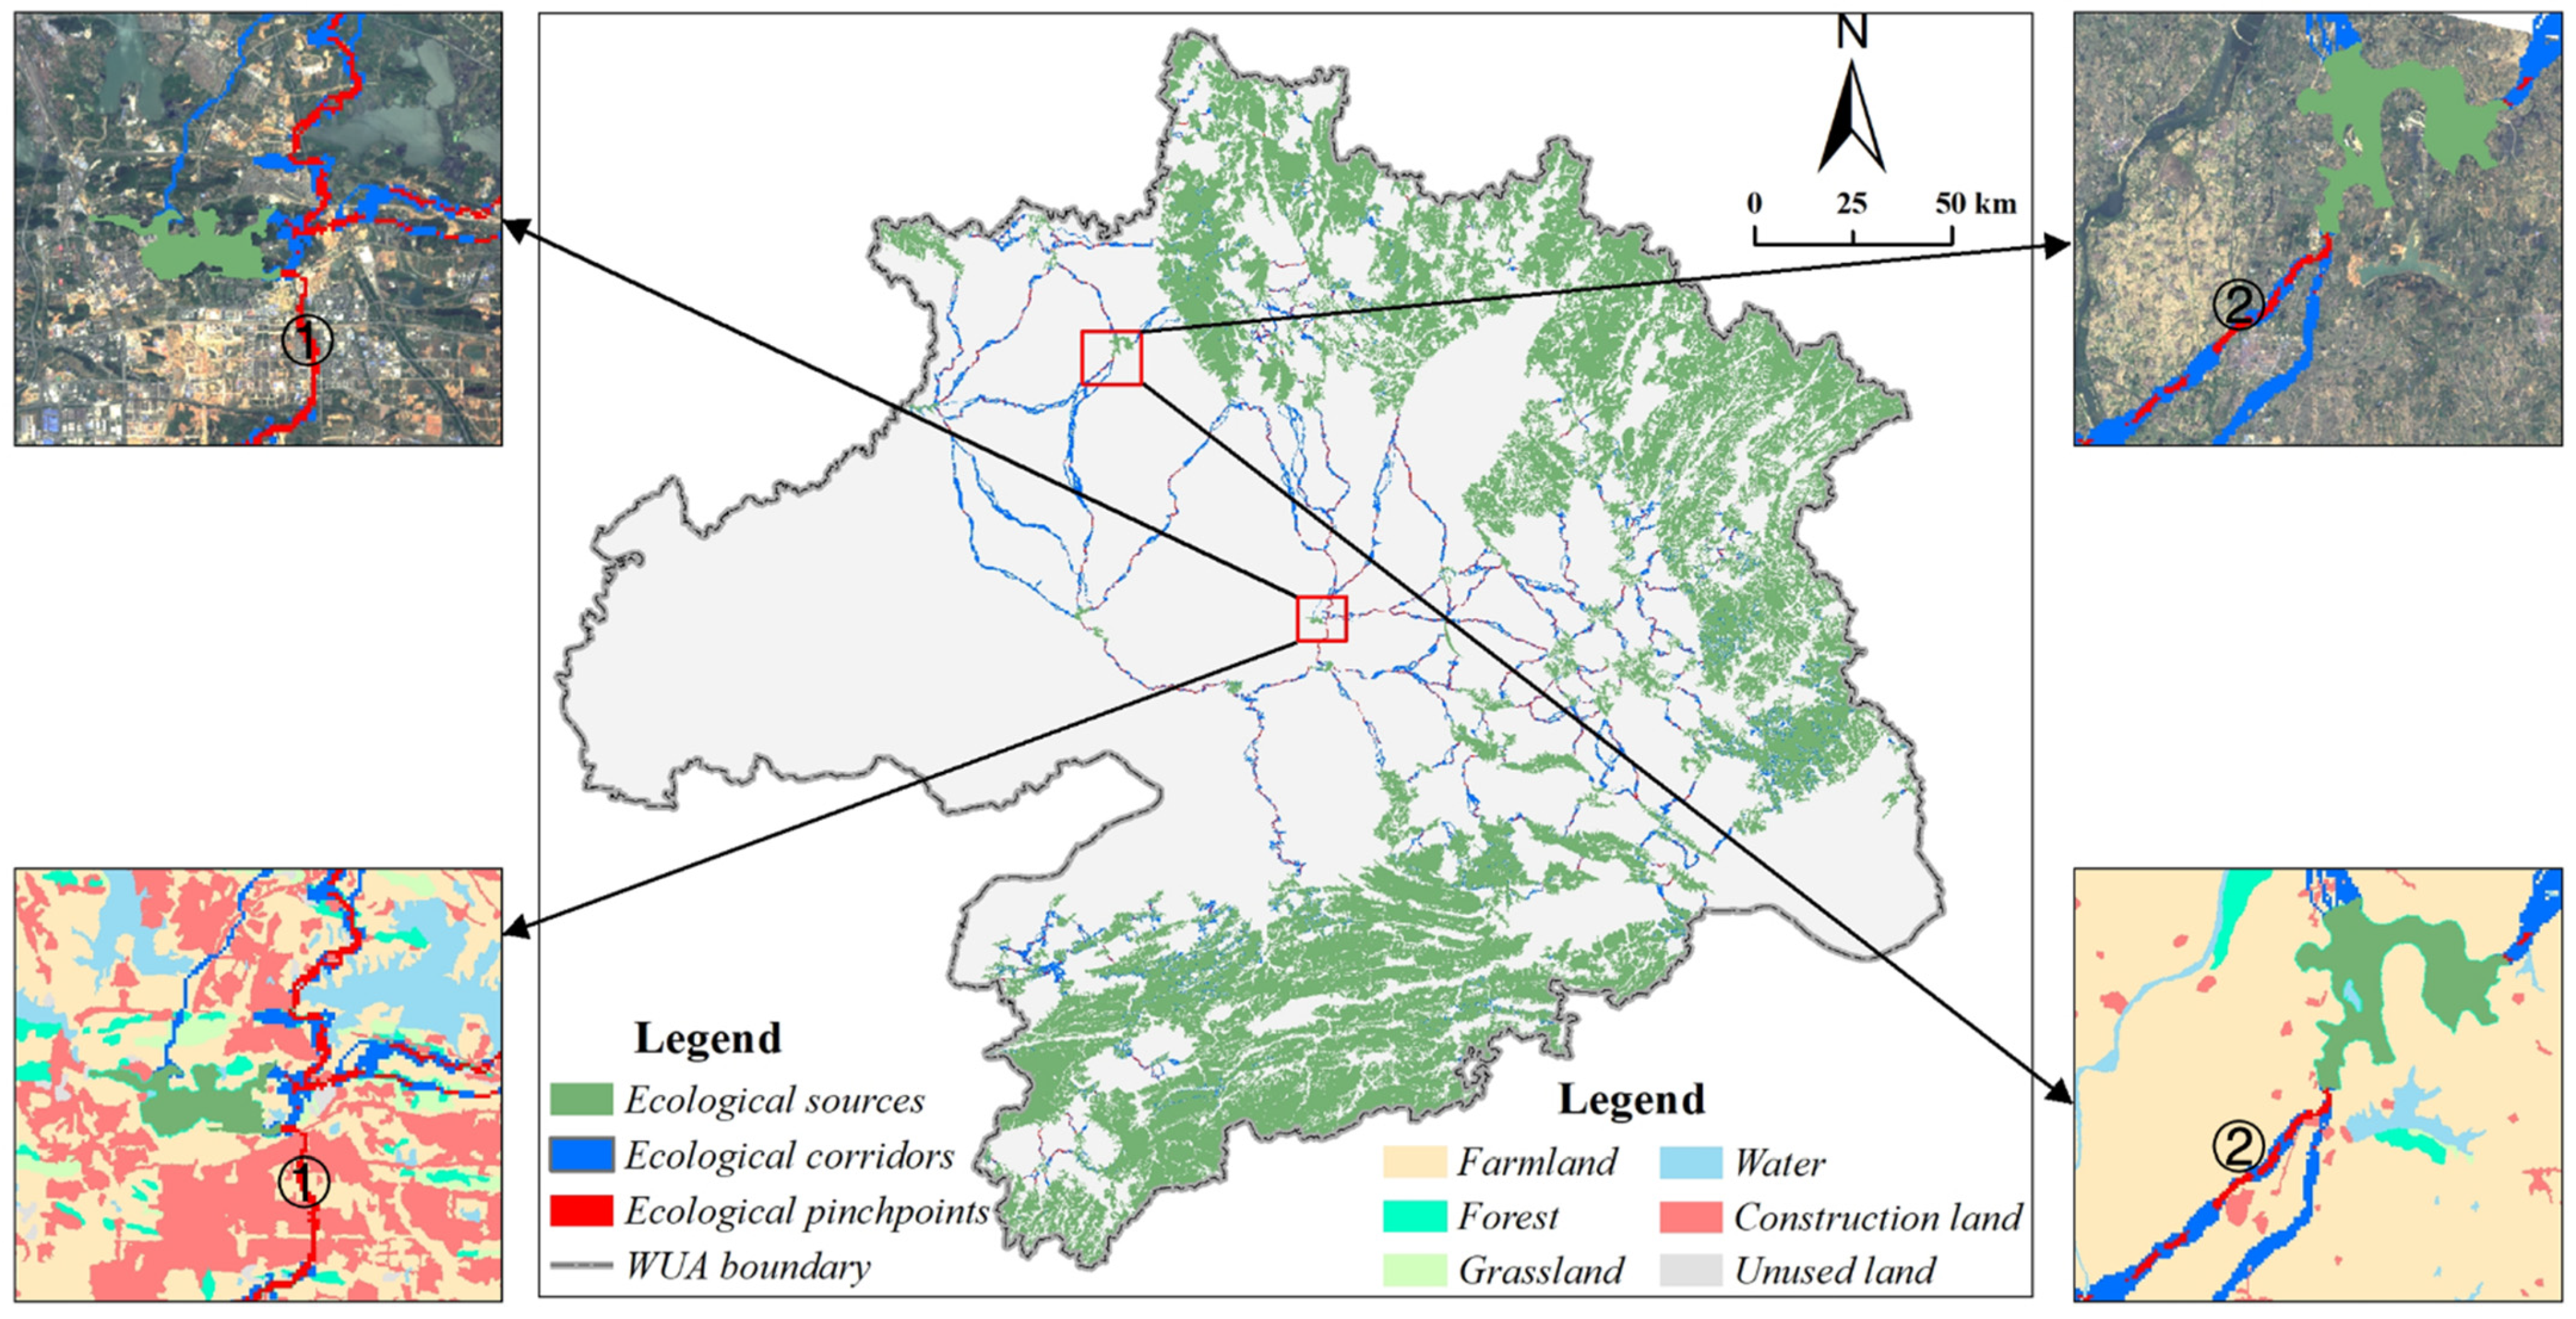
Returning farmlands to forests orderly.
Building three-dimensional wildlife passages across planar construction land.
Reserving wildlife passages beside linear construction lands such as roads and bridges.
Ecological pinchpointsNarrow and irreplaceable corridors.
Incorporated into nature reserves to prevent natural or manmade erosion.
Improving the vegetation coverage around ecological pinchpoints.
Publisher’s Note: MDPI stays neutral with regard to jurisdictional claims in published maps and institutional affiliations.

