Article

A Swin Transformer-Based Encoding Booster Integrated in U-Shaped Network for Building Extraction

1
School of Telecommunications Engineering, Xidian University, Xi’an 710071, China
2
Guangzhou Institute of Technology, Xidian University, Xi’an 710071, China
3
State Key Laboratory of Complex Electromagnetic Environment Effects on Electronics and Information System (CEMEE), Luoyang 471003, China
4
State Key Laboratory of Integrated Services Networks, Xidian University, Xi’an 710071, China
5
School of Artificial Intelligence, Xidian University, Xi’an 710071, China
*
Author to whom correspondence should be addressed.
Remote Sens. 2022, 14(11), 2611; https://doi.org/10.3390/rs14112611
Submission received: 1 April 2022 / Revised: 25 May 2022 / Accepted: 27 May 2022 / Published: 29 May 2022
(This article belongs to the Special Issue Recent Advances in Neural Network for Remote Sensing)

Abstract

:
Building extraction is a popular topic in remote sensing image processing. Efficient building extraction algorithms can identify and segment building areas to provide informative data for downstream tasks. Currently, building extraction is mainly achieved by deep convolutional neural networks (CNNs) based on the U-shaped encoder–decoder architecture. However, the local perceptive field of the convolutional operation poses a challenge for CNNs to fully capture the semantic information of large buildings, especially in high-resolution remote sensing images. Considering the recent success of the Transformer in computer vision tasks, in this paper, first we propose a shifted-window (swin) Transformer-based encoding booster. The proposed encoding booster includes a swin Transformer pyramid containing patch merging layers for down-sampling, which enables our encoding booster to extract semantics from multi-level features at different scales. Most importantly, the receptive field is significantly expanded by the global self-attention mechanism of the swin Transformer, allowing the encoding booster to capture the large-scale semantic information effectively and transcend the limitations of CNNs. Furthermore, we integrate the encoding booster in a specially designed U-shaped network through a novel manner, named the Swin Transformer-based Encoding Booster- U-shaped Network (STEB-UNet), to achieve the feature-level fusion of local and large-scale semantics. Remarkably, compared with other Transformer-included networks, the computational complexity and memory requirement of the STEB-UNet are significantly reduced due to the swin design, making the network training much easier. Experimental results show that the STEB-UNet can effectively discriminate and extract buildings of different scales and demonstrate higher accuracy than the state-of-the-art networks on public datasets.

Graphical Abstract

1. Introduction

Building extraction is a hot topic in the field of remote sensing. It plays an essential role in many practical applications, including regional administration, disaster prevention, and map services [1,2,3,4,5]. In recent years, with the innovation and advancement of satellites, UAVs, and other aerial photography equipment, the quality of high-resolution remote sensing images (HRRSIs) has been continuously improved, which promotes the improvement of the performance of the existing algorithms for HRRSI building extraction. However, although the increase of image resolution is intuitively beneficial to the building extraction, it also brings new challenges to the algorithms. For example, the increase of resolution enriches the details of the texture and color of the objects on the image, which expands the differences in the inherent characteristics of the same building, thus putting forward higher requirements for the algorithm to achieve more fine-grained segmentation. In addition, the increase of image resolution can outline the building more completely. However, it could also introduce more noise and amplify the appearance of other non-building objects in the region of the target building, especially some buildings with a large area. Accordingly, the algorithms are required to capture long-range features to reduce the problem of incomplete or incorrect building extraction due to the above interference.
Existing building extraction algorithms can be divided into two categories: traditional algorithms and deep-learning-based algorithms. Traditional methods utilized handcrafted features based on the shadow, shape, color, line, and other information of the object in the image [6,7,8,9,10,11,12], and used models such as support vector machine (SVM) [13,14], random forest [15], Markov random field [16], and graph theory [17,18] to recognize and locate buildings. For example, Manno-Kovacs et al. [12] utilized region orientation of buildings as the main feature, followed by fusing with the existing features, including shadow and color, and then performing morphological methods to obtain the final extraction result. Huang et al. [7,19] used morphological methods for the building extraction task. In [19], they proposed morphological building index (MBI) to model the relationship between implicit features of buildings and the properties of morphological operators. Based on MBI, they proposed a morphological shadow index (MSI) in [7] and realized the building extraction by the fusion of MBI and MSI.
Deep learning has gained great success in the recent decade, and deep neural networks (DNNs) have been employed in various fields, including computer vision [20,21,22] and natural language processing [23]. DNNs also demonstrate high performance for HRRIS building extraction tasks [24,25,26,27,28,29,30,31,32,33]. Since both building extraction and semantic segmentation tasks need to achieve dense pixel prediction, many designs and ideas in segmentation fields have been introduced into the algorithm for building extraction.
The U-shaped network (U-Net) with encoder–decoder structure [34] was initially used for medical segmentation tasks and shows top performance among CNNs. Due to its strong ability to extract and fuse multi-scale semantic and contextual information by using skip connection and hierarchical encoding and decoding, U-Net is also widely leveraged for building extraction [25,26,27,28,29,30,33,35,36,37,38,39]. For example, seeking to overcome the lack of contextual information of each patch after image patching, Li et al. [25] proposed a fully convolutional U-shaped network where dense connectivity was built to fully extract the context of features at different levels. Ye et al. [28] introduced channel and spatial attention on skip connections to reduce the differences of the semantic information between low-level and high-level features and to avoid the inconsistencies in feature connection. Shao et al. [30] added a residual enhancement module on the basis of U-Net. After the image passes through the U-Net network, the segmented objects would be further adjusted through the residual enhancement module to alleviate the incomplete and wrong segmentation of the building. However, although U-Net can effectively extract local features and performs well on building extraction datasets, there is still optimization room since it is difficult to capture large-scale features due to the local perceptive field of the convolution kernel, leading to incomplete or missing extraction, especially for HRRSIs.
Transformer [23,40,41] is a sequence-to-sequence model with an encoder–decoder structure for natural language processing (NLP) tasks. Different from the previous implementations based on the recurrent neural network (RNN) [42,43], Transformer can model the semantic feature of all the word vectors in high parallelism and efficiency by exploiting the global self-attention mechanism. Considering that the global self-attention mechanism is a potential method to extract large-scale semantic information efficiently in the computer vision tasks, Dosovitskiy et al. proposed the vision Transformer (ViT) [44] for image classification by projecting image patches to independent sequences. Based on the ViT, Liu et al. [45] designed a swin Transformer by proposing shifted windows and restricting the scope of global self-attention on features. Since a swin Transformer demonstrates higher performance over CNN and lower computational cost than a ViT, Yuan et al. [46] and Chen et al. [47] introduced it to their building extraction algorithms as encoding networks. The features at different scales are decoded separately by a series of convolutions and fused by passing through bottleneck layers (i.e., 1 × 1 convolutional layers) to extract and fuse multi-scale semantic information.
Even though the Transformer-based networks have a global receptive field and can effectively capture the long-range features, their extraction of local features is not emphasized due to the lack of restrictions on the local receptive field, resulting in relatively low localization accuracy. To combine the advantages of local and long-range feature extraction, some existing works tried to fuse a U-Net and a Transformer by integrating the Transformer modules into the U-Net [48,49]. However, this direct fusion creates a potential ambiguity and imbalance in local and global feature extraction, which reduces their feature-encoding capabilities.
In this paper, inspired by the swin Transformer [45], we propose the Swin Transformer-based Encoding Booster- U-shaped Network (STEB-UNet), which is composed of an integrated encoding booster based on the swin Transformer and a specially designed U-shaped network (U-Net). Instead of adjusting to the U-Net architecture as most current building extraction networks do, we maintain the U-Net but combine it with our encoding booster in a novel manner to expand the receptive field to the global level and enhance the encoding capability of the overall network. The proposed encoding booster includes a swin Transformer pyramid to extract the large-scale semantic and contextual information in multi-scale features. The features obtained by the encoding booster at different levels will be further fused with the corresponding features of U-Net to compensate for the latter’s lack of large-scale semantic extraction. By introducing such a highly-efficient encoding booster, both small and large building targets in HRRSIs can be extracted by the STEB-UNet with high accuracy. Experimental results show that the proposed network demonstrates higher performance than other state-of-the-art (SOTA) building extraction algorithms on public datasets.
The rest of this paper is organized as follows. Section 2 introduces the proposed network design. Section 3 tests the performance of our network. We also compare the performance of the STEB-UNet with several SOTA algorithms and STEB-UNet variants on public datasets. Section 4 discusses the performance of different loss functions, the requirement of computational and memory resources for the network training platform, and a brief introduction of the future work. Section 5 summarizes the paper with the conclusion.

2. Methodology

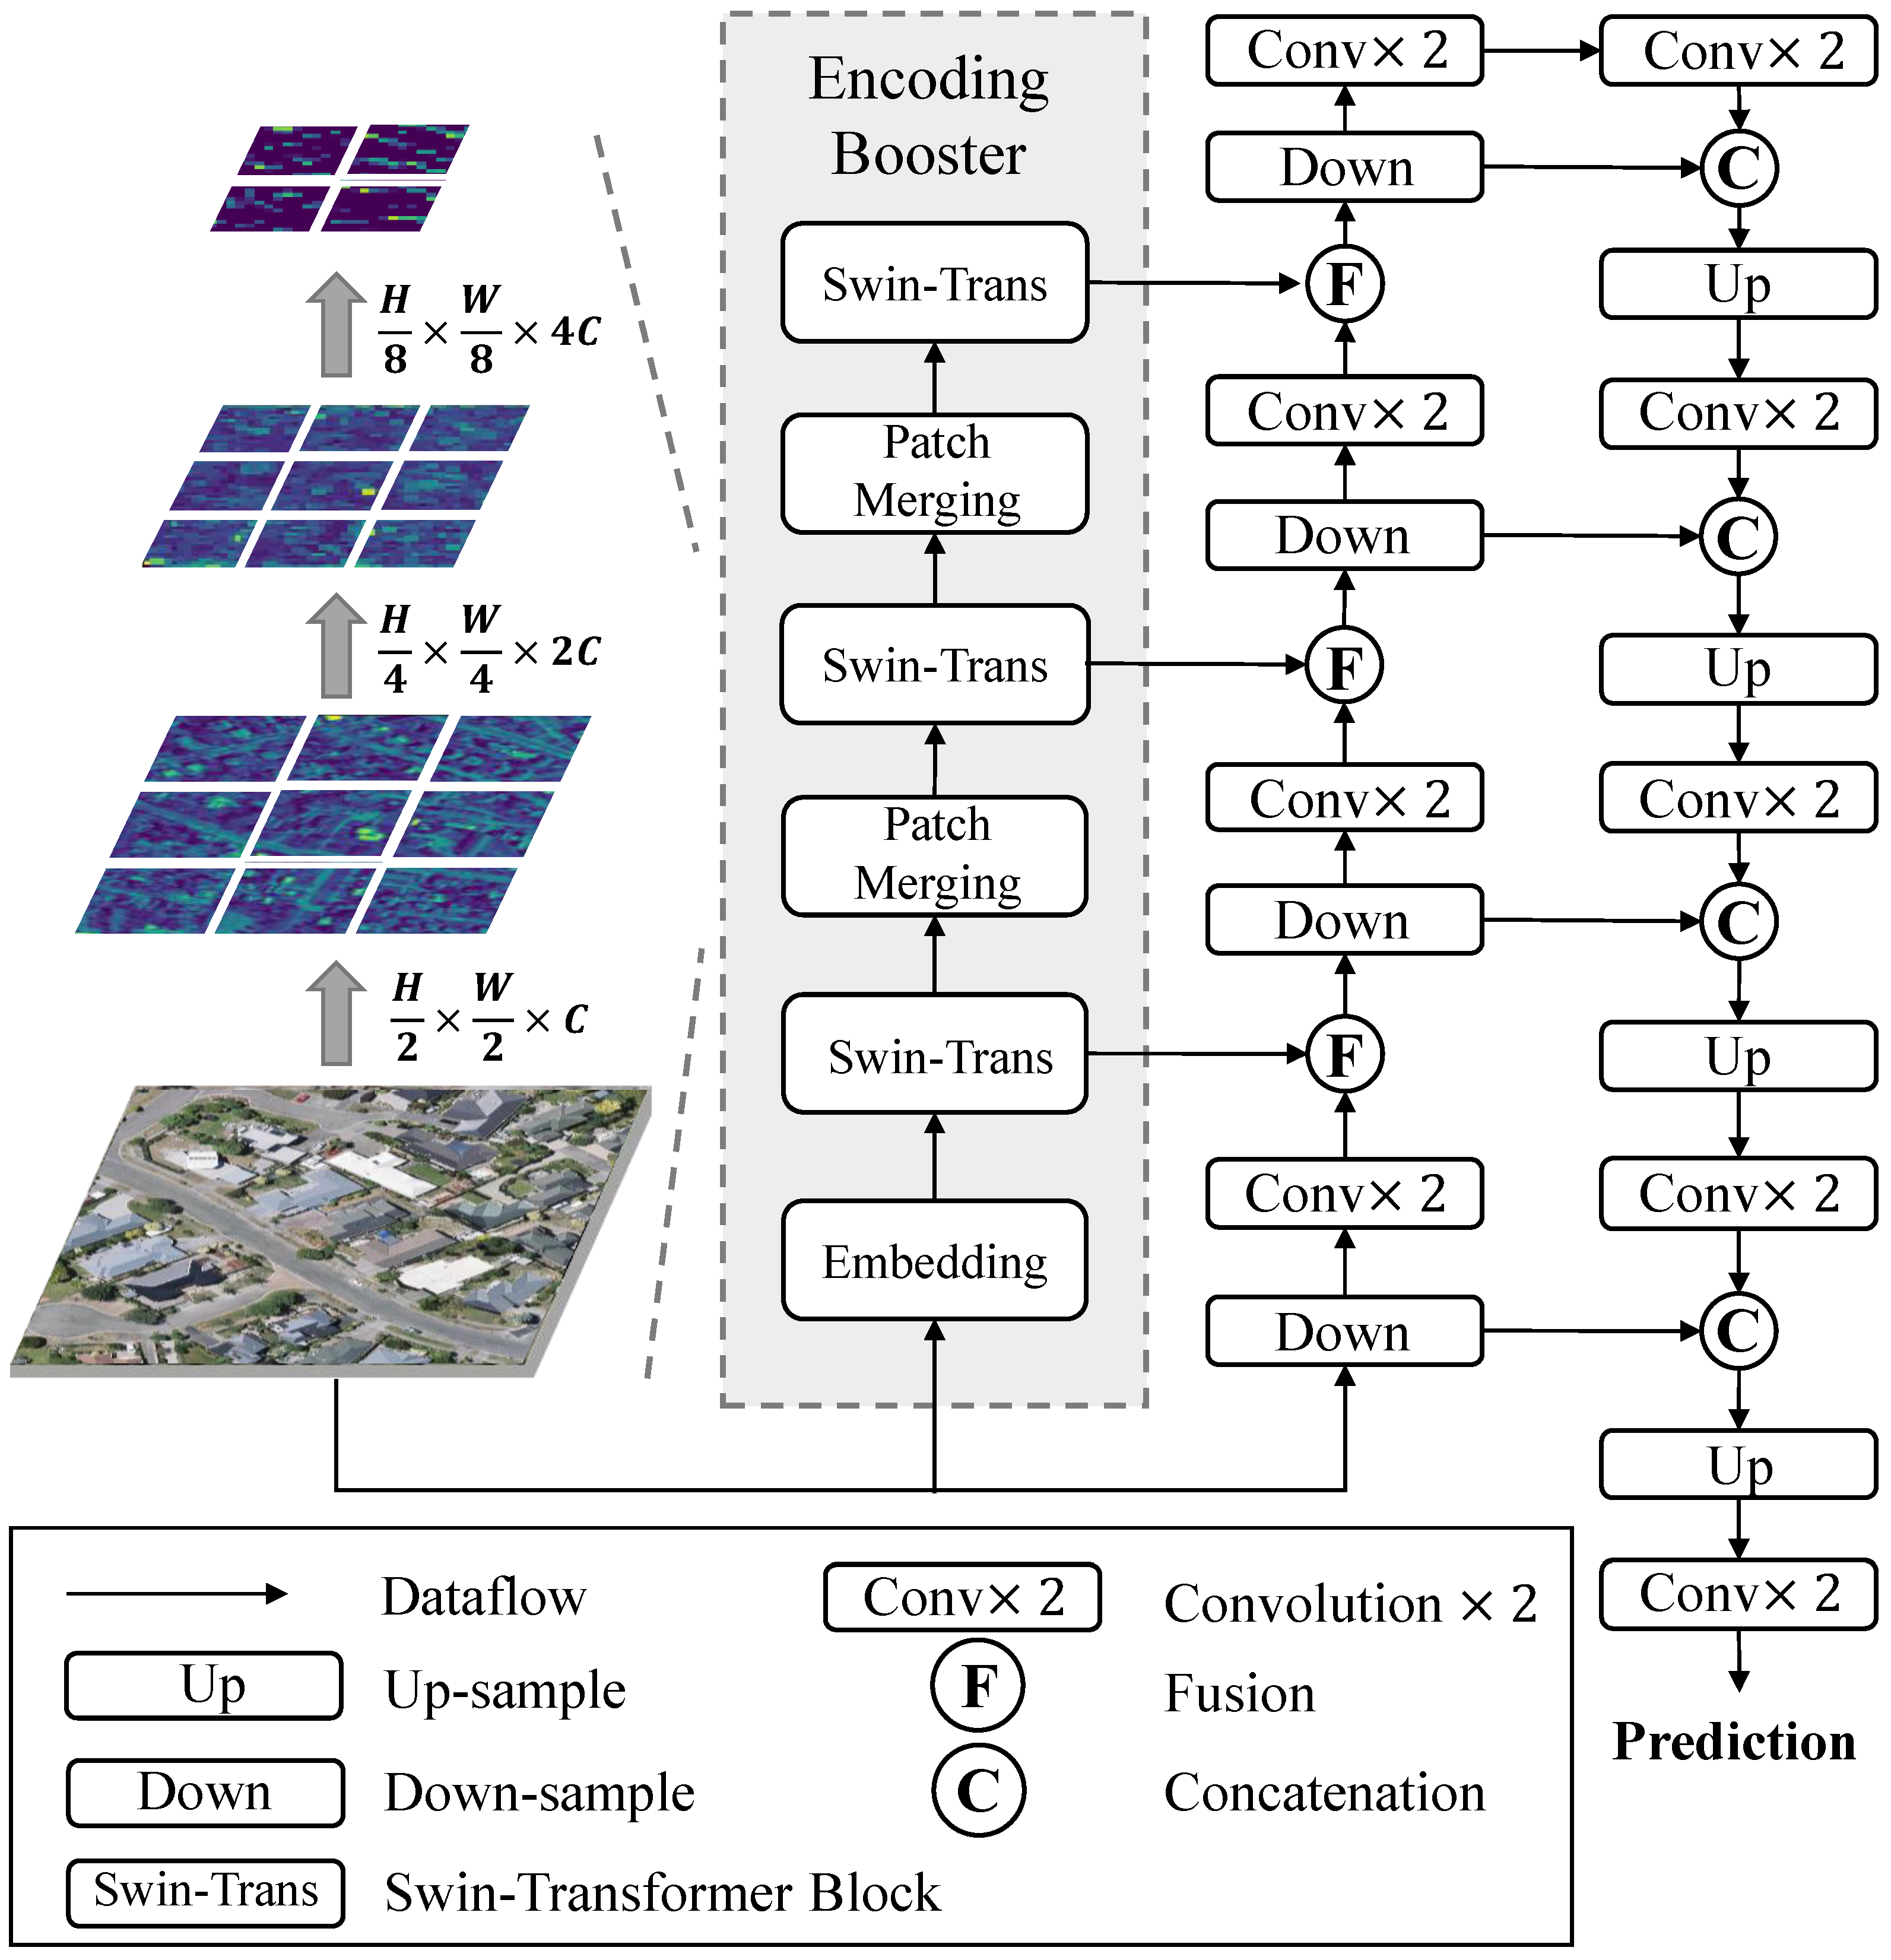
2.1. Overall Architecture

In this section, we propose the swin Transformer-based encoding booster and integrate it into a specially designed U-shaped network (U-Net) for building extraction. The overall network is called the Swin Transformer-based Encoding Booster- U-shaped Network (STEB-UNet), whose architecture is shown in Figure 1. The encoding booster is the key to our design because it significantly improves the network’s capability of capturing large-scale semantics by introducing the global self-attention mechanism via a swin Transformer. In the STEB-UNet, the input image will be fed to the encoding booster and the U-Net simultaneously. In the encoding booster, the input image will first pass through an embedding layer, where patch embedding and position embedding are performed for encoding the image to initial low-level features. The initial features will then pass through a swin Transformer pyramid composed of continuous swin Transformer blocks and patch-merging layers for higher-level feature extraction and down-sampling, respectively.
For the U-Net, based on the original convolution stages, up- (down-) sample layers and the skip connections design [34], we introduce the fusion block to achieve the feature fusion. The input image will go through a series of down-sample layers and convolutional layers on the encoding side. The features from the encoding booster and the U-Net at the same level will be fused in the fusion block and serve as the input features of the next encoding stage. The decoding side contains multiple convolutional layers and up-sample layers for restoring the spatial resolution of the feature. The encoded features will be transferred to the decoding side via the skip connections and concatenated with the decoded features of the same level to serve as the input feature of the next stage decoder. The final prediction is obtained after passing through all the decoding stages.

2.2. Transformer and Shifted-Window Design

The core of the Transformer is the use of a global self-attention mechanism to represent the global correlation between features. The self-attention mechanism can be described by:
Attention ( Q , K , V ) = softmax ( QK T d ) V ,
where matrices Q , K , and V represent the query, key, and value, respectively. d is a scaling factor used to avoid the vanishing gradient of the softmax ( · ) function. This kind of attention mechanism is called global because it is performed on a full feature instead of within a local receptive field. The self-attention is reflected in that in most implementations, the matrices Q , K , and V are the linear projections (i.e., the output results of several fully-connected layers) of the same embedded word vectors.
In most Transformer implementations [44,45], for reducing the O ( n 2 ) computational complexity brought by the matrix multiplications in the global self-attention computation, the input image is partitioned into multiple patches by a patch-embedding operation to reduce the length of the sequences before passing through the Transformer blocks. However, it is empirically shown that even after the patching embedding, the self-attention calculations on each patch still cause high computational and high memory requirements for the training platform. For addressing this problem, we utilize the shifted-window (swin) design [45] to further optimize the computational complexity. Based on patching, in a swin design the whole patched image is further partitioned into multiple non-overlapping shifted windows, and the computation of the self-attention will be restricted within each local window. Thus the complexity of the self-attention computation can be significantly reduced because each window contains a smaller number of patches than the whole image.
Figure 2 demonstrates the global self-attention computation with the swin design. The whole calculation process includes two steps as Figure 2a,b respectively, show. In the l th calculation, the whole feature map is divided into four areas by 4 × 4 windows. The self-attention computations are performed independently within areas bounded by each window. At the beginning of l + 1 th calculation, to cover the patch areas where the l th calculation has not been performed due to the shifted windows’ boundaries, all windows will shift 2 × 2 patches to the lower right. Although window shifting can establish the cross-window feature connections, it causes an increase in the number of areas (within solid orange boxes in Figure 2b), leading to the rebound in computational complexity. The newly generated areas with various sizes, such as the area A, B, and C, are also challenging for the self-attention computation on a uniform scale.
To solve the above problem and unify the computational scale, as Figure 2b shows, window splicing and masking [45] are introduced. In the l + 1 t h calculation after window shifting, first, the area A, B, and C will move to the lower right. Thus the moved and unmoved areas can splice together to form a new feature, which can still be divided by four 4 × 4 windows. Accordingly, the regular self-attention computation can be performed on this new feature as in the l t h computation. Furthermore, to ensure the semantic relevance of the adjacent regions, the moved and unmoved regions will be masked, respectively, to prevent interference during the l + 1 t h self-attention computation. After calculation, area A, B, and C will move back. These two calculation steps described above illustrated in Figure 2 will repeat until the end of the global self-attention computation.

2.3. Swin Transformer-Based Encoding Booster

The embedding layer contains two operations: patch embedding and position embedding. Since the computational complexity of the self-attention in the Transformer is O ( n 2 ) , the amount of computation grows exponentially with the length of the sequence. Accordingly, if we directly flatten the whole image, especially the high-resolution image, into a long pixel sequence, it will lead to high computational and memory costs. Therefore, it is of great necessity to perform image patching and treat each flattened patch as an input sequence of the shorter length to the swin Transformer block. Assume that the RGB input image is I R H × W × C , and the patch size is set to 2 × 2 . First, we can obtain H 2 × W 2 patches by image patching, and the dimension of each patch is 4 × C . Afterward, due to the position insensitivity of the self-attention computation, we exploit a learnable absolute position encoding [44] to avoid confusion in the semantics of the image representation. The position encoding can model the semantic relationships between patches at different positions and generate features with implicit position and spatial information through training. Then we project the patches by a fully-connected layer to the original dimension C for satisfying the subsequent feature fusion operation. Accordingly, the feature size after embedding layer becomes H 2 × W 2 × C .
After the embedding layer, the feature will pass through the swin Transformer pyramid, which consists of multiple swin Transformer blocks for extracting the global semantic information, and patch merging layers [45] for down-sampling. The swin Transformer block (shown in Figure 3) is composed of multiple encoders (shown in the blue dotted boxes), and each encoder contains layer normalization (LN), windowing multi-head self-attention (W-MSA) or shifted-windowing multi-head self-attention (SW-MSA), and multi-layer perception (MLP). It is built to implement the self-attention computation with the shifted window design. In particular, since the swin transformer block is a sequence-to-sequence model, the 2D features are flattened to sequences before input. In contrast, the output sequences are resized to 2D features to serve as the input of the patch-merging layer. The feature processing in the swin Transformer block can be described by the following equation:
z ^ = W MSA ( LN ( z 1 ) ) + z 1 , = 1 L
z = MLP ( L N ( z ^ ) ) + z ^ , = 1 L
z ^ + 1 = SW MSA ( L N ( z ) ) + z , = 1 L
z + 1 = MLP ( LN ( z ^ + 1 ) ) + z ^ + 1 ,     = 1 L
where L, z ^ , and z represent the number of encoders, the output sequences of (S)W-MSA and MLP, respectively. The encoder containing the W-MSA computation realizes the l-th self-attention calculation demonstrated in Figure 2, and the encoder containing the SW-MSA computation realizes the l + 1 -th self-attention calculation. Each pair of these two types of encoders realizes a whole cycle of the shifted-window global self-attention computation. Since the length of sequences is maintained before and after the computation, the encoders can be constantly stacked, enabling the swin Transformer block to capture global semantics.
In the swin Transformer pyramid, since the intermediate features produced by each swin Transformer block contain global semantic information of different scales, they will be treated as the output features at different levels of the encoding booster and utilized for the following feature fusion. Because the swin Transformer block does not change the feature scale, the input feature size of the first patch-merging layer is still H 2 × W 2 × C . We use patch merging to down-sample and obtain the multi-scale features at different levels. In the patch merging layer, the feature is first partitioned to 2 × 2 patch squares, and the patches at the same position in each square will be then reorganized in order and stacked in the channel dimension to form a H 4 × W 4 × 2 C features. Similarly, the feature size will be down-sampled to H 8 × W 8 × 4 C after the second patch-merging layer. With the patch merging, the image size shrinks, and the spatial dimensions expand gradually in the swin Transformer pyramid, allowing the encoding booster to construct more diverse spatial feature properties and extract richer multi-scale semantic and contextual information.

2.4. U-Shaped Network with Feature Fusion

As we mentioned above, the proposed network includes a swin Transformer pyramid and a specially designed U-shaped network (abbreviated as U-Net, shown in the right-hand of Figure 1). In this work, the feature fusion block is introduced into the U-Net to realize the feature-level fusion with the encoding booster mentioned above. Since down-sample layers are utilized to shrink the feature size, we call the data path on the encoding side of the U-Net the contracting path. Similarly, due to the utilization of up-sample layers for the feature size restoration, we call the data path on the decoding side the expansive path. In the following, we will introduce these two kinds of data paths and especially our fusion methodology of the swin Transformer-based encoding booster and the U-Net.
On the contracting path, as illustrated in Figure 1, each stage contains a down-sample layer and convolution layers. A 2 × 2 max-pooling layer is deployed in each down-sample layer. The max-pooling can expand the receptive field by shrinking the feature size, allowing fixed-scale features to include contextual information of larger areas. The scaled features are then passed by two successive 3 × 3 convolutional layers, where the dimensions of the features maintain.
As described above, the features extracted by our proposed encoding booster contain large-scale semantic information, while the convolutional operation and the special U-shaped structure enable the U-Net to extract local semantic features efficiently. Seeking to combine global and local semantic information on the contracting path, we fuse the features at each scale generated by U-Net encoders and Transformer blocks and serve the fused features as the input of the next-stage encoder. In the fusion blocks, the fusing operation includes a channel concatenation and 1 × 1 convolutions, which achieves the fusion of the extracted global and local semantic information and enhances the informative features through the network training. All operations in the STEB-UNet can be represented by
E k = Conv × 2 ( F d o w n k 1 ) , k = 1 H
B k = Merge ( Swin ( B k 1 ) ) , k = 1 H
F k = Conv 1 × 1 ( Concat ( E k , B k ) ) ,   k = 1 H
where E denotes the output of the U-Net encoder, B denotes the booster’s output, and F denotes the output of the fusion block. H is the height of the swin Transformer pyramid, and in Figure 1, H is equal to 3.
The feature fusion doubles the dimension of the feature due to the feature concatenation we exploit. With going to the deeper encoding stages on the contracting path, the scale of features continuously shrinks. Hence, the multi-scale semantic and contextual information can be extracted by convolutions on different-sized features. Overall, the contracting path promotes the efficiency of feature encoding by expanding the receptive and enabling multi-scale feature extraction. Most importantly, it fuses the features produced by the swin Transformer pyramid and the U-Net. Through our experiment, we empirically show that this highly-efficient fusion method enables our network to achieve state-of-the-art (SOTA) performance.
For the expansive path, we employ a regular design [34]. In contrast to the contracting path, the nearest interpolation algorithm is utilized in the up-sample layer on the expansive path to double the height and width of the features. After passing by two 3 × 3 convolutional layers which do not change the dimension, the features are concatenated with the features on the contracting path transmitted by the skip connection. In the U-Net, skip connection refers to the data path used to connect the corresponding encoding stage on the contracting and the decoding stage on the expansive paths. By using skip connections, the features which have not been fully encoded and still retain the original image information can be propagated to the decoding sides and fused with the decoded features. Therefore, the low-level and high-level semantic and contextual information contained in the features can be fused, which significantly improves the localization accuracy for segmentation tasks and the final prediction performance.

2.5. Loss Function

Dice loss [50] is a metric used to quantify the similarity of two sets. In terms of the building extraction task, given the prediction y ^ and the ground truth (GT) y, the Dice loss L d i c e can be calculated by the following equation:
L d i c e = 1 D ,
In this equation, D represents the Dice coefficient [50] in the range of [ 0 , 1 ] . It can be obtained by
D = 2 1 N y i × y i ^ 1 N y i 2 + 1 N y i ^ 2 ,
where y ^ i refers to the i t h pixel of the flattened prediction vector, y i refers to the i t h pixel of the flattened label vector, and N refers to the number of pixels. Obviously, D can be used to measure the similarity between prediction and GT. The closer D is equal to 1, the more similar the prediction and GT are. On the other hand, the closer D is equal to 0, the more different they are. This means that it is consistent with minimizing the Dice loss with converging the network. Therefore, we utilized Dice loss as the loss function of the STEB-UNet in this work.

3. Experiments and Results

3.1. Experiment Dataset

The Massachusetts building dataset contains 151 aerial images covering the 340 km2 Boston area, and each image with the size of 1500 × 1500 pixels covers a 2.25 km2 area. The entire dataset is split into a training set containing 137 images, a validation set containing 4 images, and a testing set containing 10 images. In the experiments of this paper, we will expand this dataset by performing data augmentation based on this division ratio.
The WHU dataset consists of more than 220,000 independent buildings extracted from aerial images with 0.075 m spatial resolution and 450 km2 covering Christchurch, New Zealand. The original aerial images are down-sampled to 0.3 m ground resolution and cropped into 8189 tiles with the size of 512 × 512 pixels, including 4736 tiles (including 130,500 buildings) for the training set, 1036 tiles (including 14,500 buildings) for the validation set and 2416 tiles (including 42,000 buildings) for the testing set.
Figure 4 shows the examples of source images and ground truth (GT) from the above datasets. Obviously, for images of the same size in the WHU and Massachusetts datasets, the regions covered by the former are significantly larger than that of the latter. Thus, the buildings in the Massachusetts dataset are denser and comprise fewer pixels. In contrast, the buildings in the WHU dataset occupy a larger pixel area and are sparser. Therefore, the challenge of extracting buildings in the WHU dataset is being able to extract buildings with clear and complete borders. For the Massachusetts dataset, the challenge is avoiding missing the small-scale buildings in the image.

3.2. Evaluation Metrics

Precision and recall are two evaluation metrics commonly used for segmentation networks. They can be obtained by
p r e c i s i o n = T P T P + F P ,
r e c a l l = T P T P + F N ,
where T P , F P , and F N represent the number of true positive, false positive, and false negative samples. In terms of the building extraction task, T P represents the number of pixels in the overlapping region of the predicted building and the GT building, T P + F P is the total number of pixels in the predicted building, and T P + F N is the total number of pixels in the GT building.
Even though the precision and recall can be used to evaluate models, they are usually negatively correlated, i.e., the larger the former, the smaller the latter, or vice versa, which makes it difficult to use either of them to fully assess the model’s performance. Therefore, in this paper, we employed the F 1 score for evaluation. The F 1 score can effectively alleviate this problem by considering both accuracy and recall. It can be obtained by
F 1 = 2 × p r e c i s i o n × r e c a l l p r e c i s i o n + r e c a l l
In addition, IOU is also utilized in this work. It can measure the similarity between the prediction and the true label. In the image segmentation task, IOU can be obtained by dividing the area of the intersection region of the prediction and ground truth by the area of their union region. IOU can be calculated by
I O U = T P T P + F P + F N ,
In terms of the building extraction task, T P represents the number of pixels in the overlapping region of the predicted building and the GT building, and T P + F P + F N represents the number of pixels of their union region.

3.3. Experimental Setting

In this experiment, we performed data processing on the original Massachusetts and WHU datasets. In terms of the Massachusetts dataset, we tiled each aerial image into 3 × 3 non-overlapping images at 500 × 500 pixels and performed data augmentation to further expand the dataset, including rotating and shifting. After processing, the Massachusetts dataset contains 5436 images in total. We used 4932 images for training, 144 images for validation, and 360 images for testing, keeping the same division ratio as the original dataset. In terms of the WHU dataset, we directly utilized its divided dataset, i.e., 4736 images for training, 1036 images for validation, and 2416 images for testing. Moreover, due to the limitation of the hardware memory, the images in both datasets were cropped randomly further to different sizes (shown in Table 1) before being fed into different networks.
Our proposed network STEN-UNet was implemented using the Pytorch deep-learning framework. All experiments were performed on the machine with an Intel Xeon Silver 4214r (2.4GHz frequency) CPU and Nvidia 3090 (24G memory per) × 4. All experimented networks were trained for 2000 epochs. The detailed training configurations for the proposed STEB-UNet and comparison networks are shown in Table 1. We selected the best models at a particular epoch on the validation dataset for testing and the performance comparison in Section 3.5.

3.4. Comparison Network

We compared our proposed network (shown in Figure 1) with the state-of-the-art (SOTA) segmentation networks, including the U-Net [34], the U 2 -Net [51], and the Segmentation Transformer (SETR) [52], as well as the building extraction networks, including the Building Residual Refine Network (BRRNet) [30] and the RFA-UNet [28]. Since the BRRNet [30] and the RFA-UNet [28] do not provide publicly available source codes or processed images, their experimental results and settings are the references of reports in the papers. For the other networks, we re-trained and selected the best models with the highest metrics for the comparisons in the following subsections. A detailed introduction to comparison networks is in the following paragraphs.
U-Net [34] is a fully convolutional network (FCN) and was originally used for medical image segmentation. The subsequent research also discovered its high accuracy in most segmentation tasks, including the building extraction tasks. The introduction to the U-Net is included in Section 1 and Section 2. Since all the CNNs in this experiment are based on the U-shaped architecture, the U-Net is regarded as a baseline network for comparisons.
U 2 -Net [51] introduces a two-level nesting design based on the U-shaped architecture. Each encoder or decoder stage of the U 2 -Net comprises a small nested U-Net. This nesting design enables the extraction of more contextual information from multi-scale features and increases the network depth without causing a dramatic growth in the number of parameters. The U 2 -Net demonstrates SOTA performance in segmentation tasks.
SETR [52] regards the training for segmentation tasks as a sequence-to-sequence learning. Different from the previous FCNs, which were the main approaching for image segmentation, SETR is a fully transformer-based network that uses the sequentialTransformer block to progressively extract the semantics and context. SETR provides three different decoder designs, and in this paper, we utilized the simplest and the most commonly used one called SETR-Naïve, where the encoder is composed of Transformer layers, and the decoder only contains two 1 × 1 convolutional layers and an up-sample layer to restore the image resolution.
BRRNet [30] and RFA-UNet [28] are FCNs for the building extraction task. The BRRNet contains a predict module and a refinement module. The predict module is a U-shaped network used to extract features. Taking the output of the predict module as an input, the refinement module is used to correct the prediction to reduce the deviations from the ground truth and further improve the network’s accuracy. The RFA-UNet is based on a standard U-shaped architecture. In particular, the RFA-UNet contains an attention module to re-weight the features along spatial and channel dimensions, which can bridge the gap between high-level and low-level features, thus enhancing the consistency of features before the concatenation.
Transformer-based Encoding Booster- U-shaped Network (TEB-UNet) is built as a variant of the proposed STEB-UNet to verify the effectiveness of our swin Transformer-based encoding booster. The overall architecture of the TEB-UNet is the same as the STEB-UNet (shown in Figure 1), except the swin Transformer block in the encoding booster which we replaced with the basic vision Transformer module [44]. The basic Transformer module does include the shifted-window design, which means the self-attention is calculated directly on the whole feature map instead of in each fixed-size shifted window. In addition, the patch merging as a down-sampling method used in the swin Transformer pyramid was replaced with a simple 2 × 2 max-pooling operation to ensure size matching for feature concatenation.

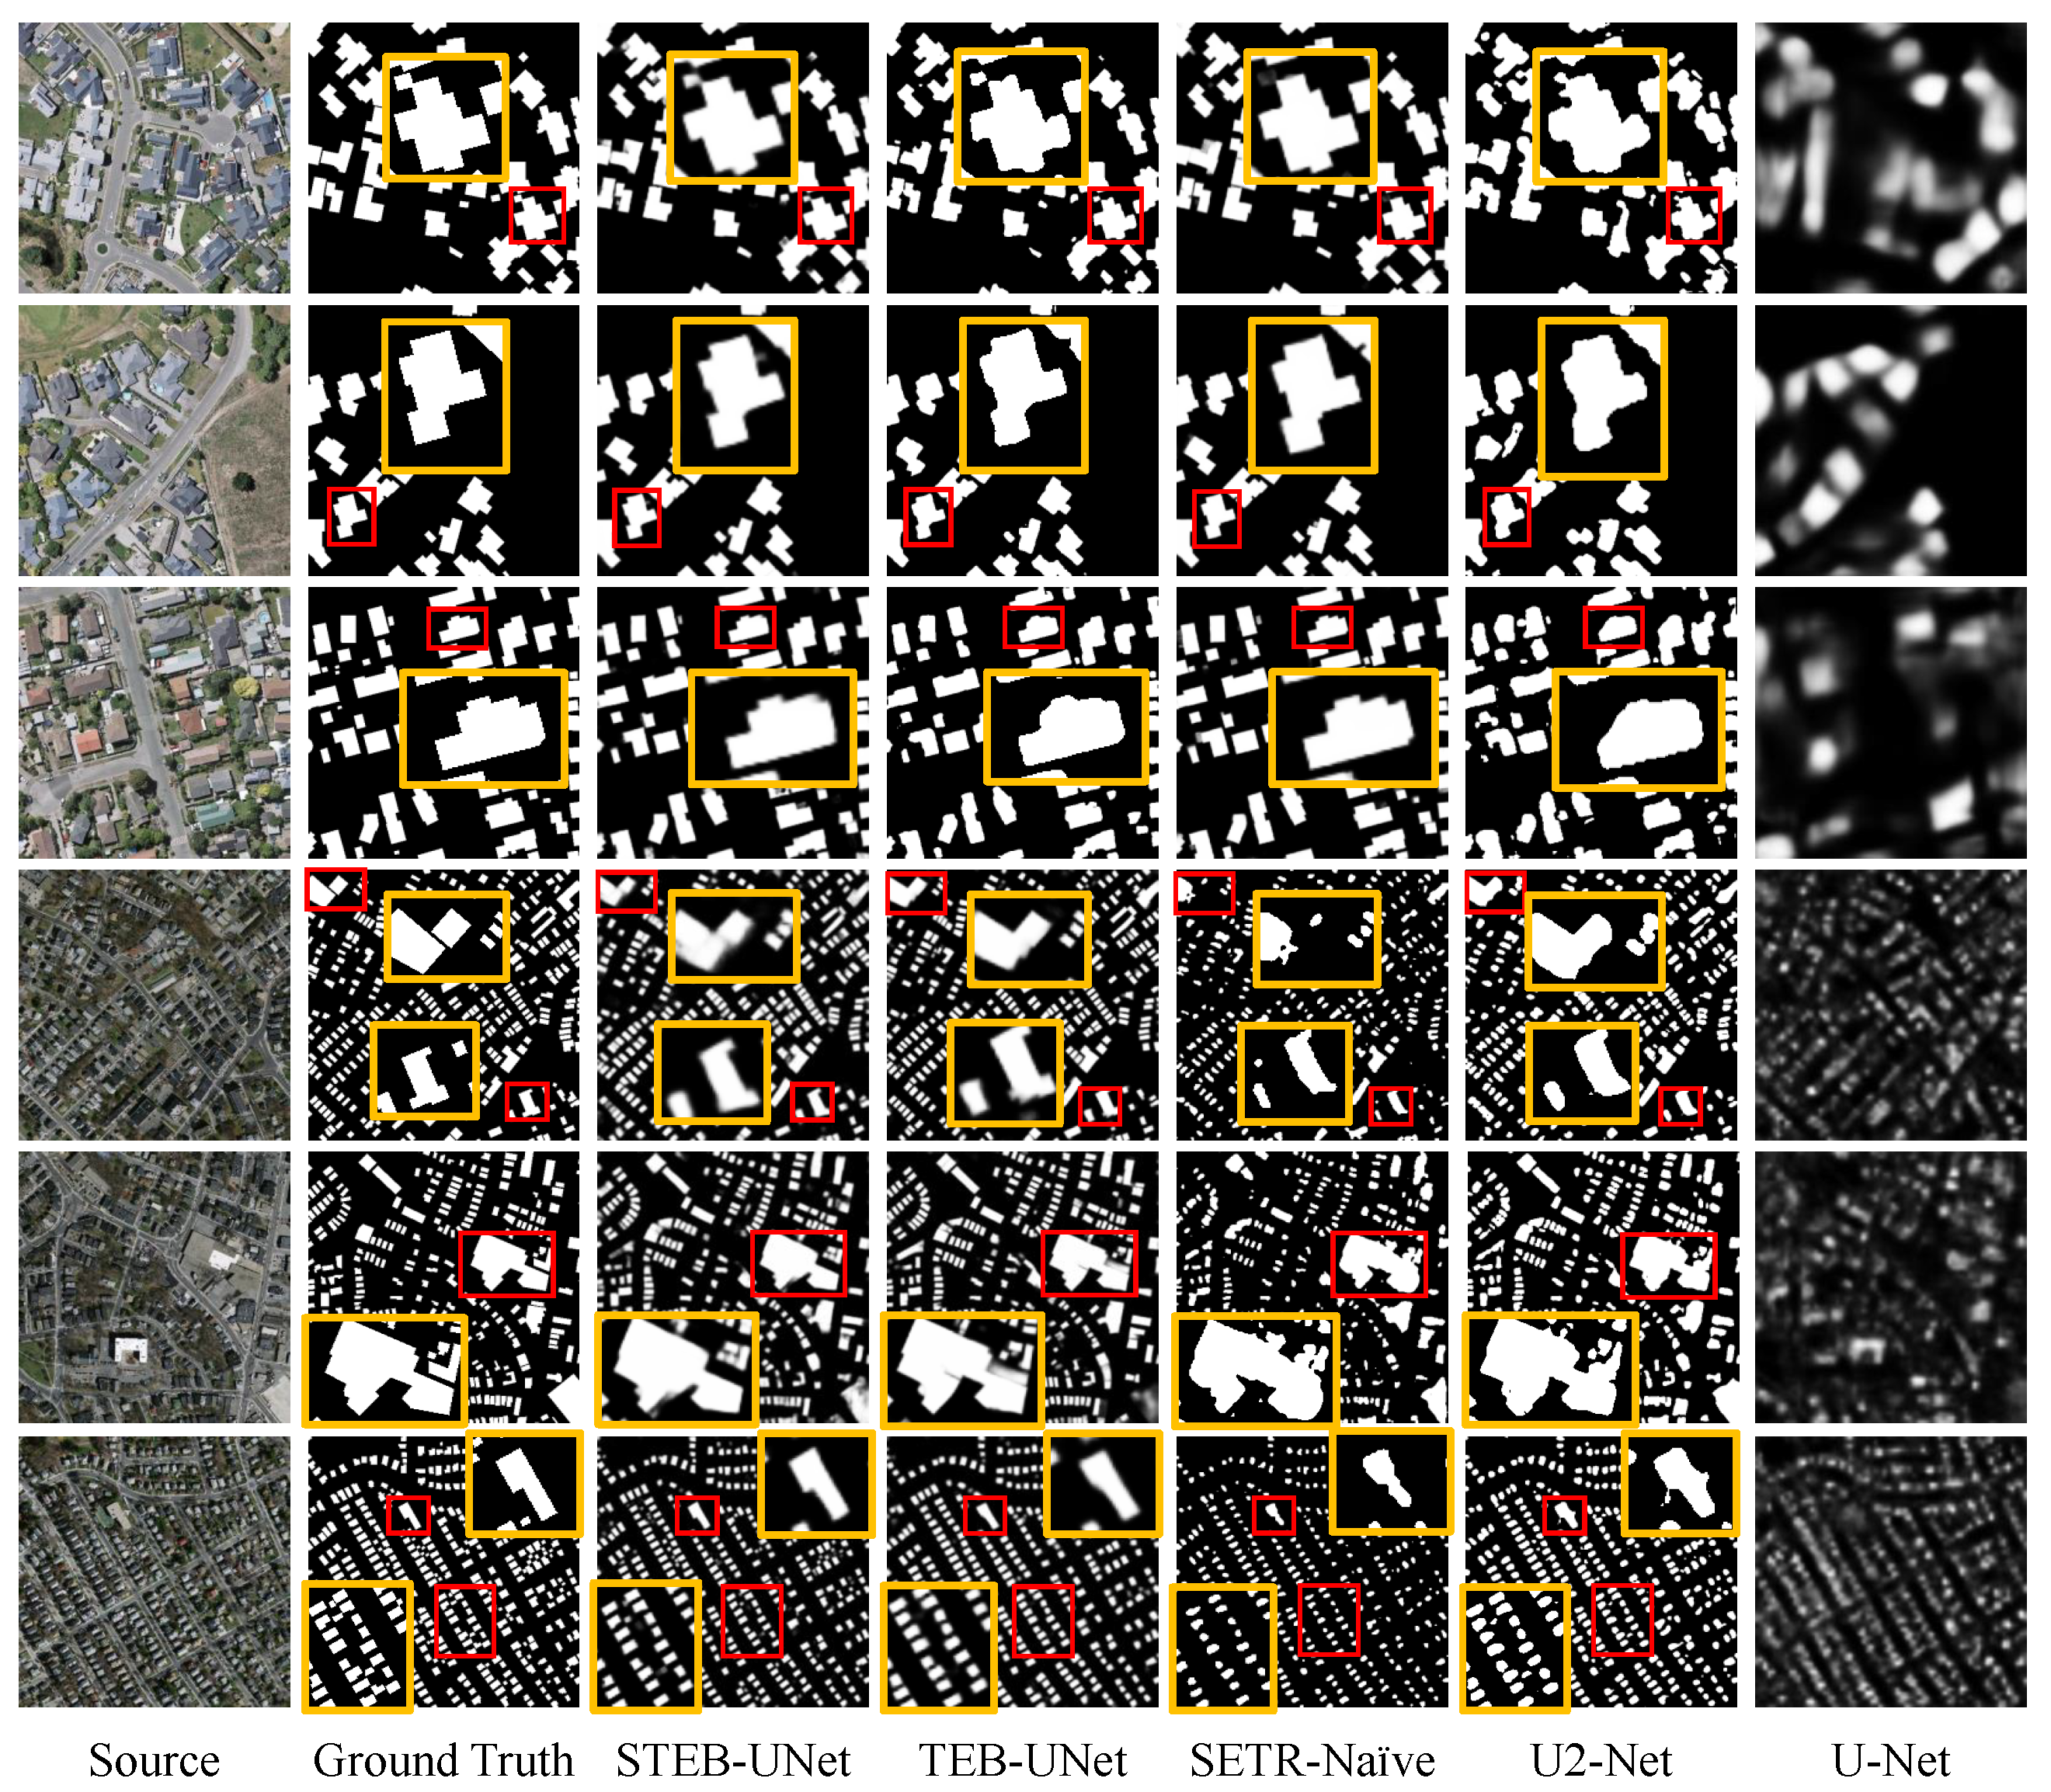
3.5. Experimental Result and Analysis

Figure 5 demonstrates the comparison of extraction results of different approaches. The first three rows show the WHU dataset, and the last three rows show the Massachusetts dataset. The areas where the STEB-UNet shows greater advantages have been marked in red boxes. Since our network can better identify the internal feature similarity of building areas and the differences between buildings and non-building objects, therefore, the extracted buildings by our network have clearer boundaries and more complete outlines. In Figure 5, the images in the first three rows show that for some buildings occupying large areas, our proposed network can segment the edges more accurately compared to other networks. The images in the last three rows show that our network can extract large areas of buildings more completely and minimize the missing of buildings of small areas extracted from aerial photographs, thus effectively improving the accuracy of building extraction.
To highlight the advantages of the STEB-UNet over traditional CNN-based methods, we visualize the performance of the STEB-UNet and the U 2 -Net on the WHU and Massachusetts datasets in Figure 6. We chose the U 2 -Net for comparison because its computation is entirely based on convolutional operations. The examples show that the U 2 -Net misses a lot of building areas (blue boxes), especially for buildings on a large scale (e.g., the last column of Figure 6b, and the middle column of Figure 6d). In contrast, the segmentation of building boundaries by the STEB-UNet is sharper and more accurate, and the missed, as well as the incorrectly extracted building areas (red boxes), are much less than those of the U 2 -Net. This indicates that our Transformer-based encoding booster exhibits a good performance of large-scale semantic extraction, which significantly improves building extraction.
In addition to the visual comparison of the experimental results, we also quantified the comparison of results using the F 1 score and I O U metrics. The higher F 1 score or I O U indicates a better performance of the model. The comparisons of metrics of different networks are shown in Table 2. The results in Table 2 show that the proposed STEB-UNet achieves the best performance compared with other networks, especially on the WHU dataset. Compared with the U-Net as the baseline, the STEB-UNet shows great advantages on both datasets, which verifies the effectiveness of the proposed swin Transformer-based encoding booster. Compared with other fully convolutional networks based on U-shaped structures (i.e., BRRNet, U 2 -Net, and RFA-Net), our integrated swin Transformer-based encoding booster can effectively break through the limitations of local perceptive fields and extract richer feature information, especially large-scale features. The performance of SETR in the building extraction task is limited because SETR does not include the utilization of convolutional operations in the encoding stage, resulting in the lack of some inductive biases, such as a strong correlation of local semantics, shift in-variance, etc. Compared with SETR, the STEB-UNet significantly improves the performance because of the convolution-based-encoding structure, which greatly improves the localization accuracy. Moreover, the slight performance improvement of the STEB-UNet over the TEB-UNet verifies that our swin Transformer pyramid can extract semantic information at different scales more efficiently and accurately.

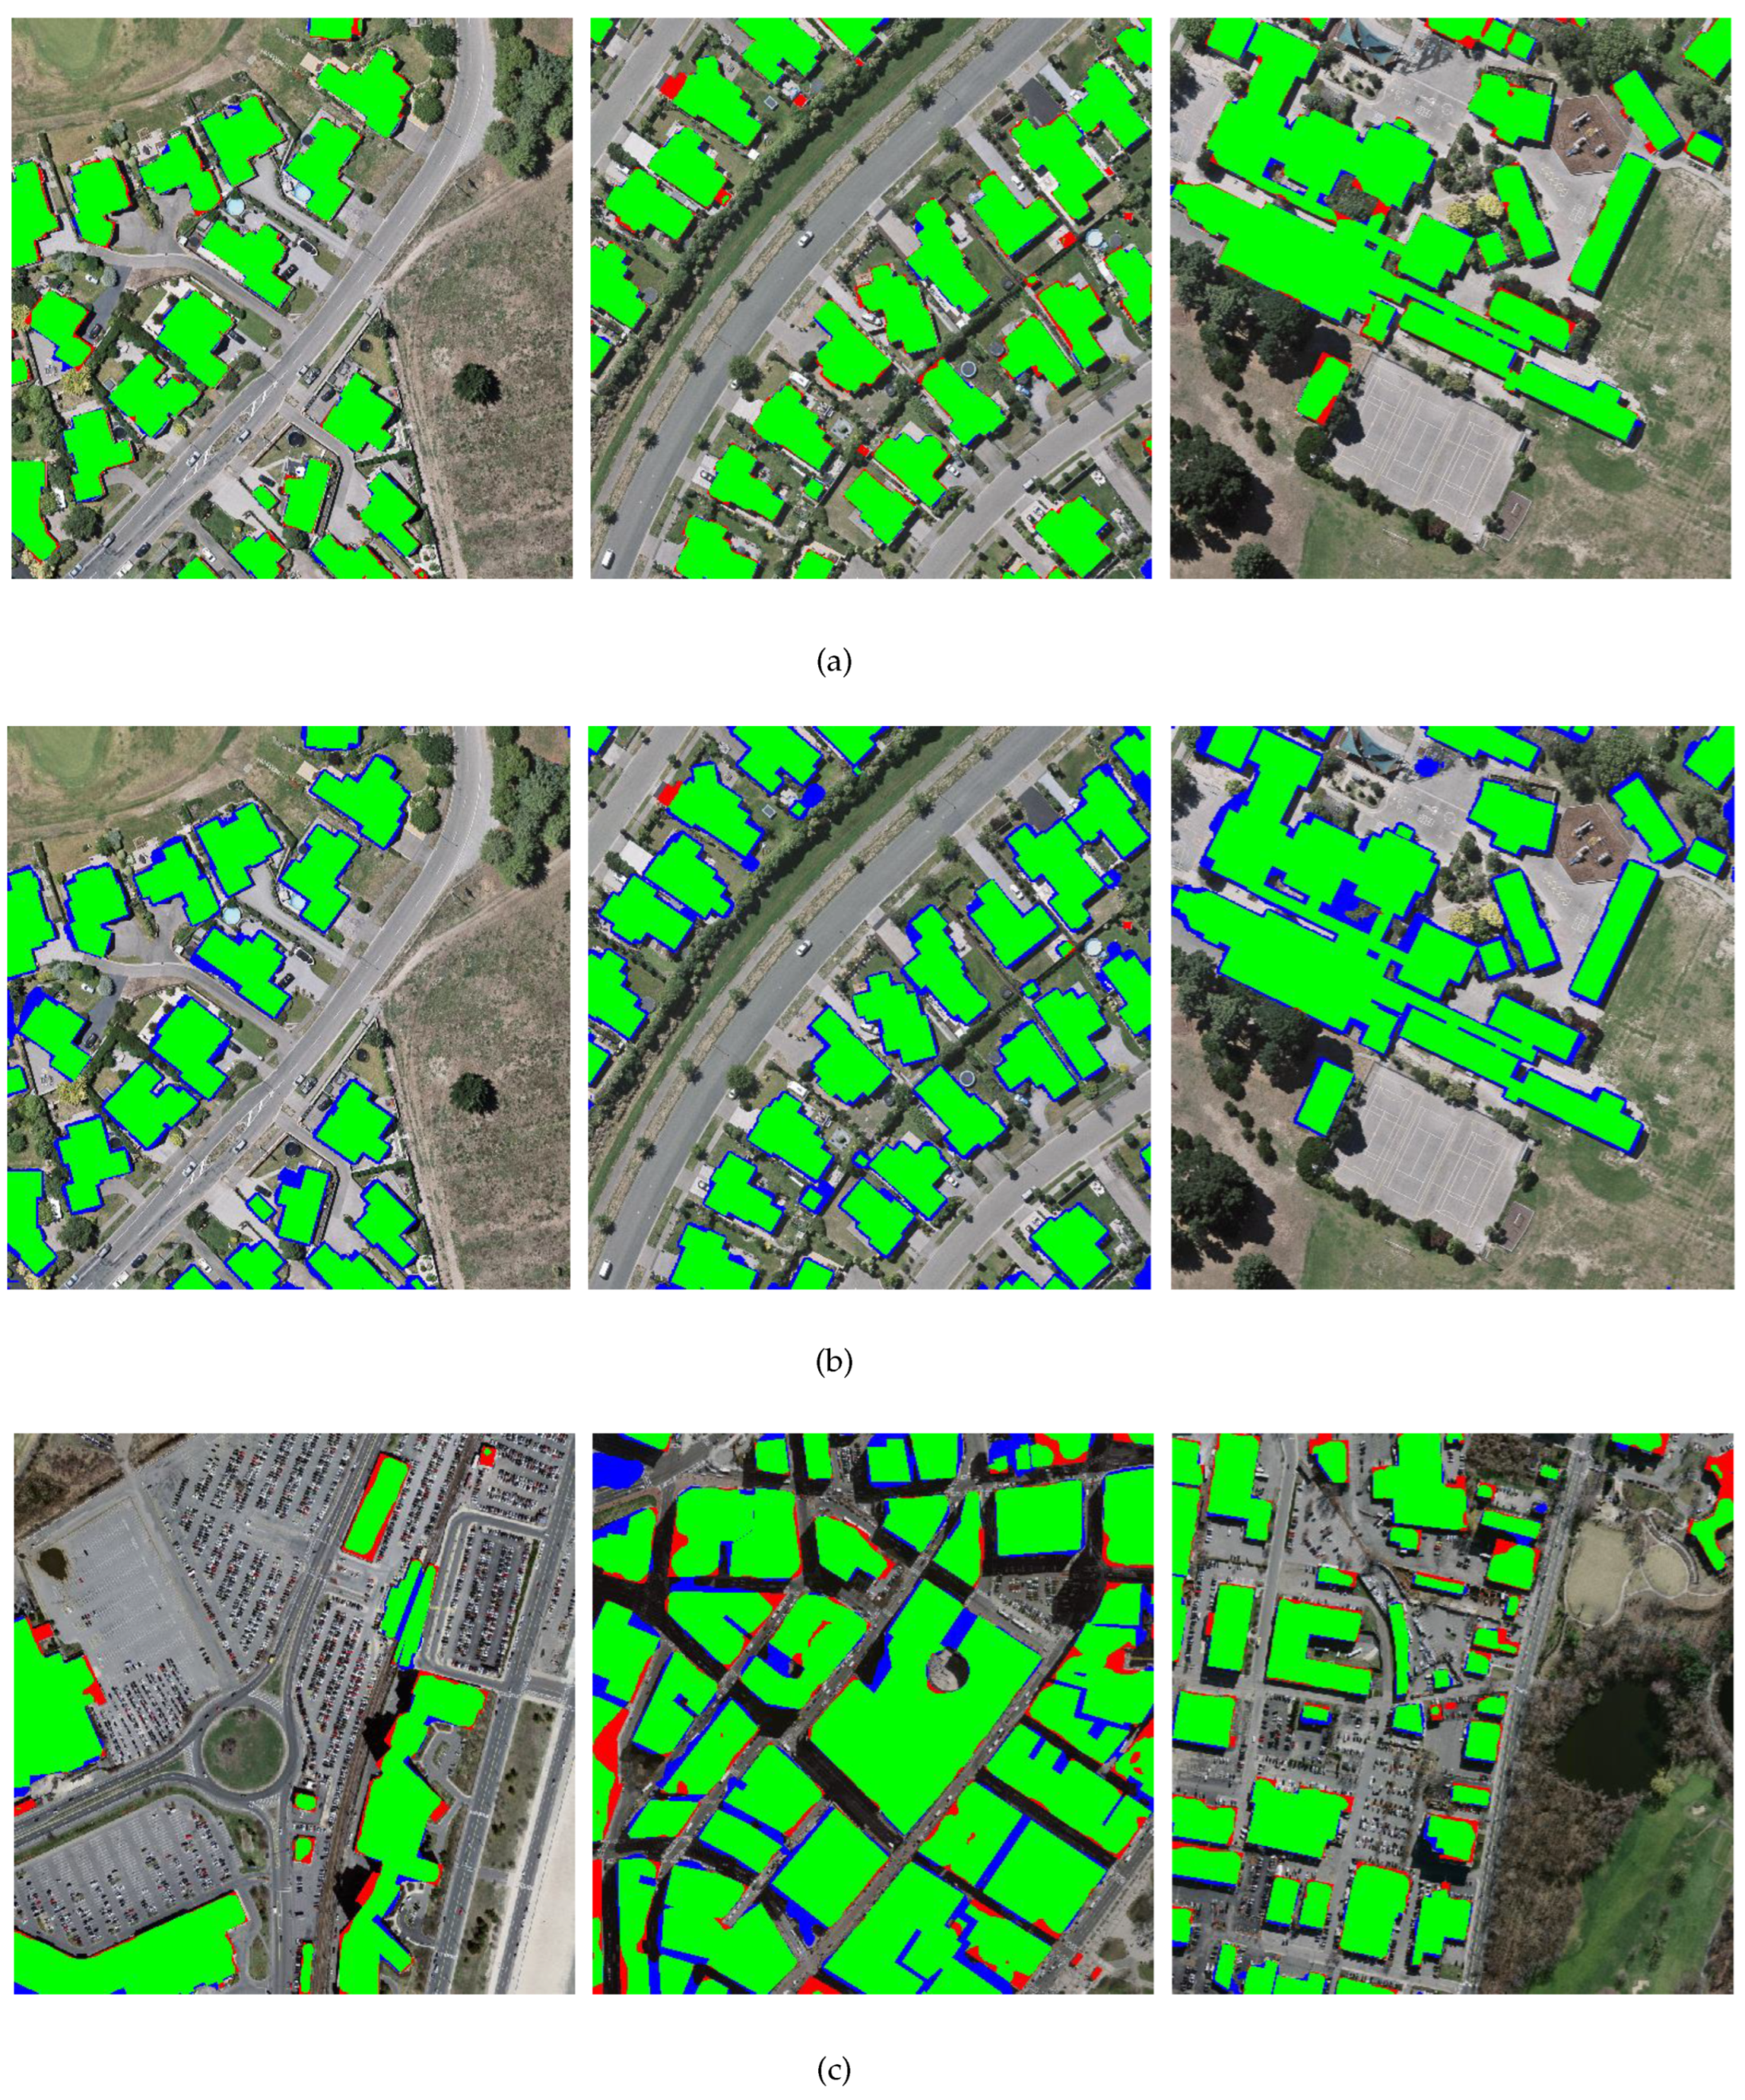
3.6. Generalization Testing

In deep supervised learning, we trained and tested the network on the same dataset. However, we often faced target data with different feature distributions from the training dataset in practical applications. In such conditions, the generalization ability of an algorithm is important because it can affect the performance on unknown data. To explore the generalization ability of our proposed network, we performed the generalization testing experiment to simulate and evaluate the effectiveness of experimental networks in real applications.
The experimental results are illustrated in Table 3. The results in the “Massachusetts” column were obtained by training networks on the WHU dataset and testing on the Massachusetts dataset. Similarly, the results in the “WHU” column were obtained by training networks on the Massachusetts dataset and testing on the WHU dataset. Table 3 shows that the testing metrics of different networks generally decrease compared to the ordinary learning, while the decline is more pronounced on the WHU dataset than on the Massachusetts dataset. According to our analysis, the possible reason is that since the sizes of most buildings in the Massachusetts dataset are relatively small, the shapes and edge characteristics of these low-resolution buildings are fuzzy and different from those of the larger-sized buildings in the WHU dataset. This makes it difficult for the model trained on the Massachusetts dataset to perform well on the WHU dataset. In contrast, due to the high resolution of buildings in the WHU dataset with clear boundaries, the trained model can still recognize the inherent features of buildings and distinguish them from the features of surrounding non-building objects when detecting small buildings targets.
Table 3 also illustrates that first, the network including Transformers still outperforms CNNs in the generalization testing, and the drop of their experimental metrics is less than that of CNNs. Our explanation of this phenomenon is that due to its advantages in extracting large-scale contextual and semantic information, the Transformer can still identify buildings of different sizes with high accuracy when generalizing to other datasets. Second, we can find that SETR-Naïve is less affected on both datasets than other networks. We analyze the possible reasons are the feature extraction of SETR-Naïve only achieved by Transformer layers, and the lack of fusion of multi-scale semantic and contextual information that other U-shaped networks include. Therefore, although the testing results are still not as good as the TEB-UNet and the STEB-UNet, the feature extraction of SETR-Naïve can be consistent on different datasets, and thus the performance of SETR-Naïve can also be maintained to a certain extent when processing data with different feature distributions. Most importantly, the proposed STEB-UNet still demonstrates the highest performance in generalization testing, indicating a good generalization to extract buildings on different datasets with high accuracy.

4. Discussion

To alleviate the problem that traditional convolutional neural networks (CNNs) have difficulty extracting large-scale semantic information from high-resolution remote sensing images (HRRSIs), we propose a swin Transformer-based encoding booster to enable the network to capture global features. We integrated this encoding booster into a U-Net, which has performed well in segmentation tasks, to alleviate the incomplete or incorrect segmentation of large buildings due to the local receptive fields in the convolution process, thus improving the accuracy of the building extraction. We call the integrated network the Swin Transformer-based Encoding Booster- U-shaped Network (STEB-UNet). In this section, first, we will compare the performance of the STEB-UNet with different loss functions. Then we will discuss the resource requirements of the proposed network for the training platform and compare it with other networks mentioned in Section 3. Finally, we will briefly introduce our future work.

4.1. Loss Function

As mentioned in Section 2.5, we used Dice loss [50] as the target function for network training in this work. Dice loss was originally applied for medical segmentation task [50], but it is also utilized in existing building extraction works [30,54]. In addition to Dice loss, the binary cross-entropy (BCE) loss is another widely used loss function. In particular, it has been employed in some Transformer-related networks [45,46,55,56] and demonstrates good performance. BCE is utilized to reflect the similarity between two probability distributions. For the building extraction task, given the prediction y ^ and the true label y, BCE loss can be obtained by the following equation:
L b c e = 1 N i = 1 N y i ln y i ^ + ( 1 y i ) ln ( 1 y i ^ ) ,
Similar to the definitions of the Dice loss calculation, in the above equation, y ^ i refers to the i t h pixel of the flattened prediction vector, y i refers to the i t h pixel of the flattened label vector, and N refers to the number of pixels.
Since the proposed STEB-UNet also contains Transformer blocks, we experimented to use BCE as the loss function and compared the testing results with those obtained by using Dice loss. Furthermore, inspired by TransFuse [56] and Msst-net [46], whose loss functions are composed of several different targets, we tried a weighted combination of Dice and BCE loss to experiment whether the combined loss function could enable the network to obtain better testing results through supervising the network training. The combined loss L c m b can be calculated by
L c m b = α L b c e + ( 1 α ) L d i c e α ( 0 , 1 ) ,
where α is an adjustment factor used to adapt the weight of two loss functions. The definition of L d i c e can be found in Section 2.5.
Table 4 illustrates the performance comparison of the STEB-UNet with different aforementioned loss functions, including the BCE loss, the Dice loss, and the combined loss. From Line 1 and Line 2, we can see that the Dice loss achieves better performance than the BCE loss. Moreover, the combination strategy of two loss functions does not show apparent superiority, and its performance is between Dice loss and BCE loss. Also, different settings of the α values to adjust the weight of the Dice and the BCE loss do not yield much difference since the testing metrics are almost the same. Therefore, through the experiments in this subsection, we empirically show that using the Dice function as the loss function for the STEB-UNet can achieve better performance for the building detection task than using BCE loss or a combination of two losses.

4.2. Resource Requirement Analysis

Large-scale networks tend to have higher accuracy, but their numerous parameters will also bring significant storage challenges to the computing platforms, especially mobile devices. Therefore, the trade-off between accuracy and the number of parameters is an important part of the network design. To this end, we counted the number of parameters of different networks. Figure 7 demonstrates that the proposed STEB-UNet has a relatively fewer number of parameters while maintaining high accuracy (shown in Section 3).
From Figure 7, we can also find that the number of parameters of Transformer-included networks (TEB-UNet, SETR, and STEB-UNet) is generally higher than the convolution-based networks at the same depth. In fact, despite the high performance in segmentation tasks, Transformer-included networks are much more training costly in practice. The reason is that the computation of the global attention mechanism leads to a higher requirement of memory and computational power because of the enormous computational complexity, which is always one of the major challenges in training Transformer-included networks.
To explore the memory and computational requirement for training different Transformer-based networks mentioned in this paper, we counted the number of parameters, the GPU memory, and the training time of a single epoch for the SETR, TEB-UNet, and the proposed STEB-UNet. Table 5 shows the experimental results. SETR has the most number of parameters, almost 2× more than the other networks whose quantities of parameters are close. Due to the high computational complexity of the global attention in Transformer, larger GPU memory is needed to train SETR and TEB-UNet, nearly 9× and 7× more than training the STEB-UNet, respectively. Since 20 GB GPU memory is required to train them feeding with a single 128 × 128 image, the batch size can only be set to one even on a 3090 (24 GB) high-performance computational platform. In contrast, due to the window-shifting design, STEB-UNet’s global self-attention computation is limited to a fixed-size window; thus, the GPU memory required for training is greatly reduced. We experimented that up to 12 input images can be fed to the STEB-UNet in a single batch. Considering that the comparisons in this table were obtained when the batch size was set to one, the difference in actual training time will be further enlarged due to the distributed training with multiple GPUs in real applications where the batch size is much larger than one.

4.3. Future Work

Despite STEB-UNet’s relatively inexpensive computational and storage resource cost, it can only achieve 7 to 8 FPS training speed and 19 to 20 FPS inference speed in experiments. Therefore, compared to other slightly less accurate but lighter networks, currently the STEB-UNet is unsuitable for real-time building extraction tasks or deployed on low-computational mobile platforms. In the future, we can probably address this challenge by introducing the lightweight design, such as knowledge distillation, tensor decomposition, and deep separable convolution, to achieve model compression with minimal loss of accuracy.

5. Conclusions

In this paper, to promote large-scale semantic extraction in remote sensing building extraction tasks, we proposed a shifted-window Transformer-based encoding booster. Compared with the convolution-based encoders, our encoding booster can capture large-scale semantic information more efficiently because of the significant expansion of the perceptive field by the global self-attention mechanism of the swin Transformer. Moreover, due to the utilization of patch merging for down-sampling, our encoding booster can extract semantic information from multi-level features. Furthermore, through integrating the encoding boosters into a U-Net with feature fusion blocks in a novel manner, our network called the Swin Transformer-based Encoding Booster- U-shaped Network (STEB-UNet) can fully exploit their advantages in large-scale feature extraction and high localization accuracy. Particularly, due to the shifted-window design, the STEB-UNet has lower computational and memory costs than other Transformer-included networks while maintaining high performance. Experiments on public datasets demonstrated that our proposed network achieves higher building extraction accuracy than state-of-the-art networks.

Author Contributions

X.X. supervised the study, gave suggestions and revised the manuscript; W.G. proposed the original idea, completed the programming and wrote the manuscript. R.C. completed the experiments and collected the data; Y.H. collected the data and revised the manuscript; J.W. and H.Z. gave suggestions and revised the manuscript. All authors have read and agreed to the published version of the manuscript.

Funding

This work was supported in part by the NSFC under Grant 61901341 and 61403291, in part by the China Postdoctoral Science Foundation under Grant 2021TQ0260, in part by the GHfund under Grant 202107020822 and 202202022633, and in part by the National Natural Science Foundation of Shaanxi Province under Grant 2020JQ-301.

Institutional Review Board Statement

Not applicable.

Informed Consent Statement

Not applicable.

Data Availability Statement

The data used in this work are WHU buildings dataset [53] and Massachusetts buildings dataset [36]. They can be download from http://gpcv.whu.edu.cn/data/building_dataset.html (accessed on 2 January 2022) and https://www.cs.toronto.edu/~vmnih/data (accessed on 7 January 2022), respectively.

Acknowledgments

We would like to thank the anonymous reviewers for their constructive and valuable suggestions on the earlier drafts of this manuscript.

Conflicts of Interest

The authors declare that there is no conflict of interest.

References

  1. Enemark, S.; Williamson, I.; Wallace, J. Building modern land administration systems in developed economies. J. Spat. Sci. 2005, 50, 51–68. [Google Scholar] [CrossRef]
  2. Blaschke, T. Object based image analysis for remote sensing. ISPRS J. Photogramm. Remote Sens. 2010, 65, 2–16. [Google Scholar] [CrossRef] [Green Version]
  3. Li, X.; Li, Z.; Yang, J.; Liu, Y.; Fu, B.; Qi, W.; Fan, X. Spatiotemporal characteristics of earthquake disaster losses in China from 1993 to 2016. Nat. Hazards 2018, 94, 843–865. [Google Scholar] [CrossRef]
  4. Liu, Y.; Li, Z.; Wei, B.; Li, X.; Fu, B. Seismic vulnerability assessment at urban scale using data mining and GIScience technology: Application to Urumqi (China). Geomat. Nat. Hazards Risk 2019, 10, 958–985. [Google Scholar] [CrossRef] [Green Version]
  5. Zhang, B.; Chen, Z.; Peng, D.; Benediktsson, J.A.; Liu, B.; Zou, L.; Li, J.; Plaza, A. Remotely sensed big data: Evolution in model development for information extraction [point of view]. Proc. IEEE 2019, 107, 2294–2301. [Google Scholar] [CrossRef]
  6. Saeedi, P.; Zwick, H. Automatic building detection in aerial and satellite images. In Proceedings of the 2008 10th International Conference on Control, Automation, Robotics and Vision, Hanoi, Vietnam, 17–20 December 2008; pp. 623–629. [Google Scholar]
  7. Huang, X.; Zhang, L. Morphological building/shadow index for building extraction from high-resolution imagery over urban areas. IEEE J. Sel. Top. Appl. Earth Obs. Remote Sens. 2011, 5, 161–172. [Google Scholar] [CrossRef]
  8. Ok, A.O.; Senaras, C.; Yuksel, B. Automated detection of arbitrarily shaped buildings in complex environments from monocular VHR optical satellite imagery. IEEE Trans. Geosci. Remote Sens. 2012, 51, 1701–1717. [Google Scholar] [CrossRef]
  9. Manno-Kovács, A.; Ok, A.O. Building detection from monocular VHR images by integrated urban area knowledge. IEEE Geosci. Remote Sens. Lett. 2015, 12, 2140–2144. [Google Scholar] [CrossRef]
  10. Femiani, J.; Li, E.; Razdan, A.; Wonka, P. Shadow-based rooftop segmentation in visible band images. IEEE J. Sel. Top. Appl. Earth Obs. Remote Sens. 2014, 8, 2063–2077. [Google Scholar] [CrossRef]
  11. Li, E.; Xu, S.; Meng, W.; Zhang, X. Building extraction from remotely sensed images by integrating saliency cue. IEEE J. Sel. Top. Appl. Earth Obs. Remote Sens. 2016, 10, 906–919. [Google Scholar] [CrossRef]
  12. Manno-Kovacs, A.; Sziranyi, T. Orientation-selective building detection in aerial images. ISPRS J. Photogramm. Remote Sens. 2015, 108, 94–112. [Google Scholar] [CrossRef]
  13. Inglada, J. Automatic recognition of man-made objects in high resolution optical remote sensing images by SVM classification of geometric image features. ISPRS J. Photogramm. Remote Sens. 2007, 62, 236–248. [Google Scholar] [CrossRef]
  14. Turker, M.; Koc-San, D. Building extraction from high-resolution optical spaceborne images using the integration of support vector machine (SVM) classification, Hough transformation and perceptual grouping. Int. J. Appl. Earth Obs. Geoinf. 2015, 34, 58–69. [Google Scholar] [CrossRef]
  15. Du, S.; Zhang, F.; Zhang, X. Semantic classification of urban buildings combining VHR image and GIS data: An improved random forest approach. ISPRS J. Photogramm. Remote Sens. 2015, 105, 107–119. [Google Scholar] [CrossRef]
  16. Katartzis, A.; Sahli, H. A stochastic framework for the identification of building rooftops using a single remote sensing image. IEEE Trans. Geosci. Remote Sens. 2007, 46, 259–271. [Google Scholar] [CrossRef]
  17. Sirmacek, B.; Unsalan, C. Urban-area and building detection using SIFT keypoints and graph theory. IEEE Trans. Geosci. Remote Sens. 2009, 47, 1156–1167. [Google Scholar] [CrossRef]
  18. Liu, Z.; Cui, S.; Yan, Q. Building extraction from high resolution satellite imagery based on multi-scale image segmentation and model matching. In Proceedings of the 2008 International Workshop on Earth Observation and Remote Sensing Applications, Beijing, China, 30 June–2 July 2008; pp. 1–7. [Google Scholar]
  19. Huang, X.; Zhang, L. A multidirectional and multiscale morphological index for automatic building extraction from multispectral GeoEye-1 imagery. Photogramm. Eng. Remote Sens. 2011, 77, 721–732. [Google Scholar] [CrossRef]
  20. Ren, S.; He, K.; Girshick, R.; Sun, J. Faster r-cnn: Towards real-time object detection with region proposal networks. Adv. Neural Inf. Process. Syst. 2015, 28, 91–99. [Google Scholar] [CrossRef] [Green Version]
  21. Krizhevsky, A.; Sutskever, I.; Hinton, G.E. Imagenet classification with deep convolutional neural networks. Adv. Neural Inf. Process. Syst. 2012, 25, 1097–1105. [Google Scholar] [CrossRef]
  22. Long, J.; Shelhamer, E.; Darrell, T. Fully convolutional networks for semantic segmentation. In Proceedings of the IEEE Conference on Computer Vision and Pattern Recognition, Boston, MA, USA, 7–12 June 2015; pp. 3431–3440. [Google Scholar]
  23. Vaswani, A.; Shazeer, N.; Parmar, N.; Uszkoreit, J.; Jones, L.; Gomez, A.N.; Kaiser, Ł.; Polosukhin, I. Attention is all you need. In Proceedings of the Advances in Neural Information Processing Systems, Long Beach, CA, USA, 4–9 December 2017; pp. 5998–6008. [Google Scholar]
  24. Liu, Y.; Piramanayagam, S.; Monteiro, S.T.; Saber, E. Dense semantic labeling of very-high-resolution aerial imagery and lidar with fully-convolutional neural networks and higher-order CRFs. In Proceedings of the IEEE Conference on Computer Vision and Pattern Recognition Workshops, Honolulu, HI, USA, 21–26 July 2017; pp. 76–85. [Google Scholar]
  25. Li, L.; Liang, J.; Weng, M.; Zhu, H. A multiple-feature reuse network to extract buildings from remote sensing imagery. Remote Sens. 2018, 10, 1350. [Google Scholar] [CrossRef] [Green Version]
  26. Kang, W.; Xiang, Y.; Wang, F.; You, H. EU-Net: An efficient fully convolutional network for building extraction from optical remote sensing images. Remote Sens. 2019, 11, 2813. [Google Scholar] [CrossRef] [Green Version]
  27. Yi, Y.; Zhang, Z.; Zhang, W.; Zhang, C.; Li, W.; Zhao, T. Semantic segmentation of urban buildings from VHR remote sensing imagery using a deep convolutional neural network. Remote Sens. 2019, 11, 1774. [Google Scholar] [CrossRef] [Green Version]
  28. Ye, Z.; Fu, Y.; Gan, M.; Deng, J.; Comber, A.; Wang, K. Building extraction from very high resolution aerial imagery using joint attention deep neural network. Remote Sens. 2019, 11, 2970. [Google Scholar] [CrossRef] [Green Version]
  29. Guo, M.; Liu, H.; Xu, Y.; Huang, Y. Building extraction based on U-Net with an attention block and multiple losses. Remote Sens. 2020, 12, 1400. [Google Scholar] [CrossRef]
  30. Shao, Z.; Tang, P.; Wang, Z.; Saleem, N.; Yam, S.; Sommai, C. BRRNet: A fully convolutional neural network for automatic building extraction from high-resolution remote sensing images. Remote Sens. 2020, 12, 1050. [Google Scholar] [CrossRef] [Green Version]
  31. Chen, M.; Wu, J.; Liu, L.; Zhao, W.; Tian, F.; Shen, Q.; Zhao, B.; Du, R. DR-Net: An improved network for building extraction from high resolution remote sensing image. Remote Sens. 2021, 13, 294. [Google Scholar] [CrossRef]
  32. Jin, Y.; Xu, W.; Zhang, C.; Luo, X.; Jia, H. Boundary-aware refined network for automatic building extraction in very high-resolution urban aerial images. Remote Sens. 2021, 13, 692. [Google Scholar] [CrossRef]
  33. Chen, D.Y.; Peng, L.; Li, W.C.; Wang, Y.D. Building Extraction and Number Statistics in WUI Areas Based on UNet Structure and Ensemble Learning. Remote Sens. 2021, 13, 1172. [Google Scholar] [CrossRef]
  34. Ronneberger, O.; Fischer, P.; Brox, T. U-net: Convolutional networks for biomedical image segmentation. In Proceedings of the International Conference on Medical Image Computing and Computer-Assisted Intervention, Munich, Germany, 5–9 October 2022; Springer: Cham, Switzerland, 2015; pp. 234–241. [Google Scholar]
  35. Pan, X.; Gao, L.; Marinoni, A.; Zhang, B.; Yang, F.; Gamba, P. Semantic labeling of high resolution aerial imagery and LiDAR data with fine segmentation network. Remote Sens. 2018, 10, 743. [Google Scholar] [CrossRef] [Green Version]
  36. Ji, S.; Wei, S.; Lu, M. Fully convolutional networks for multisource building extraction from an open aerial and satellite imagery data set. IEEE Trans. Geosci. Remote Sens. 2018, 57, 574–586. [Google Scholar] [CrossRef]
  37. Ji, S.; Wei, S.; Lu, M. A scale robust convolutional neural network for automatic building extraction from aerial and satellite imagery. Int. J. Remote Sens. 2019, 40, 3308–3322. [Google Scholar] [CrossRef]
  38. Ma, J.; Wu, L.; Tang, X.; Liu, F.; Zhang, X.; Jiao, L. Building extraction of aerial images by a global and multi-scale encoder-decoder network. Remote Sens. 2020, 12, 2350. [Google Scholar] [CrossRef]
  39. Wierzbicki, D.; Matuk, O.; Bielecka, E. Polish cadastre modernization with remotely extracted buildings from high-resolution aerial orthoimagery and airborne LiDAR. Remote Sens. 2021, 13, 611. [Google Scholar] [CrossRef]
  40. Brown, T.; Mann, B.; Ryder, N.; Subbiah, M.; Kaplan, J.D.; Dhariwal, P.; Neelakantan, A.; Shyam, P.; Sastry, G.; Askell, A.; et al. Language models are few-shot learners. Adv. Neural Inf. Process. Syst. 2020, 33, 1877–1901. [Google Scholar]
  41. Devlin, J.; Chang, M.W.; Lee, K.; Toutanova, K. Bert: Pre-training of deep bidirectional transformers for language understanding. arXiv 2018, arXiv:1810.04805. [Google Scholar]
  42. Hochreiter, S.; Schmidhuber, J. Long short-term memory. Neural Comput. 1997, 9, 1735–1780. [Google Scholar] [CrossRef]
  43. Sutskever, I.; Vinyals, O.; Le, Q.V. Sequence to sequence learning with neural networks. In Proceedings of the Advances in Neural Information Processing Systems, Montreal, QC, Canada, 8–13 December 2014; pp. 3104–3112. [Google Scholar]
  44. Dosovitskiy, A.; Beyer, L.; Kolesnikov, A.; Weissenborn, D.; Zhai, X.; Unterthiner, T.; Dehghani, M.; Minderer, M.; Heigold, G.; Gelly, S.; et al. An image is worth 16 × 16 words: Transformers for image recognition at scale. arXiv 2020, arXiv:2010.11929. [Google Scholar]
  45. Liu, Z.; Lin, Y.; Cao, Y.; Hu, H.; Wei, Y.; Zhang, Z.; Lin, S.; Guo, B. Swin transformer: Hierarchical vision transformer using shifted windows. In Proceedings of the IEEE/CVF International Conference on Computer Vision, Montreal, BC, Canada, 11–17 October 2021; pp. 10012–10022. [Google Scholar]
  46. Yuan, W.; Xu, W. MSST-Net: A Multi-Scale Adaptive Network for Building Extraction from Remote Sensing Images Based on Swin Transformer. Remote Sens. 2021, 13, 4743. [Google Scholar] [CrossRef]
  47. Chen, X.; Qiu, C.; Guo, W.; Yu, A.; Tong, X.; Schmitt, M. Multiscale feature learning by transformer for building extraction from satellite images. IEEE Geosci. Remote. Sens. Lett. 2022, 19, 2503605. [Google Scholar] [CrossRef]
  48. Chen, J.; Lu, Y.; Yu, Q.; Luo, X.; Adeli, E.; Wang, Y.; Lu, L.; Yuille, A.L.; Zhou, Y. Transunet: Transformers make strong encoders for medical image segmentation. arXiv 2021, arXiv:2102.04306. [Google Scholar]
  49. Petit, O.; Thome, N.; Rambour, C.; Themyr, L.; Collins, T.; Soler, L. U-net transformer: Self and cross attention for medical image segmentation. In Proceedings of the International Workshop on Machine Learning in Medical Imaging; Springer: Berlin/Heidelberg, Germany, 2021; pp. 267–276. [Google Scholar]
  50. Milletari, F.; Navab, N.; Ahmadi, S.A. V-net: Fully convolutional neural networks for volumetric medical image segmentation. In Proceedings of the 2016 Fourth International Conference on 3D Vision (3DV), Stanford, CA, USA, 25–28 October 2016; pp. 565–571. [Google Scholar]
  51. Qin, X.; Zhang, Z.; Huang, C.; Dehghan, M.; Zaiane, O.R.; Jagersand, M. U2-Net: Going deeper with nested U-structure for salient object detection. Pattern Recognit. 2020, 106, 107404. [Google Scholar] [CrossRef]
  52. Zheng, S.; Lu, J.; Zhao, H.; Zhu, X.; Luo, Z.; Wang, Y.; Fu, Y.; Feng, J.; Xiang, T.; Torr, P.H.; et al. Rethinking semantic segmentation from a sequence-to-sequence perspective with transformers. In Proceedings of the IEEE/CVF Conference on Computer Vision and Pattern Recognition, Nashville, TN, USA, 20–25 June 2021; pp. 6881–6890. [Google Scholar]
  53. Mnih, V. Machine Learning for Aerial Image Labeling; University of Toronto: Toronto, ON, Canada, 2013. [Google Scholar]
  54. Diakogiannis, F.I.; Waldner, F.; Caccetta, P.; Wu, C. ResUNet-a: A deep learning framework for semantic segmentation of remotely sensed data. ISPRS J. Photogramm. Remote Sens. 2020, 162, 94–114. [Google Scholar] [CrossRef] [Green Version]
  55. Valanarasu, J.M.J.; Oza, P.; Hacihaliloglu, I.; Patel, V.M. Medical transformer: Gated axial-attention for medical image segmentation. In Proceedings of the International Conference on Medical Image Computing and Computer-Assisted Intervention, Strasbourg, France, 27 September–1 October 2021; Springer: Berlin/Heidelberg, Germany, 2021; pp. 36–46. [Google Scholar]
  56. Zhang, Y.; Liu, H.; Hu, Q. Transfuse: Fusing transformers and cnns for medical image segmentation. arXiv 2021, arXiv:2102.08005. [Google Scholar]
Figure 1. The architecture of the proposed STEB-UNet, including a swin Transformer-based encoding booster (within the gray box) and a specially designed U-shaped network.
Remotesensing 14 02611 g001
Figure 2. The global self-attention computation with the shifted-window (swin) design, comprising two continuous calculation steps (a) normal computation on each window area (within solid orange box) and (b) masked computation on each unmoved window area (within solid orange box) and each spliced window area (within dotted orange box).
Remotesensing 14 02611 g002
Figure 3. The internal structure of the swin Transformer block.
Remotesensing 14 02611 g003
Figure 4. The source and ground truth images in the datasets: (a) Massachusetts source image; (b) Massachusetts ground truth; (c) WHU source image; (d) WHU ground truth.
Remotesensing 14 02611 g004
Figure 5. The comparison of the building extraction results of different networks on the WHU (first to third line) and Massachusetts (fourth to sixth line) dataset. The building areas are drawn white. The areas where the STEB-UNet shows greater advantages are in red boxes, whose zoom-in figures are shown in their near yellow boxes.
Remotesensing 14 02611 g005
Figure 6. The building extraction results of: (a) STEB-UNet on the WHU dataset; (b) U 2 -Net on the WHU dataset; (c) STEB-UNet on the Massachusett dataset; (d) U 2 -Net on the Massachusett dataset. The boxes in green, blue, and red indicate true-positive, false-negative, and false-positive classifications, respectively.
Remotesensing 14 02611 g006aRemotesensing 14 02611 g006b
Figure 7. The number of parameters (Millions) of different methods.
Remotesensing 14 02611 g007
Table 1. Training configurations for different networks.
NetworkInput SizeBatch SizeOptimizerParameter Setting
STEB-UNet 256 2 32Adamlr = 0.001, betas = (0.9, 0.999),
eps =1 × 10⁻⁸, weight decay = 0
U-Net [34] 256 2 32RMSProplr = 0.001, momentum = 0.9,
weight decay =1 × 10⁻⁸
U 2 -Net [51] 256 2 32Adamlr = 0.001, betas = (0.9, 0.999),
eps = 1 × 10⁻⁸, weight decay = 0
SETR-Naïve [52] 128 2 2Adamlr = 0.0001, betas = (0.9, 0.999),
eps = 1 × 10⁻⁸, weight decay = 0
BRRNet [30]
(reported)
256 2 8Adamlr = 0.001
RFA-UNet [28]
(reported)
512 2 (WHU)
320 2 (Mass)
8Adamlr = 0.001
TEB-UNet 128 2 4Adamlr = 0.0001, betas = (0.9, 0.999),
eps = 1 × 10⁻⁸, weight decay = 0
Table 2. Experimental results of different methods on WHU and Massachusetts datasets.
Massachusetts [53]WHU [36]
F 1 Score ↑IOU ↑ F 1 Score ↑IOU ↑
U-Net [34]82.81%73.34%85.45%87.98%
BRRNet [30] (report)85.36%74.46%92.40%85.90%
U2-Net [51]85.91%80.56%92.47%91.34%
RFA-UNet [28] (report)85.65%74.91%94.75%90.02%
SETR-Naïve [52]87.05%77.39%93.41%88.47%
TEB-UNet89.74%76.91%94.55%88.63%
STEB-UNet89.90%81.66%96.85%93.89%
Table 3. The generalization testing of different methods on WHU and Massachusetts datasets.
Massachusetts [53]WHU [36]
F 1 Score ↑IOU ↑ F 1 Score ↑IOU ↑
U-Net [34]74.20%72.45%81.01%78.49%
U2-Net [51]81.83%74.54%84.13%80.92%
SETR-Naïve [52]85.74%74.51%85.84%81.43%
TEB-UNet85.11%75.80%87.11%84.87%
STEB-UNet87.08%78.95%87.64%85.22%
Table 4. The performance comparison of the proposed STEB-UNet with different loss function on the WHU dataset.
Loss Function F 1 ScoreIOU
BCE96.74%93.62%
Dice96.85%93.89%
Combine ( α = 0.4)96.76%93.61%
Combine ( α = 0.5)96.79%93.65%
Combine ( α = 0.6)96.79%93.64%
Table 5. Data statistics in training of different networks, where batch size is set to one, the size of input image is 128 × 128, and the loss function is set to BCE loss.
ModelParameter (M)Memory (MB)Training Time/Epoch
SETR-Naive [52]51.95221651769.4 s
TEB-UNet25.86165791385.8 s
STEB-UNet21.142465807.3 s
Publisher’s Note: MDPI stays neutral with regard to jurisdictional claims in published maps and institutional affiliations.

