Article

Spatio-Temporal Characteristics of the Evapotranspiration in the Lower Mekong River Basin during 2008–2017

1
School of Earth Science and Engineering, Hohai University, Nanjing 211100, China
2
Shandong Electric Power Engineering Consulting Institute Co., Ltd., Jinan 250013, China
*
Author to whom correspondence should be addressed.
Remote Sens. 2022, 14(11), 2609; https://doi.org/10.3390/rs14112609
Submission received: 26 November 2021 / Revised: 18 May 2022 / Accepted: 27 May 2022 / Published: 29 May 2022

Abstract

:
Droughts and floods have occurred frequently in the Lower Mekong River Basin in recent years. Obtaining the evapotranspiration (ET) in the basin helps people to better understand water cycle and water resources. In this study, we retrieved and validated ET in the Lower Mekong Basin over multiple years (from 2008 to 2017) using remote sensing products. Based on the retrieval ET, we analyzed the spatial-temporal variation of ET and influencing factors at the monthly, seasonal, and inter-annual scale respectively. The results revealed that the overall variation trend of ET at annual scale slightly increased during 2008 to 2017, with the highest annual ET being 1198 mm/year in 2015 and the lowest annual ET being 949 mm/year in 2008. At the seasonal scale, ET in the rainy season was lower than the dry season; at the monthly scale, March had the highest monthly ET (101 mm/month) while July had the lowest monthly ET (73 mm/month). Spatial analyzing showed that ET in the margin of this region was higher (with on average about 1250 mm/year) and lower in the middle (with on average about 840 mm/year), and monthly ET changed mostly in forest areas with the difference of 60 mm/month. Influencing analyzing results showed that ET was mainly driven by solar radiation and near-surface temperature, and precipitation had an inhibitory effect on ET in the rainy season months. The study also showed that forests in the basin are very sensitive to solar radiation, with a correlation coefficient of 0.89 in March (the month with the highest ET) and 0.45 in July (the month with the lowest ET).

1. Introduction

Global climate change is an important environmental issue. Water shortage and the deterioration of water environment have become an important factor that restricts economy development [1]. As an important part of the global water cycle and energy balance, exploring regional evapotranspiration (ET) is of great significance to solving water resources related issues, especially for developing countries. Terrestrial evaporation is the main way of water cycle and energy conversion in a soil-vegetation-atmosphere system, including land surface ET and vegetation evaporation [2,3]. Both solar shortwave radiation and precipitation are largely consumed by ET. Solar shortwave radiation accounts more than half of the world’s net radiation, which is a significant role of global climate change research [4]. With the growth of both population and economy, 60% of surface precipitation is consumed by evaporation [5,6]. Moreover, the main cause of drought is that ET is higher than precipitation [7]. Differences in precipitation and ET help people understand the types of droughts, such as researches on drought prediction and evaluation thorough the drought index [8]. ET is also related to issues of economic development and water resource protection in arid areas [9], such as estimation and evaluation of surface runoff and groundwater, basin-scale water source planning and managing, farmland irrigation and tillage scheduling, and water deficit of crop [10,11,12,13]. The study of ET enables people to better understand the balance of water and energy flow, which is necessary to ecological environmental protection and sustainable use of water resources.
The Mekong River Basin is located on the Indochina Peninsula on the south of China, and it is one of the regions with the richest water resources in Asia (Figure 1). Droughts and floods occurred frequently in the region in recent years, for example the droughts in 2009–2010 and 2015–2016, and the flash floods in 2008, 2011, and December 2013 [14]. From the end of 2014 to 2016, the Lancang-Mekong River Basin (known as the Lancang River in China and the Mekong River outside China) was affected by the El Niño phenomenon; as a result, all countries in the basin suffered varying degrees of drought due to large-scale meteorological drought, especially the lower delta region, which experienced the most severe drought in nearly a century. Years of extreme weather have led to record droughts in the Low Mekong Basin in 2010 and 2015 [15]. Droughts are more devastating and longer than floods, and droughts in recent years have taken a heavy toll in human and economic lives in the Mekong countries [16]. There are significant seasonal vibrations of climate and environment in the basin, and the change of evapotranspiration even affects the precipitation in the basin, because it is also one of the potential factors leading to flood or drought [17]. The hydrological process of the Lancang-Mekong River Basin is faced with the dual impact of climate change and hydropower development [18]. As an international river, Lancang-Mekong River’s water resource utilization is related to the development of countries in the basin. The study of ET in this basin is of great significance for strengthening the Lancang-Mekong Cooperation and building the land-sea Silk Road. The issues of concern to scholars in this area including hydropower, water flow changes, transboundary transport nutrients, agricultural production and the water supply needs of the ecosystems in the lower reaches of the basin, all of them mainly focusing on international cooperation and the challenges brought by dam construction in recent years [19,20,21,22,23].
ET is a comprehensive interaction between surface and atmosphere that is affected by temperature, humidity, solar radiation, vegetation type and other factors [24,25]. At the long-term scale, the ET variation is dominated primarily by solar radiation (namely shortwave downwelling radiation) in the arid region, whereas the ET variation is driven predominantly by the water supply, which is related to the precipitation [26]. Since the 1990s, the solar radiation has been increasing, especially in the Northern Hemisphere [27]. Accordingly, the air temperature has also increased [28]. Therefore, against the background of global brightening and warming, it is important to reveal the variations of ET and the potential reasons for these trends for investigating the available water resources in Mekong River Basin. Although there are several models of ET retrieval based on remote sensing that can obtain the region’s actual ET, most research is focused currently on the study of the variation of potential ET in the Mekong River Basin [29,30,31,32,33]. There is less research that has analyzed the variation of actual ET in this basin [34]. Therefore, in this study, a non-parametric remote sensing model (RS–NP) is used to retrieve the ET in the Lower Mekong River Basin from 2017 to 2018, with the results being validated with MOD16 daily LE (8-day scale). Based on the validated results, the study further analyzed the temporal and spatial variation of ET in the basin during the decade to reveal the ET variation in the basin. Finally, it also analyzed the effect of meteorology factors on ET in the basin.

2. Study Area and Data
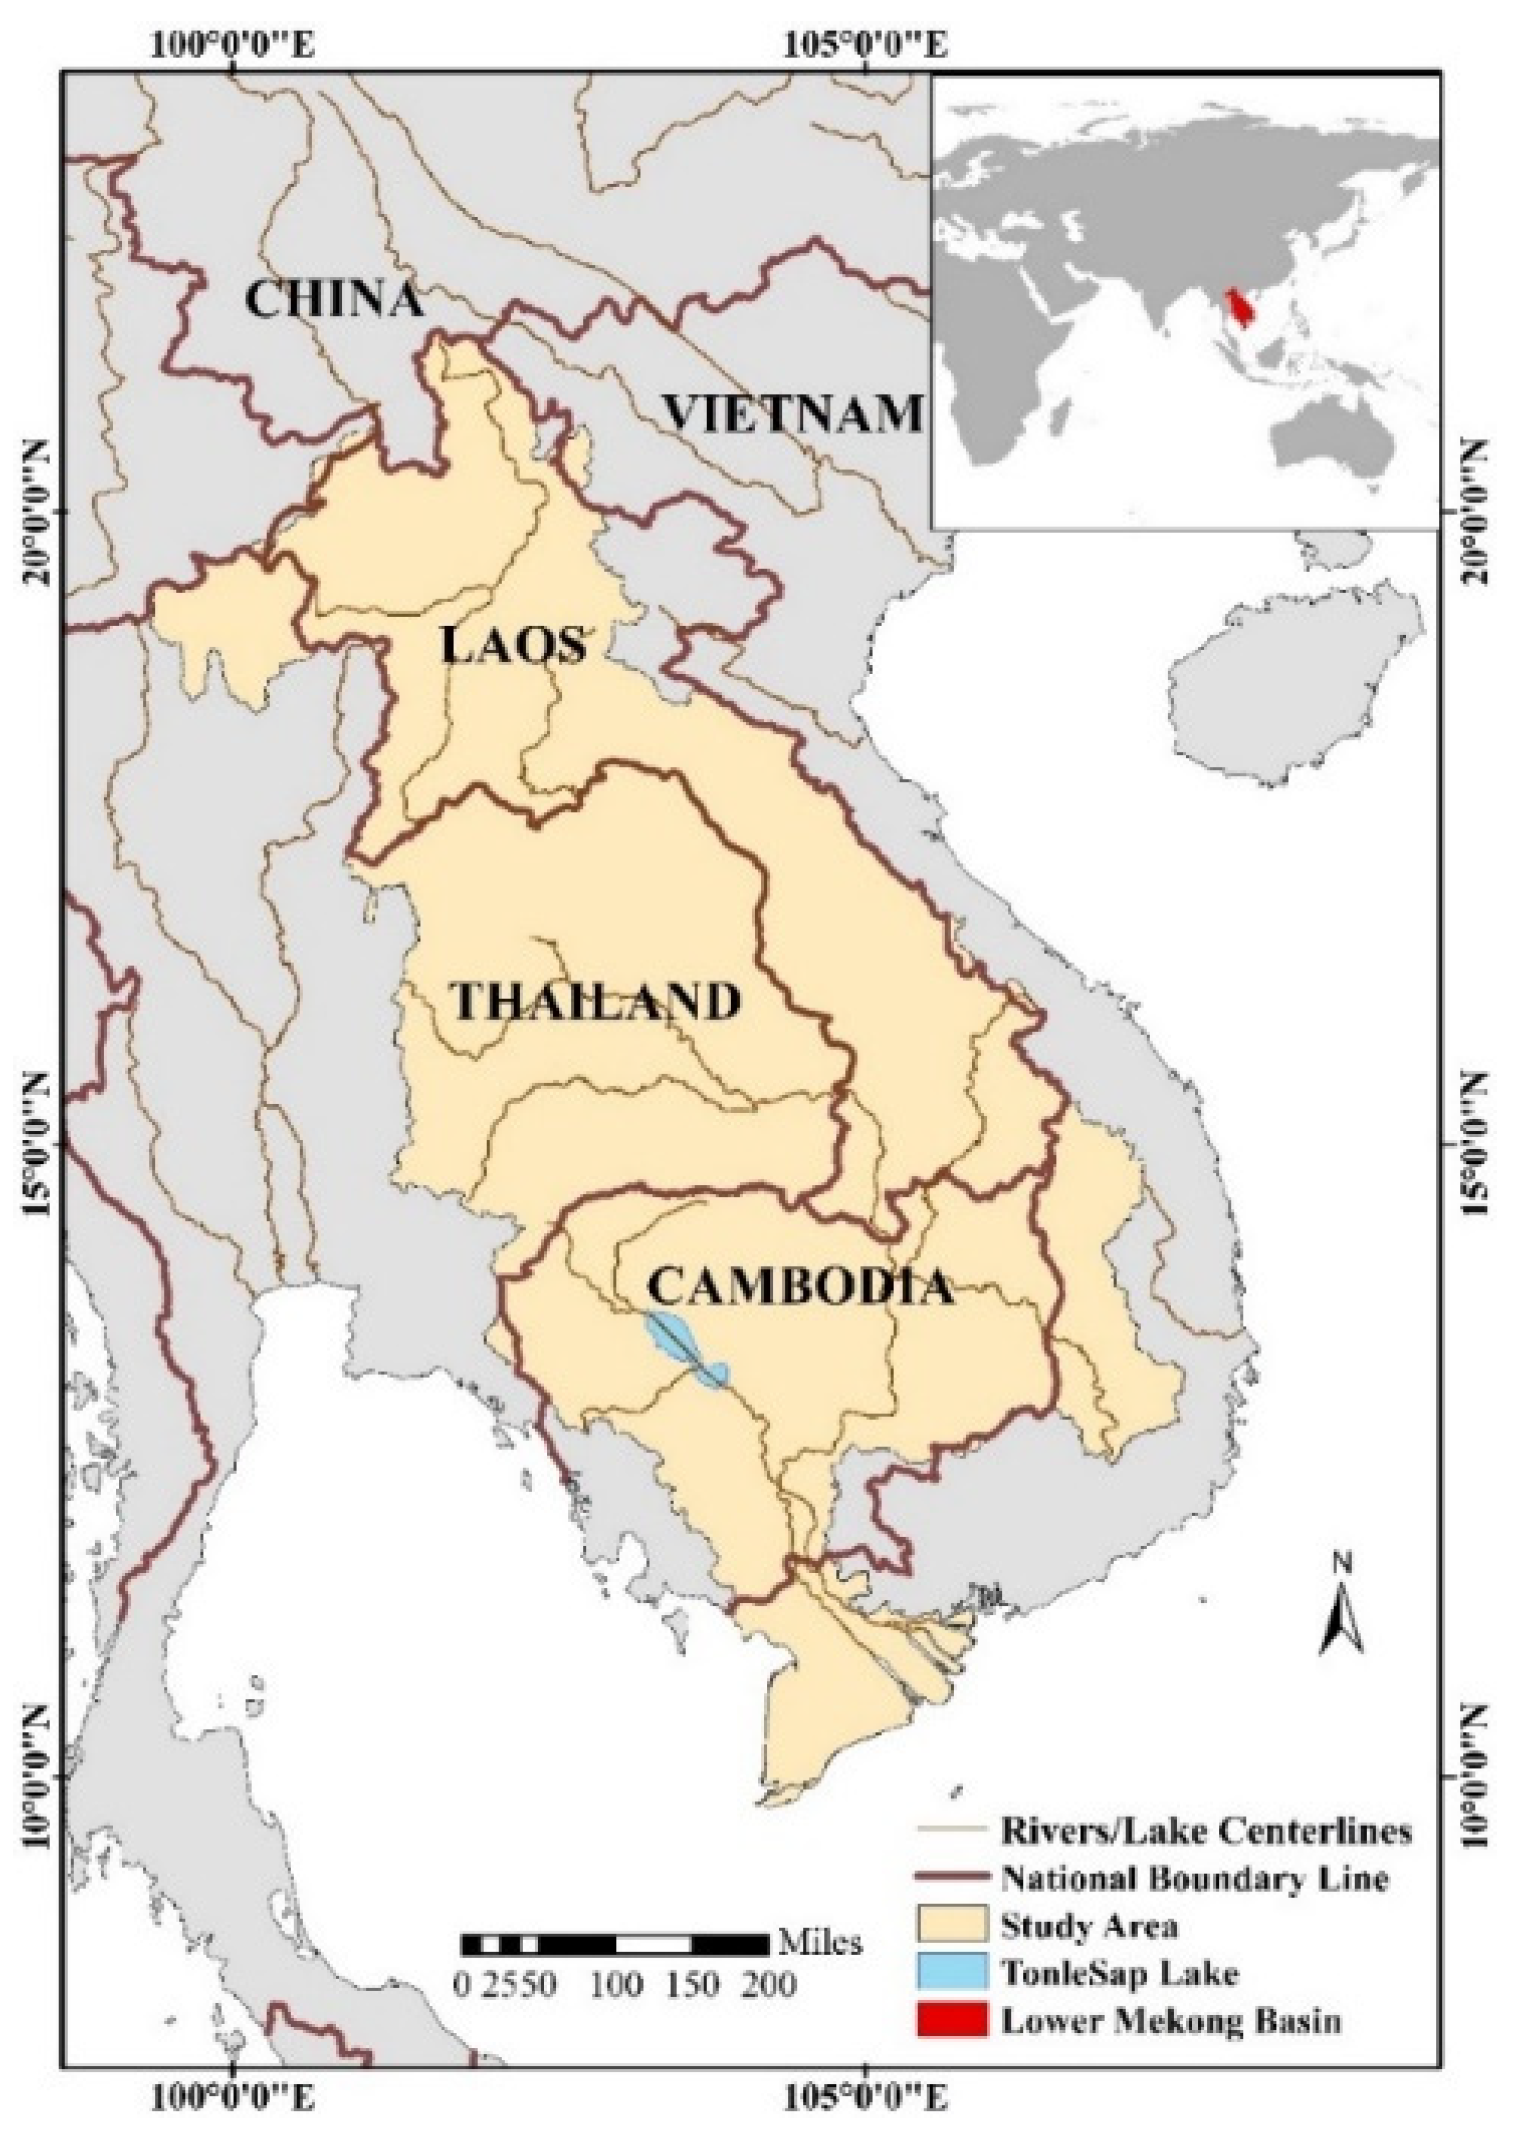
2.1. Study Area

The lower Mekong River Basin is located in the South-Central Peninsula of Southeast Asia, with a latitude and longitude range between 8°33′48″~22°30′15″N and 99°01′15″~108°46′30″E, covering an area of 642,000 km2 [35]. The countries in the basin are Thailand, Laos, Myanmar, Cambodia, and Vietnam. Located in the center of the Asian tropical monsoon region, the region has high temperatures throughout the year and is divided into rainy and dry seasons: the southwest monsoon from the Indian Ocean prevails from May to the end of September; thus, the rainy season in the basin is from May to October with wet weather and abundant precipitation. The northeast monsoon from Asia and Europe prevails from November to mid-March. Accordingly, the dry season is from November to April with dry weather and low precipitation. In the Lower Mekong River Basin, although the difference in precipitation there is large between the rainy and the dry seasons, the annual temperature remains over 20 °C, and the highest temperature in the hottest April and May can even reach 38 °C to 40 °C [36,37].
The basin is high in the north and low in the south, and the mountains stretch north and south. Consequently, most of the Mekong countries are surrounded by mountains. In the lower reaches of the basin, a large amount of sediment alluvium deposition formed the Mekong River Plain and the Mekong River Delta. The region’s developed agriculture and dense population have brought relatively developed urbanization. The Mekong River has a large seasonal water level drop, which is a typical monsoon river. The summer half year is a wet period and winter half year is a dry period, and the water level in April is the lowest. Known in the basin, Tonle Sap Lake is a natural regulating reservoir that effectively mitigates the effects of downstream flooding and drought.

2.2. Data

The data used in this study mainly include Moderate-resolution Imaging Spectroradiometer (MODIS) (https://ladsweb.modaps.eosdis.nasa.gov, accessed on 20 December 2020) (remote sensing data) and China Meteorological Administration Land Data Assimilation System (CLDAS) (reanalysis data) [38]. In this study, MODIS product onboard Aqua (UTC 14:00) including daily cloud emissivity & cloud top temperature MYD06, 8-day composite surface reflectance MYD09A1 and 8-day land surface temperature & emissivity MYD11A2, and CLDAS product including surface temperature (LST), surface pressure (PRS), specific humidity (RHU), atmospheric temperature (TMP), and shortwave downlink radiation (SRA) are used as the input data of the model to retrieve LE. We integrated the MYD09A1 with 500 m spatial resolution to 1 km, and resampled the CLDAS data with 6 km spatial resolution to 1 km because of the weak spatial heterogeneity, and we also combined the time resolution of CLDAS data from 1 h to 8 days, so that the time and spatial resolution of all input data are consistent. The 16-day composite ET/Latent Heat Flux product MOD16 based on the RS-PM model produced by Mu et al. [39] were used for cross validation of retrieval LE. The Land cover data from MCD12Q1 provided annual land cover types on the land surface, and a land use dataset based on the IGBP classification scheme was used, which had an accuracy of 75% [40]. The boundaries and of the basin and river networks in the basin were retrieved from the Natural Earth (https://www.naturalearthdata.com, accessed on 20 December 2020). The details of experimental data used on this study is shown in Table 1.

3. Methodology

3.1. ET Estimation

The Non-parametric (NP) method is a nonparametric evaporation solution obtained in a simple analytical by taking the surface temperature as the generalized coordinate of the Hamiltonian quantity in the macroscopic state and combining it with equilibrium evaporation [41]. Pan et al. established a remote sensing model for the ET base on the NP approach (the RS–NP model). The RS–NP model developed from it involves fewer parameters, reduces the uncertainty of the computational process, and has a clear physical meaning that avoids the problems of complicated impedance parameterization calculations, the difficulty of identifying error sources, and the difficulties of the model correction that exist in traditional retrieve models. This model takes remote sensing data MODIS and land surface assimilation data CLDAS as input data, and uses different methods to calculate ET under all sky [42,43,44].
The NP approach to calculate fluxes based on the partial differential equations of Hamiltonian with LST is as follows [41].
L E = + γ ( R n G s ) ε σ ( T s 4 T a 4 ) + G s l n ( T s T a )
where LE is the latent heat flux, Rn is the net surface radiation, Gs is the soil heat flux, ε is the and surface emissivity (LSE), σ is the Stephen Boltzmann constant, Ts is the surface temperature (LST), Ta is the near-surface atmospheric temperature, ∆ is the saturated water vapor pressure gradient under Ta conditions and γ is the psychometric constant. The expressions for the saturation water vapor pressure gradient ∆, the dry and wet bulb constants γ, and the surface emissivity ε are as follows.
= 4098 × [ 0.6108 · exp { 17.27 · ( T a 273.15 ) T a 35.85 } ] ( T a 35.85 ) 2
γ = C p P ε a w L v = 0.665 × 10 3 P
ε = 0.273 + 1.778 ε 31 1.807 ε 31 ε 32 1.037 ε 32
where Cp is the constant pressure specific heat capacity at atmospheric pressure with a value of 1.013 × 10⁻³ MJ kg−1 K−1; P is the near-surface atmospheric pressure, provided by CLDAS; εaw is the ratio of water vapor to air molecular weight (approximately 0.622); and ε31 and ε32 are the surface emissivity of MODIS data, provided by the MYD11 product.
The RS–NP model uses MODIS and CLDAS to integrate the retrieval of net surface radiation. Net surface radiation is considered as the combination of surface long-wave and short-wave net radiation. Soil heat flux can be regarded as a function of normalized vegetation index and surface net radiation. When the sub-base is a water body (NDVI < 0), the ratio of soil heat flux to surface net radiation is constant; when the sub-base is a non-water body (NDVI > 0), soil heat flux has a closer relationship with surface net radiation [45]. The net surface radiation Rn and soil heat flux Gs are obtained by retrieve of the following equation.
R n = ( 1 α ) R s d + R l d ε σ T s 4
      { G s = 0.583 · exp ( 2.13 · N D V I ) · R n     N D V I > 0 G s = 0.583 · R n                                         N D V I < 0
where Rsd is the surface shortwave downwelling radiation, Ts is the surface temperature, and Rsd and Ts are provided by CLDAS. Rld is the surface long-wave downwelling radiation, α is the surface reflectance, and the expressions of Rld and α are as follows.
R l d = σ ε a T a 4
  α = 0.160 α 1 + 0.291 α 2 + 0.243 α 3 + 0.116 α 4 + 0.112 α 5 + 0.081 α 7
ε a = [ 1 ( 1 + 46.5 · e 0 T a ) exp ( ( 1.2 + 3 · 46.5 · e 0 T a ) 1 2 ) ]
e 0 = P 1 + 0.628 / ( q 1 )
where εa is the near-surface atmospheric emissivity; Ta is the near-surface temperature, provided by CLDAS. α1, α2, α3, α4, α5 and α7 are the surface reflectance of MODIS, provided by the MYD09 product; e0 is the near-surface water vapor partial pressure, q is the specific humidity. Both P and q were provided by CLDAS.
From the account of remote sensing data, instantaneous data were collected during satellite transit. A time scale extension was required for the purpose of acquiring ET on the long time scales. The time ascending scale was achieved and the Solar Radiation Ratio Method (SolRad) was adapted [46]. The SolRad method assumes that the radio of latent heat flux and solar radiation were constant at the daily scale, so that the ratio of the daily lateen heat flux to other flux components can be regarded as constant. The SolRad method and the daily mean short-wave radiation are expressed as follows.
L E d a i l y = 1.1 × ( R s d ) d a i l y × L E R s d  
( R s d ) d a i l y = T = t r i s e T = t s e t ( R s d ) T t s e t t r i s e
where L E d a i l y is the daily average evapotranspiration after time upscaling, ( R s d ) d a i l y is the daily average shortwave net radiation, LE is the instantaneous evapotranspiration, R s d is the instantaneous shortwave net radiation, t r i s e is the time of sunrise and t s e t is the time of sunset.

3.2. Data Analysis Methods

3.2.1. Radionov Time Series Analysis

The Rodionov mutation analysis method can capture the mutation points in the evapotranspiration time series with strong trend changes. This method can effectively capture the year of abrupt change and analyze the factors influencing the mutation phenomenon in the time series evapotranspiration change analysis [47,48].

3.2.2. Sliding Filter Analysis

The sliding filtering method is a low-pass filtering data processing method, which can effectively deal with the non-smooth data in the time series data, carry out trend extrapolation and curve fitting, and obtain the law of evanescent time series change.
After low-pass filtering, the sequence can effectively weaken the influence of random errors on the analysis of change trends compared with the original time series.

3.2.3. Sen + MK Variation Trend Analysis

The Theil–Sen method is a relatively stable trend analysis method, which does not require data to confirm to certain probability distribution characteristics and is not sensitive to the time series outliers. In addition, the combination of the Theil–Sen method and the Mann–Kendall method can effectively analyze and test the trend of time series data. In this paper, we combined the Sen–MK method to carry out the analysis of spatial variation characteristics in regional ET time series variation [41]. Table 2 shows the Sen + MK trend description and significance classification. In Table 2, T S s l o p e characterizes the Thile–Sen variation trend, while p is the significance test value of the Mann–Kendall method. In this paper, a trend test model with a period of ten years was constructed for the basin ET data with a single image element value, and spatial Sen–MK trend analysis at the basin scale was performed.

3.3. Accuracy Evaluation Method

In this paper, the accuracy of the retrieval results was evaluated by cross validation. Through comparing the retrieval results of the same pixel at the same location and time scale with different algorithms, the relative accuracy of MOD16 ET product and RS–NP model was revealed. The retrieval accuracy of the model was obtained through quantitively analysis of three difference indexes of root mean square error (RMSE), bias, Relative Error (RE), and the consistency index of relevant index (R2).
The difference indexes describe the systematic error and random error in error propagation theory. In this research, the mean error (bias) was used to evaluate the system error of the model, the relative error (RE) was used to evaluate the relative deviation between the retrieval value and true value of ET, and the root mean square error (RMSE) was used to reflect the sampling standard deviation between the retrieval value and the true value of the ET. Three difference indicators are defined as follows.
b i a s =   ( y y ) N
R E = ( | b i a s | ) 1 N i = 1 N y i × 100  
R M S E =   ( y y ( x ) ) 2 N
where y is the retrieval value, y′ is the reference value, and N is the total quantity of remote sending retrieval pixel.
The consistency index describes the consistency between the retrieval value and the true ET value and is often evaluated by liner fitting. In this research, the correlation coefficient (R2) was used as the evaluation index, with the index closer to 1, which resulted in better consistency between the retrieval value and the true ET value. R2 is defined as follows.
R 2 = 1 i = 1 N ( y i y i ) 2 i = 1 N ( y i y ¯ ) 2

4. Results

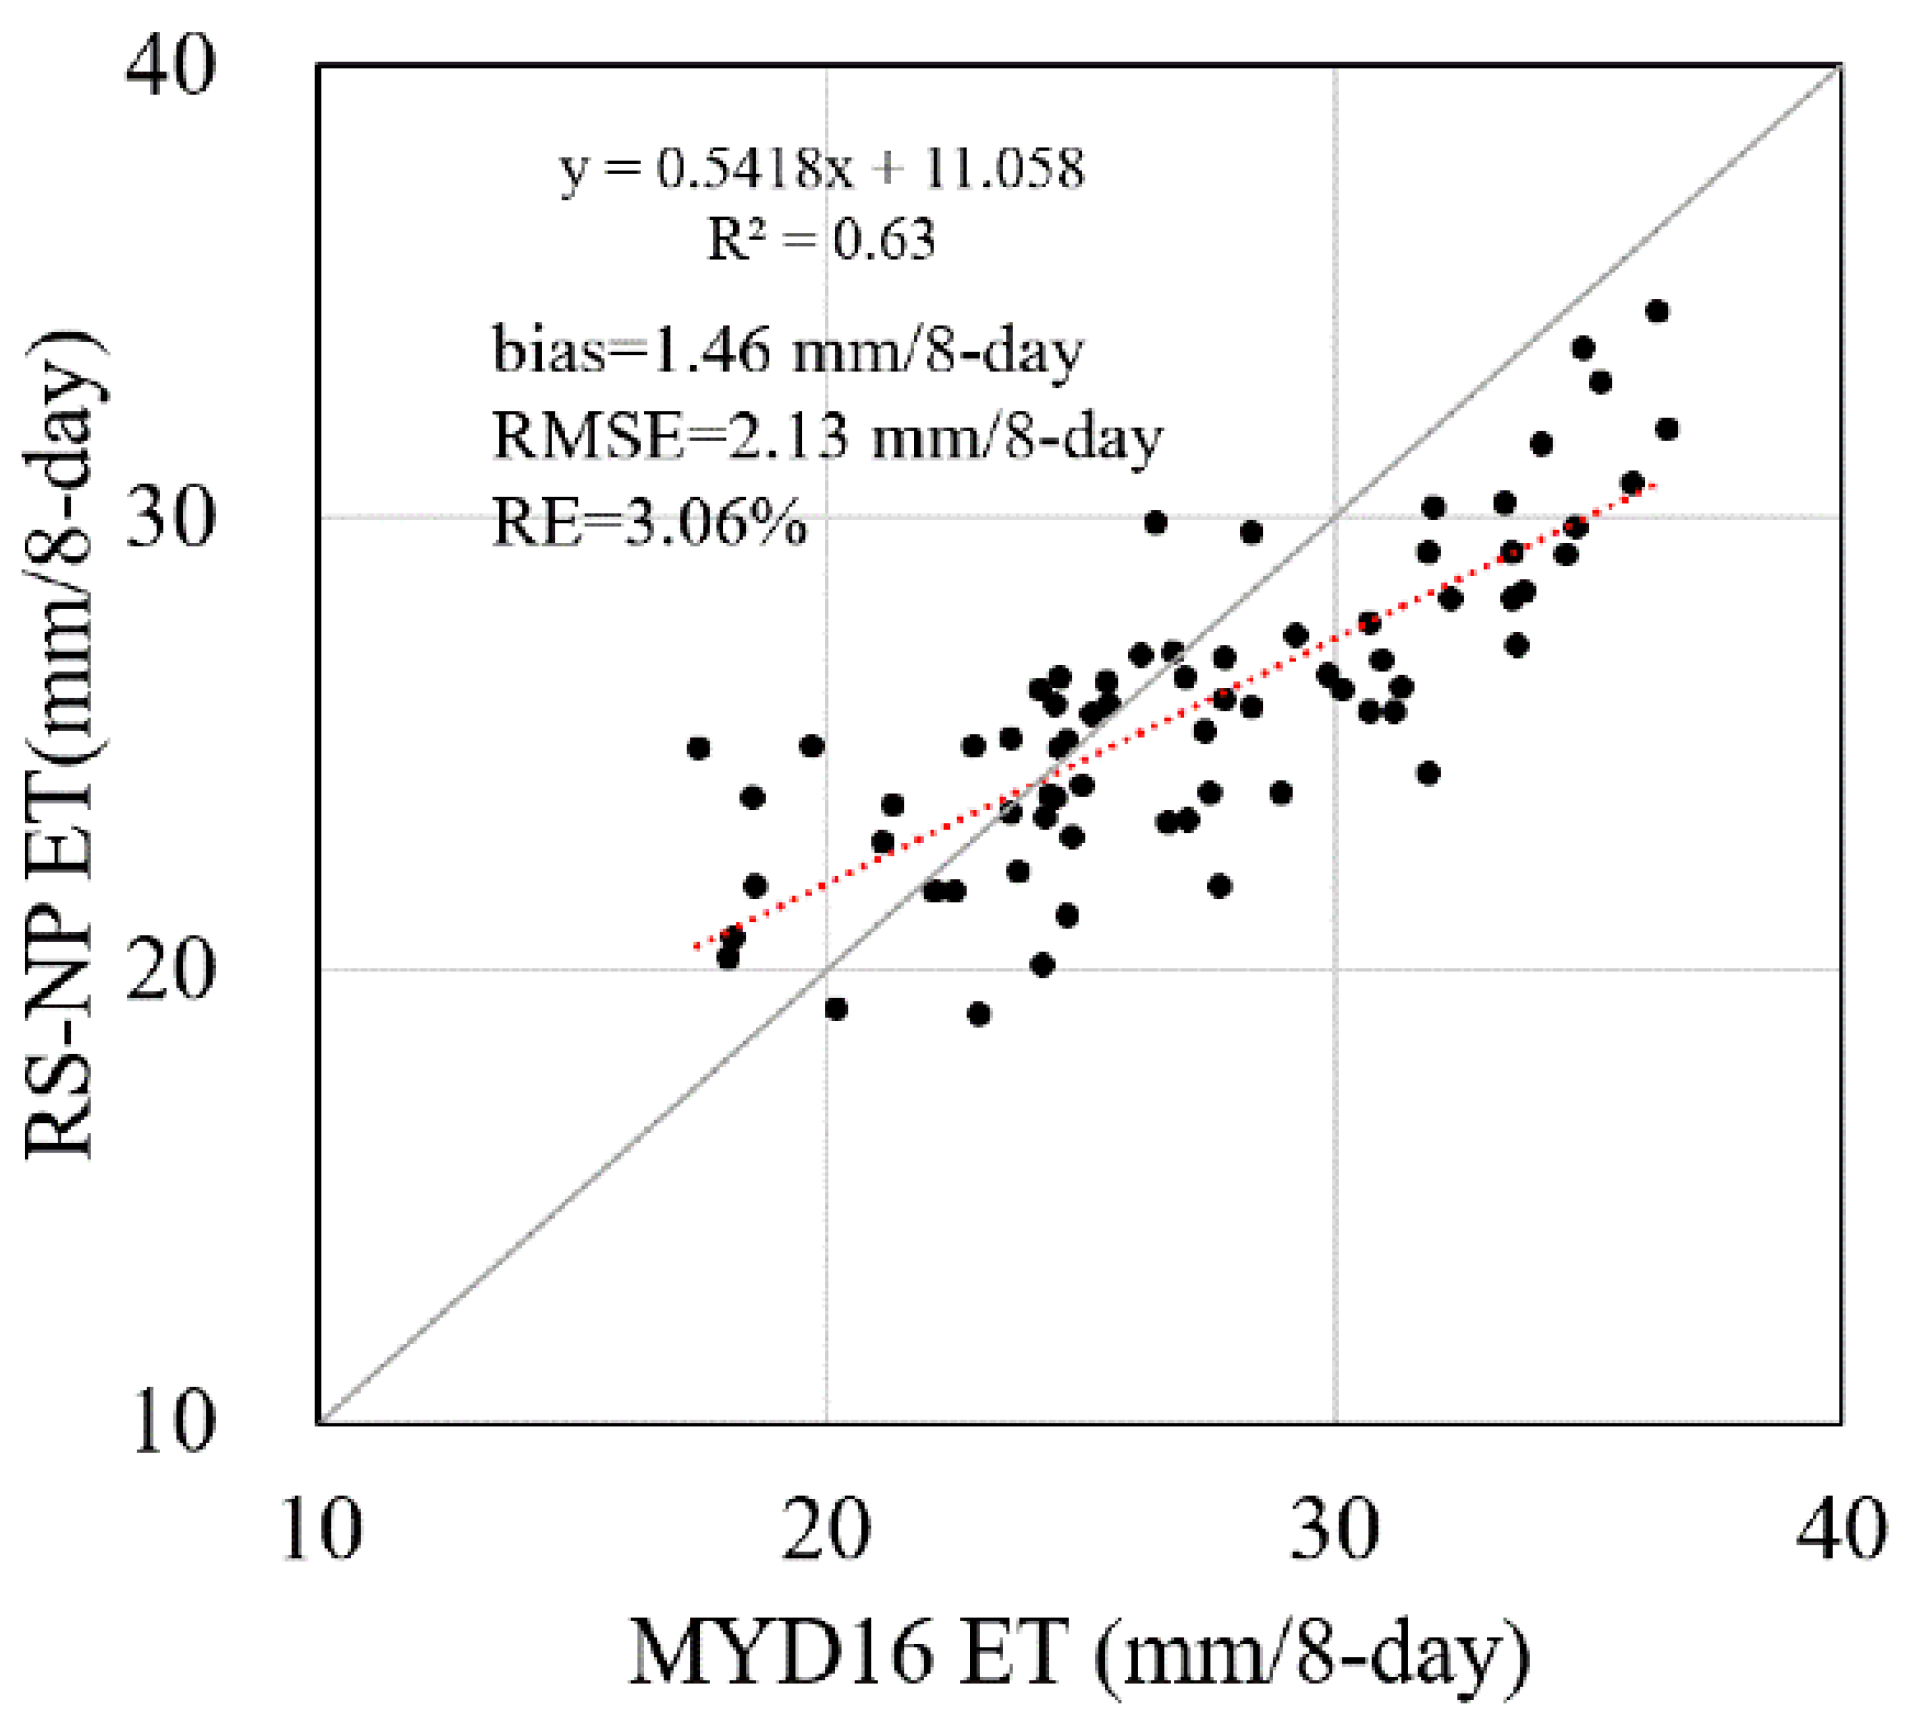
4.1. Cross Validation with MOD16

Figure 2 shows the relationship between the retrieval ET and MYD16 ET at the eight-day scale; each point in the diagram is a random point within the basin. The retrieval ET and MYD16 ET correlated well with a bias of 1.46 mm/8-day, a RMSE of 2.13 mm/8-day and a RE of 3.06%, and the distribution also presented a linear correlation with the R2 of 0.63. The ET provided by MYD16 was relatively reliable, and the accuracy of verification results reflected the real situation of surface ET.

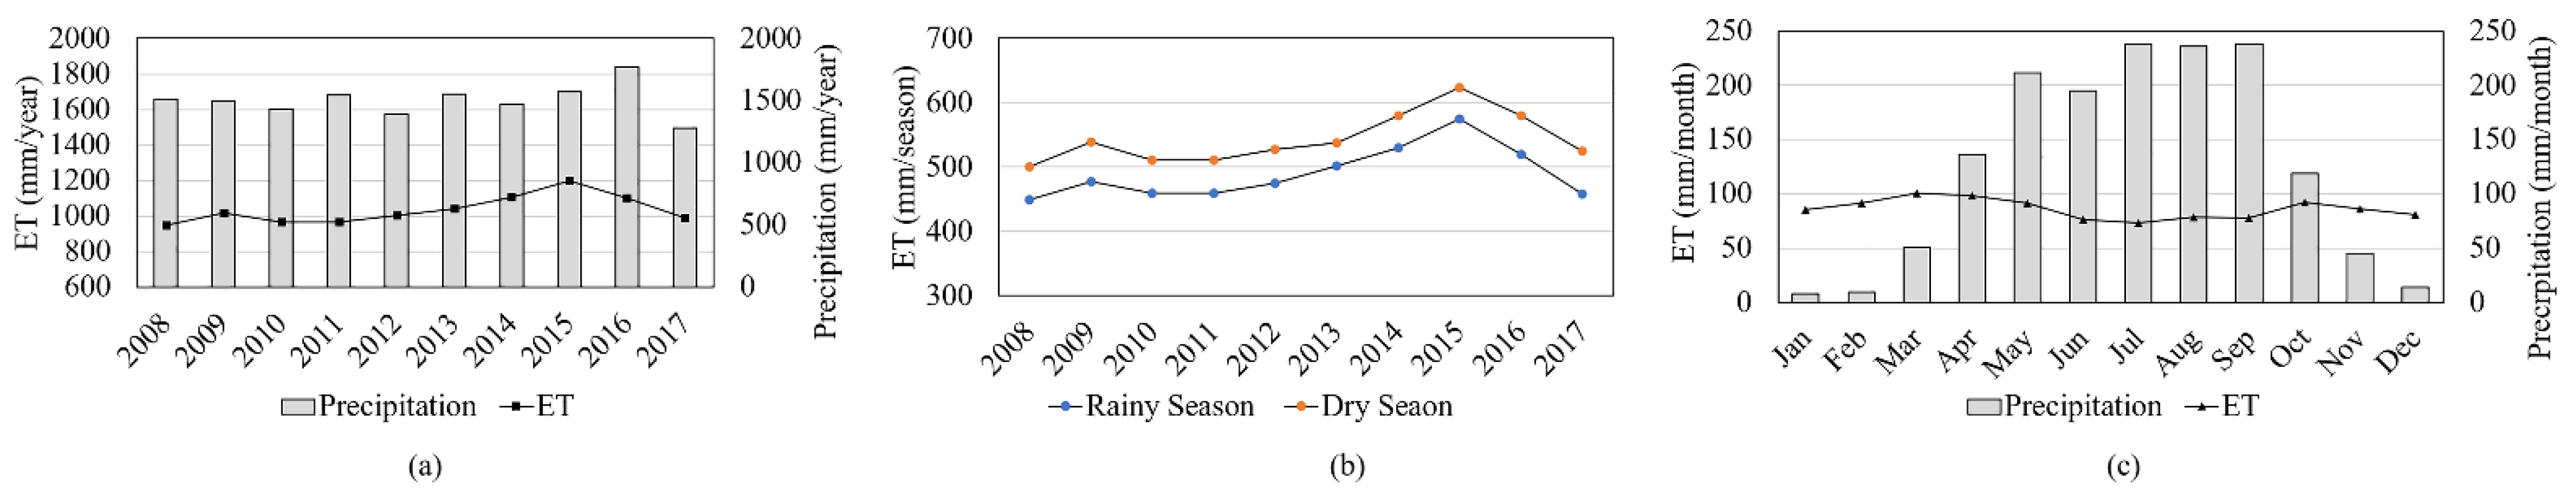
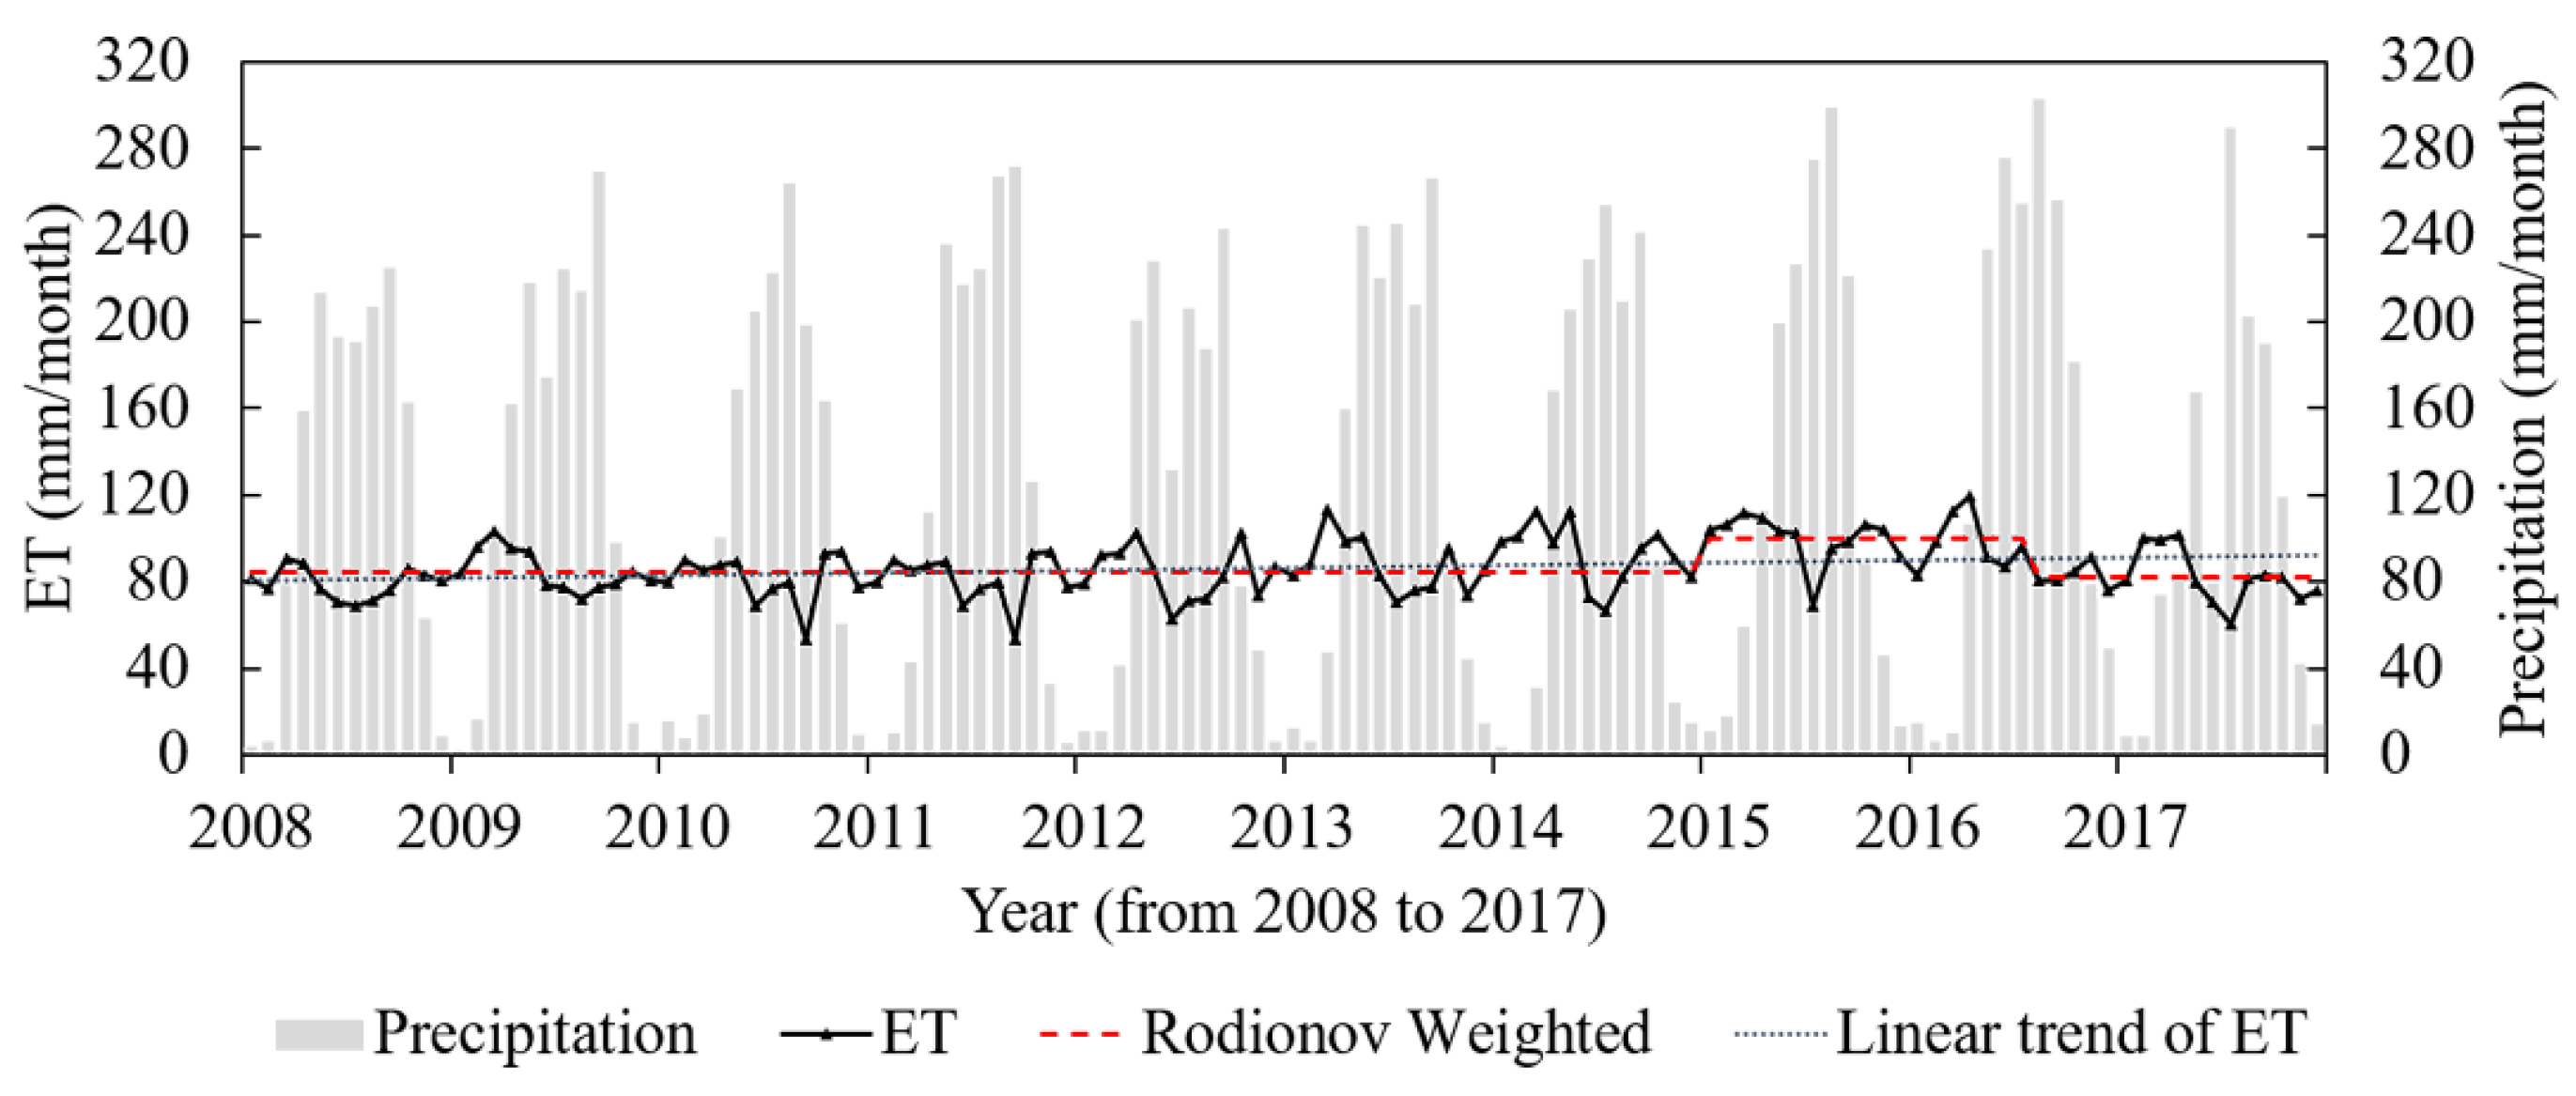
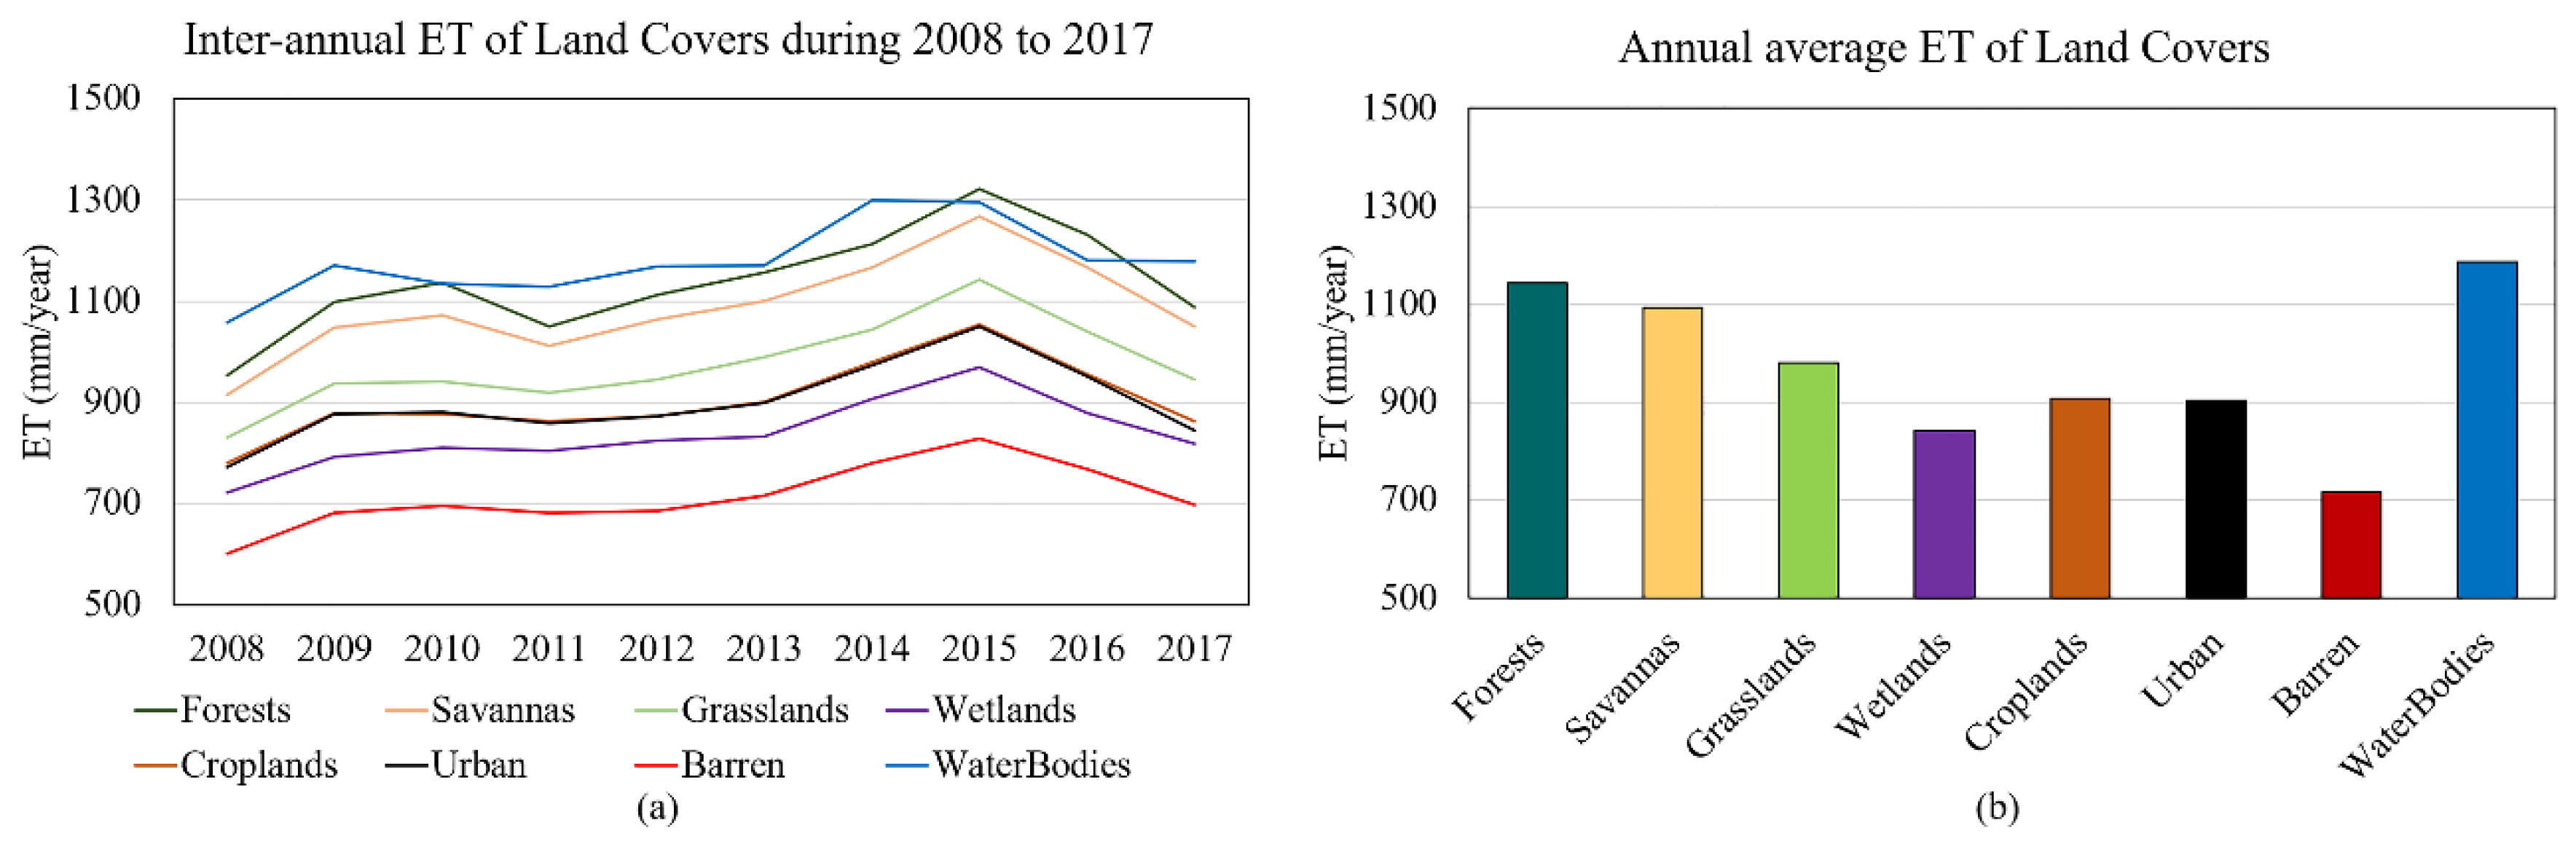
4.2. Temporal Characteristics of ET

Figure 3 shows the trend of ET and precipitation during 2008 to 2017. The linear trend of the 8-day ET showed an increase during 2008 to 2017, and ET in the Lower Mekong River Basin fluctuated. The Rodionov weight was notably higher from January 2015 to July 2016. At the eight-day scale, the maximum mean ET was 35 mm/8-day (in March), and the minimum mean ET was 10 mm/8-day (in August). A strong El Niño event in 2015 led to an increase in global temperature and precipitation, and a longer duration of high ET than other years lasting from February to November in 2015 was captured by the Rodionov time series analysis.
Figure 4a shows the annual ET retrieval results. Annual ET from 2008 to 2017 fluctuated on the average of 1034 mm, and the average of annal precipitation was 1500 mm. The annual ET slightly increased from 2009 to 2015 by 182 mm/year and then decreased. The highest annual ET was in 2015 (1198 mm/year) and the lowest annul ET was in 2008 (949 mm/year). The annual ET was less than a half of the annual precipitation in this typical humid basin, excepted in 2015.
Located in Indochina Peninsula, the Lower Mekong River Basin has a tropical monsoon climate affected by the land-sea monsoon differences; thus the year is divided into rainy and dry seasons. The rainy season is from May to October and the dry season is from November to April. Figure 4b shows the variation of seasonal ET. Dry season ET and rainy season ET were on average of 543 mm/year and 491 mm/year, respectively, and the ET of rainy season was lower than that of the dry season in all the ten years.
Figure 4c shows the monthly precipitation and monthly ET. At monthly scale, ET fluctuated around the average of 86 mm and slowly dropped below the average level during rainy season months; precipitation increased from January to July and then conversely decreased in the dry season months. In the rainy season, monthly precipitation (on the average of 206 mm/month) was over twice higher than the monthly ET (on the average of 82 mm/month). However, monthly precipitation in the dry seasons (on the average of 44 mm/month) was much lower than the monthly ET (on the average of 91 mm/month).

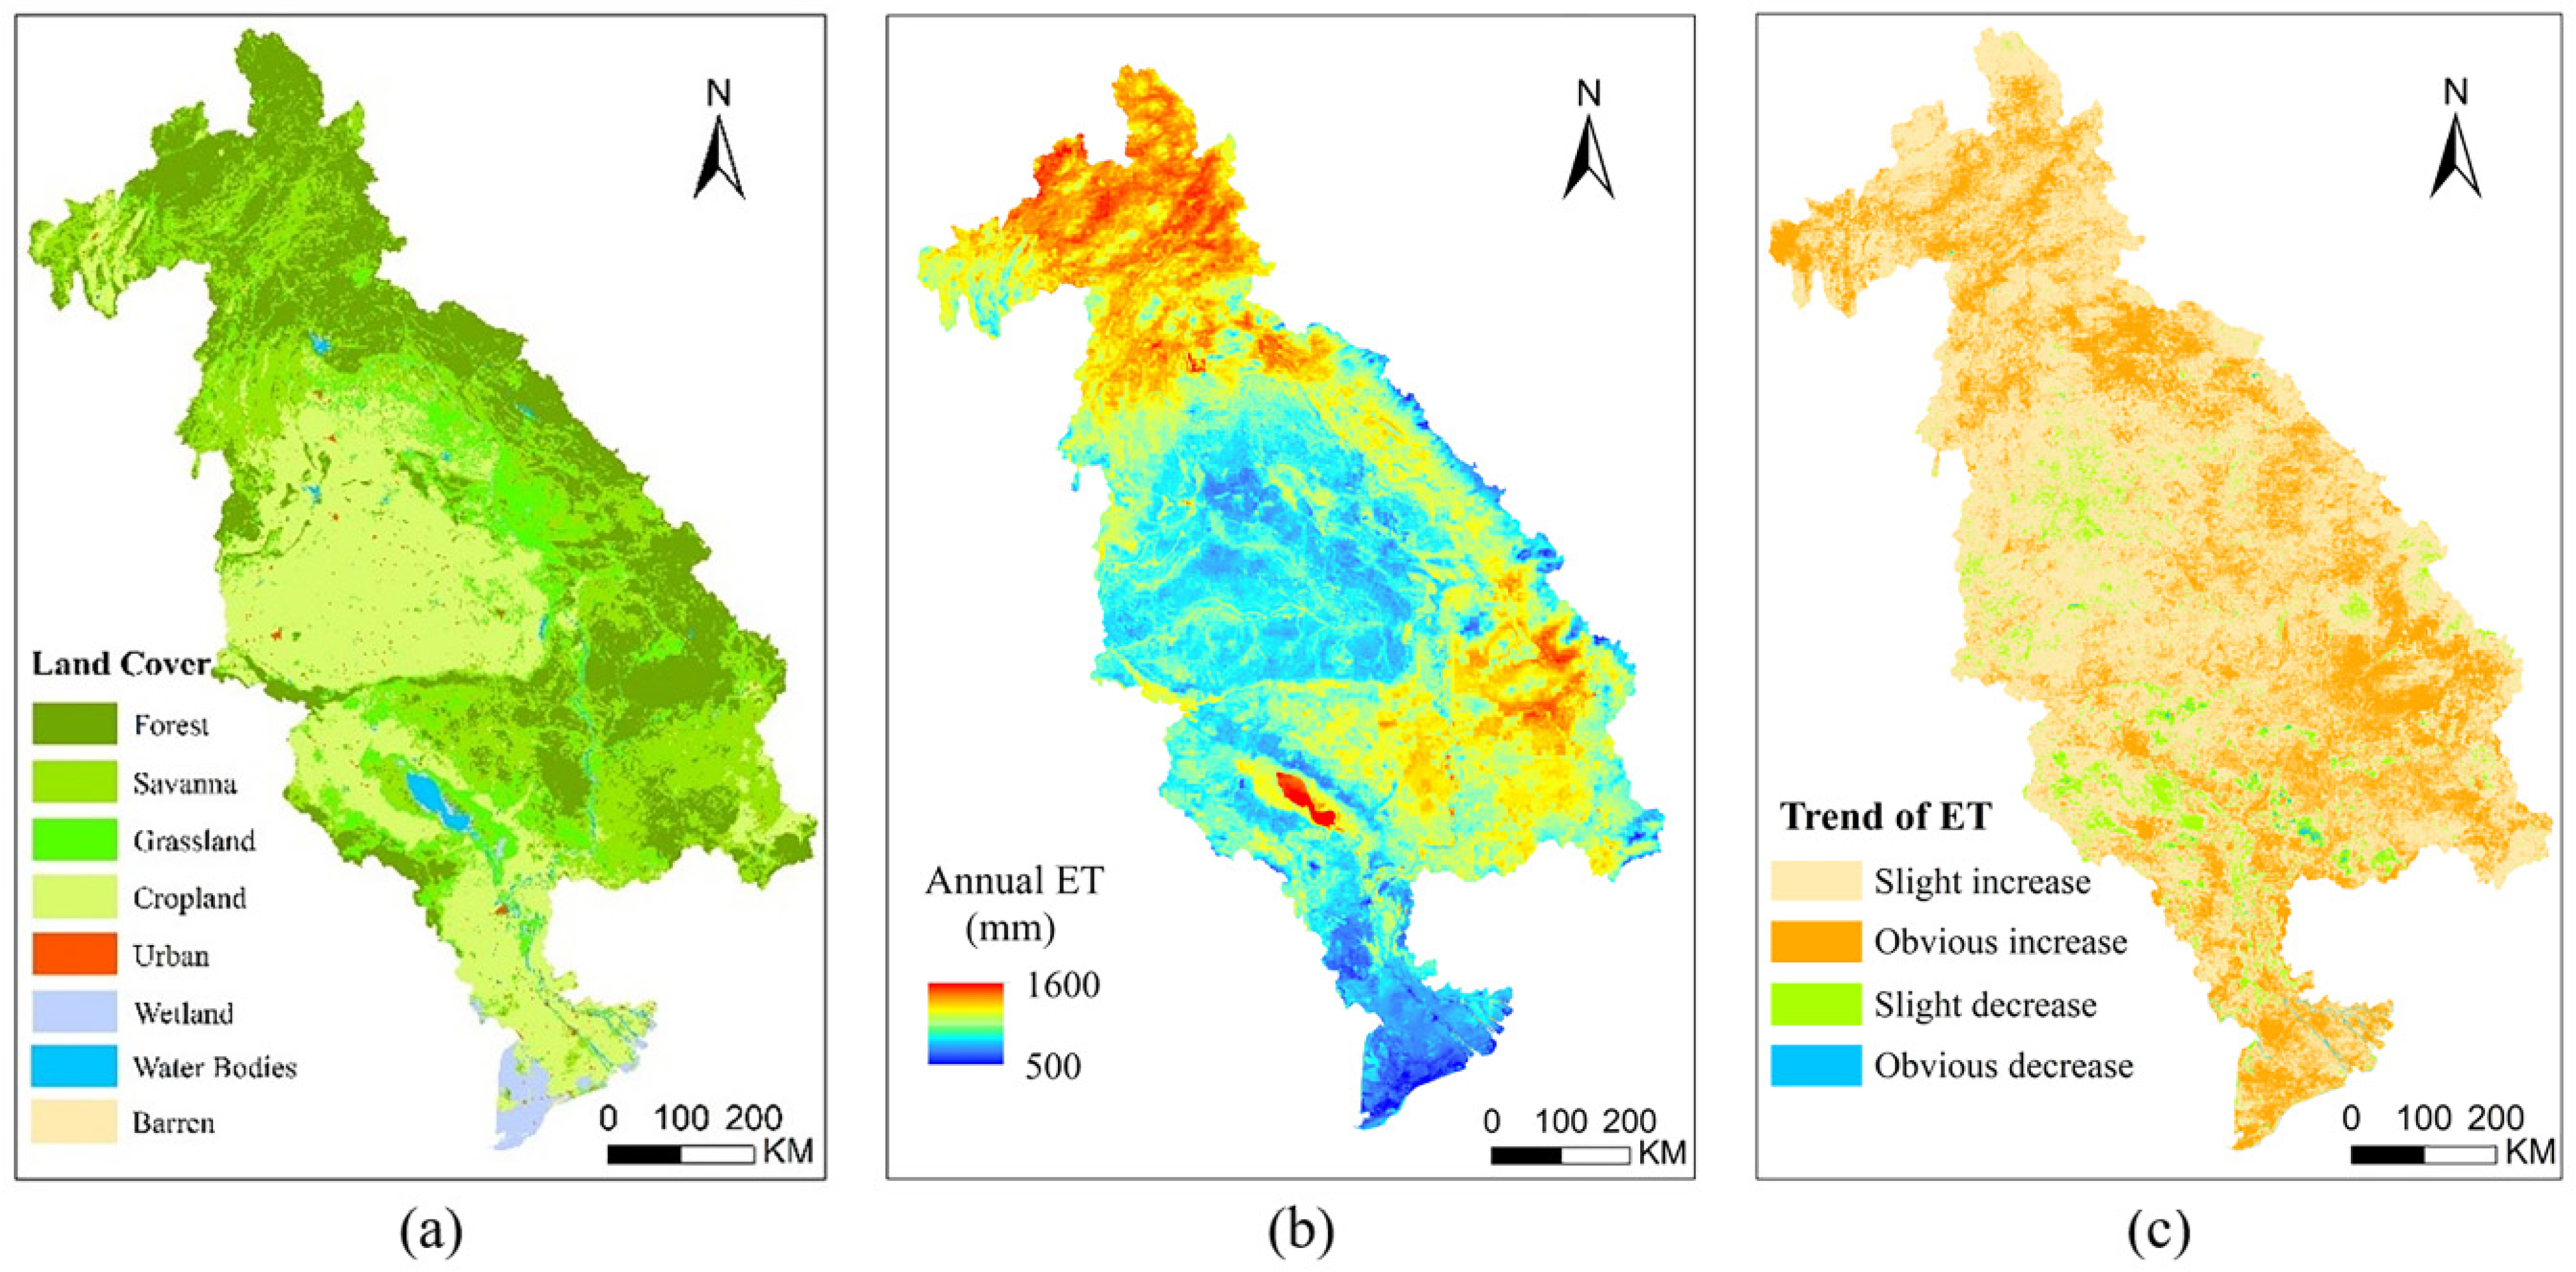
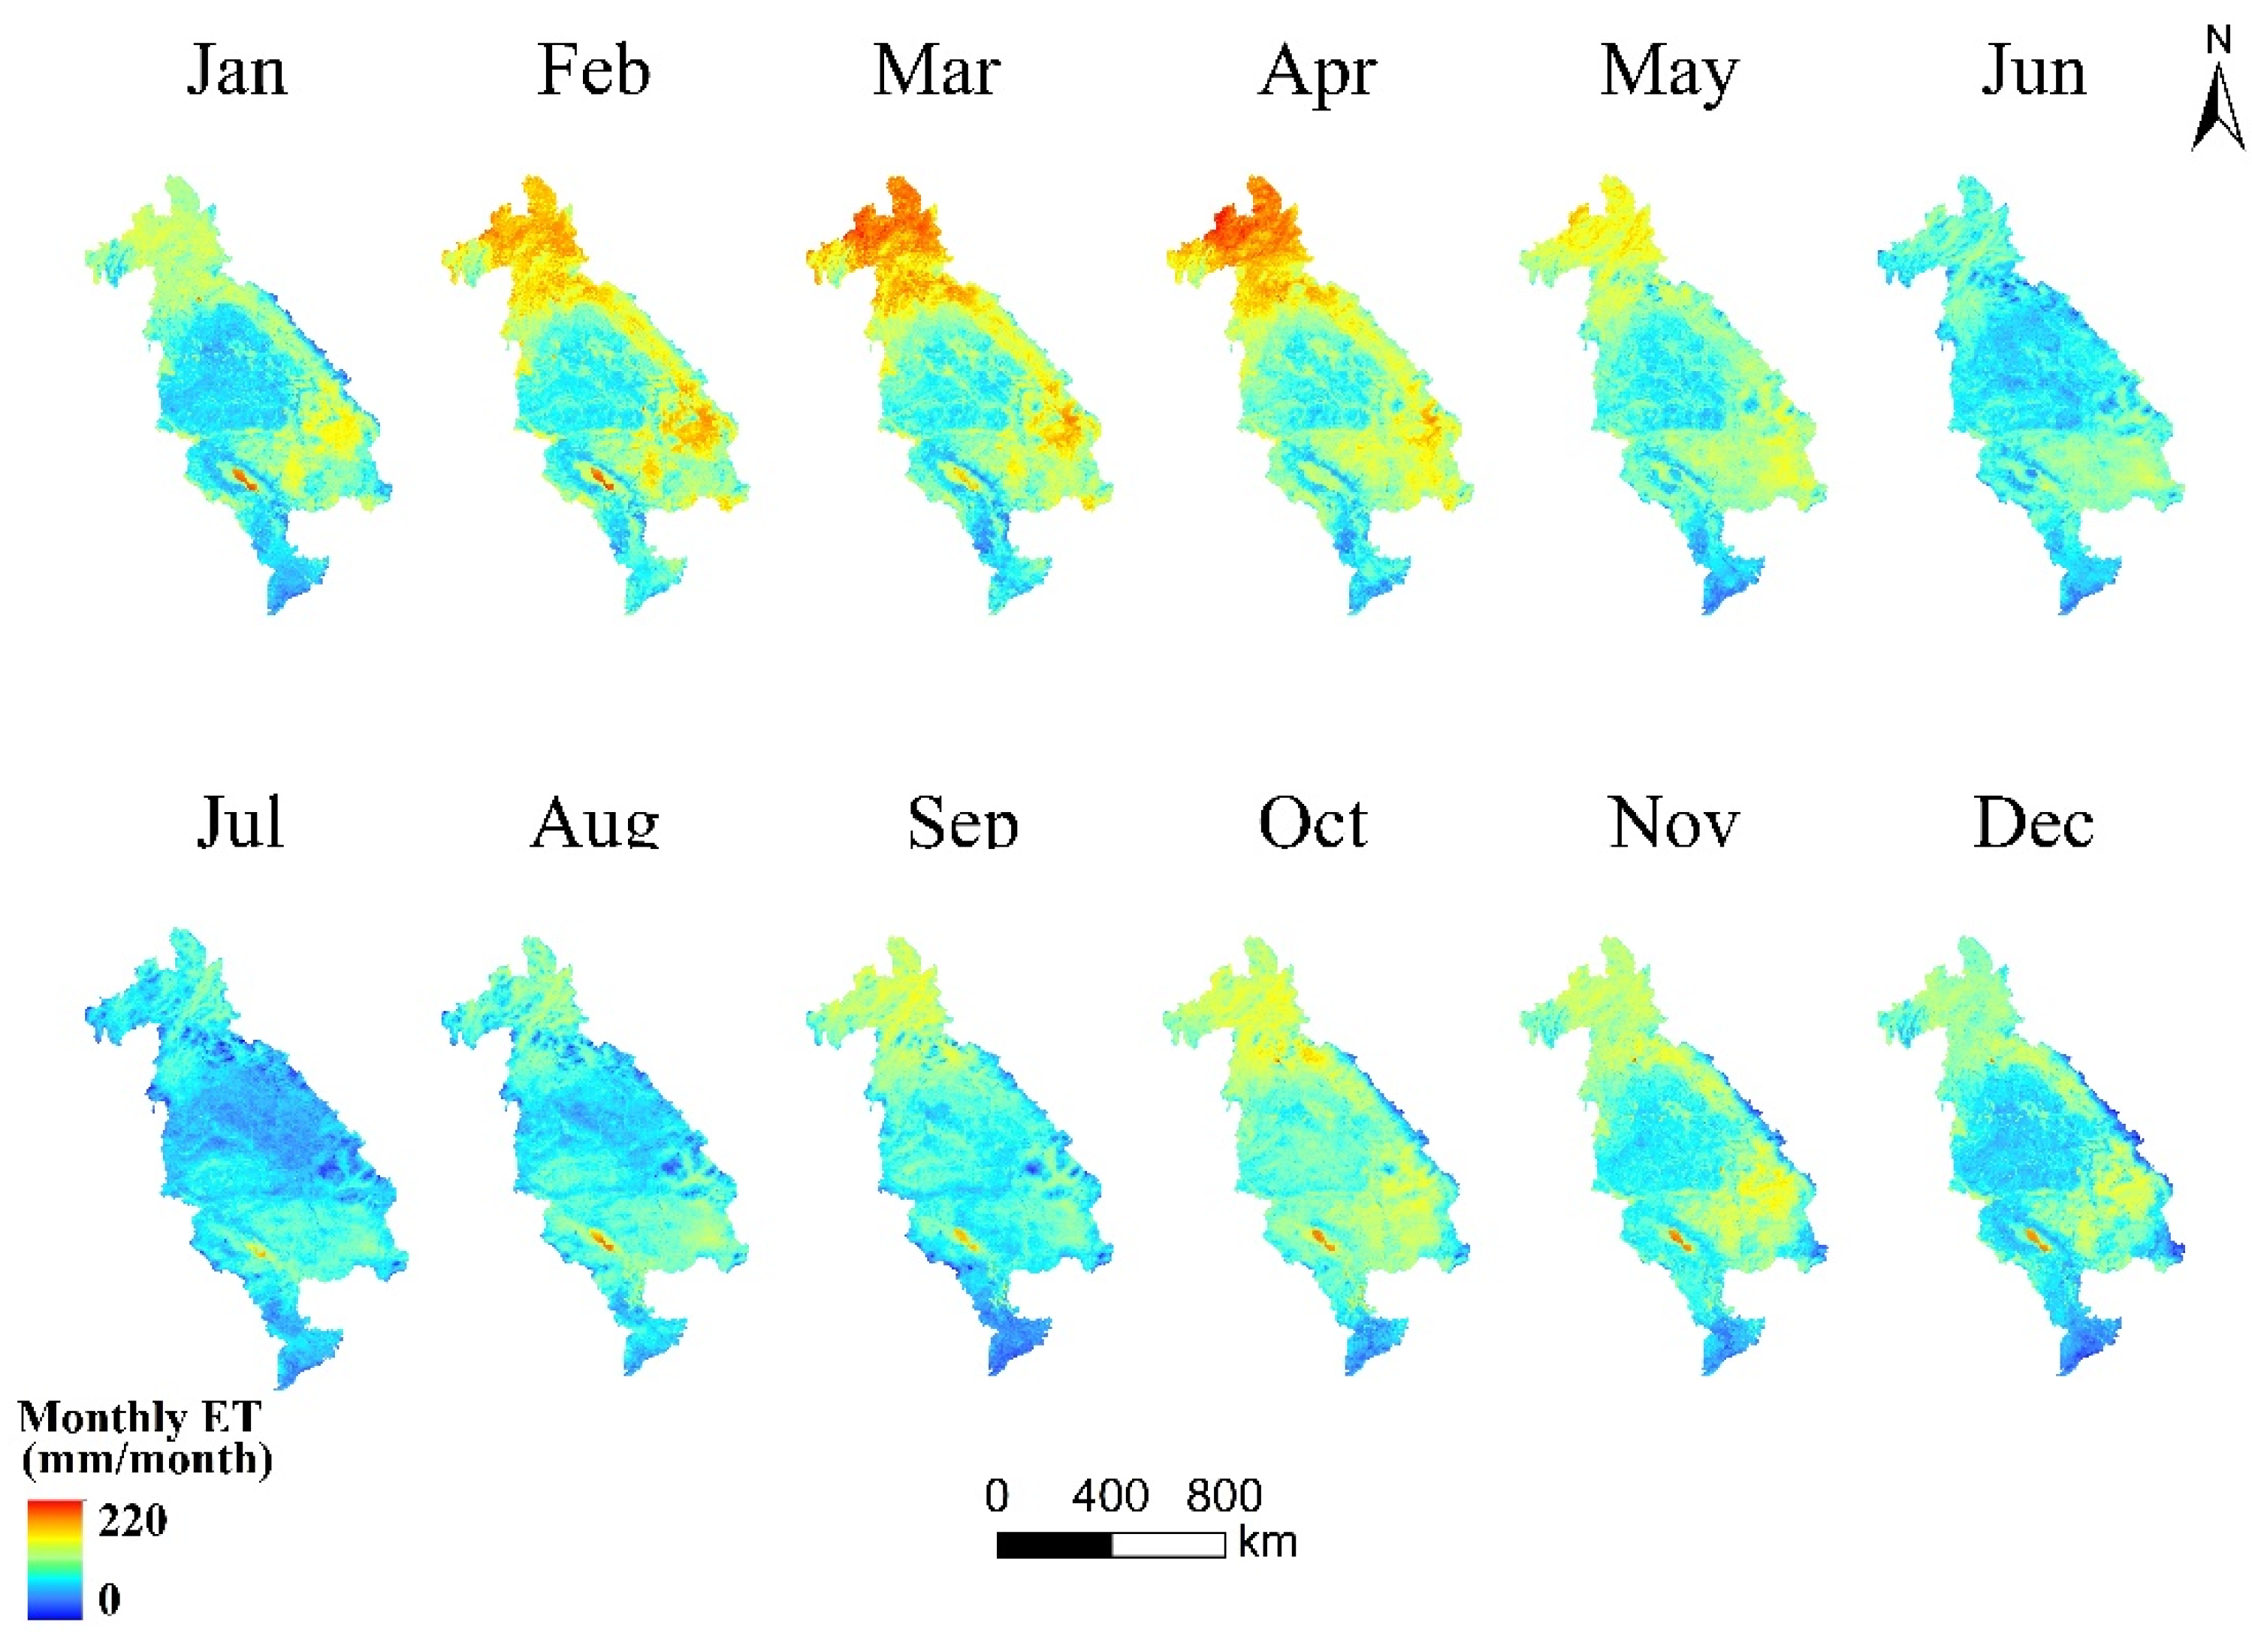
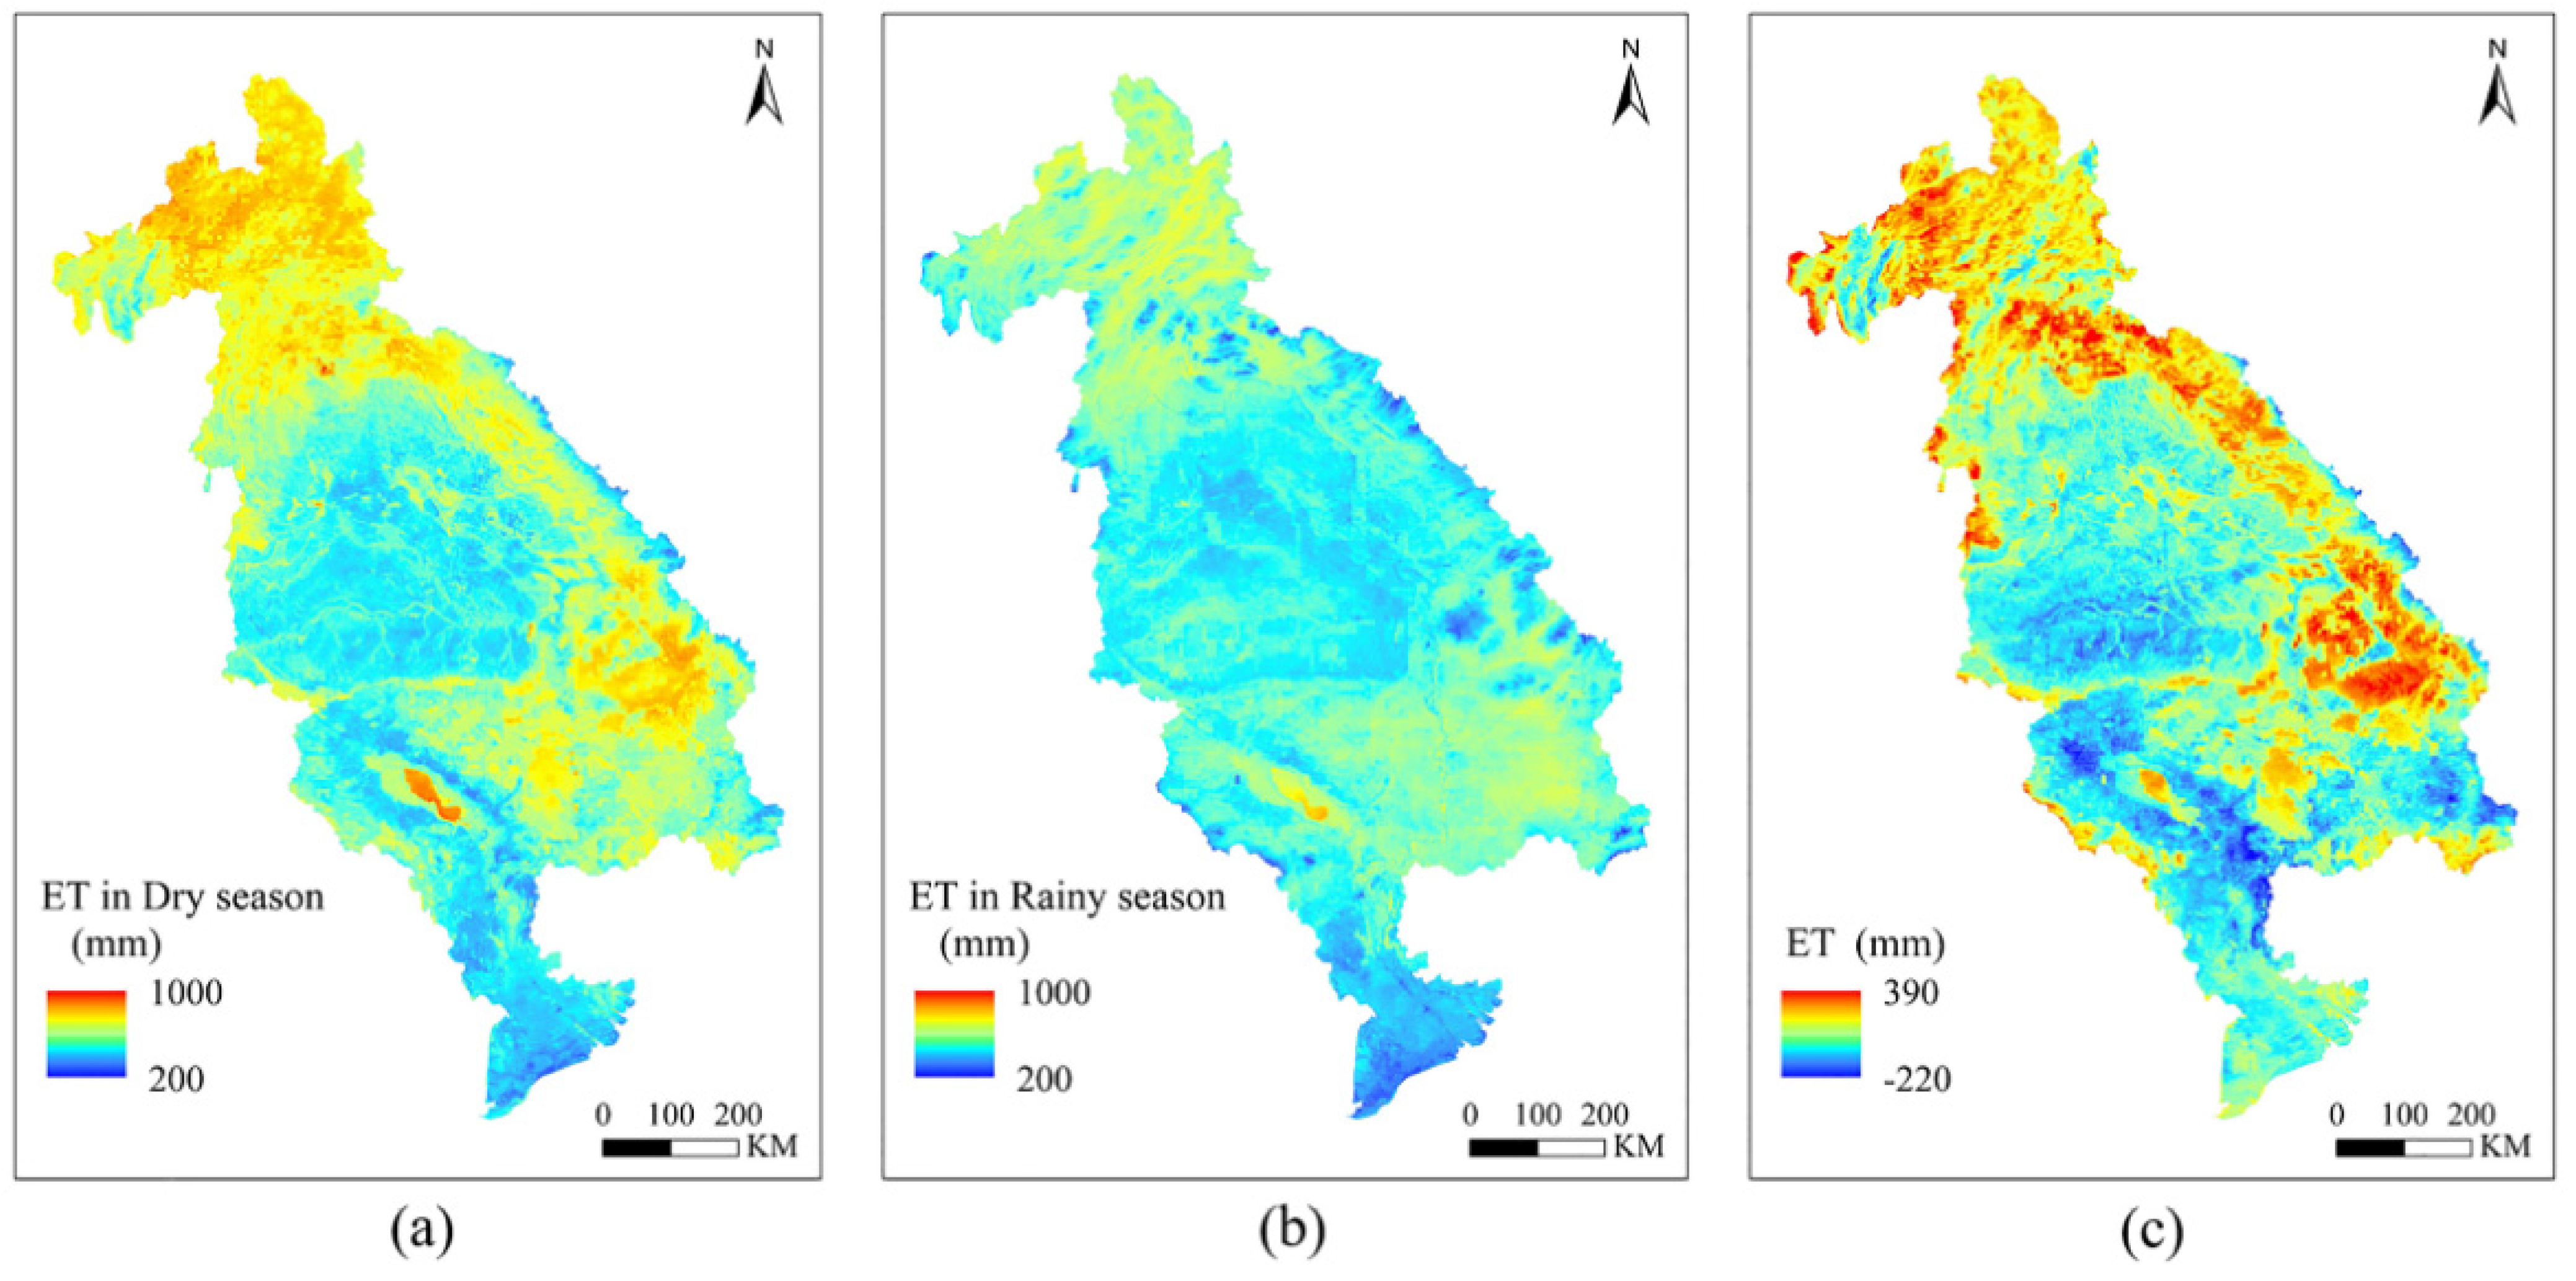
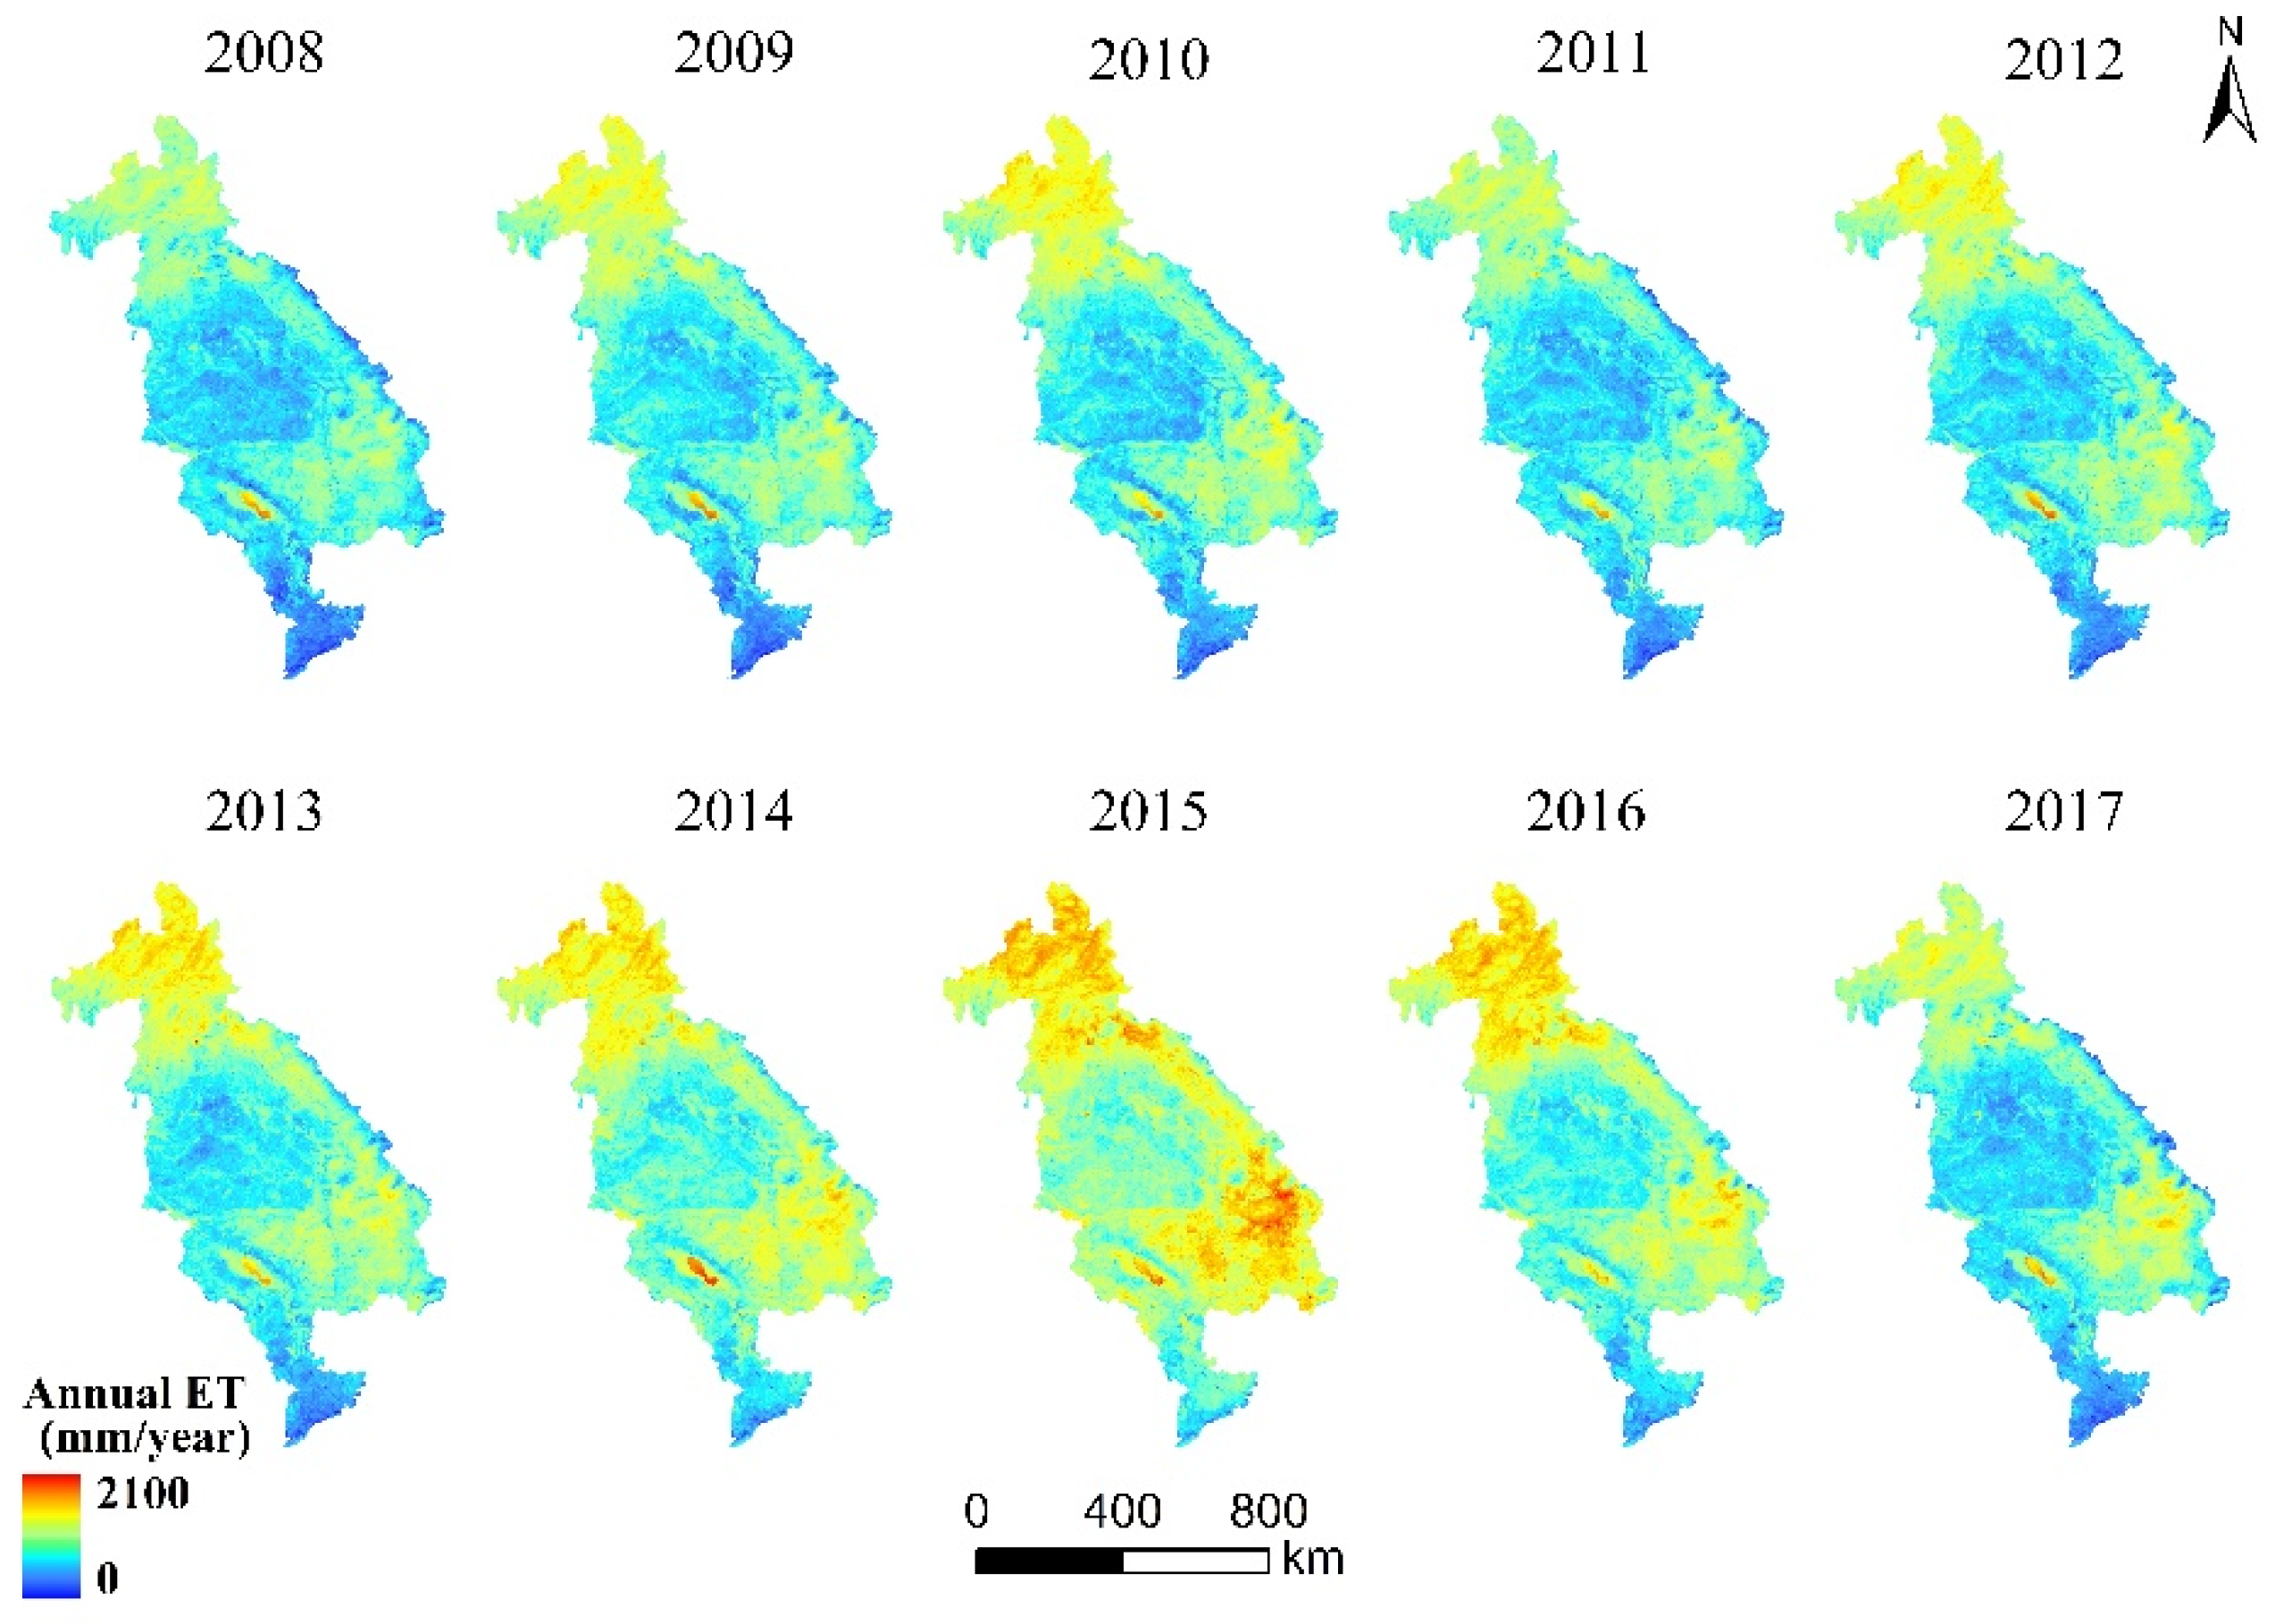
4.3. Spatial Characteristics of ET

The study analyzed land use types in the basin with MCD12Q1 (Figure 5a), and then calculated the spatial distribution of ET by lattice calculation (Figure 5c). As shown in Figure 5a,b, the spatial distribution of ET in the Lower Mekong Basin was consistent with land covers. Along the Mekong River network, ET was low in the middle, with about 840 mm/year of the region, and high in the margin of the basin, with about 1250 mm/year of the region; and the maximum ET was about 1550 mm/year in Tonle Sap Lake. The study conducted time series for multi-year ET, and then counted the MK test value and changing rates based on the Sen + MK trend test to reveal the spatial and temporal variation characteristics of ET. Figure 5c shows the spatial distribution of the changing slope and significance test for ET from 2008 to 2017. Significantly increased areas were mainly located in the tropical broadleaf forests in Laos (in the northern part of the basin) and the forest (in the southeastern of the basin). ET near the water area and the seasonal inundated area showed a slight decrease trend, while ET in most areas of cropland and grassland areas showed a slight increase. The conversion of land use types also affected the change of regional ET: the decrease of ET in Cambodia (in the southern part of the basin) may be related to the deforestation of local tropical forest; however, the decrease in the cropland areas in Thailand (in the middle of the basin) was related to the rotation of different local economic crops.
Figure 6 shows the spatial variation of inter-annual ET. During 2008 to 2017, the obvious changing of ET was mainly in the Laos forests (in the north part of the basin) and the tropical broadleaf forests of Cambodia and Vietnam (in the south part of the basin). With regard to the distribution of spatial characteristics, when the ET in the whole basin increased, there was a more obvious spatial distribution. For example, the forest ET was 15 mm/year higher than the cropland ET in 2008, but the difference between these two areas was 21 mm/year due to the El Niño event in 2015. This phenomenon indicated that ET in forest is more responsive to climate change and plays an important role for regional ecological stability.
The spatial distribution of monthly ET is shown in Figure 7. The spatial distribution characteristics of monthly ET varied a lot. The ET of the Tonle Sap Lake’s was even lower in March to June than the northern forests. The monthly change of the forest ET was nearly 60 mm, while the monthly change of wetlands was only 30 mm. More notable, the forest ET began to exceed water ET of the Tonle Sap Lake from May to July, which is mainly related to the heavy rain and the increase of water areas with the coming of rainy season.
Spatial distributions of seasonal ET and their difference are shown in Figure 8. ET in the basin was 53 mm/season higher in the dry season than in the rainy season and together with a more significant regional difference in the dry season. Above all, the ET in water area was even 500 mm/season higher than that in wetlands ET. Although ET in the dry seasons was higher than in the rainy seasons on the average level, the regional ET was probably higher in the rainy season in a few areas, such as croplands and wetlands.

5. Discussion

Variation of ET is related to meteorological factors and climatic characteristics of different underlying surfaces. This part performs the correlation analysis of the influencing factors.

5.1. Change of Land Cover and Their Impact on ET

The annual ET for different land covers from 2008 to 2017 shown in Figure 9 revealed the influence of land covers on spatial distribution of ET in Figure 5b. As shown in the diagram, ET in the basin is highly consistent with vegetation coverage and magnitude is exhibited as follows: Forest > Savanna > Grassland > Cropland > Urban > Wetland. Sufficient water supply and strong ET of tropical rainforest broad-leaved canopy may lead to forest ET over 1100 mm/year, which is as high as water ET in the basin. In expected urban and barren areas, the difference of annual ET between each land cover was about 80 mm/year, resulting in the similarity of both the ET and land use distribution in Figure 5a. The variation of inter-annual ET distribution in Figure 6 can be explained by the trend in Figure 9a. ET of the grassland, barren, urban, cropland and wetlands with lower vegetation cover roughly increased from 2008 to 2015, and then decreased from 2015 to 2017. Forest ET fluctuated from 2008 to 2011 and then followed the variation trend of the whole basin, but forest ET was higher than water ET in 2015 and 2016.
Li et al. [49] suggested that both human activities and land use types have influences on ET variation, and our study in the basin also confirmed that. The reason that tropical savanna ET and grassland ET was much higher than crop land ET is that rainfall supplies sufficiently to both savanna and grassland areas, and the ET of croplands is affected by human activities and the climate characteristics.
The dynamic change of land use also affected the growth of dominant species in the ecological communities to a certain extent. Therefore, it had a corresponding impact on surface temperature, air humidity and light, and has different scale effects on local microclimate that affect the regional evaporation process. Table 3 shows the land use transfer matrix of the Lower Mekong River Basin between 2008 and 2017.
Combined with the land use transfer matrix and variation of annual ET, the change direction of land use types varied: the same land use type transformed to different types and showed difference in regional ET change. The change of land cover in vegetation areas was mainly from forest to savanna, savanna to grassland and forest to grass. Annual ET in areas where forest and savanna changed into each other both showed an increasing trend (only 45 mm/year and 53 mm/year respectively), and in those areas where forest converted to grass, the annual ET had decreased about 27 mm/year. Therefore, the annual ET of land covers has little influence on regional ET, and previous research indicates that climate change might be the dominant reason for ET changing in such humid basins [50].

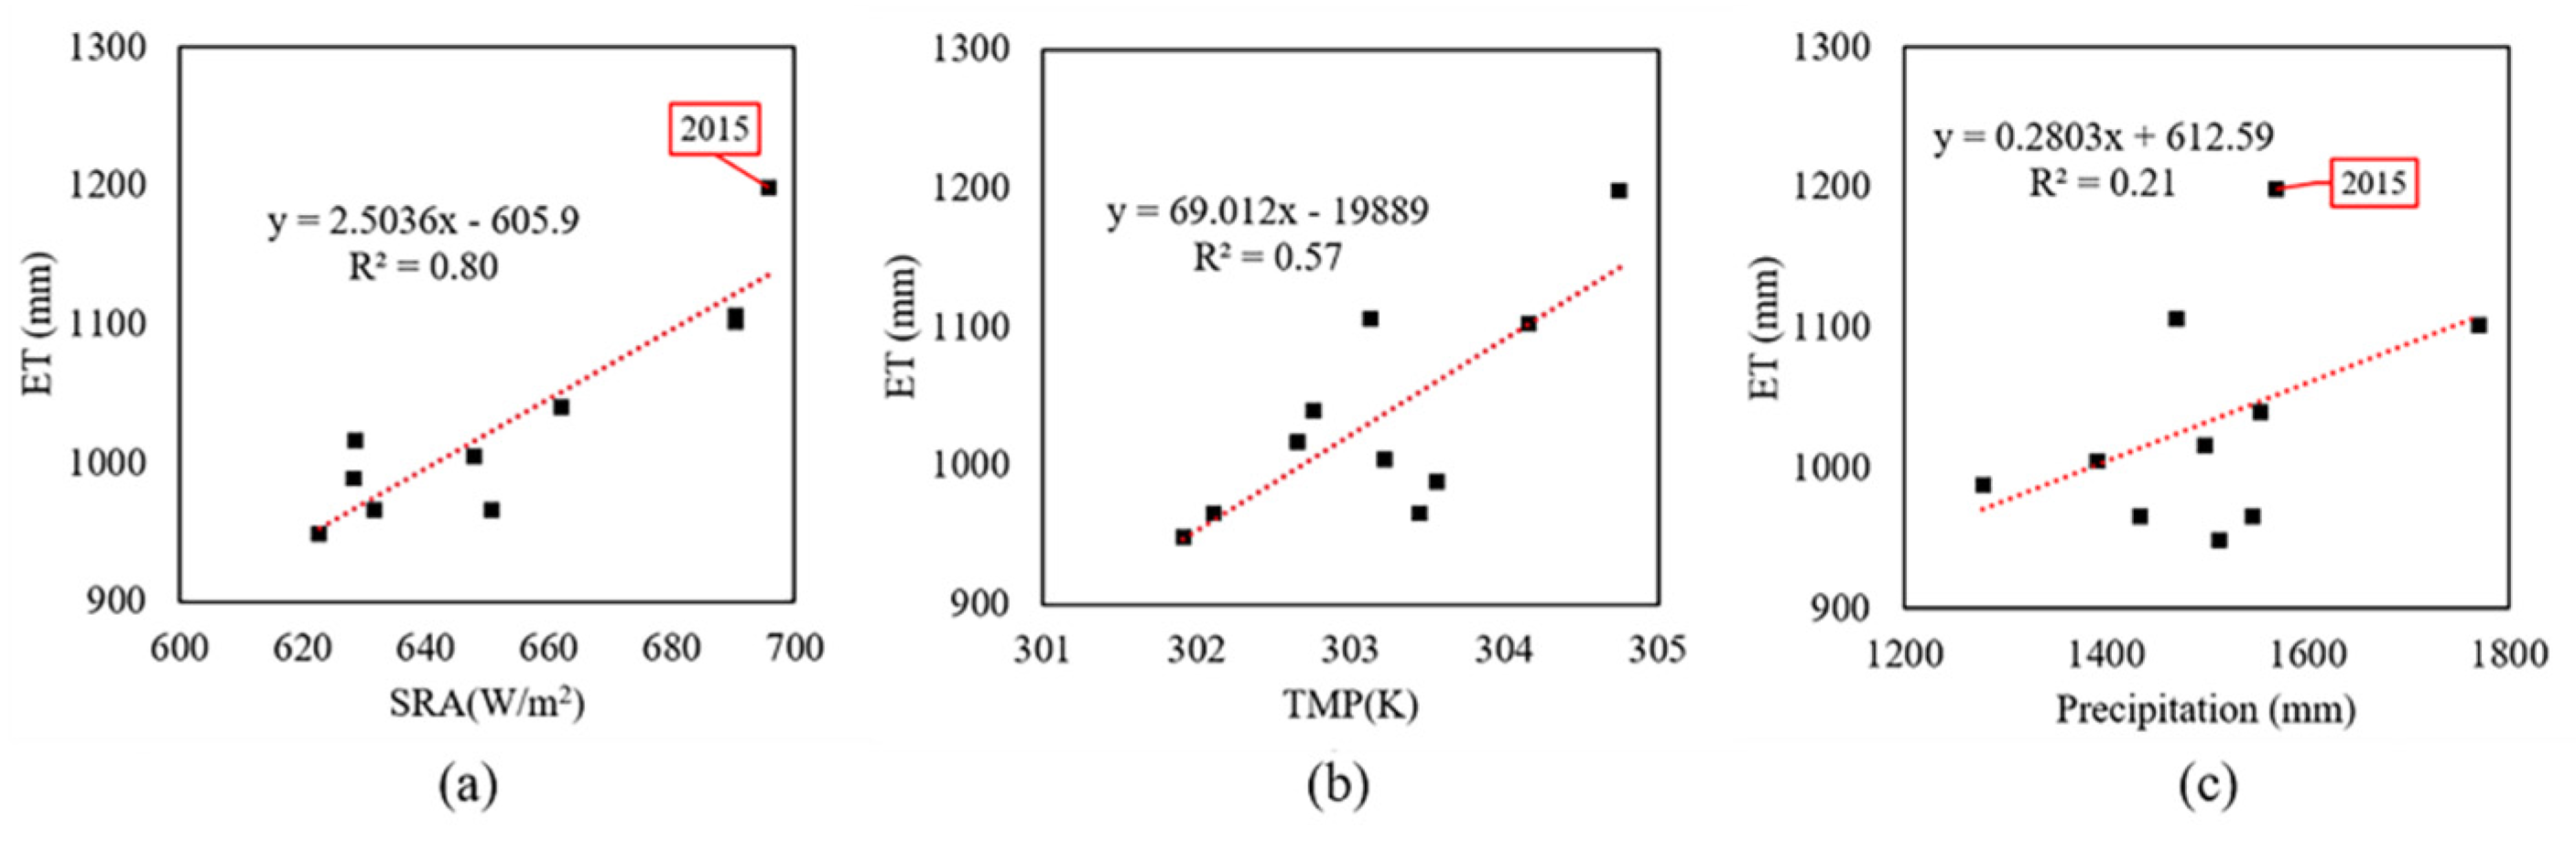
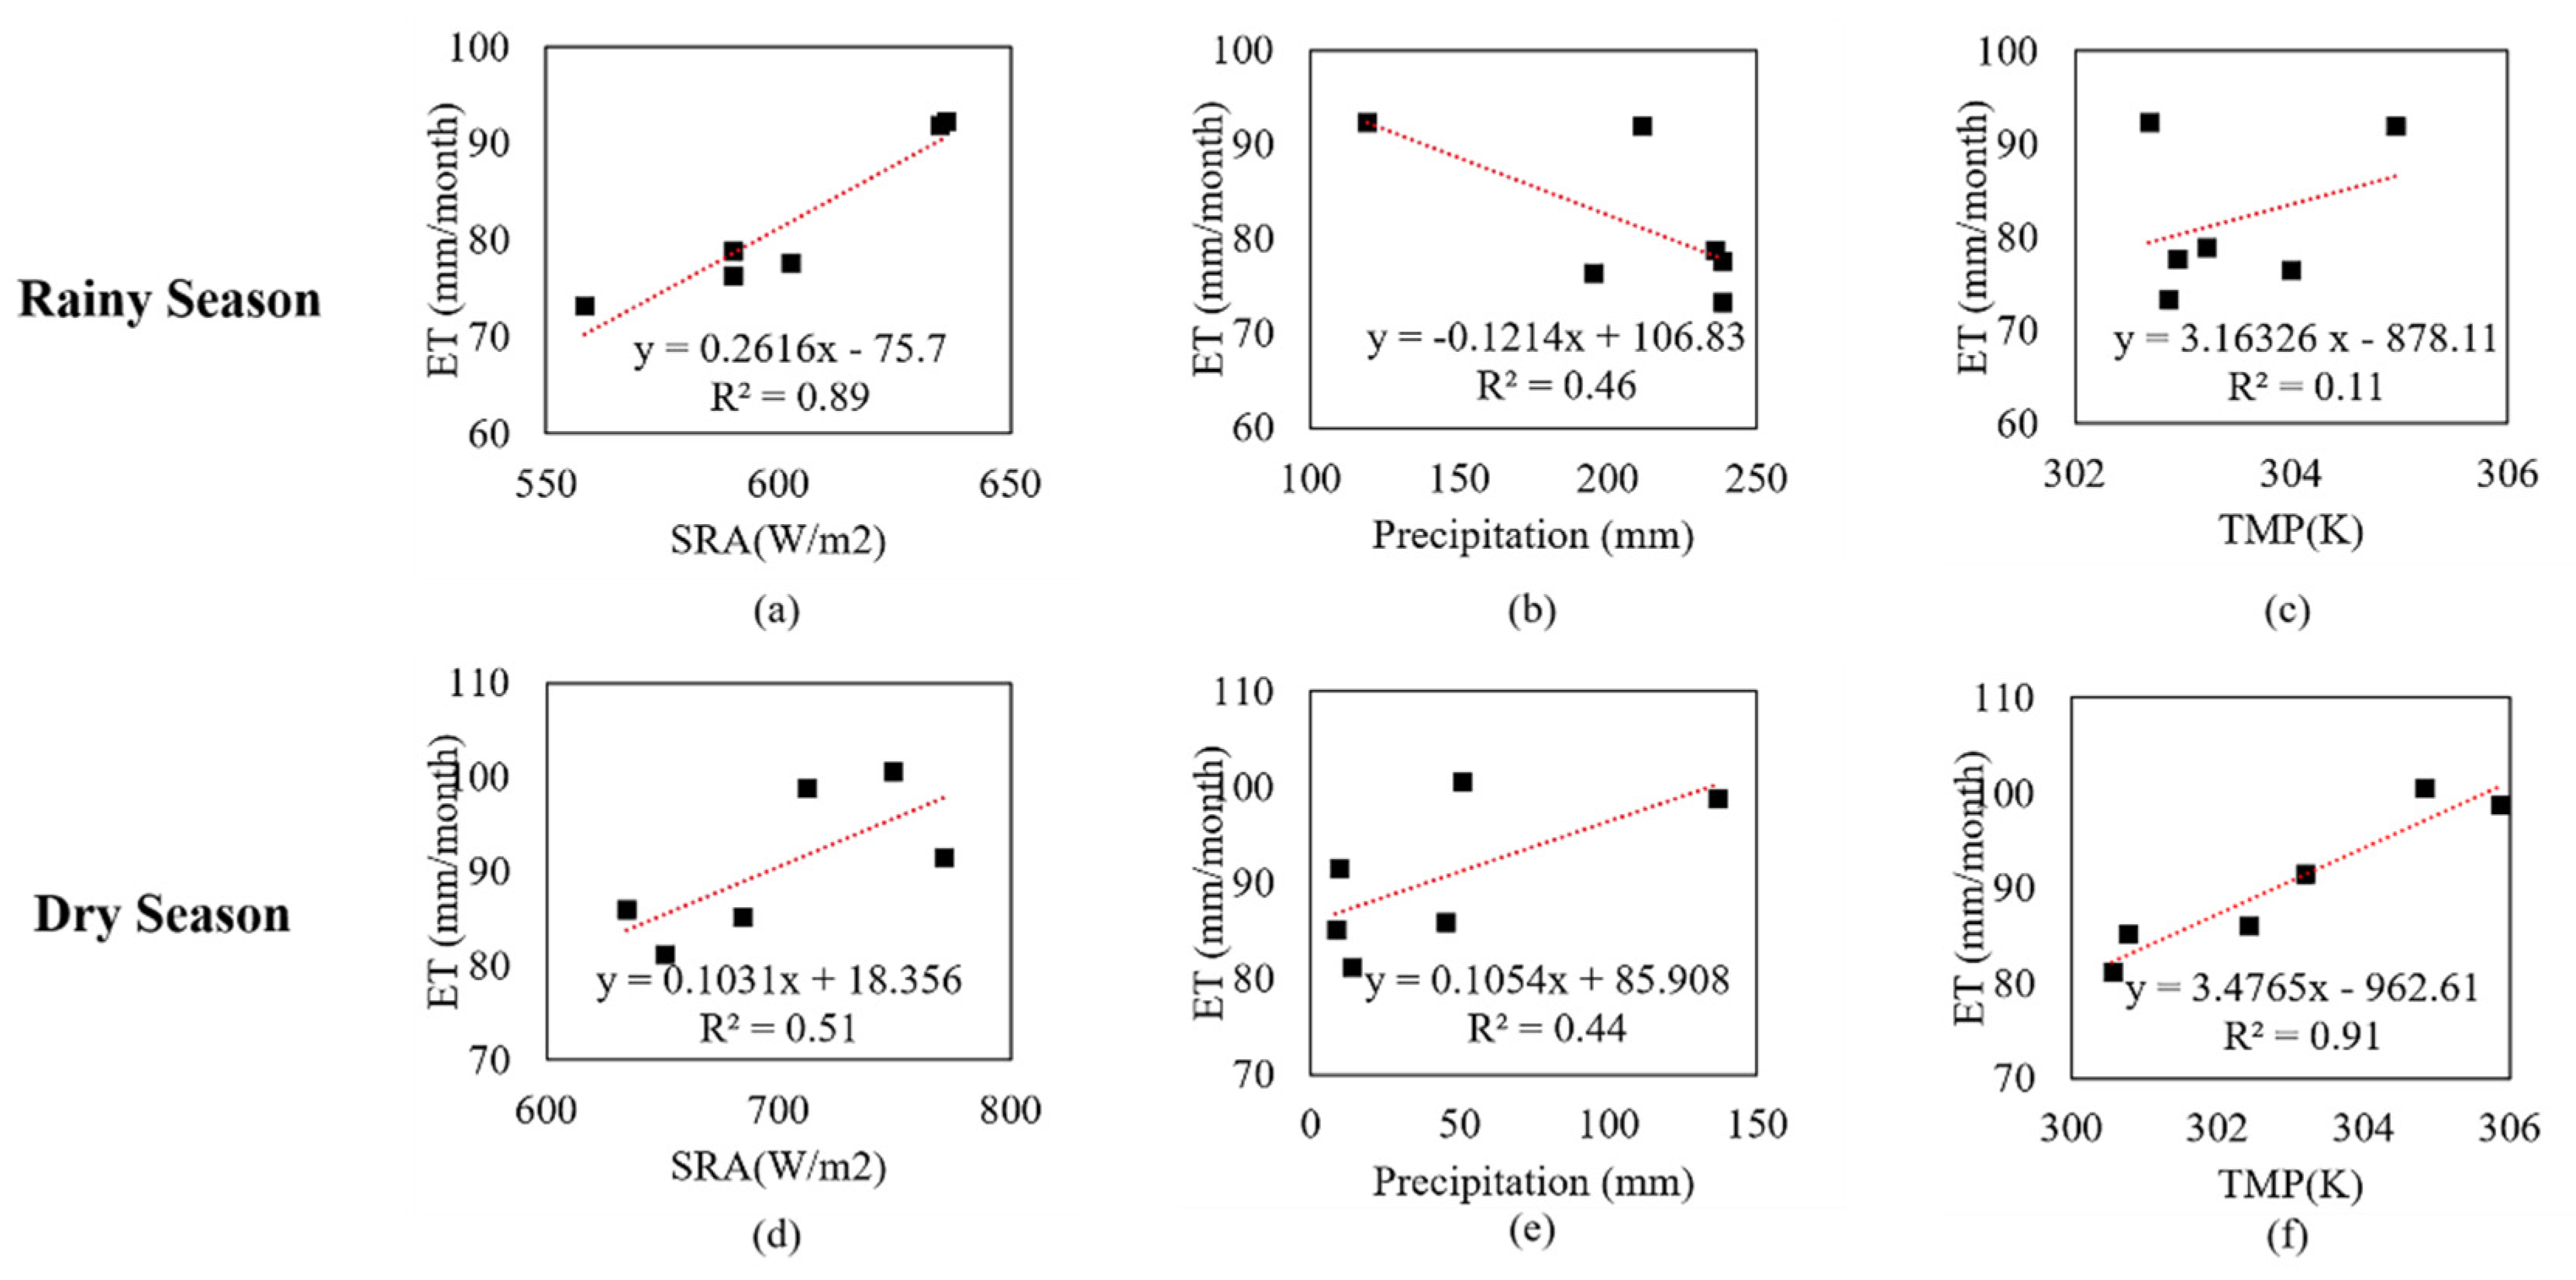
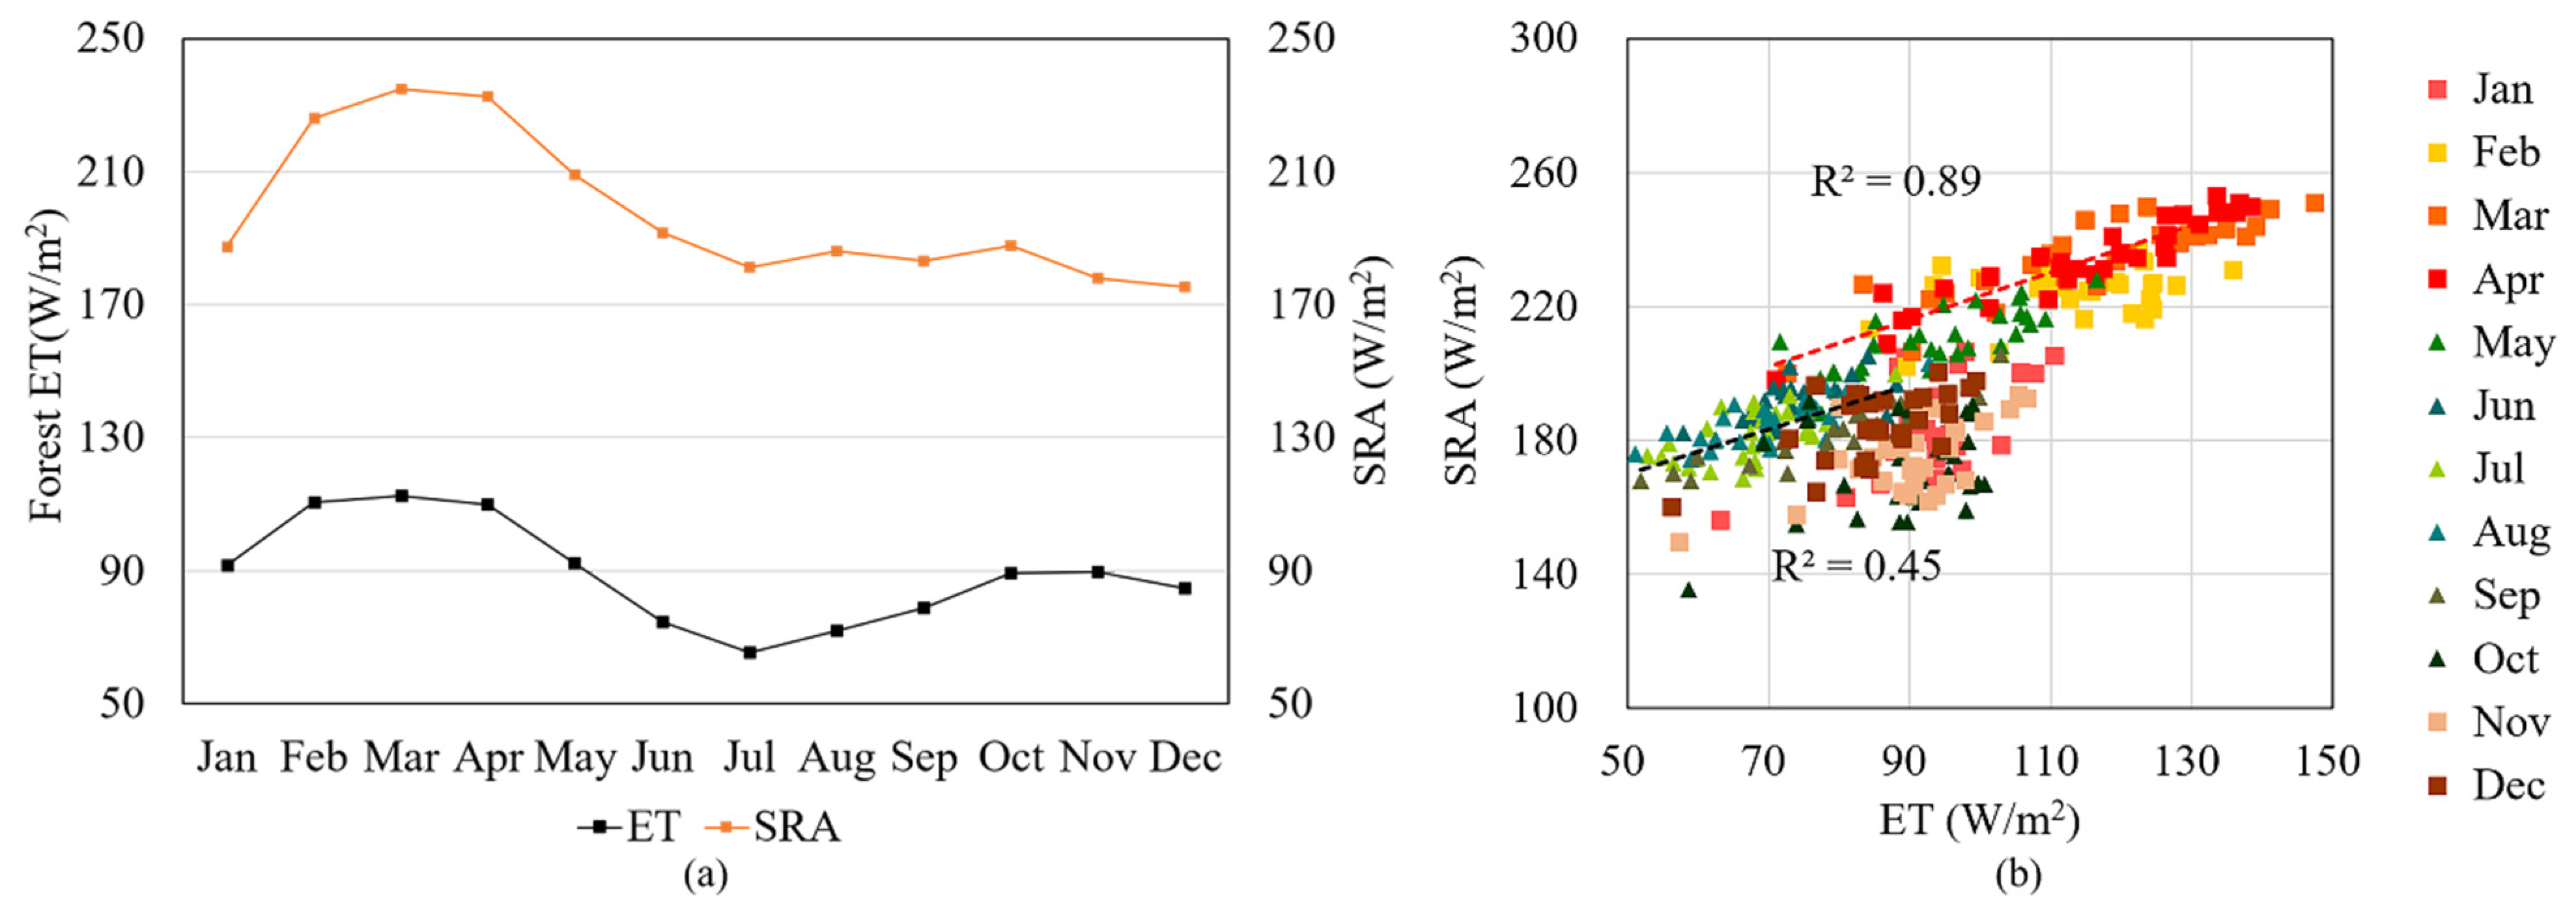
5.2. Influence of Meteorological Factors on ET

The effects of different meteorological factors on the variation of annual ET are shown in Figure 10. Annual ET in the Lower Mekong River Basin was mainly driven by solar energy and near-surface temperature, with the determination of 0.80 and 0.57, respectively. In the typical humid basin, the trends of precipitation and ET were not clearly correlated, but there is a consistent upward trend in both precipitation and SRA in 2015.
Figure 11 shows the correlation coefficient of meteorological factors on a seasonal scale. Correlations between meteorological factors and ET shifted between rainy and dry seasons. The variation trends of solar radiation and ET are consistent both on the annual and seasonal scales, especially as regards the relative index, which is about 0.89 in rainy seasons. Notably, as the precipitation decreases and surface temperature increases from rainy season to dry season, the inhibitory effect of precipitation on ET becomes the promote effect. However, temperature becomes the dominant influencing factor in dry season, where the relative index is 0.91.
The above discussion indicates that forest ET had the most obvious change in time series, and the dominant meteorological influencing factor of ET in the Lower Mekong River Basin is solar radiation. Present research reported that the forest area in the Lower Mekong Basin is mainly natural forest [51]. Therefore, it is necessary to clarify the correlation between solar radiation and ET in natural forest area. In the natural forest area, monthly SRA was the highest in April (235 W/m2) and the lowest in December (175 W/m2). The spatial distribution of SRA in the forest areas shown in Figure 12a presents the increasing trend from February to April that was the same with the spatial distribution of forest ET in Figure 9. As shown in Figure 12b, both SRA and forest ET are higher in the dry season than in the rainy season, and the correlation between them is significant in the dry season (the correlation coefficient in the dry season is 0.89, and the correlation coefficient in the rainy season is 0.45).
The reason that the ET in the basin is dominated by solar radiation includes the two aspects that have been discussed above. On the one hand, forest ET was as high as water ET in the whole basin while it also occupied a large area. On the other hand, the variation of SRA is the dominant factor that influenced forest ET, which caused the regional monthly ET to have the same variation trend as SRA. Other researchers have also reached similar conclusions regarding such wet surface areas, that the change of ET is consistent with the change of solar radiation, and is opposite to that of precipitation [52,53].

6. Conclusions

In this paper, the ET in the Lower Mekong River Basin during 2008 to 2017 was retrieved by using MODIS and CLDAS data, and the spatial and temporal variation characteristics of ET in the region were analyzed. This study can help people better understand the water cycle process in the basin and has reference value and contribution to the formulation of water resources measures and economic development decision in the Lower Mekong River Basin. The main conclusions of the paper are as follows:
(1) ET in the basin slightly increased during 2008 to 2017 and experienced an unusual increase from January 2015 to July 2016. The highest annual ET was 1198 mm/year in 2015, and the lowest annual ET was 949 mm/year in 2008. The ET in the rainy season was lower than that in the dry season, and the inter-annual variation trend of seasonal ET was consistent with that of annual ET, and average difference of seasonal ET was 53 mm/season. On the monthly scale, the monthly ET was consistent with the monthly precipitation in the dry season months, and opposite to the monthly precipitation in the rainy season months. The maximum monthly ET was 101 mm/month in March, and the minimum monthly ET was 73 mm/month in July.
(2) ET was low in the middle with about 840 mm/year of the region and high in the margin of the basin with about 1250 mm/year of the region; the maximum ET was about 1550 mm/year in Tonle Sap Lake. With the increase of ET in the basin, natural forests have the most obvious response to changes in ET, thus the basin also had the largest spatial difference of ET in 2015. The distribution of ET in the dry season was more obvious than that in the rainy season. Only the wetlands in the southern part of the basin and some cropland in the middle of the basin affected by human activities had higher ET in the rainy season than in the dry season. The variation law of monthly scale ET on different underlying surfaces was different: the change of forest ET was nearly 60 mm/month, while the that of wetland ET was only 30 mm/month.
(3) The study analyzed the main factors affecting the ET in the Lower Mekong River Basin from two aspects of land cover and meteorology. Our experiments show that ET in the basin was highly consistent with vegetation coverage, and magnitude is exhibited as: Forest > Savanna > Grassland > Cropland > Urban > Wetland. The difference of ET between adjacent land types was uniform, so the distribution of ET in the basin was clearly displayed. Our results also revealed that i meteorological factors rather than land cover change affected the ET changing in the basin the most. On the inter-annual scale, ET was mainly driven by solar energy and near-surface temperature, with the determination of 0.80 and 0.57, respectively. On the seasonal scale, SRA and TMP were the dominant factors in the rainy and dry seasons, with the relative index of 0.89 and 0.91, respectively. However, precipitation restrained ET in the rainy season months. The study further confirmed that the largest coverage of forest and the greater influence of forest ET by SRA lead to the ET of the entire basin being dominated by SRA.

Author Contributions

Conceptualization, X.P.; methodology, X.P.; software, X.P.; formal analysis, S.L.; validation, Z.Y.; investigation, C.Y.; data curation, Z.Y., W.X. and T.L.; data analysis, C.Y.; writing—original draft preparation, S.L.; writing—review and editing, X.P.; visualization, S.L. and C.Y.; supervision, Y.Y.; funding acquisition, X.P. and Y.Y. All authors have read and agreed to the published version of the manuscript.

Funding

This research was funded by the National Nature Science Foundation of China (41701487 and 420713460), the Fundamental Research Funds for the Central Universities of China (2019B02714, B210201013), the State Scholarship Funds of China, and the Nature Science Foundation of Jiangsu Province, China (BK20190495).

Data Availability Statement

The data used in this study was from the following platforms: the LAADS of NASA for providing MODIS products (http://ladsweb.nascom.nasa.gov, accessed on 20 December 2020), the National Meteorological Information Center of China for providing CLDAS products (http://data.cma.cn, accessed on 6 January 2021) and the Center for Global Environmental Research for providing vector data (https://www.cger.nies.go.jp/en/, accessed on 10 September 2020).

Acknowledgments

We would like to thank the LAADS of NASA for providing MODIS products (http://ladsweb.nascom.nasa.gov, accessed on 20 December 2020), the National Meteorological Information Center of China for providing CLDAS products (http://data.cma.cn, accessed on 6 January 2021) and the Center for Global Environmental Research for providing vector data (https://www.cger.nies.go.jp/en/, accessed on 10 September 2020). We also thank the anonymous referees for their insightful comments and suggestions.

Conflicts of Interest

The authors declare no conflict of interest.

References

  1. Bates, B.C.; Kundzewicz, Z.W.; Wu, S.; Palutikof, J.P.; Arnell, N. Climate Change and Water; Technical Paper of the Intergovernmental Panel on Climate Change; IPCC: Geneva, Switzerland, 2008. [Google Scholar]
  2. Monteith, J.L. Evaporation, evapotranspiration and climatic data. J. Hydrol. 1997, 190, 167–168. [Google Scholar] [CrossRef]
  3. Brutsaert, W. The Surface Roughness Parameterization; Springer: Dutch, The Netherlands, 1982. [Google Scholar]
  4. Stocker, T.F. Climate Change 2013: The Physical Science Basis. Contribution of Working Group I to the Fifth Assessment Report of IPCC the Intergovernmental Panel on Climate Change; AGU Fall Meeting Abstracts; IPCC: Geneva, Switzerland, 2014. [Google Scholar]
  5. Thompson, J.R.; Green, A.J.; Kingston, D.G.; Todd, M.C.; Richard, G.T. Potential Evapotranspiration-Related Uncertainty in Climate Change Impacts on River Flow: An Assessment for the Mekong River Basin. J. Hydrol. 2014, 510, 503–523. [Google Scholar] [CrossRef] [Green Version]
  6. Oki, T.; Kanae, S. Global Hydrological Cycles and World Water Resources. Science 2006, 313, 1068–1072. [Google Scholar] [CrossRef] [PubMed] [Green Version]
  7. Wang, S.D.; Chen, X.; Liu, S.H.; Kai, Y.U.; Zhou, S.J. A Review on Monitoring Models of Arid Area Using Remote Sensing. Remote Sens. Inf. 2006. [Google Scholar] [CrossRef]
  8. Tirivarombo, S.; Osupile, D.; Eliasson, P. Drought monitoring and analysis: Standardised Precipitation Evapotranspiration Index (SPEI) and Standardised Precipitation Index (SPI). Phys. Chem. Earth Parts A/B/C 2018, 106, 1–10. [Google Scholar] [CrossRef]
  9. Song, L.; Liu, S.; Kustas, W.P.; Nieto, H.; Sun, L.; Xu, Z.; Skaggs, T.H.; Yang, Y.; Ma, M.; Xu, T.; et al. Monitoring and Validating Spatially and Temporally Continuous Daily Evaporation and Transpiration at River Basin Scale. Remote Sens. Environ. 2018, 219, 72–88. [Google Scholar] [CrossRef]
  10. Di, L.; Singh, V.P. Assessing the Impact of End-Member Selection on the Accuracy of Satellite-Based Spatial Variability Models for Actual Evapotranspiration Estimation. Water Resour. Res. 2013, 49, 2601–2618. [Google Scholar]
  11. Anderson, M.C.; Allen, R.G.; Morse, A.; Kustas, W.P. Use of Landsat Thermal Imagery in Monitoring Evapotranspiration and Managing Water Resources. Remote Sens. Environ. 2012, 122, 50–65. [Google Scholar] [CrossRef]
  12. Jackson, R.D.; Idso, S.B.; Reginato, R.J.; Pinter, P.J., Jr. Canopy Temperature as a Crop Water Stress Indicator. Water Resour. Res. 1981, 17, 1133–1138. [Google Scholar] [CrossRef]
  13. Yang, Y.; Shang, S.; Jiang, L. Remote Sensing Temporal and Spatial Patterns of Evapotranspiration and the Responses to Water Management in a Large Irrigation District of North China. Agric. For. Meteorol. 2012, 164, 112–122. [Google Scholar] [CrossRef]
  14. Cosslett, T.L.; Cosslett, P.D. The Lower Mekong Basin: Rice Production, Climate Change, ENSO, and Mekong Dams. In Sustainable Development of Rice and Water Resources in Mainland Southeast Asia and Mekong River Basin; Springer: Dordrecht, The Netherlands, 2018; pp. 85–114. [Google Scholar] [CrossRef]
  15. Zhang, X.; Liu, H. Analysis of Drought Character in the Mekong River Basin. In Flood Prevention and Drought Relief in Mekong River Basin; Springer: Dordrecht, The Netherlands, 2020; pp. 95–107. [Google Scholar] [CrossRef]
  16. Chen, X.; Zheng, Y.; Xu, B.; Wang, L.; Han, F.; Zhang, C. Balancing Competing Interests in the Mekong River Basin via the Operation of Cascade Hydropower Reservoirs in China: Insights from System Modeling. J. Clean. Prod. 2020, 254, 119967. [Google Scholar] [CrossRef]
  17. Hu, Y.; Maskey, S.; Uhlenbrook, S. Downscaling Daily Precipitation over the Yellow River Source Region in China: A Comparison of Three Statistical Downscaling Methods. Arch. Meteorol. Geophys. Bioclimatol. Ser. B 2012, 112, 447–460. [Google Scholar] [CrossRef]
  18. Wang, W.; Lu, H.; Yang, D.; Sothea, K.; Jiao, Y.; Gao, B.; Peng, X.; Pang, Z. Modelling Hydrologic Processes in the Mekong River Basin Using a Distributed Model Driven by Satellite Precipitation and Rain Gauge Observations. PLoS ONE 2016, 11, e0152229. [Google Scholar] [CrossRef] [PubMed] [Green Version]
  19. Bo, X.; Yu, L.; Han, F.; Zheng, Y.; Ding, W.; Zhang, C.; Wallington, K.; Zhang, Z. The Transborder Flux of Phosphorus in the Lancang-Mekong River Basin: Magnitude, Patterns and Impacts from the Cascade Hydropower Dams in China. J. Hydrol. 2020, 590, 125201. [Google Scholar]
  20. Gu, Z.; Fan, H.; Wang, Y. Dynamic Characteristics of Sandbar Evolution in the Lower Lancang-Mekong River between 1993 and 2012 in the Context of Hydropower Development. Estuar. Coast. Shelf Sci. 2020, 237, 106678. [Google Scholar] [CrossRef]
  21. Hecht, J.S.; Lacombe, G.; Arias, M.E.; Dang, T.D.; Piman, T. Hydropower Dams of the Mekong River Basin: A Review of Their Hydrological Impacts. J. Hydrol. 2019, 568, 285–300. [Google Scholar] [CrossRef]
  22. Liu, S.; Li, X.; Chen, D.; Duan, Y.; Ji, H.; Zhang, L.; Chai, Q.; Hu, X. Understanding Land Use/Land Cover Dynamics and Impacts of Human Activities in the Mekong Delta over the Last 40 Years. Glob. Ecol. Conserv. 2020, 22, e00991. [Google Scholar] [CrossRef]
  23. Chen, X.; Lui, H.; Mu, X. Summary of Flood and Drought in Mekong River Basin. In Flood Prevention and Drought Relief in Mekong River Basin; Springer: Dordrecht, The Netherlands, 2020; pp. 27–54. [Google Scholar]
  24. Andrews, D.G. Frontmatter. In An Introduction to Atmospheric Physics; Cambridge University Press: Cambridge, UK, 2010. [Google Scholar]
  25. Liu, Y. Hydrologic Remote Sensing; CRC Press: Boca Raton, FL, USA, 2016. (In Chinese) [Google Scholar]
  26. Wang, K.; Dickinson, R.E. A Review of Global Terrestrial Evapotranspiration: Observation, Modeling, Climatology, and Climatic Variability. Rev. Geophys. 2012, 50, 2. [Google Scholar] [CrossRef]
  27. Wild, M. Solar radiation budgets in atmospheric model intercomparisons from a surface perspective. Geophys. Res. Lett. 2005, 32, 99–119. [Google Scholar] [CrossRef]
  28. Trenberth, K.E.; Fasullo, J.T.; Kiehl, J. Earth′s Global Energy Budget. Bull. Am. Meteorol. Soc. 2009, 90, 311–323. [Google Scholar] [CrossRef]
  29. Li, Z.-L.; Tang, R.; Wan, Z.; Bi, Y.; Zhou, C.; Tang, B.; Yan, G.; Zhang, X. A Review of Current Methodologies for Regional Evapotranspiration Estimation from Remotely Sensed Data. Sensors 2009, 9, 3801–3853. [Google Scholar] [CrossRef] [PubMed] [Green Version]
  30. Jiang, L.; Islam, S. A Methodology for Estimation of Surface Evapotranspiration over Large Areas Using Remote Sensing Observations. Geophys. Res. Lett. 1999, 26, 2773–2776. [Google Scholar] [CrossRef] [Green Version]
  31. Bastiaanssen, W. SEBAL-Based Sensible and Latent Heat Fluxes in the Irrigated Gediz Basin, Turkey. J. Hydrol. 2000, 229, 87–100. [Google Scholar] [CrossRef]
  32. Su, Z. The Surface Energy Balance System (SEBS) for Estimation of Turbulent Heat Fluxes. Hydrol. Earth Syst. Sci. 2002, 6, 85–100. [Google Scholar] [CrossRef]
  33. Xiong, Y.; Qiu, G.Y. Estimation of Evapotranspiration Using Remotely Sensed Land Surface Temperature and the Revised Three-Temperature Model. Int. J. Remote Sens. 2011, 32, 5853–5874. [Google Scholar] [CrossRef]
  34. Hu, S.; Mo, X. Attribution of Long-Term Evapotranspiration Trends in the Mekong River Basin with a Remote Sensing-Based Process Model. Remote Sens. 2021, 13, 303. [Google Scholar] [CrossRef]
  35. Mekong River Comission. Planning Altas of the Lower Mekong River Basin; Mekong River Comission: Vientiane, Laos, 2013. [Google Scholar]
  36. Baiyinbaoligao. Overview of the Mekong River Basin; Mekong River Comission: Vientiane, Laos, 2020. [Google Scholar]
  37. Meynell, P.J. Wetlands of the Mekong River Basin, an Overview; Springer: Dordrecht, The Netherlands, 2017. [Google Scholar]
  38. Shi, C. Status and Plans of CMA Land Data Assimilation System (CLDAS) Project; EGU General Assembly Conference EGU General Assembly Conference Abstracts; EGU: Munich, Germany, 2014. [Google Scholar]
  39. Mu, Q.; Heinsch, F.A.; Zhao, M.; Running, S.W. Development of a Global Evapotranspiration Algorithm Based on MODIS and Global Meteorology Data. Remote Sens. Environ. 2007, 111, 519–536. [Google Scholar] [CrossRef]
  40. Friedl, M.A.; Sulla-Menashe, D.; Tan, B.; Schneider, A.; Ramankutty, N.; Sibley, A.; Huang, X. MODIS Collection 5 Global Land Cover: Algorithm Refinements and Characterization of New Datasets. Remote Sens. Environ. 2010, 114, 168–182. [Google Scholar] [CrossRef]
  41. Liu, Y.; Hiyama, T.; Yasunari, T.; Tanaka, H. A Nonparametric Approach to Estimating Terrestrial Evaporation: Validation in Eddy Covariance Sites. Agric. For. Meteorol. 2012, 157, 49–59. [Google Scholar] [CrossRef]
  42. Xin, P.; Liu, Y. Spatio-Temporal Variation of Surface Net Radiation over the Yangze River Basin during 1983–2012. Resour. Environ. Yangtze Basin 2016, 25, 486–496. [Google Scholar]
  43. Pan, X.; Liu, Y.; Gan, G.; Fan, X.; Yang, Y. Estimation of Evapotranspiration Using a Nonparametric Approach under All Sky: Accuracy Evaluation and Error Analysis. IEEE J. Sel. Top. Appl. Earth Obs. Remote Sens. 2017, 10, 2528–2539. [Google Scholar] [CrossRef]
  44. Pan, X.; You, C.; Liu, Y.; Shi, C.; Han, S.; Yang, Y.; Hu, J. Evaluation of Satellite-Retrieved Evapotranspiration Based on a Nonparametric Approach over an Arid Region. Int. J. Remote Sens. 2020, 41, 7605–7623. [Google Scholar] [CrossRef]
  45. Moran, M.; Jackson, R.D.; Raymond, L.H.; Gay, L.W.; Slater, P.N. Mapping Surface Energy Balance Components by Combining Landsat Thematic Mapper and Ground-Based Meteorological Data. Remote Sens. Environ. 1989, 30, 77–87. [Google Scholar] [CrossRef]
  46. Rodionov, S.N. A Sequential Method for Detecting Regime Shifts in the Mean and Variance; University of Washington: Seattle, WA, USA, 2005; pp. 68–72. [Google Scholar]
  47. Marty, C. Regime Shift of Snow Days in Switzerland. Geophys. Res. Lett. 2008, 35, 62–77. [Google Scholar] [CrossRef] [Green Version]
  48. Pan, X.; Liu, Y.; Fan, X. Satellite Retrieval of Surface Evapotranspiration with Nonparametric Approach: Accuracy Assessment over a Semiarid Region. Adv. Meteorol. 2016, 2016, 1584316. [Google Scholar] [CrossRef] [Green Version]
  49. Li, M.; Chu, R.; Islam, A.R.M.T.; Shen, S. Characteristics of Surface Evapotranspiration and Its Response to Climate and Land Use and Land Cover in the Huai River Basin of Eastern China. Environ. Sci. Pollut. Res. 2021, 28, 683–699. [Google Scholar] [CrossRef]
  50. Sawano, S.; Hotta, N.; Komatsu, H.; Suzuki, M.; Yayama, T. Evaluation of Evapotranspiration in Forested Areas in the Mekong Basin Using GIS Data Analysis. In Forest Environments in the Mekong River Basin; Sawada, H., Araki, M., Chappell, N.A., LaFrankie, J.V., Shimizu, A., Eds.; Springer: Tokyo, Japan, 2007; pp. 36–44. [Google Scholar] [CrossRef]
  51. Tang, X.; Woodcock, C.E.; Olofsson, P.; Hutyra, L.R. Spatiotemporal Assessment of Land Use/Land Cover Change and Associated Carbon Emissions and Uptake in the Mekong River Basin. Remote Sens. Environ. 2021, 256, 112336. [Google Scholar] [CrossRef]
  52. Liu, J.; Zhang, Q.; Xu, C.; Jin, X. Change of Actual Evapotranspiration of Poyang Lake Watershed and Associated Influencing Factors in the past 50 Years. Resour. Environ. Yangtze Basin 2010, 4, 197–203. [Google Scholar]
  53. Li, X.; Liu, L.; Duan, Z.; Wang, N. Spatio-Temporal Variability in Remotely Sensed Surface Soil Moisture and Its Relationship with Precipitation and Evapotranspiration during the Growing Season in the Loess Plateau, China. Environ. Earth Sci. 2014, 71, 1809–1820. [Google Scholar] [CrossRef]
Figure 1. Study Area: The Lower Mekong River, the countries contained within the basin and national boundary lines.
Remotesensing 14 02609 g001
Figure 2. Comparison of consistency and difference between RS-NP retrieval ET (mm/8-day) and MYD16 ET (mm/8-day).
Remotesensing 14 02609 g002
Figure 3. Overall variation trends of monthly ET and monthly precipitation from 2008 to 2017 with the Rodionov weighted line.
Remotesensing 14 02609 g003
Figure 4. Temporal variation trend of ET. (a) The inter-annual trend of annul ET and precipitation from 2008 to 2017. (b) The rainy season ET and the dry season ET from 2008 to 2017. (c) The monthly trend of ET and precipitation from 2008 to 2017.
Remotesensing 14 02609 g004
Figure 5. (a) Spatial distribution of land use in the Lower Mekong River Basin from 2008 to 2017; (b) Spatial distribution of average ET from 2008 to 2017; (c) Sen + MK trend analysis of spatial and temporal variability of ET in the Lower Mekong River Basin from 2008 to 2017.
Remotesensing 14 02609 g005
Figure 6. The spatial distribution of average annual ET from 2008 to 2017 in the Lower Mekong River basin.
Remotesensing 14 02609 g006
Figure 7. The spatial distribution of average monthly ET from 2008 to 2017 in the Lower Mekong River basin.
Remotesensing 14 02609 g007
Figure 8. Spatial distribution of seasonal ET from 2008 to 2017 (a) Dry season ET; (b) Rainy season ET; (c) Spatial distribution of the ET difference between rainy and dry seasons.
Remotesensing 14 02609 g008
Figure 9. (a) The variation trend of annual ET in different land covers from 2008 to 2017. (b) The average annual ET of different land covers from 2008 to 2017.
Remotesensing 14 02609 g009
Figure 10. Correlation analysis between meteorological factors and annual ET. (a) SRA; (b) Precipitation; (c) TMP.
Remotesensing 14 02609 g010
Figure 11. Correlation analysis between meteorological factors (SRA, precipitation and TMP) and monthly ET in the rainy season and the dry season.
Remotesensing 14 02609 g011
Figure 12. (a) Variation of monthly SRA and monthly ET in forest areas of the Lower Mekong River Basin in multiple years. (b) The effect of SRA on monthly ET in forest areas. Every 30 points in the figure represent the value of SRA and ET of a month, and the shape of those points have been divided into triangle and square to present rainy season and dry season, respectively.
Remotesensing 14 02609 g012
Table 1. Experimental data used in this study, their resolution and purpose.
Data NameParametersTemporal/Spatial
Resolution
Data Types
MYD06Cloud emissivity & Cloud top temperaturedaily/1 kmRemote Sensing
(Retrieval)
MYD09Near-subsolar point reflectance8-day/500 mRemote Sensing
(Retrieval)
MYD11Land surface temperature & emissivity8-day/1 kmRemote sensing
(Retrieval)
MCD12Land cover data1 year/500 mRemote sensing
(Analyze)
CLDASBarometric pressure, Shortwave downwelling radiation, Relative humidity, Temperature1 h/6 kmReanalysis
(Retrieval)
MOD16ET8-day/1 kmRemote Sensing
(Validation)
Table 2. Sen + MK trend description and significance grading used in this study.
Trend TSslope Test   Values   p Significance Classification
T S s l o p e > 0 p 0.5Slight increase
p < 0.5Significant increase
T S s l o p e < 0 p 0.5Slight increase
p < 0.5Significant increase
Table 3. Comparison of land use change and the net change rate in the basin in 2008 and 2017.
2017
(km2)
2008 (km2)Total
GrasslandsUrbanForestCroplandsSavannasWetlandsWater Area
Grasslands40,123.130.004287.443316.0111,596.82326.9513.19591,715.91
Urban lands29.842743.940.0062.4426.300.480.002863.00
Forest lands568.820.00185,323.80200.6511,340.4353.550.94197,506.18
Croplands11,706.400.00191.50188,725.734575.23117.810.95205,318.32
Savannas8291.590.0029,425.925062.51119,151.95141.890.00162,076.53
Wetlands427.630.00142.70247.9349.6410,481.78137.7012,077.79
Water area56.630.0085.428.0979.0425.205886.546145.77
Total61,258.902743.94219,457.69197,264.95147,124.7611,177.076041.42
Net increase or decrease−1543.09119.06−21,951.518053.3714,951.77900.72104.75
Publisher’s Note: MDPI stays neutral with regard to jurisdictional claims in published maps and institutional affiliations.

