Abstract
Salinity systems are well known as extreme environmental systems that occur either naturally or by certain human activities, in arid and semiarid regions, which may harm crop production. Soil salinity identification is essential for soil management and reclamation projects. Information derived from space data acquisition systems (e.g., Landsat, ASTER) is considered as one of the most rapid techniques in mapping Salt-Affected Soil (SAfSoil). The current study tested the previously proposed salinity indices on the northern Nile Delta region, Egypt. The results indicated that most of the indices were not suitable to detect the SAfSoil in the area, due to the interaction between the bare soils, salts, and urbanization. To resolve this issue, the current work suggested a new index for detecting and monitoring the SAfSoil in the Nile Delta region. The newly proposed index takes into consideration plant health, the salt crust at the surface of the soils, as well as urbanization. It facilitates the mapping processes of SAfSoil in the area compared to any other previously proposed index. In this respect, multi-temporal Landsat-7 and 8 satellite data, acquired in 2002, 2016, and 2021, were used. The new index was prepared using the 2002 data and verified using the 2016 and 2021 data. Field measurements and data collected during 2002, 2016, and 2021 were utilized as ground truth data to assess the accuracy of the results obtained from the proposed index. The evaluation of the results indicated that the accuracy assessment for 2002, 2016, and 2021 images was 94.58, 96.08, and 95.68%, respectively. Finally, the effectiveness of using remote sensing in detecting and mapping SAfSoil is outlined.
1. Introduction
Soil salinity is a primary land degradation process that reduces biological production in arid and semi-arid climates, requiring comprehensive monitoring and management. Recent advances in remote sensing technology allowed soil salinity to be recognized and monitored reliably [1,2,3]. Soil salinity is known as a dynamic process, which arises as a result of natural processes and human activities, particularly in arid and semi-arid environments as a result of insufficient rainfall, an excessive evaporation of shallow groundwater, and a highly soluble concentration of salt [3,4]. Salinity alters the chemical and physical properties of soils, which results in a considerable reduction in crop productivity [5,6,7].
Saline soils are defined by the USA Salinity Laboratory Staff [8] as a soil with an electrical conductivity (EC) value > 4 (dS m−1), pH < 8.5, and exchangeable sodium percentage (ESP) < 15. An increase in soil salinity affects both soil and water quality [9,10,11,12], which, in turn, affects plant growth, production, and may eventually leads to soil deterioration [13,14,15,16,17,18]. Soil salinity is usually evaluated by collecting soil samples and measuring electrical conductivity in the laboratory. This method is well-known to be time-consuming and expensive due to the number of samples required to understand the spatial variability in the soil salinity for a given area [19,20,21,22,23,24]. The high geographic variability of soil salinity over short distances necessitates the collection of multiple soil samples, which results in such an expensive and time-consuming process. Remote sensing technologies, when compared to traditional approaches, provide considerable cost-effective advantages in detecting soil salinity for vast regions with high precision [1,21,25].
Satellite images, along with advanced processing techniques, provide a better tool in detecting and mapping soil salinity due to the spectral demeanor of the salt lineaments on the Earth’s surface, which is a reasonable indicator for assigning salinity [24,26,27,28,29,30]. It is important to keep in mind that many factors influence soil spectral reflectance, e.g., the soil physicochemical properties (i.e., wetness or moisture-content, organic matter (OM), texture, clay content, and/or types and degree of surface roughness) [30,31,32,33,34], the salt crust being mixed with other soil constituents, or being invisible beneath them [35,36]. Thus, it is sometimes challenging to predict soil salinity from reflectance [37]. Consequently, several studies used vegetation cover (plant health) as an indicator for soil salinity to avoid soil reflectance complications [22]. Scattered (sparse) vegetation on the soil surface, which can function as a sign of high salinity, have also been used as an essential indicator to identify pieces of land affected by salinity using flower reflectance [38]. Additionally, the photosynthetic characteristics of unhealthy vegetation can boost the reflectance of visible light and reduce reflectance from the Near Infra-Red (NIR) range [39]. This behavior has been recognized in various plants, which undergo salinity fatigue [29]. Several Vegetation Indices (VIs), such as the Normalized Difference Vegetation Index (NDVI) and Soil-Adjusted Vegetation Index (SAVI), were also exploited as main indicators for estimating soil salinity [40,41,42]. Moreover, numerous scientists have developed and used other sophisticated salinity indices along with the Normalized Difference Salinity Index (NDSI) and Salinity Index (SI) [36].
Several authors used remote sensing data analysis to investigate the soil salinity at different locations by investigating the spectral properties of the saline soils in visible (VIS) and infrared (IR) wavelengths [21,37,38,39]. Their primary method was mainly to create regression models between ground sample locations and remote sensing datasets. Three approaches have mainly been used to map the soil salinity: (1) model development between reflection values of spectral bands in satellite images and measured soil salinity values [37,40], (2) directly estimating soil salinity by calculating salinity indices [21,39,40], and (3) indirectly estimating soil salinity by calculating vegetation indices [21,41,42].
Due to the unique reflection of electromagnetic energy from salt crusts on the soil surface, soil salinity is detected and monitored at numerous scales using remote sensing technologies [4,39]. However, some factors such as soil texture, moisture, organic matter, and iron oxide content [43], as well as vegetation type and development period [44], interfere with the energy reflected or adsorbed from saline soils under natural conditions, reducing the success of remote sensing in determining surface salinity. Furthermore, the resolution of remote sensing images has a substantial impact on the efficacy of remote sensing-based soil salinity determination [45,46,47]. Nonetheless, various authors claimed that employing remote sensing techniques to determine soil salinity has several advantages [1,4,39]. This viewpoint is widely acknowledged as a low-cost soil salinity monitoring tool, particularly in basins with insufficient drainage [48]. However, developments in remote sensing technology have yet to produce an optimum data type and interrogation method combination for assessing soil salinity under a variety of ambient situations [49,50].
The severity and quantity of soil salinity may be completely assessed, primarily based on the high correlations between the EC and the NDVI values of both the sugar-cane and cotton crops [51,52,53,54,55,56]. Visible salt features on the soil surface can be directly detected via remote sensing sensors [48,49,50,51,52,53,54,55,56,57], while salt-tolerant crops (halophytic plants) are indirect indicators used to identify salt-affected soil [41,46,58,59,60].
Multi and hyperspectral images have been previously used in soil salinity mapping, but the results obtained from these studies were mixed [36]. Consequently, researchers interested in the prediction and delineating of soil salinity usually accompanied their research with the indices of flora, i.e., NDVI, SAVI, Radar Vegetation Index (RVI), Salt Balance Index (SBI), Green Vegetation Index (GVI), and Humidity Index (WI) [41,45,46,57,60,61,62]. In the Landsat image, a significant relationship was revealed between the reflectance in the blue, green, red, and near-infrared bands, and the EC values, as well as brightness (BI) and Humidity (WI) indices [63,64,65].
Kafr El-Sheikh Governorate is located in the far north of Egypt. The entire area is located in the north of the Nile Delta and overlooks the Mediterranean Sea with a coastal extension of 100 km in length and is bordered to the west by the Rashid branch with a length of 85 km until its mouth in the Mediterranean Sea. The land cover/land use of the region varies between plants, sabkhas, urban areas, and water bodies [66]. This diversity and its intensity affect the ability of remote sensing data to identify saline soils. With reference to the area landscape and its geology structure, the soils consist of alluvial plain (flood plain), coastal plain (marine plain), and lacustrine deposits (mixed of flood plain and marine plain) [17]. The saline soils refer to lands with inherited salts, while the salt-affected soils refer to acquired salts formed by nature, climate, and human activity. The current research proposes a Soil Salinity Index for arid and semi-arid conditions (SIA), which is tested along the northern Nile Delta region, Egypt, where different levels of soil salinities have been recorded. Landsat Thematic Mapper (TM) imagery is used in the development process of the SSI, which relies on: (1) NDVI, to extract flora fraction, WI, to extract the waterlogging, and the alkalinity index to extract the alkalinity; and (2) examination of the relationships between the direct and indirect indicators in relation to their variation in the saline soil.
2. Materials and Methods
Study area: Kafr El-Sheikh Governorate is one of the north Nile Delta governorates of Egypt. It is located between longitudes 30°20′5″ and 31°20′10″ East, and latitudes 30°50′35″ and 31°55′32″ North, with a total area of 377,798 ha (Figure 1). It is characterized by imperfect to well-drained soil as it was formed within the alluvium of the Nile delta, which has been deposited in semiarid climates [66]. The hydrology of the area is affected by both the River Nile irrigation canals, and the seepage from the Mediterranean Seawater, but overall, the groundwater quality of the area is mostly good [66,67,68].

Figure 1.
Location of Kafr El-Sheikh Governorate area and land use/land cover units.
The area slopes gently to very gently toward the north. It has a semi-arid climate and receives a total annual rainfall of about 72.44 mm, which spreads mostly along 6 months/year. The annual mean and total evaporations are 89.76 and 1077.08 mm, respectively. The maximum and minimum mean annual temperatures are about 32.3 °C and 18.7 °C, respectively. The annual mean relative humidity is about 56.78%. Additionally, the annual mean wind speed is about 3.9 km h−1 [17].
The main economic activity is agriculture and fishing. The governorate is considered an agricultural area. It is famous for the cultivation of rice, beets, cotton, and wheat. It is distinguished by its industrial activity, as it manufactures dairy, oils, soap, fodder, rice, gin, and beet sugar, in addition to the spread of many fish farms [66].
The natural environments in the region can be classified into three main types: agricultural and urban environments, coastal environments, and wetlands. The center and south of the province cover the sediments of the modern geological age (the Holocene era), which are dark brown formations composed of deposits of clay and sandy clay. These sediments are deposited over the ancient marine sediments (under-delta formations) that date back to the Pleistocene era. They are yellow in color and consist of coarse and fine sand and pebbles consisting of quartz or igneous and metamorphic rocks. As for the northern coastal zone, it is a low sandy coast consisting of soft brittle sediments belonging to the Pleistocene and Holocene periods.
Based on climatic reports collected during 2005–2015, the area was characterized by the following (High Temp: 34 °C, Low Temp: 9 °C, Mean Temp: 22 °C, Precipitation: 4.2 mm, Humidity: 63%, and Wind: 11 km h−1). It could be concluded that Hottest Month was August (29 °C), Coldest Month was January (14 °C), Wettest Month was November (11.9 mm), Windiest Month was July (13 km h−1), and Annual Precipitation was 50.6 mm (per year) Figure 2 [69].
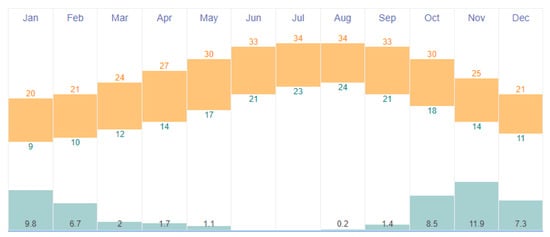
Figure 2.
Historic climate data from 2005 to 2015 of Kafr El-Sheikh Governorate area.
The 2016 and 2021 soil samples were air-dried, softly crushed, sieved through a 2 mm sieve, and stored for analysis. Soil parameters were determined in triplicate in accordance with SSSA-Methods of Soil Analysis: Part 3 Chemical Methods, 5.3 (1996) https://acsess.onlinelibrary.wiley.com/doi/book/10.2136/sssabookser5.3 (accessed on 25 May 2022). A Perkin Elmer PinAAcle 500 Flame Atomic Absorption Spectrometer was used. EC was determined using soil saturated water extract according to the methods of USDA [70].
Statistical information about the resulting soil samples used to verify the proposed indicators is presented in Table 1.

Table 1.
Analysis of soil samples used to verify the results of the proposed Index.
Richard’s criteria were used to classify the saline and sodic soils as follows: Saline Soil with EC > 4.0 dS m−1, pH < 8.5, and ESP < 15 or SAR < 13. Alkaline (Sodic) Soil has EC < 4.0 dS m−1, pH > 8.5, and ESP > 15 or SAR > 13. Saline-Alkaline (sodic) Soil has EC > 4.0 dS m−1, pH < 8.5, and ESP > 15 or SAR > 13 [8].
In order to quantitatively measure land surface salinity, a set of multi-temporal Landsat images, digital topographic (scale of 1: 25,000), geologic, and hydrologic maps were exploited to obtain an accurate soil classification map. The multi-temporal Landsat-7 and 8 images were acquired in 2002, 2016, and 2021, respectively, with both atmospheric and radiometric corrections applied. Periodic noise was automatically removed using the Fast Fourier transform (FFT) method. The satellite overpasses as well as the path/row for the Landsat images were, respectively, as follows: (LE07_L1TP_177038_20020617_20200916_02_T1, LC08_L1TP_177038_20160818_20200906_02_T1, and LC08_L1TP_177038_20210731_20210804_01_T1) (Table 2).

Table 2.
List of the satellites used, the types of sensors captured, and their bandwidths. The imagery was taken from https://www.usgs.gov (accessed on 30 June 2021). The imagery was processed and analyzed using ENVI 5.1.
In the initial analysis of the current study, the indices of Khan et al. [71], Farifteh [72], Setia et al. [73], and Dehni and Lounis [74] (Table 3) were selected, respectively, to check their ability in mapping the SAfSoil in the area. A mask was applied to the vicinity of Kafr El-Sheikh Governorate (Figure 1), as well as the Borollus Lake, to maximize the delineation accuracy of SSI, as well as enhance the extraction process of urban areas. Initial results were acquired using the integration between the Normalized difference built-up index (NDBI), supervised classification, and visual interpretation where urban areas were subtracted from SAfSoil. The soil salinity layer was then extracted using the previously published indices (Table 3). Finally, SAfSoil distribution was verified against the map produced from the geostatistical techniques of the collected soil samples. All the previously extracted layers were then combined to produce the final land-cover map of the area (Figure 3).

Table 3.
Salinity indices as proposed by different authors (where R = Red, G = Green, B = Blue, NIR = Near-Infrared, and SI = Salinity Index).
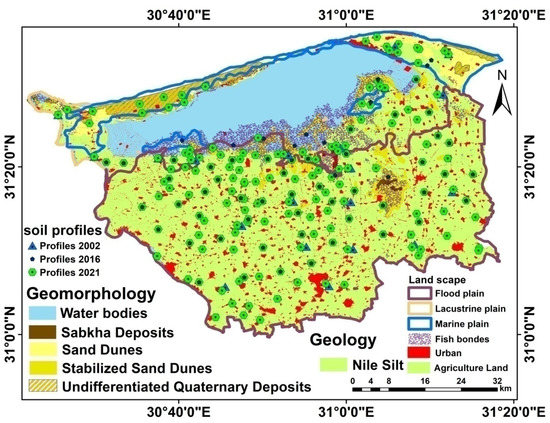
Figure 3.
Soil profile location and land use land cover, geomorphology, geology, and landscape of the area.
Thematic maps for the soil salinity were developed using ArcGIS 10.5 software. Thematic maps of the study area were generated using Inverse Distance Weighted (IDW) interpolation as recommended by AbdelRahman et al. [75] and Yao [76]. IDW interpolation determines cell values using a linearly weighted combination of a set of sample points.
The following equation was used for IDW interpolation methods as well-discussed by Yao et al. [58]
where the Z(xi) data value of locations is used to generate the variable Z value of x0 at the unsampled location, the Z(xi) value is assigned by the weight wi, and n is the number of closest neighboring data points used for estimation.
where di is the distance between the estimated point and the observed point.
where xi and xi + h are sampling locations separated by a distance h, and Z(xi) and Z(xi + h) are the observed values of variable Z at the corresponding locations.
The least squares method that was used to estimate the linear regression is the following equation:
After AbdelRahman [66], the research area was divided into three categories (flood plain, lacustrine deposits, and coastal plain). Geomorphology and geology are depicted in Figure 3:
- Nile silt covers the most land, consisting of fine-grained sediment (silt and clay) deposited on a flood plain by floodwaters that cannot be confined inside the stream channel.
- Quaternary marine deposits (such as carbon deposits and gypsum metal) are found on lower sections of the existing land surface, and terrestrial deposits are found on higher parts of the present sea floor.
- Sabkha deposits, which are flat and extremely saline patches of sand or silt lying slightly above the water table and typically having soft nodules and enterolithic veins of gypsum or anhydrite, are salt-flat soils.
- Sand dunes are wind-created sand ridges that can be seen in deserts or near lakes and oceans.
- Wind-stabilized dunes migrate inward from the lake. Movement is halted if the sand dune is stabilized by vegetation, such as this dune slope.
Results obtained from these indices (Table 3) were carefully examined as they were not efficient in detecting the SAfSoil in the area, as they were either inconclusive or there was a major overlap between the SAfSoil and other classes in the area (e.g., urban areas, waterlogging).
According to Richard’s criteria, the major predominant soil types in the area are Nonsaline-nonalkaline soil with area is about 65%, whereas saline soil is about 7%, while alkaline soil is about 4% whilst saline-alkaline soil is about 5% of the total area. Soils are alluvial due to silt deposits (clayey) resulting from the flow of the Nile River. In this region, diverse soil types are observed, which also vary in their production potential. In general, these soils have been described as a complex of salinity ranges in the topographic units and overlapped with the results of the approached index. On the basis of texture, they are categorized into two ranges: light (coarse textured) soils in the north of Borollus lake along the coastal shoreline and heavy soils (clayey black types) in the rest of the area. Therefore, the laboratories soil analyses help in the delineation of saline, sodic, and Saline-Alkaline (sodic) Soils. Accordingly, it is possible to identify nonsaline or alkaline areas. These are the boundaries that were compared with the areas obtained from the new proposal, and the accuracy of the results was measured, which are shown in the tables (5, 6 and 7) discussed later.
During field work, stressed vegetation was used as an indirect sign for the presence of salt in the soils, where salt-affected soils are usually characterized by poorly vegetated areas. The selected remote sensing indices were used to discriminate and map salt-affected soils. Salinity index was the best combined ratio of selected bands to compute the targeted areas.
Detailed examination of Landsat data shows that the maximum and minimum observed wavelength values of SAfSoil ranged between 10.5 and 12.5, and 0.76 and 0.90 μm, respectively, while the urban areas maximum and minimum wavelength were well represented in the ranges between 2.08 and 2.35, and 10.5 and 12.5 μm, respectively. These observations were used to produce much-suitable SAfSoil indices for the study area. Additionally, the study area is mostly covered with vegetation, water lakes, and waterlogging locations, which means involving other indices for vegetation and water is essential for the good separation between the different classes in the area. The current proposed new indices take into account the enhancement for both vegetation and water following the indices of Deering and Rouse [77], and Mcfeeters [78], respectively (Table 4). NDWI and NDVI were used to distinguish vegetation from urban areas. After that, both features were used as a comparison with the new index, taking into account the improvements achieved compared to the old indices, thus ensuring that the results obtained are not affected by unfavorable categories.

Table 4.
Vegetation and water indices as proposed by different authors (where R = Red, NIR = Near-Infrared, SWIR = Shortwave-Infrared, NDVI = Normalized difference vegetation index, and NDWI = Normalized difference water index).
2.1. Data Processing
Before developing the proposed soil salinity index SIA, the soil samples collected were analyzed to make an interpolation as representative as possible of the salinization process. The analysis of the variability and spatial structure of these data was performed under Arc GIS (Spatial Analyst). This module, which integrates the IDW (inverse distance weighting) interpolation method, offers the possibility to analyze the spatial variability in the data. This algorithm was used to interpolate the 2002, 2016, and 2021 soil data, including sodium adsorption ratio (SAR) and soil electrical conductivity (EC). Several studies have recommended this interpolation procedure as it allows reliable results according to AbdelRahman [68]. Landsat data were used to develop the land cover map following the approach mentioned in AbdelRahman [75]. Finally, the factorial thematic maps produced were overlaid in a GIS environment to evaluate the SIA map.
2.2. Atmospheric Correction
The initial image processing investigation was to perform atmospheric correction for the Landsat data. The atmospheric correction algorithm was effectively and successfully used in soil salinity studies, particularly in arid and semi-arid environments. Once the atmospheric correction process was finalized, the Landsat digital number values (DN) were converted into their corresponding ground surface reflectance values. Using the field-measured GPS, the location of each soil sampling location was identified in the satellite images and their corresponding spectral reflectance values were extracted. The field GPS receiver had a locational accuracy of + or − a meter. It is worth noting here that only the spectral reflectance values of the selected Landsat bands were used in this study.
2.3. Index Development
To identify and observe how the saline soil’s spectral reflectance differs from nonsaline soils, it was necessary to plot the spectral reflectance of various levels of soil salinities. This is believed to aid in the process of developing a soil salinity index particularly suited for the study area.
All soils, with their varying levels of salinities, peaked in their reflectance at the short-wave infrared reflectance band. Saline soils had higher reflectance values within the visible and blue*red/green parts of the spectrum in comparison to nonsaline soils. This was likely due to the high intensity of reflectance from such surfaces, particularly due to the whitish color of salt covering a saline pixel within the study area. The saline soil’s reflectance at this band was extremely low in comparison to nonsaline soils, suggesting strong absorption. The close-up of saline and nonsaline soils’ reflectance in the Red*NIR/Green regions and demonstrated this further.
While both saline and nonsaline soils all had varying degrees of response in the Blue − Red/Blue + Red regions, it appeared that a key difference between the two was within the Blue − Red/Blue + Red regions. One key noticeable difference in the spectral reflectance between saline and nonsaline soils was within the three parts’ combinations of all bands. For this, the study developed a SIA, which took into account this difference in spectral response.
It should be expected that this index would be significantly higher than unity in its magnitude for saline soils and quite low in magnitude for nonsaline soils. High-salinity soils will portray higher values for the term equation part1–part3 and lower values for part 2, leading to index values higher than unity. To assess the accuracy of this index in estimating soil salinity, it is imperative to compare it with some of the widely used salinity indices such as those mentioned in Table 3.
The proposed index relies mostly on the visible and NIR portion of the electromagnetic spectrum, as illustrated below:
The proposed index used three parts of the equation, where the first part used blue, red, and green bands, as illustrated in Figure 4, Figure 5 and Figure 6.
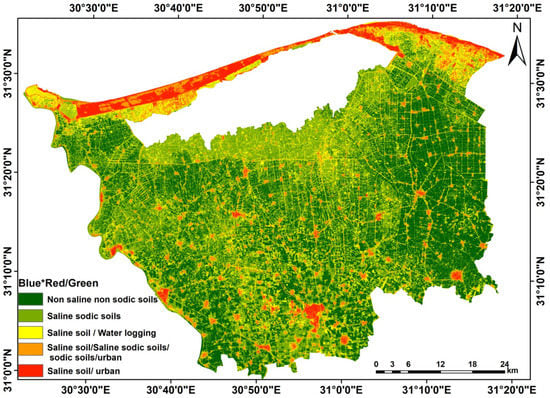
Figure 4.
1st part of the equation (Blue * Red/Green) applied on 2021.
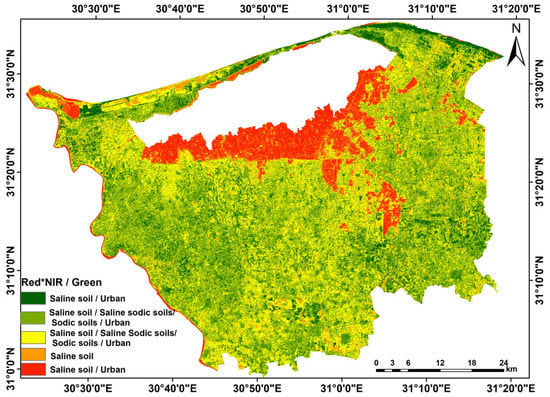
Figure 5.
2nd part of the equation (Red * NIR/Green) applied on 2021.
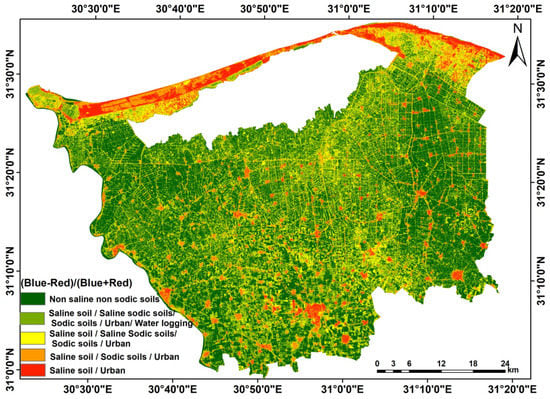
Figure 6.
3rd part of the equation (Blue − Red/Blue + Red) applied on 2021.
This part of the equation illustrates the highly saline soils (>4 dS m−1) in an accurate way, but, unfortunately, there was an overlap between highly saline soils in red (at the sand beach of the shoreline) and dense urban areas, while it succeeded in extracting the saline sodic soils, presented in light green along with the waterlogged areas. Furthermore, the model succeeded in recognizing the saline soils with high accuracy, but there was an overlap with waterlogged, dry sabkhas, and low-density urban areas (in yellow). The model observed the nonsaline and nonsodic areas in high accuracy (dark green).
For the second part of the equation, as shown in Figure 5, the model succeeded in recognizing the waterlogged, fish farms, and dry sabkhas in an accurate way in red. In addition, for the highly saline and highly sodic areas that are presented in orange, the model succeeded in configuring slightly to moderately saline, moderately sodic soils (yellow color), while the light green color was nonsaline-nonsodic soils, and the dark green color indicated the saline highly sodic soils, but it overlapped with dense urban areas.
For the third part of the model, as seen in Figure 6, the model succeeded in recognizing the highly saline highly sodic soils but with an overlap with the dense urban areas (red color). While the orange color illustrated slightly saline highly sodic soils, the yellow color illustrated the saline sodic soils with sabkhas. The light green color illustrated the saline sodic soils mixed with fishponds, and the dark green color demonstrated nonsaline-nonsodic soils.
The image resulting from the proposed indices was tested using the satellite image and field data obtained during 2002. The validation of the indices was carried out using the field data collected during 2016 and 2021 from different key locations in the area. The field data of 2016 and 2021 comprised 20 to 60 samples and GPS locations from the five different classes we used. The suggested formula of Congalton and Green [79] was used to calculate the Kappa coefficient and estimate the overall accuracy of our results. A flowchart showed the main steps of the study work, illustrated in Figure 7.
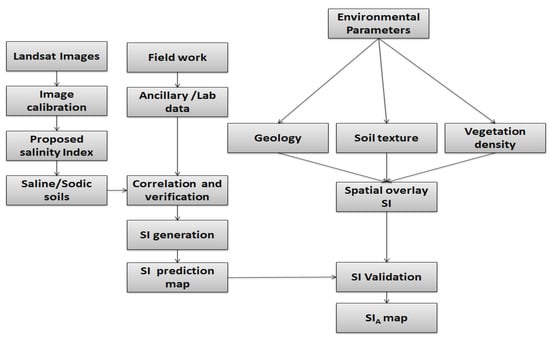
Figure 7.
Flowchart showing the main steps of the study.
2.4. Empirical Models Development
Statistical and mathematical models were developed to model vegetation canopies, soil moisture, and soil salinity. Research in this area has resulted in considerable improvements in estimating soil salinity, its spatial distribution, and the interaction between electromagnetic radiation and saline soils. In an attempt to develop a new empirical model, the SIA values for the field soil sampling locations were regressed with the lab-estimated salinity EC measurements. Various regression models were developed, including linear and logarithmic; however, the exponential relation portrayed the highest R-square values. The exponential relation is ideal with soil salinity indices due to their low saturation levels. The developed semi-empirical models were later applied for the Landsat for generating soil salinity and soil salinity class maps.
3. Results and Discussion
Results obtained from the indices [71,72,73,74] (Table 3) were not successful in mapping the SAfSoil in the study area (Figure 5, Figure 7, Figure 8 and Figure 9 ). The indices of Khan et al. [71] and Farifteh [72] (Table 3) failed to separate between the different types of soil degradation (e.g., waterlogging, saline soil, and SAfSoil). It also failed to separate between the SAfSoil and the soil sealing. Its ability for water bodies extraction was also limited (Figure 8 and Figure 9). There was also a considerable overlap between the SAfSoil and the urban areas. On the other hand, the indices of Setia et al. [73] and Dehni and Lounis [74] (Table 3) were inconclusive where the different classes were mostly indistinguishable (Figure 10 and Figure 11).
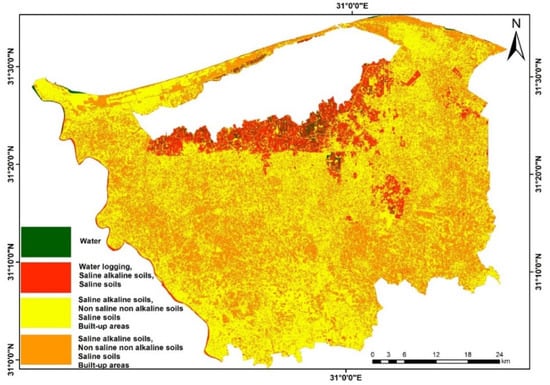
Figure 8.
A 2002 map showing the SAfSoil results from the indices of Khan et al. [71].
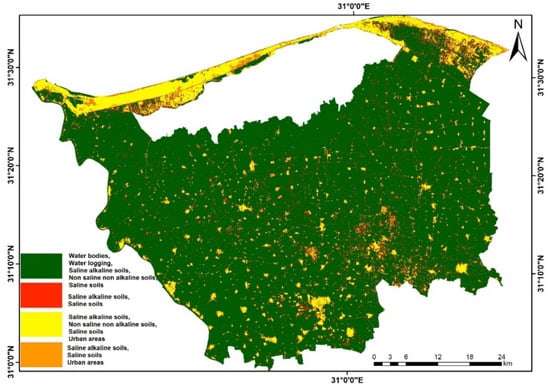
Figure 9.
A 2002 map showing the SAfSoil results from the indices of Farifteh [72].
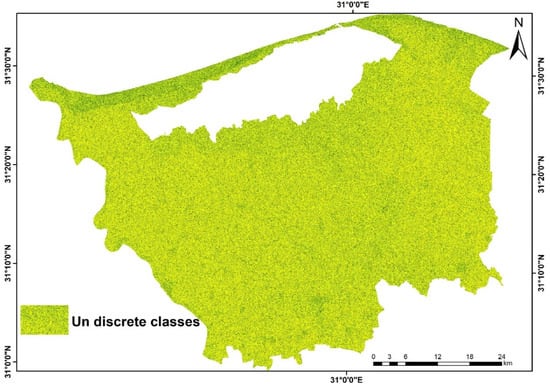
Figure 10.
A 2002 map showing the SAfSoil results from the indices of Setia et al. [73].
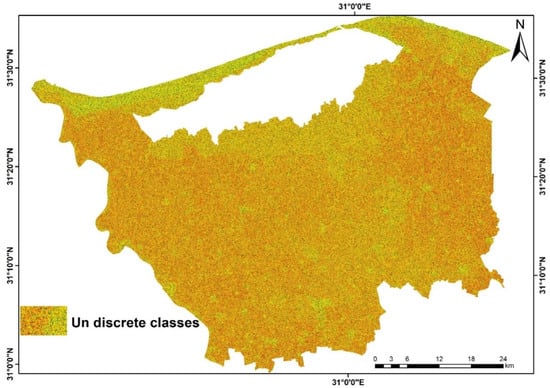
Figure 11.
A 2002 map showing the SAfSoil results from the indices of Dehni and Lounis [74].
Results from our proposed indices to an image acquired in 2002 (Figure 12) clearly separated the SAfSoil in the study area. It was able to distinguish between the saline and nonsaline soil, as well as urban areas and waterlogging locations. These results were verified using data collected during fieldwork conducted during the same year of 2002. While applying the proposed index, five classes were extracted, namely: waterlogging, saline-alkaline soil, nonsaline nonalkaline soil, urban areas, and saline soils. The classification accuracy assessment was 97.8% with a kappa coefficient of 0.88 (Table 5).
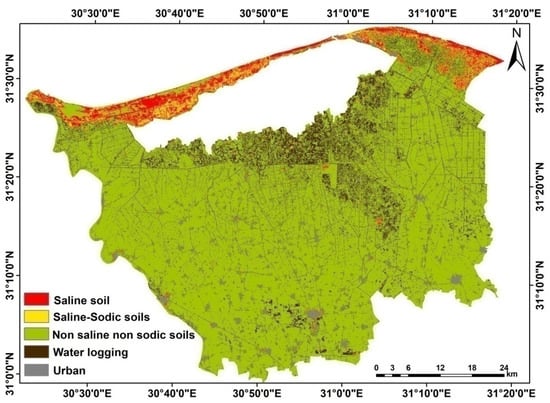
Figure 12.
A 2002 map showing the salt-affected soils in the study area.

Table 5.
Accuracy assessment using error matrix in 2002 based on soil survey of 20 soil profiles.
To further assess the accuracy of the results, the analysis was performed on satellite data acquired during 2016 and 2021 with a time span of 10 years between the two datasets, so we can better see the changes. Field visits to some key sites were carried out to collect sufficient field data for the validation of the results. The results were also compared with those obtained from 2002 to see if the changes were consistent. The classified images with the same five classes are listed in Figure 13 and Figure 14 for the years 2016 and 2021, respectively, with the tables showing the results from their accuracy assessment listed in Table 6 and Table 7, respectively.
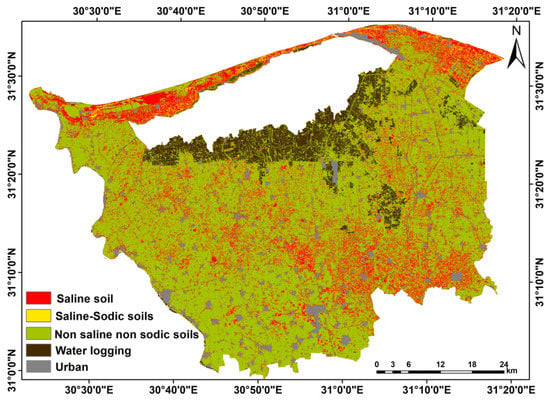
Figure 13.
A 2016 map showing the salt-affected soils in the study area.
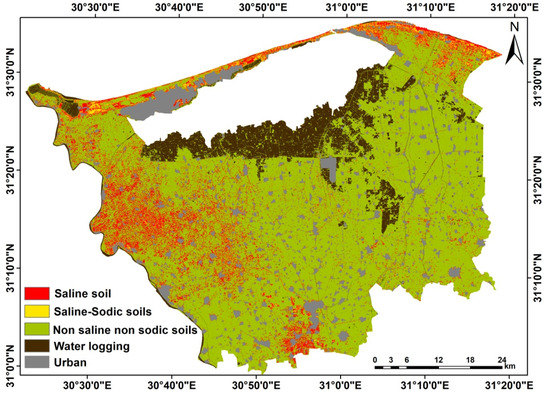
Figure 14.
A 2021 map showing the salt-affected soils in the study area.

Table 6.
Accuracy assessment using error matrix in 2016 based on soil survey of 20 soil profiles.

Table 7.
Accuracy assessment using error matrix in 2021 based on soil survey of 20 soil profiles.
Looking at the classification results for 2002, 2016, and 2021, we can easily see how the different classes changed with time (Table 8). The waterlogging class represented 7.5%, 8.4%, and 9.9% of the total area for the years 2002, 2016, and 2021, respectively, showing a clear increase over time. This can be attributed to the intensive agricultural practices, as well as the misuse of irrigation water in the area. The saline soils classes represented 4.1%, 5.2%, and 7% of the total area for the years 2002, 2016, and 2021, respectively, showing a clear increase over time as well. This can be clearly observed by the large patch of salt-affected area located along the shoreline of the Mediterranean Sea and at the southern boundary of Borollus Lake. The saline-alkaline soils represented 3.8%, 2.8%, and 0.7% of the total area for the years 2002, 2016, and 2021, respectively, while the nonsaline nonalkaline class represented 67.3%, 65.6%, and 64.5% of the total area for the years 2002, 2016, and 2021, respectively, showing a clear decrease over time. Lastly, the urban areas represented 4.1%, 5.3%, and 5.9% of the total area for the years 2002, 2016, and 2021, respectively.

Table 8.
Output classes from the proposed SI.
According to Madani [80], examining the Landsat images, it was found that saline soils had a high spectral reflectance in the red and NIR bands and seemed to have a bright image signature. Salinity prediction models were created using these factors to infer soil salinity across a vast region. In contrast, Mehrjardi [81] discovered that band 3 (red band) had the strongest association with EC among the Landsat ETM+ bands 1–5 and 7, and that a regression model built to tie EC to band 3 and the exponential relation was determined to be the best kind of model based on that finding. Salinity and sodicity may arise for a variety of causes, including geological formation or human and climate change effect. For the observation of soil salinity and sodicity model, ground water level, landform, land management type, soil texture, and land cover were employed. The utilization of Landsat ETM+ data of the research region indicated bare patches with a high reflectance owing to high salinity and/or salt-efflorescence on the soil surface, according to our findings, also in agreement with the finding of Abbas and Khan [82]. Elnaggar and Noller [65] observed that salt-affected soils with salt encrustation at the surface were smoother than nonsaline surfaces and had a high reflectivity in the visible and near-infrared bands. They also discovered that in Landsat bands 1, 2, 3, and 4, there was a substantial link between EC values and reflectance.
In soil salinity research, the thermal band has shown to be an effective technique. It plays an important role in distinguishing saline soils, particularly in locations where there is bare soil or scant vegetation. Verma et al. [64], for example, proved that adding the Landsat TM thermal band to the visible-NIR bands helps address spectral similarity difficulties with saline soils. The thermal band was also employed to distinguish between salt- and sodium-affected soils. Metternicht and Zinck [83] discovered that including the thermal band improved salt and sodium detection. Furthermore, AlaviPanah and Goossens [84] discovered that adding the thermal band to the best Landsat TM visible-NIR band combination has excellent promise for distinguishing saline soil from gypsiferous soil in an Iranian case study. This research corroborated the findings of Goossens et al. [85] who found that the TM thermal band plays a critical role in distinguishing gypsiferous from salty soils. Furthermore, Furby et al. [86] claimed that multispectral satellite sensors confounded reflectance because nonsaline soils were mistaken with bare, excessively saline places. It was found that Landsat’s spectral resolution was inadequate as the difference between the spectra of salty land and wet land was not sufficient to enable spectral separation [87], as well as the fluctuating spectral response of saline soil [88]. The proposed index illustrated a high correlation with the measured EC and ESP in the lab with an accuracy of 96%, which is not in agreement with Bannari et al. [89], who presented three alternative salinity indices, SI-1, SI-2, and SI-3, based on the EO-1 ALI spectral bands, to distinguish between modest and moderate soil salinity and sodicity in Morocco. Despite the fact that SI-3 had the greatest correlation (46.9%), the data from this index were insufficient to offer exact information. As a result, they created two more soil salinity and sodicity indices. Their findings showed that these SSSI indices were likely to improve the identification accuracy in low- and medium-salinity regions as they had the highest correlation (52.9%) with ground EC measurements. To measure soil salinity in Pakistan, Abbas and Khan [82] proposed an integrated technique based on geographical analysis of both ground and satellite data. To identify soil salinity, remote sensing data-based salinity indices and a Principal Component Analysis (PCA) were created. Their findings revealed that, when compared to ground data, S3 offered the most promising outcome of the six salinity indices.
The SIA model outperformed all other salinity indices models and showed the highest R-square (0.90) relationship between the EC salinity measures and the SIA in 2021. While the model showed and R-square value of 0.88 for the data of year 2016 followed by value of 0.83 for 2002.
4. Conclusions
The identification of the spatial extent of SAfSoil is a very important task for crop manufacturing. This drove many authors to develop efficient remote sensing algorithms (indices) to map this type of soil (e.g., [71,72,73,74]). Results of mapping of the SAfSoil using the previously proposed indices were not conclusive when applied to the study area in the northern Nile Delta region, Egypt. The current study proposed a new SAfSoil index, which took into account different parameters (e.g., vegetation and water saturation). The proposed index, on the other hand, was very successful in delineating the SAfSoil as well as nonsaline soil and waterlogging in the study area. The newly proposed SAfSoil index was tested using Landsat-7 and Landsat-8 data acquired in 2002, 2016, and 2021, providing near accurate results. These results were verified using field measurements performed during the same time frames of the images.
The newly developed SAfSoil index (SIA) achieved a much greater result when compared to the previously published indices. It can also be used worldwide in locations of similar environments.
Author Contributions
Conceptualization, M.A.E.A., A.A.A., S.S.G. and A.S.; methodology, M.A.E.A. and A.S.; software, M.A.E.A., P.D., A.A.A. and S.S.G.; validation, M.A.E.A., A.A.A., P.D. and S.S.G.; formal analysis, M.A.E.A., A.A.A. and A.S.; investigation, M.A.E.A., A.A.A. and S.S.G.; resources, M.A.E.A., A.A.A. and S.S.G.; data curation, M.A.E.A., P.D., A.A.A. and S.S.G.; writing—original draft preparation, M.A.E.A., P.D., A.A.A., S.S.G. and A.S.; writing—review and editing, M.A.E.A., P.D., A.A.A., S.S.G. and A.S.; visualization, M.A.E.A., P.D., A.A.A., S.S.G. and A.S.; supervision, M.A.E.A., P.D., A.A.A., S.S.G. and A.S.; project administration, M.A.E.A., P.D., A.A.A., S.S.G. and A.S.; funding acquisition, M.A.E.A., P.D., A.A.A., S.S.G. and A.S. All authors have read and agreed to the published version of the manuscript.
Funding
This research received no external funding.
Institutional Review Board Statement
Not applicable.
Informed Consent Statement
Not applicable.
Data Availability Statement
The data used to support the results of this research are available on request from the corresponding.
Acknowledgments
The manuscript presents a participation between the scientific institutions in two countries (Egypt and Italy), and in particular, the authors are grateful for their support in carrying out the work to: (1) National Authority for Remote Sensing and Space Sciences (NARSS), Cairo 11769, Egypt. (2) National Research Centre, Giza 12622, Egypt. (3) Regione Basilicata-Italy. Programma di Sviluppo Rurale (Mis 124—Innovative tillage: Macchine e tecnologie innovative per lo sviluppo dell’agricoltura conservativa nei sistemi cerealicoli in Basilicata. PSR Mis 124—Le tecnologie satellitari Network RTK a supporto dell’agricoltura conservativa per la cerealicoltura lucana). (4) Ministero dello Sviluppo Economico (La casa delle tecnologie; il giardino delle tecnologie emergenti a Matera).
Conflicts of Interest
The authors declare no conflict of interest.
References
- Wang, J.; Ding, J.; Yu, D.; Teng, D.; He, B.; Chen, X.; Ge, X.; Zhang, Z.; Wang, Y.; Yang, X.; et al. Machine learning-based detection of soil salinity in an arid desert region, Northwest China: A comparison between Landsat-8 OLI and Sentinel-2 MSI. Sci. Total Environ. 2020, 707, 136092. [Google Scholar] [CrossRef] [PubMed]
- Kılıc, O.M.; Budak, M.; Gunal, E.; Acır, N.; Halbac-Cotoara-Zamfir, R.; Alfarraj, S.; Ansari, M.J. Soil salinity assessment of a natural pasture using remote sensing techniques in central Anatolia, Turkey. PLoS ONE 2022, 17, e0266915. [Google Scholar] [CrossRef] [PubMed]
- Nguyen, K.A.; Liou, Y.A.; Tran, H.P.; Hoang, P.P.; Nguyen, T.H. Soil salinity assessment by using near-infrared channel and Vegetation Soil Salinity Index derived from Landsat 8 OLI data: A case study in the TraVinh Province, Mekong Delta, Vietnam. Prog. Earth Planet Sci. 2020, 7, 1. [Google Scholar] [CrossRef] [Green Version]
- Peng, J.; Biswas, A.; Jiang, Q.; Zhao, R.; Hu, J.; Hu, B.; Shi, Z. Estimating soil salinity from remote sensing and terrain data in southern Xinjiang Province, China. Geoderma 2019, 337, 1309–1319. [Google Scholar] [CrossRef]
- Farooq, S.; Onen, H.; Tad, S.; Ozaslan, C.; Mahmoud, S.F.; Brestic, M.; Zivcak, M.; Skalicky, M.; El-Shehawi, A.M. The Influence of Environmental Factors on Seed Germination of Polygonumperfoliatum L.: Implications for Management. Agronomy 2021, 11, 1123. [Google Scholar] [CrossRef]
- Mbarki, S.; Skalicky, M.; Vachova, P.; Hajihashemi, S.; Jouini, L.; Zivcak, M.; Tlustos, P.; Brestic, M.; Hejnak, V.; ZoghlamiKhelil, A. Comparing salt tolerance at seedling and germination stages in local populations of Medicagociliaris L. to Medicagointertexta L. and Medicagoscutellata L. Plants 2020, 9, 526. [Google Scholar] [CrossRef] [Green Version]
- Tahjib-UI-Arif, M.; Sohag, A.A.M.; Afrin, S.; Bashar, K.K.; Afrin, T.; Mahamud, A.G.M.; Polash, M.A.S.; Hossain, M.; Sohel, M.; Taher, A. Differential response of sugar beet to long-term mild to severe salinity in a soil–pot culture. Agriculture 2019, 9, 223. [Google Scholar] [CrossRef] [Green Version]
- Richards, L.A. Diagnosis and Improvement of Saline and Alkali Soils. US Salinity Laboratory Staff; US Department of Agriculture: Washington, DC, USA, 1954. [Google Scholar]
- AbdelRahman, M.A.E.; Natarajan, A.; Rajendra, H.; Prakash, S.S. Assessment of land degradation using comprehensive geostatistical approach and remote sensing data in GIS-model builder. Egypt. J. Remote Sens. Space Sci. 2019, 22, 323–334. [Google Scholar] [CrossRef]
- AbdelRahman, M.A.E.; Natarajan, A.; Hegde, R. Assessment of land suitability and capability by integrating remote sensing and GIS for agriculture in Chamarajanagar district, Karnataka, India. Egypt. J. Remote Sens. Space Sci. 2016, 19, 125–141. [Google Scholar] [CrossRef] [Green Version]
- Aboelsoud, H.M.; AbdelRahman, M.A.E. Rapid Field Technique for Soil Salinity Appraisal in North Nile Delta Using EM38 through Some Empirical Relations. Int. J. Plant Soil Sci. 2017, 14, 1–9. [Google Scholar] [CrossRef]
- AbdelRahman, M.A.E.; Metwaly, M.M.; Shalaby, A. Quantitative assessment of soil saline degradation using remote sensing indices in Siwa Oasis. Remote Sens. Appl. Soc. Environ. 2019, 13, 53–60. [Google Scholar] [CrossRef]
- AbdelRahman, M.A.E.; Shalaby, A.; Mohamed, E.S. Comparison of two soil quality indices using two methods based on geographic information system. Egypt. J. Remote Sens. Space Sci. 2019, 22, 127–136. [Google Scholar] [CrossRef]
- Zhu, J.-K. Plant Salt Tolerance. Trends Plant Sci. 2001, 6, 66–71. [Google Scholar] [CrossRef]
- Corwin, D.; Lesch, S. Application of Soil Electrical Conductivity to Precision. Agric. Agron. J. 2003, 95, 455–471. [Google Scholar] [CrossRef]
- AbdelRahman, M.A.E.; Natarajan, A.; Srinivasamurthy, C.A.; Hegde, R. Estimating soil fertility status in physically degraded land using GIS and remote sensing techniques in Chamarajanagar district, Karnataka, India. Egypt. J. Remote Sens. Space Sci. 2016, 19, 95–108. [Google Scholar] [CrossRef] [Green Version]
- AbdelRahman, M.A.E.; Shalaby, A.; Aboelsoud, M.H.; Moghanm, F.S. GIS spatial model based for determining actual land degradation status in Kafr El-Sheikh Governorate, North Nile Delta. Modeling Earth Syst. Environ. 2017, 4, 359–372. [Google Scholar] [CrossRef]
- AbdelRahman, M.A.E.; Tahoun, S. GIS model-builder based on comprehensive geostatistical approach to assess soil quality. Remote Sens. Appl. Soc. Environ. 2018, 13, 204–214. [Google Scholar] [CrossRef]
- Wang, F.; Chen, X.; Luo, G.; Ding, J.; Chen, X. Detecting soil salinity with arid fraction integrated index and salinity index in feature space using Landsat TM imagery. J. Arid Land 2013, 5, 340–353. [Google Scholar] [CrossRef] [Green Version]
- Ghabour, T.; Daels, L. Mapping and Monitoring of Soil Salinity of ISSN. Egypt. J. Soil Sci. 1993, 33, 355–370. [Google Scholar]
- Günal, E.; Wang, X.; Kılıc, O.M.; Budak, M.; Al Obaid, S.; Ansari, M.J.; Brestic, M. Potential of Landsat 8 OLI for mapping and monitoring of soil salinity in an arid region: A case study in Dushak, Turkmenistan. PLoS ONE 2021, 16, e0259695. [Google Scholar] [CrossRef]
- Dehaan, R.L.; Taylor, G.R. Field-derived spectra of salinized soils and vegetation as indicators of irrigation-induced soil salinization. Remote Sens. Environ. 2002, 80, 406–417. [Google Scholar] [CrossRef]
- Nanni, M.R.D.; Dematté, J.A.M. Spectral Reflectance Methodology in Comparison to Traditional Soil Analysis. Soil Sci. Soc. Am. J. 2006, 70, 393–407. [Google Scholar] [CrossRef]
- Brunner, P.; Kinzelbach, W.; Li, W.P. Generating soil electrical conductivity maps at regional level by integrating measurements on the ground and remote sensing data. Int. J. Remote Sens. 2007, 28, 3341–3361. [Google Scholar] [CrossRef]
- Allbed, A.; Kumar, L.; Aldakheel, Y.Y. Assessing soil salinity using soil salinity and vegetation indices derived from IKONOS high-spatial resolution imageries: Applications in a date palm dominated region. Geoderma 2014, 230, 1–8. [Google Scholar] [CrossRef]
- Carter, G.A. Responses of leaf spectral reflectance to plant stress. Am. J. Bot. 1993, 80, 239–243. [Google Scholar] [CrossRef]
- Fernandez-Buces, N.; Siebe, C.; Cram, S.; Palacio, J.L. Mapping soil salinity using a combined spectral response index for bare soil and vegetation: A case study in the former lake Texcoco, Mexico. J. Arid Environ. 2006, 65, 644–667. [Google Scholar] [CrossRef]
- Ghulam, A.; Li, Z.; Qin, Q.; Tong, Q. Exploration of the spectral space based on vegetation index and albedo for surface drought estimation. J. Appl. Remote Sens. 2007, 1, 013529. [Google Scholar] [CrossRef]
- Tilley, D.R.; Ahmed, M.; Son, J.H.; Badrinarayanan, H. Hyperspectral reflectance response of freshwater macrophytes to salinity in a brackish subtropical marsh. J. Environ. Qual. 2007, 36, 780–789. [Google Scholar] [CrossRef]
- Baumgardner, M.; Silva, L.F.; Biehl, L.L.; Stoner, E.R. Reflectance Properties of Soils. Adv. Agron. 1986, 38, 1–44. [Google Scholar] [CrossRef]
- De Jong, S. The Analysis of Spectroscopical Data to Map Soil Types and Soil Crusts of Mediterranean Eroded Soils. Soil Technol. 1992, 5, 199–211. [Google Scholar] [CrossRef]
- Demattê, J.A.M.; Costa Campos, R.; Correa Alves, M.; Florio, P.R.; Nanni, M.R. Visible-NIR Reflectance: A New Approach on Soil Evaluation. Geoderma 2004, 121, 95–112. [Google Scholar] [CrossRef]
- Shrestha, D.P.; Margate, D.E.; van der Meer, F.; Hoang, V.A. Analysis and Classification of Hyperspectral Data for Mapping Land Degradation: An Application in Southern Spain. Int. J. Appl. Earth Obs. Geoinf. 2005, 7, 85–96. [Google Scholar] [CrossRef]
- Brown, D.J.; Shepherd, K.D.; Walsh, M.G.; Dewayne Mays, M.; Reinsch, T.G. Global Soil Characterization with VNIR Diffuse Reflectance Spectroscopy. Geoderma 2006, 132, 273–290. [Google Scholar] [CrossRef]
- Metternicht, G.; Zinck, J.A. Remote Sensing of Soil Salinization: Impact on Land Management; CRC Press: Boca Raton, FL, USA, 2008; p. 377. ISBN 9780367386221. [Google Scholar]
- Allbed, A.; Kumar, L. Soil Salinity Mapping and Monitoring in Arid and Semi-Arid Regions Using Remote Sensing Technology: A Review. Adv. Remote Sens. 2013, 2, 373–385. [Google Scholar] [CrossRef] [Green Version]
- Metternicht, G.I.; Zinck, J.A. Remote sensing of soil salinity: Potentials and constraints. Remote Sens. Environ. 2003, 85, 1–20. [Google Scholar] [CrossRef]
- Allbed, A.; Kumar, L.; Sinha, P. Soil salinity and vegetation cover change detection from multi-temporal remotely sensed imagery in Al Hassa Oasis in Saudi Arabia. Geocarto Int. 2018, 33, 830–846. [Google Scholar] [CrossRef]
- Bannari, A.; El-Battay, A.; Bannari, R.; Rhinane, H. Sentinel-MSI VNIR and SWIR Bands Sensitivity Analysis for Soil Salinity Discrimination in an Arid Landscape. Remote Sens. 2018, 10, 855. [Google Scholar] [CrossRef] [Green Version]
- Judkins, G.; Myint, S. Spatial Variation of Soil Salinity in the Mexicali Valley, Mexico: Application of a Practical Method for Agricultural Monitoring. Environ. Manag. 2012, 50, 478–489. [Google Scholar] [CrossRef]
- Zhang, T.T.; Zeng, S.-L.; Gao, Y.; Ouyang, Z.; Li, B.; Fang, C.-M. Using Hyperspectral Vegetation Indices as a Proxy to Monitor Soil Salinity. Ecol. Indic. 2011, 11, 1552–1562. [Google Scholar] [CrossRef]
- Fan, X.; Liu, Y.; Tao, J.; Weng, Y. Soil Salinity Retrieval from Advanced Multi-Spectral Sensor with Partial Least Square Regression. Remote Sens. 2015, 7, 488–511. [Google Scholar] [CrossRef] [Green Version]
- Farifteh, J. Imaging Spectroscopy of Salt-Affected Soils: Model-Based Integrated Method; Utrecht University: Utrecht, The Netherlands, 2007. [Google Scholar]
- Weng, Y.; Gong, P. A review on remote sensing technique for salt-affected soils. Sci. Geogr. Sin. 2006, 26, 375. [Google Scholar] [CrossRef]
- Eldeiry, A.A.; Garcia, L.A. Detecting Soil Salinity in Alfalfa Fields Using Spatial Modeling and Remote Sensing. Soil Sci. Soc. Am. J. 2008, 72, 201–211. [Google Scholar] [CrossRef]
- Bouaziz, M.; Matschullat, J.; Gloaguen, R. Improved remote sensing detection of soil salinity from a semi-arid climate in Northeast Brazil. Comptes Rendus Geosci. 2011, 343, 795–803. [Google Scholar] [CrossRef]
- Sidike, A.; Zhao, S.; Wen, Y. Estimating soil salinity in Pingluo County of China using QuickBirddata and soil reflectance spectra. Int. J. Appl. Earth Obs. Geoinf. 2014, 26, 156–175. [Google Scholar] [CrossRef]
- Elhag, M. Evaluation of Different Soil Salinity Mapping Using Remote Sensing Techniques in Arid Ecosystems, Saudi Arabia. J. Sens. 2016, 2016, 7596175. [Google Scholar] [CrossRef] [Green Version]
- Wardlow, B.D.; Egbert, S.L. Large-area crop mapping using time-series MODIS 250 m NDVI data: An assessment for the U.S. Central Great Plains. Remote Sens Environ. 2008, 112, 1096–1116. [Google Scholar] [CrossRef]
- Yang, Z.; Gao, J.; Zhou, C.; Shi, P.; Zhao, L.; Shen, W.; Ouyang, H. Spatio-temporal changes of NDVI and its relation with climatic variables in the source regions of the Yangtze and Yellow rivers. J. Geogr. Sci. 2011, 21, 979–993. [Google Scholar] [CrossRef]
- Zhang, F.; Tiyip, T.; Ding, J.; Sawut, M.; Tashpolat, N.; Kung, H.; Han, G.; Gui, D. Spectral reflectance properties of major objects in desert oasis: A case study of the Weigan–Kuqa river delta oasis in Xinjiang, China. Environ. Monit. Assess. 2012, 184, 5105–5119. [Google Scholar] [CrossRef]
- Weiss, E.; Marsh, S.E.; Pfirman, E.S. Application of NOAA-AVHRR NDVI Time-Series Data to Assess Changes in Saudi Arabia’s Rangelands. Int. J. Remote Sens. 2001, 22, 1005–1027. [Google Scholar] [CrossRef]
- Xue, J.; Su, B. Significant Remote Sensing Vegetation Indices: A Review of Developments and Applications. J. Sens. 2017, 2017, 1353691. [Google Scholar] [CrossRef] [Green Version]
- Mokarram, M.; Hojjati, M.; Roshan, G.; Negahban, S. Modeling the behavior of Vegetation Indices in the salt dome of Korsia in North-East of Darab, Fars, Iran. Model. Earth Syst. Environ. 2015, 1, 27. [Google Scholar] [CrossRef] [Green Version]
- Wiegand, C.I.; Rhoades, J.D.; Escobar, D.E.; Everitt, J.H. Photographic and Videographic Observations for Determining and Mapping the Response of Cotton to Soil Salinity. Remote Sens. Environ. 1994, 49, 212–223. [Google Scholar] [CrossRef]
- Wiegand, C.; Anderson, G.; Lingle, S.; Escobar, D. Soil Salinity Effects on Crop Growth and Yield-Illustration of an Analysis and Mapping Methodology for Sugarcane. J. Plant Physiol. 1996, 148, 418–424. [Google Scholar] [CrossRef]
- Matinfar, H.R.; AlaviPanah, S.K.; Zand, F.; Khodaei, K. Detection of Soil Salinity Changes and Mapping Land Cover Types Based upon Remotely Sensed Data. Arab. J. Geosci. 2013, 6, 913–919. [Google Scholar] [CrossRef]
- Alhammadi, M.S.; Glenn, E.P. Detecting Date Palm Trees Health and Vegetation Greenness Change on the Eastern Coast of the United Arab Emirates Using SAVI. Int. J. Remote Sens. 2008, 29, 1745–1765. [Google Scholar] [CrossRef]
- Iqbal, F. Detection of Salt Affected Soil in Rice-Wheat Area Using Satellite Image. Afr. J. Agric. Res. 2011, 6, 4973–4982. [Google Scholar] [CrossRef]
- Aldakheel, Y.Y. Assessing NDVI Spatial Pattern as Related to Irrigation and Soil Salinity Management in Al-Hassa Oasis, Saudi Arabia. J. Indian Soc. Remote Sens. 2011, 39, 171–180. [Google Scholar] [CrossRef]
- Jabbar, M.; Chen, X. Land Degradation Due to Salinization in Arid and Semi-Arid Regions with the Aid of Geo-Information Techniques. Geo-Spat. Inf. Sci. 2008, 11, 112–120. [Google Scholar] [CrossRef]
- Lobell, D.B.; Lesch, S.M.; Corwin, D.L.; Ulmer, M.G.; Anderson, K.A.; Potts, D.J.; Doolittle, J.A.; Matos, M.R.; Baltes, M.J. Regional-Scale Assessment of Soil Salinity in the Red River Valley Using Multi-Year MODIS EVI and NDVI. J. Environ. Qual. 2009, 39, 35–41. [Google Scholar] [CrossRef] [Green Version]
- Verma, K.S.; Saxena, R.K.; Barthwal, A.K.; Deshmukh, S.N. Remote Sensing Technique for Mapping Salt Affected Soils. Int. J. Remote Sens. 1994, 15, 1901–1914. [Google Scholar] [CrossRef]
- Dwivedi, R.S. Soil Resources Mapping: A Remote Sensing Perspective. Remote Sens. Rev. 2001, 20, 89–122. [Google Scholar] [CrossRef]
- Elnaggar, A.A.; Noller, J.S. Application of Remote- Sensing Data and Decision-Tree Analysis to Mapping Salt—Affected Soils over Large Areas. Remote Sens. 2010, 2, 151–165. [Google Scholar] [CrossRef] [Green Version]
- AbdelRahman, M.A.E.; Afifi, A.A.; Scopa, A. A Time Series Investigation to Assess Climate Change and Anthropogenic Impacts on Quantitative Land Degradation in the North Delta, Egypt. ISPRS Int. J. Geo-Inf. 2022, 11, 30. [Google Scholar] [CrossRef]
- Elbana, M.; Refaie, K.M.; El-Shirbeny, M.A.; AbdelRahman, M.A.E.; Abdellatif, B.; El-Gendy, R.; Attia, W. Indirect estimation of deep percolation using soil water balance equation and NASA Land Simulation Model (LIS) for more sustainable water management. Egypt. J. Soil. Sci. 2019, 59, 363–383. [Google Scholar] [CrossRef] [Green Version]
- Abdel-Shafy, H.I.; Kamel, A.H. Groundwater in Egypt Issue: Resources, Location, Amount, Contamination, Protection, Renewal, Future Overview. Egypt. J. Chem. 2016, 59, 321–362. [Google Scholar] [CrossRef] [Green Version]
- CNE: Climatologically Normal for Egypt of Kafr El-Sheikh Governorate Station, (2005–2015); Ministry of Civil Aviation, Meteorological Authority: Cairo, Egypt, 2016.
- Burt, R. (Ed.) USDA-Natural Resources Conservation Service. Soil Survey Laboratory Information Manual; Soil Survey Investigations Report No. 45; Version 2.0.; Aqueous Extraction, Method 4.3.3; USDA-NRCS: Lincoln, NE, USA, 2011; p. 167. [Google Scholar]
- Khan, N.M.; Rastoskuev, V.V.; Sato, Y.; Shiozawa, S. Assessment of hydrosaline land degradation by using a simple approach of remote sensing indicators. Agric. Water Manag. 2005, 77, 96–109. [Google Scholar] [CrossRef]
- Farifteh, J.; Farshad, A.; George, R.J. Assessing Salt-Affected Soils Using Remote Sensing, Solute Modelling, and Geophysics. Geoderma 2006, 130, 191–206. [Google Scholar] [CrossRef]
- Setia, R.; Marschner, P.; Raja Segaran, R.; Summers, D.; Chittleborough, D. Severity of Salinity Accurately Detected and Classified on a Paddock Scale with High Resolution Multispectral Satellite Imagery. Land Degrad. Dev. 2011, 24, 375–384. [Google Scholar] [CrossRef]
- Dehni, A.; Lounis, M. Remote Sensing Techniques for Salt Affected Soil Mapping: Application to the Oran Region of Algeria. Procedia Eng. 2012, 33, 188–198. [Google Scholar] [CrossRef] [Green Version]
- AbdelRahman, M.A.E.; Zakarya, Y.M.; Metwaly, M.M.; Koubouris, G. Deciphering Soil Spatial Variability through Geostatistics and Interpolation Techniques. Sustainability 2021, 13, 194. [Google Scholar] [CrossRef]
- Yao, X.; Fu, B.; Lü, Y.; Sun, F.; Wang, S.; Liu, M. Comparison of four spatial interpolation methods for estimating soil moisture in acomplex terrain catchment. PLoS ONE 2013, 8, e54660. [Google Scholar] [CrossRef]
- Deering, D.W.; Rouse, J.W.; Haas, R.H.; Schell, J.A. Measuring “forage production” of grazing units from Landsat MSS data. In Proceedings of the 10th International Symposium Remote Sensing of Environment, Ann Arbor, MI, USA, 6 October 1975; Volume II, pp. 1169–1178. [Google Scholar]
- Mcfeeters, S.K. The use of Normalized Difference Water Index (NDWI) in the delineation of open water features. Int. J. Remote Sens. 1996, 17, 1425–1432. [Google Scholar] [CrossRef]
- Congalton, R.G. A review of assessing the accuracy of classifications of remotely sensed data. Remote Sens. Environ. 1991, 37, 35–46. [Google Scholar] [CrossRef]
- Madani, A.A. Soil Salinity Detection and Monitoring Using Landsat Data: A Case Study from Siwa Oasis, Egypt. GISci. Remote Sens. 2005, 42, 171–181. [Google Scholar] [CrossRef]
- Mehrjardi, R.T.; Mahmoodi, S.H.; Taze, M.; Sahebjalal, E. Accuracy Assessment of Soil Salinity Map in Yazd-Ardakan Plain, Central Iran, Based on Land sat ETM+ Imagery. Am. Eurasian J. Agric. Environ. Sci. 2008, 3, 708–712. [Google Scholar]
- Abbas, A.; Khan, S. Using Remote Sensing Techniques for Appraisal of Irrigated Soil Salinity. In International Congress on Modelling and Simulation (MODSIM); Oxley, L., Kulasiri, D., Eds.; Modelling and Simulation Society of Australia and New Zealand: Brighton, UK, 2007; pp. 2632–2638. [Google Scholar]
- Metternicht, G.; Zinck, J.A. Spatial Discrimination of Salt- and Sodium-Affected Soil Surfaces. Int. J. Remote Sens. 1997, 18, 2571–2586. [Google Scholar] [CrossRef]
- AlaviPanah, S.K.; Goossens, R. Relationship between the Landsat TM, MSS Data and Soil Salinity. J. Agric. Sci. Technol. 2001, 3, 21–31. [Google Scholar]
- Goossens, R.; Kazem, A.P.S.; De Dapper, M.; Kissyar, O. The Use of Thermal Band of Landsat TM for the Study of Soil Salinity in Iran (Ardakan Area) and Egypt (Ismailia Province). In Proceedings of the International Conference on Geomatics in Natural Resource Monitoring, Dehradun, India, 3–11 March 1999; pp. 454–459. [Google Scholar]
- Furby, S.L.; Vallace, J.F.; Caccetta, P.A.; Wheaton, G.A. Detecting and Monitoring Salt-Affected Land: A Report from the LWRRDC Project Detecting and Monitoring Changes in Land Condition through Time Using Remotely Sensed Data; CSIRO, Division of Mathematics & Statistics: Canberra, Australia, 1995. [Google Scholar]
- Gopalakrishnan, T.; Kumar, L. Modeling and Mapping of Soil Salinity and its Impact on Paddy Lands in Jaffna Peninsula, Sri Lanka. Sustainability 2020, 12, 8317. [Google Scholar] [CrossRef]
- Avdan, U.; Kaplan, G.; Avdan, Z.Y.; Matci, D.K.; Erdem, F.; Mizik, E.T.; Demirtas, I. Comparison of Remote Sensing Soil Electrical Conductivity from PlanetScope and Ground Measured Data in Wheat and Beet Yields. Biol. Life Sci. Forum 2021, 3, 48. [Google Scholar] [CrossRef]
- Bannari, A.; Guedona, A.M.; El-Hartib, A.; Cherkaouic, F.Z.; El-Ghmari, A. Characterization of Slightly and Moderately Saline and Sodic Soils in Irrigated Agricultural Land using Simulated Data of Advanced Land Imaging (EO-1) Sensor. Commun. Soil Sci. Plant Anal. 2008, 39, 2795–2811. [Google Scholar] [CrossRef]
Publisher’s Note: MDPI stays neutral with regard to jurisdictional claims in published maps and institutional affiliations. |
© 2022 by the authors. Licensee MDPI, Basel, Switzerland. This article is an open access article distributed under the terms and conditions of the Creative Commons Attribution (CC BY) license (https://creativecommons.org/licenses/by/4.0/).