Abstract
Coal is one of the fundamental fossil energy supporting the world’s economy. The synergistic development between efficient coal mining and ecological environment protection is the inevitable requirement for the preservation of global harmony. As the world’s largest coal producer, China has conducted a strategic shift from east to west in terms of the exploitation of its energy resources, posing a serious threat to the fragile ecological environment of the western region. In particular, the surface subsidence caused by coal mining is the root of the ecological deteriotation and the destruction of ground structures. However, it is difficult to reveal the law of large-scale surface subsidence in western mining areas merely by conventional measurement methods such as leveling, on account of the high intensity of coal seam mining, the weakness of the lithology of overlying rock and the large thickness of wind-blown sand strata. In view of this, small baseline subset interferometric synthetic aperture radar (SBAS-InSAR) technology was used in this study to obtain the time series of surface vertical displacement during the whole mining process of the 2401 working face in the Yingpanhao coal mine, Inner Mongolia. Based on the deformation data, the dynamic evolution characteristics of surface subsidence under high intensity mining in the western mining area were analyzed exhaustively. It was found that the surface subsidence is characterized by an extensive coverage range (48.52 km2) with minimal ground settlement (250 mm) in the study area. Meanwhile, the boundary shape of the subsidence basin followed a “circular-parallelogram-trapezoid” changeable process and the coverage area of the basin experienced three stages: a linear increasing period, a temporary stagnation period, and a re-expansion period. Furthermore, there existed an abnormal uplift phenomenon on the east side of the open-off cut in the 2401 working face. Combined with the structure of overlying strata, this paper carried out a preliminary analysis on the reasons of the abovementioned phenomenon. The research results are of vital realistic significance for ground buildings and ecological environmental protection in the aeolian sand mining area in Western China.
1. Introduction
Coal is one of the fundamental fossil energy sources supporting the world’s economy. The synergistic development of efficient coal mining and ecological environment protection is the inevitable requirement for the preservation of harmony. As the world’s largest coal producer, China has strategically shifted its intensive mining activities from east to west as a result of the gradual depletion of coal resources in the eastern region. However, large-scale and high-intensity coal exploitation poses a serious threat to the fragile ecological environment in the western aeolian sand area. In particular, the surface subsidence caused by coal mining would destroy the original equilibrium structure of underground aquifer, threaten the safety of infrastructure including railways, highways, as well as natural gas transmission pipelines, and weaken the carrying capacity of the ecological environment. Therefore, it has become a hot research topic to master the mining subsidence law of the aeolian sand area in Western China, in order to solve scientifically the contradiction between coal resources exploitation and the surface human living environment.
Early studies have shown that drastic strata movement and discontinuous surface damage would occur rapidly after coal mining in western aeolian sand areas, such as sudden surface collapse [1], permanent ground fissures [2,3,4,5,6], the decline of groundwater level accompanied by the above severe destruction [7], as well as secondary damages such as the loss of soil nutrients and the reduction of microbial diversity [8]. According to the analysis of Yan et al. [9,10,11], the above severe failure phenomenon has an apparent relationship with the characteristics of the strata structure featured as a large coal seam thickness, shallow burial depth, and thin overlying bedrock. Under the condition of high-intensity mining, the overlaying strata in these areas are prone to sliding instability, which causes synchronous failure of the aeolian sand layer. Consequently cracks connecting mining fields and the surface are formed. However, the conclusions of the above research are only applicable to describe the surface damage characteristics of shallow coal seams.
The latest research [12] indicates that the severity of surface subsidence is greatly reduced along with the increased mining depth. Moreover, this reduction trend is particularly obvious for the first working face in the state of insufficient mining. To understand this phenomenon, preliminary studies [12,13] on the overburden deformation characteristics of deep mining in Western China were undertaken with similar material simulation experiments and numerical simulation experiments. It was considered that the giant thick Cretaceous strata weakly cemented to the stratum located above the deeply buried coal seam has superior resistance to deformation and damage because of its good integrity and large thickness [14,15,16,17], thus controlling the development of the overburden movement to the surface. However, these investigations did not specifically discuss the ground settlement characteristics after deep coal mining due to the lack of comprehensive surface deformation observation data.
With the rapid development of satellite-based earth observation technology, a new generation of surface deformation monitoring technology represented by differential interferometry synthetic aperture radar (D-InSAR) [18,19,20], persistent scatterers InSAR (PS-InSAR) [21] and small baseline subset InSAR (SBAS-InSAR) [22,23,24] has been proposed. With great advantages such as a wide monitoring range, a high observation density, historical backtracking, a high accuracy of deformation monitoring and a low influence by the weather, these techniques have been widely used in the fields of volcanoes [25,26,27,28], earthquakes [29,30,31,32,33,34], landslides [35,36,37,38], and other geological hazards [39,40,41]. At the same time, it has been widely used in the field of surface subsidence monitoring in mining areas, including the analysis of the relationship between surface deformation and underground mining [42], the evaluation of potential mine geological hazards by calculating the prediction parameters of surface subsidence [43], and the analysis of the influence of additional factors, such as groundwater migration [44,45] and underground coal fire [46], on surface displacement in mining areas. Nevertheless, there are few cases that employ time series InSAR (TS-InSAR) technology to analyze mining-induced surface subsidence in the aeolian sand area of Western China.
The SBAS-InSAR technique adopts the method of acquiring interferometric image pairs with short spatial and temporal baselines from multiple master images, which can use as many interferograms as possible in the same observation time to participate in the deformation sequence solution. Compared with the PS-InSAR technology, it is more suitable for the aeolian sand area in Western China without permanent scatterers such as houses, roads, railways, bridges, and exposed rocks. Therefore, the time series of surface subsidence during the advancement of the 2401 working face in the Yingpanhao coal mine, located in the central part of the Ordos Basin, China, were obtained by the SBAS-InSAR technique, and the relationship between the two geometric features (shape and coverage area) of the surface subsidence basin and the advancing length of the working face were analyzed in this study. Moreover, the influence mechanism of the aeolian sand layer and the weakly cemented covered rock combination structure on surface subsidence was further analyzed. The purpose of this study was to grasp the characteristics of surface subsidence under the insufficient condition of deep coal mining in the aeolian sand area of Western China so as to provide insights for analyzing the movement mechanism of giant thick weakly cemented overburden.
2. Study Area
As shown in Figure 1, the study area is located in the inland of Northwest China with a flat terrain and sandy landform, which has a typical midtemperate semiarid continental climate with little rainfall and high surface evaporation, resulting in an extreme shortage of surface water resources. However, the groundwater resources in this area are relatively abundant, especially in shallow strata. Monsoons are prevalent in the study area with an average wind speed of 13.4 m/s over the years, especially in the northwest monsoon in spring. The extreme maximum wind speed can reach 19.0 m/s, allowing dust storms to form frequently.
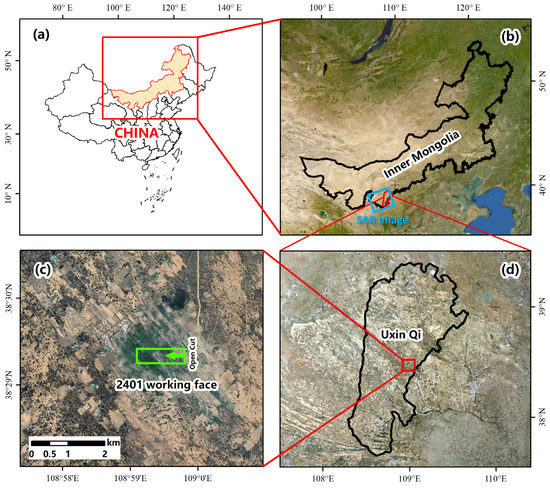
Figure 1.
Location of the study area. (a) Position at the national level in China. (b) Position in Inner Mongolia Province. Blue rectangular frame is the cover range of SAR Images. (c) Position in Uxin Qi. (d) 2401 working face layout. The direction indicated by the green arrow is the advancing direction of the working face.
The study area is located in the central part of the Ordos platform, which is the most complete and stable structural unit existing in China. It provides advantageous conditions for the formation of a relatively complete and simple stratigraphic structure and the avoidance of large fault development. According to drilling data, the strata in the area from bottom to top are: Upper Triassic Yanchang Formation (), Middle-Lower Jurassic Yan’an Formation (), Middle Jurassic Zhiluo Formation (), Anding Formation (), Lower Cretaceous Zhidan Group (), and Quaternary (). Figure 2 describes the stratigraphic distribution of the study area in detail. Overall, the lithology of the strata is mostly sandstone. Such lithologies have poor mechanical properties due to weak cementation, but have a large thickness. Specifically, the high-lying Cretaceous Zhidan Group formations have compressive strengths between 10–20 Mpa, tensile strengths between 0.29–1.61 Mpa, a modulus of elasticity between 1.76–2.91 Gpa, and a cohesion between 4.8–8.6 Mpa with an average thickness of more than 300 m. The 2-2 coal seam currently being mined in the Yingpanhao coal mine was formed during the Jurassic period and is located in the third section of , with an average burial depth of 722.88 m, a thickness of 6.41 m, and a dip angle of 1°.
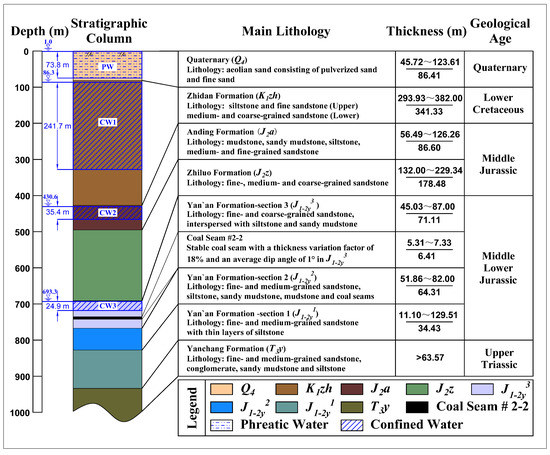
Figure 2.
Stratigraphic structure and aquifer distribution in the study area.
The study area is scarce of surface water, but is abundant in groundwater resources, which can meet the water demand of local residents for living and production. According to the borehole pumping data of the Yingpanhao coal mine, there are mainly four aquifers in the overburden of the 2-2 coal seam, as shown in Figure 2. From the surface downward, they are: pore phreatic aquifer PW, confined aquifer CW1, Middle Jurassic () confined aquifer CW2, and bottom to 2-2 coal seam confined aquifer CW3. The main information of each aquifer is shown in Table 1. The unit water inflow q and permeability coefficient K of each aquifer were determined by steady flow single-hole tests (drop depth of 10 m, steady pumping time of 8 h, and caliber of 91 mm). The phreatic aquifer PW is mainly supplied by atmospheric precipitation and lateral runoff in adjacent areas. At the same time, the phreatic aquifer has a certain hydraulic connection with the lower confined aquifer CW1. The confined aquifer CW1 has a high porosity, strong water permeability and conductivity, which forms a good storage space for groundwater and is the main aquifer in this area. The hydraulic connection between the CW1 and the lower confined water aquifer is small, and further down, the confined aquifers CW2 and CW3 are weakly water-rich with poor permeability and hydraulic conductivity. In the formation , , and , there are multiple layers of mudstone, sandy mudstone, and siltstone with thin thickness, dense lithology, and poor permeability. Consequently, they can be regarded as the relatively impermeable layers.

Table 1.
Main information about the aquifer in the Yingpanhao coal mine.
The 2401 working face is located in the northeast of the industrial square. The average depth of the working face is about 742 m. The average mining thickness is about 5.6 m. The mining width is 300 m. The working face is mined by comprehensive mechanization with a longwall arrangement and full height of one mining. The mining sequence is backward and the roof management method is a caving method. The 2401 working face was advanced from east to west in early December 2019 from the open cut. The advancing length was 1022 m until 31 January 2021. There is no other working face adjacent to the 2401 working face, except for the 2202 working face in the second mining section at a distance of 2027 m to its south. Since they are far away from each other, it can be initially considered that the two working faces do not produce obvious mining disturbance impact on each other’s subsidence area. Figure 3 is a layout of the 2401 working face.
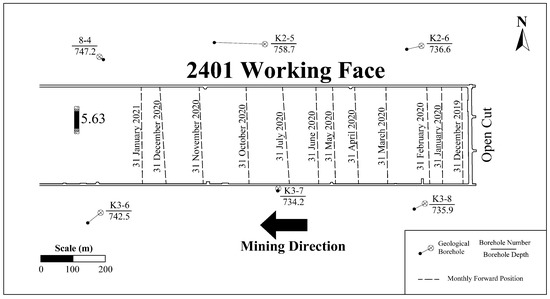
Figure 3.
Layout of the 2401 working face and the monthly forward position.
3. Materials and Methods
In this section, the SAR images employed in this paper, the basic principles of the SBAS-InSAR technology, and the main data processing workflow are presented.
3.1. SAR Images
The SAR image dataset used in this study was obtained by C-band high resolution synthetic aperture radar on the Sentinel-1 A satellite of ESA in wide swath mode, spanning the period from 29 July 2019 to 19 May 2021 with a total of 53 scenes. The coverage of the Sentinel-1 A SAR images used is shown in the blue rectangle in Figure 1b, and the main parameter is shown in Table 2. The study area is located in the eastern part of the original SLC image coverage. In order to minimize the computation time and storage space required for the SBAS-InSAR processing, all images were first uniformly cropped in this study. The cropped SLC image coverage is shown in the red rectangular in Figure 1d.
Table 2.
Main parameters of Sentinel-1A SAR images over the Yingpanhao mine area, China.
In addition, ASTER GDEM V2 data with a spatial resolution of 30 m were also used in this study to assist in the interferogram alignment and remove the topographic phase in the interferogram. At the same time, the corresponding precise orbit data of each SAR image were used to weaken the orbit error in the interference phase.
3.2. SBAS-InSAR Technology
Several subsets were generated by the free combination of SAR images covering the study area through the setting of temporal baseline and spatial baseline thresholds in the SBAS-InSAR technique [22]. The baselines were smaller within the same subset and larger between subsets. The terrain phase simulation and removal were performed using external DEM, and then the selection of high-quality coherence points was based on the coherence coefficients of the interferogram. Finally, the least-squares solution (LS) within a subset and the singular value decomposition (SVD) between subsets were obtained on the interference phases of these highly coherent points to obtain high-precision deformation time series and annual average deformation rates. The basic principle of SBAS-InSAR technology is described below.
One super master image is selected from SAR images covering the same area, and then other SAR images are registered with it. Then, M multiview differential interferograms are generated.
Assume that the images at moments and generate the jth interferogram. The interferometric phase of the pixel with azimuthal coordinate x and distance coordinate r in the map is:
where ; is the central wavelength of the radar signal; and are the cumulative deformations at moments and (), respectively, with respect to the radar line-of-sight direction at moment ; represents the terrain phase of the residual in the differential interferogram. If the DEM introduced in the differential interferogram has high accuracy, most of the terrain phase can be removed, then the residual terrain information in the differential interferogram is small and can be ignored in the calculation process; represents the atmospheric delay phase; represents the coherent noise (such as the system thermal noise).
If the influence of atmospheric delay phase, residual terrain phase and noise phase are not considered, Equation (3) can be simplified as:
In order to obtain the deformation sequence with physical significance, the average phase velocity of two adjacent images is set as:
where , then,
Thus, the following matrix equation can be obtained:
In the formula, is an matrix, where each row corresponds to an interferogram and each column corresponds to a SAR image obtained at a certain time. The value of the main image column is ; the value of the auxiliary image column is ; and values of the remaining images are 0.
Since the SBAS-InSAR technology adopts the multimain image strategy, matrix is generally a rank-deficient matrix. The generalized inverse matrix of is obtained by the SVD method, and the minimum norm solution of the velocity vector is obtained. Finally, the deformation of each time period can be obtained by integrating the velocity of each time period. SBAS-InSAR not only inherits the advantages of traditional D-InSAR, but also improves the time resolution of deformation monitoring, effectively overcoming the decoherence problem caused by a long time baseline and spatial baseline in surface deformation monitoring.
3.3. Data Processing
In this study, 53 Sentinel-1 A SAR images were processed by the SBAS-InSAR module in SARScape. The workflow of data processing is shown in Figure 4.
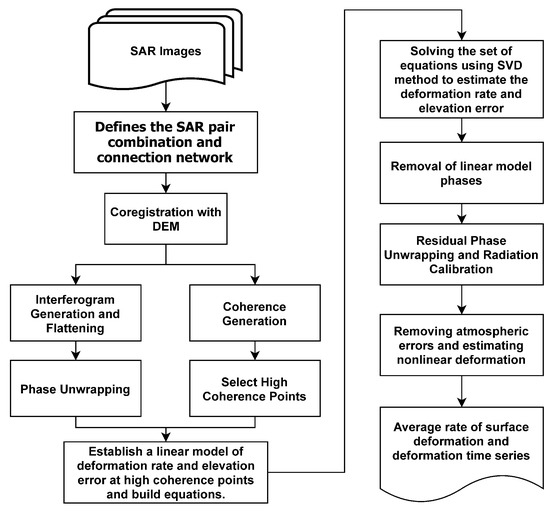
Figure 4.
SBAS-InSAR flow chart [22].
First, the temporal baseline and spatial baseline thresholds were set to 60 days and 2% of the critical limit to generate as many connected image pairs with a good coherence as possible. The generated spatio-temporal baseline connection maps are shown in Figure 5.
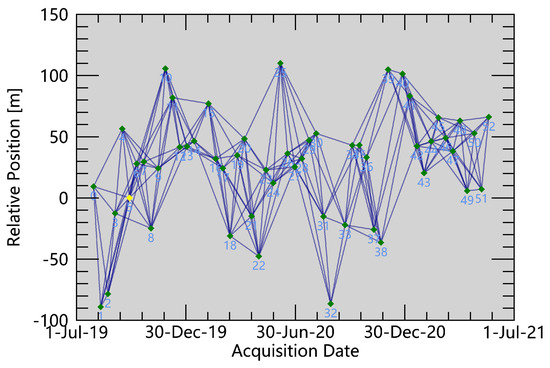
Figure 5.
Connection diagram of spatio-temporal baseline. The yellow point represents the super master image.
Then, the image pairs were registered before interference processing. After interference calculation, the terrain phase information was eliminated in combination with ASTER GDEM V2. In order to reduce the computational effort and suppress the noise, the interferograms were multilook-processed with an azimuthal direction of 1 and a range direction of 4. Then, the filtering process was performed by the Goldsteid method to further eliminate the effect of noise in the multilook differential interferogram. The minimum-cost flow method was used for unwrapping, and the threshold of the unwrapping coherence coefficient was set to 0.3. After checking the coherence map, the image pairs with poor coherence were removed. Some of the coherence and interferograms maps of the remaining pairs are shown in Figure 6 and Figure 7. The number and the date of each pair are shown in Table 3.
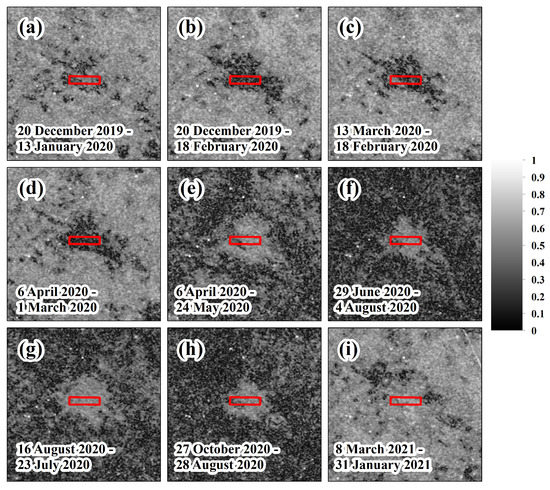
Figure 6.
Coherence images. Subfigures (a–i) are the coherence images corresponding to the image pairs in Table 3. The layout of the 2401 working face is marked by the red rectangle.
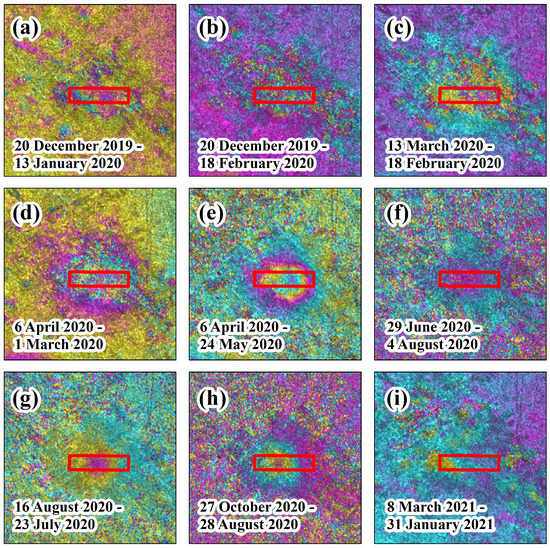
Figure 7.
Interference images. Subfigures (a–i) are the interference images corresponding to the image pairs in Table 3. The layout of the 2401 working face is marked by the red rectangle.
Table 3.
Identification number and date of partial image pairs.
In Figure 6a–d, the coherence values in the area which are directly above the 2401 working face are lower than those in the surrounding area. It indicates that the surface subsidence basin is expanding during this period. The interferometric stripes in Figure 7a–d also prove that is indeed occurring at this stage. In Figure 6e,f, the coherence values of the area around the 2401 working face is significantly reduced. As can be seen from Table 3, these coherence images correspond to dates ranging from 6 April 2020 to 27 October 2020. Combined with the historical meteorological records of the study area, the distribution of annual precipitation in the area where the Yingpanhao mine is located is extremely uneven, concentrated in July, August, and September. Moreover, the frost-free period is short throughout the year with the annual freeze starting in October and thawing in April of the following year. Studies [47,48] have been conducted to show that rainfall can cause loss of coherence. Therefore, changes in surface water content due to precipitation and low-temperature permafrost are likely to be the main factors contributing to the reduction in coherence over this time scale. From the statistical distribution of the coherence values shown in Figure 8, it can be more intuitively seen that the coherence values of the pixels in Figure 8a–d,i are mostly above 0.40, while the coherence values of Figure 8e–h generally do not exceed 0.60, mostly below 0.40. Clear interference fringes can also be seen in Figure 7e,f, indicating that subsidence is still occurring on the surface.
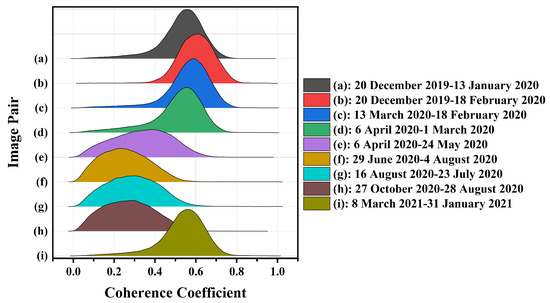
Figure 8.
Statistical distribution of coherence coefficient. Subfigures (a–i) are the Statistical distribution of coherence coefficient corresponding to the image pairs in Table 3.
The high coherence shown in Figure 6i and the absence of interference fringes shown in Figure 7i indicate that no significant subsidence has occurred at the surface after mining stopped. The interference fringes and coherence variations shown in the interferograms and coherence maps described above are consistent with the mining activity on the 2401 working face.
Then, 51 geodetic control points (GCP) were selected for orbit refinement and reflattening in the region without residual topographic streaks, deformation streaks, and phase jumps. After that, two inversions were performed. The first inversion estimated the displacement rate and residual topography, and the second inversion performed phase unwrapping to optimize the results.
The research in [21] shows that the atmospheric delay phase is generally a low-frequency signal in the spatial domain and a high-frequency signal in the time domain. The deformation phase shows low-frequency signals in both spatial and temporal domains; the noise phase is a high-frequency signal in the space and time domain. Therefore, the phase caused by the atmospheric delay can be obtained by high-pass filtering in time and low-pass filtering in space. The atmosphere high pass size and atmosphere low pass size were set to 365 days and 1600 m, respectively.
Finally, the line of sight (LOS) deformation was converted to a vertical deformation based on the formula:
where is the deformation value at any point in the LOS direction and represents the angle of incidence.
4. Results
After processing, the surface subsidence time series during the mining of the 2401 working face in the Yingpanhao coal mine were finally obtained. Figure 9 shows the distribution of the surface subsidence rate in the study area. The maximum settlement rate is 180 mm/year. In this section, the subsidence data measured by SBAS are first verified using level survey data. Then, the dynamic evolution process of the subsidence basin, its shape, and the relationship between the area and the advancing length of the working face are described.
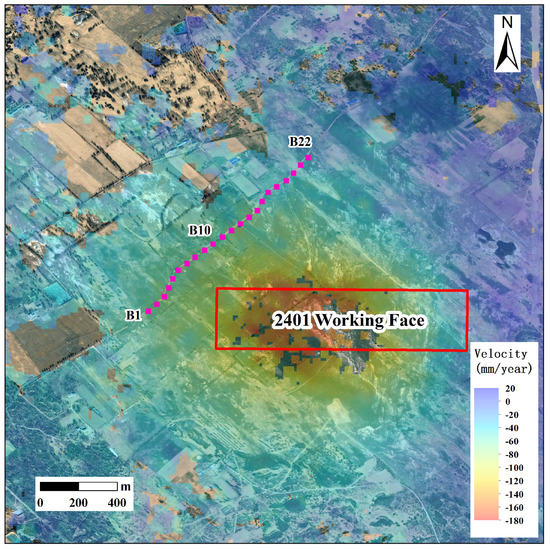
Figure 9.
The annual average subsidence rate of the ground surface and the layout of leveling points in the study area. B1–B22 are the point numbers of level measurement points. The layout of the 2401 working face is marked by the red rectangle.
4.1. Verification of Settlement Monitoring Results
In order to verify the SBAS-InSAR settlement monitoring results, leveling measurement data were collected at the surface around the 2401 working face in this study. The leveling observation line was located at the northwest side of the 2401 working face, as shown in the Figure 9, which consisted of 22 measurement points (B1–B22) in total and was laid along the road. A total of four observations were conducted. The first observation date was 2 December 2019, and the remaining observation dates were 6 March 2020, 24 July 2020 and 8 March 2021, respectively.
For comparison, the cumulative subsidence values recorded at 26 November 2019, 1 March 2020, 23 July 2020, and 8 March 2021 were extracted from the SBAS subsidence monitoring sequences containing pixels with level measurement points B1–B22 in this study. The cumulative subsidence for the other dates was then calculated by taking 26 November 2019 as the first observation. The comparison results of SBAS-InSAR and level settlement monitoring are shown in Figure 10. It can be clearly seen that the subsidence curves composed of each point also show consistent subsidence characteristics. However, it should be noted that the monitoring results of B1–B13 in July 2020 and March 2021 are slightly different. Specifically, the monitoring results of the level survey are larger than those of SBAS-InSAR by about 17 mm. Surface deformation in mining areas is usually a three-dimensional phenomenon [49]. Therefore, the discrepancy shown in Figure 10 is related to the fact that the equation for converting subsidence from the LOS direction to the vertical direction ignores subsidence perpendicular to the line-of-sight direction. However, since the differences are not significant, it can be assumed that the subsidence monitoring results of SBAS-InSAR have limited influence on the analysis of surface subsidence characteristics.
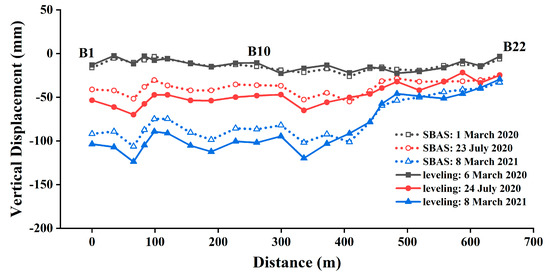
Figure 10.
Comparison of settlement measured by SBAS-InSAR and leveling.
4.2. Dynamic Development Process of Surface Subsidence Basin
The vertical deformation time series of the surface in the study area from 29 July 2019 to 19 May 2021 were obtained by the above SBAS-InSAR process. The spatio-temporal evolution of the surface subsidence basin in the study area is shown in Figure 11 with a 2-month interval.
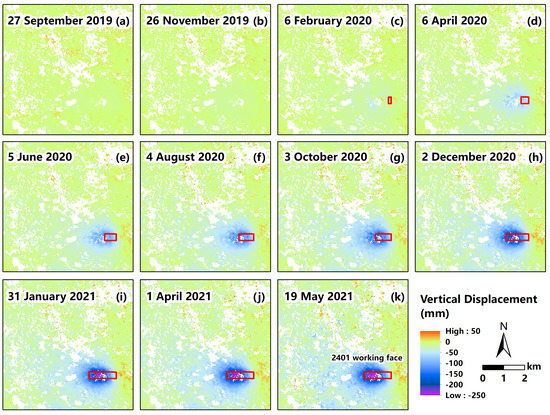
Figure 11.
The dynamic evolution process of surface subsidence basin in the study area. Subfigures (a–k) show the distribution of cumulative surface subsidence in the study area at different dates. The layout of the 2401 working face is marked by the red rectangle.
Before 26 November 2019, the 2401 working face had not been mined; meanwhile the ground surface did not show subsidence, as shown in Figure 11a,b. On 6 February 2020, the working face was advanced by a length of 100 m, while slight subsidence had occurred on the surface, as shown in Figure 11c. As the advancing length increased, the area where surface subsidence occurred expanded rapidly to the west, as shown in Figure 11d–k. During this period, the settlement amount also gradually increased. In particular, the maximum cumulative surface subsidence exceeded 200 mm on 31 January 2021, when the advancing length was approximately 1022 m. Afterwards, the mining was stopped and the extent and sink values of the surface subsidence basin increased slightly. Figure 11k shows the final formation of the surface subsidence basin. The area where surface subsidence occurs is basically located at the west side of the working face open cut. On the east side of the open cut, there is a small-scale uplift of the ground surface instead of subsidence. However, the uplift value is relatively small, not exceeding 50 mm at maximum. Such an anomalous phenomenon indicates that the movement of the overburden above the open cut is probably not in the form of a simple downward bending, but a rotation towards the center of the mining area. A further analysis of this anomaly is carried out in Section 5.1.
According to the degree of sinkage, the surface settlement area can be divided into an edge zone and a central zone. The edge zone is located on the west side of the working face, and the sinkage value of each place is small, but the coverage is extremely extensive. The central zone is located directly above the working face, slightly on the side of the coal wall, and is axially distributed with the axis of orientation of the working face, which is consistent with the surface subsidence characteristics after longwall mining of a horizontal coal seam. Meanwhile, the local area where a slight uplift occurs on the east surface of the open cut is called the uplift zone.
4.3. Variations of Surface Subsidence Basin Shape
Shape is the most intuitive geometric feature of a surface subsidence basin, which can be delineated by boundary contour lines. In a previous study [50], considering the influence of measurement error on monitoring results, 10 mm was used as the determination value of subsidence basin boundary. It has been demonstrated that the accuracy of surface subsidence monitoring by the SBAS-InSAR technology can reach subcentimeter level [51]. Moreover, the smaller the deformation, the higher the accuracy of the monitoring results. Therefore, this study used the 10 mm contour of subsidence to delineate the influence range of surface mining above the 2401 working face in each period, as shown in the dark green contour in Figure 12. In addition, to distinguish the edge zone and the center zone of the subsidence basin, this study also determined the areas where the subsidence exceeded 30 mm and 50 mm, as shown by the blue contour and the black contour , respectively.
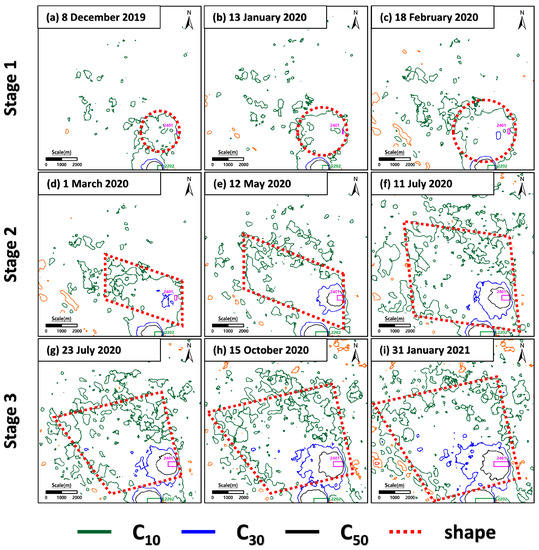
Figure 12.
Variations of the surface subsidence basin shape during the mining activities of the 2401 working face. Subfigures (a–i) show the surface subsidence basin shape at different dates.
First of all, it can be obviously recognized that the contour is more cluttered, which is increasingly serious as time passes backwards. The contours and are relatively distinct. Secondly, all three contours experienced different degrees of change during the advancement of the 2401 working face from east to west.
Among them, the contour shape of changed most significantly, roughly from circular to parallelogram and then finally to trapezoid. Accordingly, the outward expansion of the surface subsidence basin was divided into three stages as follows.
- Stage 1: Circular. During the period from 8 December 2019 to 18 February 2020, expanded simultaneously to the west, south and north with the advancement of the working face. Sporadic areas of slight subsidence were developed on the northwest side of .
- Stage 2: Parallelogram. During the period from 18 February 2020 to 11 July 2020, expanded rapidly toward the northwest side predominantly. The existing sporadic slight subsidence area was merged by the main basin, and new sporadic subsidence appeared to occur directly north of .
- Stage 3: Trapezoidal. During the period from 11 July 2020 to 31 January 2021, expanded mainly to the north, further merging the sporadically developed subsidence area directly to the north. The newly developed sporadic subsidence area expanded toward the northeast side of the boundary curve.
The shapes of and were less variable, being circular first and then oval. Moreover, the variation process was obviously directly associated with the mining activity of the 2401 working face. Assuming that 30 mm of subsidence is exactly the threshold value to distinguish the edge zone and the center zone of the subsidence basin, then it can be considered that the area within is the center zone of the subsidence basin, and the area between and is the edge zone.
From the above analysis, it can be seen that the settlement in the central zone was directly related to the mining of the 2401 working face, while the settlement in the edge zone was not directly affected by the underground mining, but more likely induced by the decline of groundwater caused by mining. A further analysis of this phenomenon is carried out in Section 5.2.
4.4. Relationship between Coverage Area of Subsidence Basin and Advancing Length of Working Face
Since the continuous exploitation of the 2401 working face is the direct cause of the expansion of the surface subsidence basin, it is necessary to have an in-depth investigation of the quantitative relationship between the geometric characteristics of the subsidence basin and the length of the working face. Accordingly, the area of the circled areas of , , and curves, denoted as , , and respectively, was first counted in this study, as shown in the Table 4 and Figure 13.
Table 4.
Coverage area of subsidence value over 10, 20 and 50 mm with different advance lengths of 2401 working face.
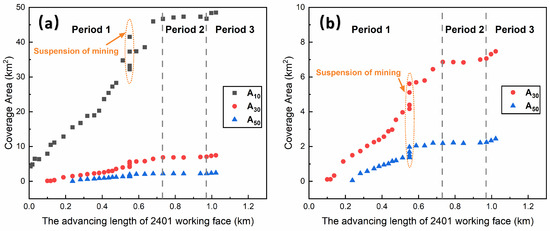
Figure 13.
Relationship between coverage area of the surface subsidence basin and advancing length of the 2401 working face. (a) Coverage area of subsidence value over 10 mm. (b) Coverage area of subsidence value over 30 and 50 mm.
As can be seen from Figure 13a, is much larger than and . When the mining length L of the 2401 working face reaches 1022.3 m, tends to be 50 km2, while both and are only within 10 km2. Specifically, is about 48.52 km2, is about 7.47 km2, and is about 2.45 km2. It indicates that the central zone was only one fifth of the entire subsidence basin area.
Combined with Figure 13a,b, it can be found that although the magnitudes of , , and are quite different from each other, all of them increase with L through three stages: a linear increasing period, a temporary stagnation period, and a re-expansion period. All of them have basically the same working face advance length corresponding to the stage shift.
- Linear increasing period:. , , and all increase linearly with L, with rates about 57.46 km2/m, 10.68 km2/m, and 4.08 km2/m, respectively. It demonstrates that the subsidence basin was rapidly expanded during this period.
- Temporary stagnation period:. , , and all change extremely slowly as L increases, and it can be assumed that the subsidence basin is not expanding outward temporarily during this period.
- Re-expansion period:. , , and increased with L again. Due to the limited amount of data, the increasing relationship between area and length cannot be clearly given during this period.
The above analysis shows that the outward expansion process of the surface subsidence basin in the study area did not increase completely with the mining of the working face, but there was a pause in the middle of the development. However, there is no relevant theory to explain this phenomenon reasonably yet. This anomaly is analyzed in Section 5.3 of this paper.
5. Discussion
In Section 4 of this paper, there were three abnormal phenomena found during the elucidation of the surface subsidence characteristics of the 2401 working face, which were: (1) a slight uplift appears on the east surface of the open cut eye; (2) obvious changes in the shape of the edge zone of the subsidence basin; (3) the expansion process of the surface subsidence basin undergoes a suspended expansion stage. This section discusses the possible explanations for the above anomalies.
5.1. Slight Uplift of the Ground Surface above the Open Cut
As mentioned in the Section 4.1, during the mining process of the 2401 working face, an abnormal slight uplift of the ground surface occurred on the east side of the open cut, forming a trend of rotation toward the center of the mining area together with the subsidence area on the west side. To further analyze this phenomenon, a vertical profile AA’ was made along the strike centerline of the 2401 working face in this study, as shown in Figure 14. Referring to the results of the three-stage division derived from Section 4.2, the cumulative vertical displacement curves on 18 February 2020, 11 July 2020, and 31 January 2021, noted as VC1, VC2, and VC3, respectively, were plotted as shown in Figure 15. The above dates are at the end of stage one, stage two, and stage three, corresponding to the advancing lengths L of the 2401 workings of 117.6 m, 512.5 m, and 1022.3 m, respectively.
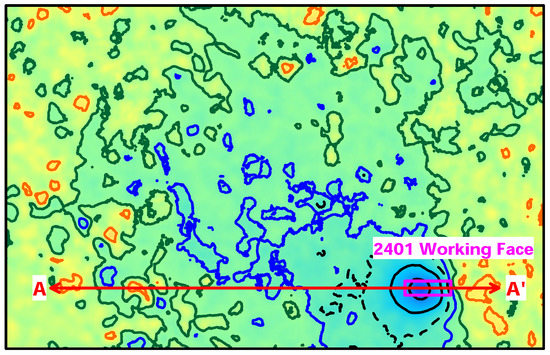
Figure 14.
Profile line AA′ along the strike of the 2401 working face.
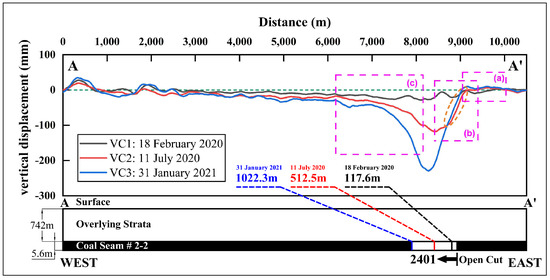
Figure 15.
Cumulative vertical displacement curves on the profile line AA′. (a) is the area where ground uplift occurs directly above the open cut. (b) is the area where ground uplift occurs to the east of the open cut. (c) is the area where the overall ground subsidence occurs in front of the working face.
Overall, with the increase of L, the range affected by the mining gradually increased, the mining influence range gradually enlarged, and the maximum settlement also increased from 30 mm to 118 mm and finally reached 230 mm. Attention should be focused on the phenomenon that there was a slight uplift near the ground surface directly above the open cutting, as shown in the rectangle (a) and (b) in Figure 15. Figure 16a,b are partial enlarged views of two rectangles respectively.
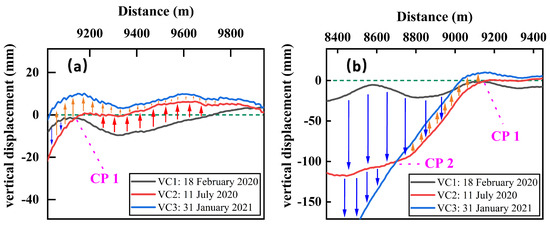
Figure 16.
Partial enlargement views of the cumulative vertical displacement curves above the open cut: (a) Area to the east of the open cut. (b) Area directly above the open cut.
Within the region shown in Figure 16a, the vertical displacement from the ground surface is dominated by a slight uplift of less than 20 mm. There exists an intersection point of vertical displacement curves VC1 and VC2, abbreviated as CP1. During the transition from VC1 to VC2, the relative vertical displacement of the surface on the left side of CP1 is in the form of subsidence, while on the right side, it is in the form of an uplift. It indicaes that the surface in region (a) underwent a rotation with CP1 as the center from 18 February 2020 to 11 July 2020. The above rotation phenomenon also existed between 11 July 2020 and 31 January 2021. Only the center of rotation was shifted from CP1 to CP2 along the advancing direction of the working face, as shown in Figure 16b. Therefore, it can be concluded that the uplift on the east side of the open cut is actually part of the overburden rotation. Studies [52,53] have shown that the thicker the rock stratum is, the higher the bearing capacity it has and it is more prone to rotation. The thickness of the Cretaceous Zhidan Group rock formation in the strata of this study area is generally over 300 m. Therefore, it is likely that the ultrathickness of the weak stratum caused the rotational motion characteristics during the overburden movement.
In contrast, there is no uplift on the ground in front of the working surface, but an overall downward bending occurs, as shown in the rectangle (c) in Figure 15. The characteristics of the surface vertical displacement in those two regions indicate that there is an apparent difference in the state of the stress distribution and overburden structure between the overburden in front of the working face and that directly above the open cut.
5.2. Influence of Groundwater and Aeolian Sand
Based on the SBAS-InSAR settlement monitoring results, it can be seen that the subsidence in the study area is very slight. According to the key stratum theory [54,55], it can be presumed that the stratum, which plays an overall controlling role on the surface settlement, is in a state of bending deformation but not yet destroyed. By analyzing the stratigraphic structure of the study area, it is clear that the giant thick weakly cemented sandstone layer with an average thickness of 341.33 m is the key strata that plays a role in controlling surface subsidence. However, due to the loose structure and high porosity, it is strongly permeable and has a certain hydraulic connection with the aeolian sand layer Q. Therefore, when the bending occurs, the groundwater in the two rock layers is transferred from all around to the bottom of the bending center along the original channels or newborn fine fissures. During the process, the groundwater in the nearby subsidence area migrates to the central zone of the basin, especially the area in front of the working face. On the other hand, after the migration of groundwater occurs, under the effect of gravity, the pores in the aeolian sand layer Q that used to be water-filled are immediately occupied by the surrounding sand particles, causing the compaction phenomenon of the aeolian sand layer, which in turn causes the surface subsidence, as shown in Figure 17.
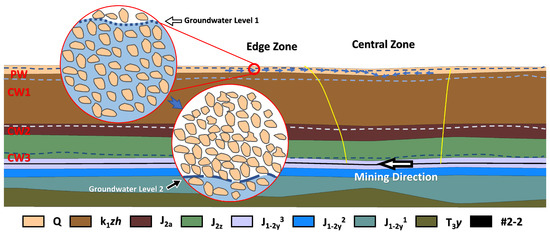
Figure 17.
The pore filling effect of aeolian sand layer in the initial mining.
This is a typical soil consolidation phenomenon, similar to the surface settlement caused by direct groundwater pumping [56]. The latest research [57,58] shows that in the excavation process of geotechnical engineering such as deep buried pits, the pumping and drainage of groundwater will cause a large area of ground settlement, and if groundwater is not supplied effectively in time, permanent compression deformation will occur in the overlying strata under the consolidation of soil. Consequently, it can explain the widespread coverage of surface subsidence basins in the study area, and the sporadic subsidence along with the haphazard boundary.
5.3. Influence of Giant Thick Weakly Cemented Overburden
The analysis in Section 4.3 shows that the surface subsidence basins in the study area were suspended in the process of outward expansion. Combined with the key strata theory, it can be preliminarily considered that this phenomenon reflects the relative equilibrium stage of strata controlling surface subsidence in the process of overburden movement.
The theory of the three-zone distribution [59] in the extraction area divides the overburden into a collapse zone, a fracture zone, and a bending zone from bottom to top. With the extension of the mining area, the development height of the collapse zone and the fissure zone gradually increases, while the thickness of the bending zone gradually reduces. Considering the stratigraphic structural characteristics of the study area, it is clear that the giant thick Cretaceous weakly cemented sandstone layer is the key strata controlling surface subsidence and is also the major component of the bending zone. Bounded by the rock floor, the bending zone is further divided into two regions. Taking the floor of the rock stratum as the boundary, the bending zone is further divided into two regions, namely the upper bending zone (UBZ) and the lower bending zone (LBZ). Before mining activities, the LBZ zone basically has an upward supporting force on the UBZ. As the working face continuously advances, the supporting force gradually decreases until it reaches zero. Subsequently, the force of the LBZ on the UBZ is transformed into a downward tension. The magnitude of the tensile force increases as L enlarges at first. However, when L reaches a certain value, the deformation of the lowermost rock in the LBZ exceeds the limit, and the breakdown occurs. As a result, the tension effect of the LBZ on the UBZ is released to a certain extent. Combined with the fact of the basin paused expansion, it can be seen that although the lateral range of the UBZ is expanded and the gravity is relatively increased, the sum of the increased gravity and the decreased tension does not change significantly, but is exactly balanced with the support force of the surrounding rock body on the UBZ. After the broken section reaches a certain range, the increase of gravity exceeds the decrease of tension, so the equilibrium state of the UBZ is broken again, and the surface continues to deform synchronously with the giant thick weakly cemented rock layer.
Recently, some researchers have also found similar results during the dewatering of deep buried confined aquifers [60,61]. That is, the strata above the pumped confined aquifer experience tension stress and show some tensile deformations. Moreover, the essence is considered to be the relief of the pore water pressure. The above-mentioned force transformation process of the LBZ on the UBZ described in this paper is essentially the decompression of strata stress during coal mining. In fact, both the decompression of strata stress and the relief of the pore water pressure are essentially the unloading process. Therefore, this study summarizes the mechanism of the suspended expansion of the surface subsidence basin as “the unloading equilibrium of weakly cemented overburden”, which is illustrated in Figure 18.
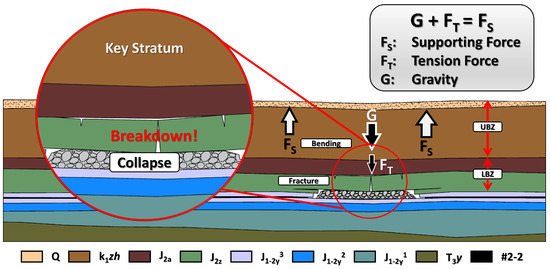
Figure 18.
The unloading equilibrium of weakly cemented overburden.
6. Conclusions
In this paper, the time series of surface subsidence during the mining process of the 2401 working face in the Yingpanhao coal mine, a deep mining area in the aeolian sand area of Western China, were obtained based on the SBAS-InSAR technology. According to the calculation results, the relationship between the geometric characteristics (shape and coverage area) of the surface subsidence basin and the advancing length of the working face in the study area was analyzed, and the following insights were obtained:
(1) Under the condition of insufficient deep mining in the western aeolian sand area, the settlement area covered a wide area with a low value of settlement. When the advancing length of the 2401 working face reached 1022.3 m, the maximum surface subsidence was only about 250 mm, and the area of subsidence area reached 48.52 km2.
(2) The abnormal uplift phenomenon on the east side of the open cut was essentially part of the overburden rotation during the advancing process of the 2401 working face. By contrast, there merely existed an overall downward bending on the surface in front of the working face. The characteristics of the surface vertical displacement in those two regions indicated that there was an apparent difference in the state of stress distribution and overburden structure between the overburden in front of the working face and that directly above the open cut.
(3) According to the shape characteristics, the surface subsidence basins in the study area were divided into a central zone and an edge zone. The central zone was located directly above the 2401 working face, and its shape underwent a change from circular to oval, covering only one fifth of the total subsidence basin coverage. The edge zone was located in front of the working face, and its shape changed significantly, experiencing the circular-parallelogram-trapezoid change. The difference in shape reflected that the settlement mechanisms of the two zone were essentially different. It was concluded that the subsidence in the central zone was directly related to the mining activities, whereas a large-scale settlement in the edge zone was associated with the soil consolidation induced by the decline of groundwater.
(4) The quantitative relationship between the coverage area of the subsidence basin and the advancing length of the working face indicated that the outward expansion process of the surface subsidence basin in the study area was divided into a linear increasing period, a temporary stagnation period, and a re-expansion period. The temporary suspension of the expansion reflected the temporary relative equilibrium state of the giant thick and weakly cemented sandstone layer that controlled the surface subsidence. Based on the three-zone distribution theory of goaf, the bending zone was divided into the UBZ and the LBZ. When the advancing length of the 2401 working face reached 732.6 m, the rock layer at the bottom of the LBZ was broken, and the tension force of the UBZ by the LBZ was reduced. The UBZ reached a relative mechanical equilibrium state under the action of gravity, tension and the support force of the surrounding rock until the advancing length of the 2401 working face exceeded 971.5 m.
The research work in this paper provides an important reference for a reasonable solution to the contradiction between the exploitation of underground coal resources and the groundwater, as well as the ecological protection of the environment in the aeolian sand mining area located in Western China. Since the 2401 workings had been mined before the study was conducted, there was a lack of groundwater level observation data and overburden internal deformation damage observation data. It is recommended that the abovementioned missing data are collected to conduct an actual measurement test or an experimental verification from other mining activities to study the phenomenon and analytical results mentioned in this paper, so as to further clarify the mechanism of strata movement after deep coal resources mining in the aeolian sand area.
Author Contributions
Conceptualization, Q.D. and G.G.; methodology, Q.D.; software, Q.D.; validation, H.L. and Y.G.; formal analysis, Q.D.; investigation, Y.G.; resources, Q.D. and G.G.; data curation, Q.D. and Y.G.; writing—original draft preparation, Q.D.; writing—review and editing, G.G. and H.L.; visualization, Q.D.; supervision, G.G.; project administration, G.G.; funding acquisition, G.G. and Q.D. All authors have read and agreed to the published version of the manuscript.
Funding
This work was funded by the National Natural Science Foundation of China (Grant No. 51974292), the Future Scientists Program of China University of Mining and Technology (Grant No. 2020WLKXJ052), and the Postgraduate Research & Practice Innovation Program of Jiangsu Province (Grant No. KYCX20_2004).
Data Availability Statement
Not applicable.
Acknowledgments
The authors thank Yingpanhao Coal Mine for providing the geological and hydrogeological data, the European Space Agency and the Alaska Satellite Facility Distributed Active Archive Center (ASF DAAC) for providing the Sentinel-1 SAR data, and METI and NASA for developing and providing the ASTER GDEM V2 data. The authors are grateful to the editors and anonymous reviewers for their valuable suggestions which greatly help to improve the original manuscript.
Conflicts of Interest
The authors declare no conflict of interest.
References
- Cui, X.; Gao, Y.; Yuan, D. Sudden Surface Collapse Disasters Caused by Shallow Partial Mining in Datong Coalfield, China. Nat. Hazards 2014, 74, 911–929. [Google Scholar] [CrossRef]
- Xu, Y.; Wu, K.; Bai, Z.; Hu, Z. Theoretical Analysis of the Secondary Development of Mining-Induced Surface Cracks in the Ordos Region. Environ. Earth Sci. 2017, 76, 703. [Google Scholar] [CrossRef]
- Li, L.; Wu, K.; Hu, Z.; Xu, Y.; Zhou, D. Analysis of Developmental Features and Causes of the Ground Cracks Induced by Oversized Working Face Mining in an Aeolian Sand Area. Environ. Earth Sci. 2017, 76, 135. [Google Scholar] [CrossRef]
- Xu, Y.; Wu, K.; Li, L.; Zhou, D.; Hu, Z. Ground Cracks Development and Characteristics of Strata Movement under Fast Excavation: A Case Study at Bulianta Coal Mine, China. Bull. Eng. Geol. Environ. 2019, 78, 325–340. [Google Scholar] [CrossRef]
- Dawei, Z.; Kan, W.; Zhihui, B.; Zhenqi, H.; Liang, L.; Yuankun, X.; Xinpeng, D. Formation and Development Mechanism of Ground Crack Caused by Coal Mining: Effects of Overlying Key Strata. Bull. Eng. Geol. Environ. 2019, 78, 1025–1044. [Google Scholar] [CrossRef]
- Yang, X.; Wen, G.; Dai, L.; Sun, H.; Li, X. Ground Subsidence and Surface Cracks Evolution from Shallow-Buried Close-Distance Multi-Seam Mining: A Case Study in Bulianta Coal Mine. Rock Mech. Rock Eng. 2019, 52, 2835–2852. [Google Scholar] [CrossRef]
- Zhang, D.; Fan, G.; Ma, L.; Wang, X. Aquifer Protection during Longwall Mining of Shallow Coal Seams: A Case Study in the Shendong Coalfield of China. Int. J. Coal Geol. 2011, 86, 190–196. [Google Scholar] [CrossRef]
- Shi, P.; Zhang, Y.; Hu, Z.; Ma, K.; Wang, H.; Chai, T. The Response of Soil Bacterial Communities to Mining Subsidence in the West China Aeolian Sand Area. Appl. Soil Ecol. 2017, 121, 1–10. [Google Scholar] [CrossRef]
- Yan, W.; Dai, H.; Chen, J. Surface Crack and Sand Inrush Disaster Induced by High-Strength Mining: Example from the Shendong Coal Field, China. Geosci. J. 2018, 22, 347–357. [Google Scholar] [CrossRef]
- He, X.; Zhao, Y.; Yang, K.; Zhang, C.; Han, P. Development and Formation of Ground Fissures Induced by an Ultra Large Mining Height Longwall Panel in Shendong Mining Area. Bull. Eng. Geol. Environ. 2021, 80, 7879–7898. [Google Scholar] [CrossRef]
- Fu, Y.; Shang, J.; Hu, Z.; Li, P.; Yang, K.; Chen, C.; Guo, J.; Yuan, D. Ground Fracture Development and Surface Fracture Evolution in N00 Method Shallowly Buried Thick Coal Seam Mining in an Arid Windy and Sandy Area: A Case Study of the Ningtiaota Mine (China). Energies 2021, 14, 7712. [Google Scholar] [CrossRef]
- Zhang, G.; Guo, G.; Lv, Y.; Gong, Y. Study on the Strata Movement Rule of the Ultrathick and Weak Cementation Overburden in Deep Mining by Similar Material Simulation: A Case Study in China. Math. Probl. Eng. 2020, 2020, 7356740. [Google Scholar] [CrossRef]
- Gong, Y.; Guo, G.; Zhang, G.; Guo, K.; Du, Q.; Wang, L. A Vertical Joint Spacing Calculation Method for UDEC Modeling of Large-Scale Strata and Its Influence on Mining-Induced Surface Subsidence. Sustainability 2021, 13, 13313. [Google Scholar] [CrossRef]
- Chen, S.; Qu, X.; Yin, D.; Liu, X.; Ma, H.; Wang, H. Investigation Lateral Deformation and Failure Characteristics of Strip Coal Pillar in Deep Mining. Geomech. Eng. 2018, 14, 421–428. [Google Scholar]
- Xie, J.; Xu, J.; Wang, F. Mining-Induced Stress Distribution of the Working Face in a Kilometer-Deep Coal Mine—A Case Study in Tangshan Coal Mine. J. Geophys. Eng. 2018, 15, 2060–2070. [Google Scholar] [CrossRef] [Green Version]
- Gao, M.; Xie, J.; Guo, J.; Lu, Y.; He, Z.; Li, C. Fractal Evolution and Connectivity Characteristics of Mining-Induced Crack Networks in Coal Masses at Different Depths. Geomech. Geophys. Geo-Energy Geo-Resour. 2021, 7, 9. [Google Scholar] [CrossRef]
- Zhao, K.; Zhou, Y.; Yu, X.; Yan, Y.; Song, Y.; Wang, J.; Suo, T.; Guo, X. Dynamic Prediction Model of Overburden Settlement in Deep Mining Areas Based on Space–Time Relationship. Nat. Resour. Res. 2021, 30, 3839–3852. [Google Scholar] [CrossRef]
- Stramondo, S.; Saroli, M.; Tolomei, C.; Moro, M.; Doumaz, F.; Pesci, A.; Loddo, F.; Baldi, P.; Boschi, E. Surface Movements in Bologna (Po Plain-Italy) Detected by Multitemporal DInSAR. Remote Sens. Environ. 2007, 110, 304–316. [Google Scholar] [CrossRef]
- Castañeda, C.; Gutiérrez, F.; Manunta, M.; Galve, J.P. DInSAR Measurements of Ground Deformation by Sinkholes, Mining Subsidence, and Landslides, Ebro River, Spain. Earth Surf. Process. Landf. 2009, 34, 1562–1574. [Google Scholar] [CrossRef] [Green Version]
- Calo, F.; Ardizzone, F.; Castaldo, R.; Lollino, P.; Tizzani, P.; Guzzetti, F.; Lanari, R.; Angeli, M.-G.; Pontoni, F.; Manunta, M. Enhanced Landslide Investigations through Advanced DInSAR Techniques: The Ivancich Case Study, Assisi, Italy. Remote Sens. Environ. 2014, 142, 69–82. [Google Scholar] [CrossRef] [Green Version]
- Ferretti, A.; Prati, C.; Rocca, F. Permanent Scatterers in SAR Interferometry. IEEE Trans. Geosci. Remote Sens. 2001, 39, 8–20. [Google Scholar] [CrossRef]
- Berardino, P.; Fornaro, G.; Lanari, R.; Sansosti, E. A New Algorithm for Surface Deformation Monitoring Based on Small Baseline Differential SAR Interferograms. IEEE Trans. Geosci. Remote Sens. 2002, 40, 2375–2383. [Google Scholar] [CrossRef] [Green Version]
- Lanari, R.; Mora, O.; Manunta, M.; Mallorqui, J.J.; Berardino, P.; Sansosti, E. A Small-Baseline Approach for Investigating Deformations on Full-Resolution Differential SAR Interferograms. IEEE Trans. Geosci. Remote Sens. 2004, 42, 1377–1386. [Google Scholar] [CrossRef]
- Pepe, A.; Berardino, P.; Bonano, M.; Daniel Euillades, L.; Lanari, R.; Sansosti, E. SBAS-Based Satellite Orbit Correction for the Generation of DInSAR Time-Series: Application to RADARSAT-1 Data. IEEE Trans. Geosci. Remote Sens. 2011, 49, 5150–5165. [Google Scholar] [CrossRef]
- Puglisi, G.; Bonforte, A.; Ferretti, A.; Guglielmino, F.; Palano, M.; Prati, C. Dynamics of Mount Etna before, during, and after the July–August 2001 Eruption Inferred from GPS and Differential Synthetic Aperture Radar Interferometry Data. J. Geophys. Res. 2008, 113, B06405. [Google Scholar] [CrossRef] [Green Version]
- D’Auria, L.; Giudicepietro, F.; Aquino, I.; Borriello, G.; Del Gaudio, C.; Lo Bascio, D.; Martini, M.; Ricciardi, G.P.; Ricciolino, P.; Ricco, C. Repeated Fluid-Transfer Episodes as a Mechanism for the Recent Dynamics of Campi Flegrei Caldera (1989–2010). J. Geophys. Res. 2011, 116, B04313. [Google Scholar] [CrossRef]
- Shirzaei, M. A Wavelet-Based Multitemporal DInSAR Algorithm for Monitoring Ground Surface Motion. IEEE Geosci. Remote Sens. Lett. 2013, 10, 456–460. [Google Scholar] [CrossRef]
- Anantrasirichai, N.; Biggs, J.; Albino, F.; Bull, D. A Deep Learning Approach to Detecting Volcano Deformation from Satellite Imagery Using Synthetic Datasets. Remote Sens. Environ. 2019, 230, 111179. [Google Scholar] [CrossRef] [Green Version]
- Lavecchia, G.; Castaldo, R.; Nardis, R.; De Novellis, V.; Ferrarini, F.; Pepe, S.; Brozzetti, F.; Solaro, G.; Cirillo, D.; Bonano, M.; et al. Ground Deformation and Source Geometry of the 24 August 2016 Amatrice Earthquake (Central Italy) Investigated through Analytical and Numerical Modeling of DInSAR Measurements and Structural-geological Data. Geophys. Res. Lett. 2016, 43, 12389–12398. [Google Scholar] [CrossRef]
- Barnhart, W.D.; Yeck, W.L.; McNamara, D.E. Induced Earthquake and Liquefaction Hazards in Oklahoma, USA: Constraints from InSAR. Remote Sens. Environ. 2018, 218, 1–12. [Google Scholar] [CrossRef]
- He, P.; Wen, Y.; Xu, C.; Chen, Y. Complete Three-Dimensional near-Field Surface Displacements from Imaging Geodesy Techniques Applied to the 2016 Kumamoto Earthquake. Remote Sens. Environ. 2019, 232, 111321. [Google Scholar] [CrossRef]
- Milczarek, W. Investigation of Post Inducted Seismic Deformation of the 2016 MW 4.2 Tarnowek Poland Mining Tremor Based on DinSAR and SBAS Method. Acta Geodyn. Geomater. 2019, 16, 183–193. [Google Scholar] [CrossRef]
- Song, X.; Han, N.; Shan, X.; Wang, C.; Zhang, Y.; Yin, H.; Zhang, G.; Xiu, W. Three-Dimensional Fault Geometry and Kinematics of the 2008 M 7.1 Yutian Earthquake Revealed by Very-High Resolution Satellite Stereo Imagery. Remote Sens. Environ. 2019, 232, 111300. [Google Scholar] [CrossRef]
- Fathian, A.; Atzori, S.; Nazari, H.; Reicherter, K.; Salvi, S.; Svigkas, N.; Tatar, M.; Tolomei, C.; Yaminifard, F. Complex Co- and Postseismic Faulting of the 2017–2018 Seismic Sequence in Western Iran Revealed by InSAR and Seismic Data. Remote Sens. Environ. 2021, 253, 112224. [Google Scholar] [CrossRef]
- Dong, J.; Zhang, L.; Tang, M.; Liao, M.; Xu, Q.; Gong, J.; Ao, M. Mapping Landslide Surface Displacements with Time Series SAR Interferometry by Combining Persistent and Distributed Scatterers: A Case Study of Jiaju Landslide in Danba, China. Remote Sens. Environ. 2018, 205, 180–198. [Google Scholar] [CrossRef]
- Hu, X.; Bürgmann, R.; Lu, Z.; Handwerger, A.L.; Wang, T.; Miao, R. Mobility, Thickness, and Hydraulic Diffusivity of the Slow-Moving Monroe Landslide in California Revealed by L-Band Satellite Radar Interferometry. J. Geophys. Res. Solid Earth 2019, 124, 7504–7518. [Google Scholar] [CrossRef] [Green Version]
- Bekaert, D.P.S.; Handwerger, A.L.; Agram, P.; Kirschbaum, D.B. InSAR-Based Detection Method for Mapping and Monitoring Slow-Moving Landslides in Remote Regions with Steep and Mountainous Terrain: An Application to Nepal. Remote Sens. Environ. 2020, 249, 111983. [Google Scholar] [CrossRef]
- Jia, H.; Wang, Y.; Ge, D.; Deng, Y.; Wang, R. Improved Offset Tracking for Predisaster Deformation Monitoring of the 2018 Jinsha River Landslide (Tibet, China). Remote Sens. Environ. 2020, 247, 111899. [Google Scholar] [CrossRef]
- Gong, W.; Darrow, M.M.; Meyer, F.J.; Daanen, R.P. Reconstructing Movement History of Frozen Debris Lobes in Northern Alaska Using Satellite Radar Interferometry. Remote Sens. Environ. 2019, 221, 722–740. [Google Scholar] [CrossRef]
- Wang, L.; Marzahn, P.; Bernier, M.; Ludwig, R. Sentinel-1 InSAR Measurements of Deformation over Discontinuous Permafrost Terrain, Northern Quebec, Canada. Remote Sens. Environ. 2020, 248, 111965. [Google Scholar] [CrossRef]
- Liao, H.; Wdowinski, S.; Li, S. Regional-Scale Hydrological Monitoring of Wetlands with Sentinel-1 InSAR Observations: Case Study of the South Florida Everglades. Remote Sens. Environ. 2020, 251, 112051. [Google Scholar] [CrossRef]
- Baek, J.; Kim, S.-W.; Park, H.-J.; Jung, H.-S.; Kim, K.-D.; Kim, J.W. Analysis of Ground Subsidence in Coal Mining Area Using SAR Interferometry. Geosci. J. 2008, 12, 277–284. [Google Scholar] [CrossRef]
- Yang, Z.F.; Li, Z.W.; Zhu, J.J.; Hu, J.; Wang, Y.J.; Chen, G.L. InSAR-Based Model Parameter Estimation of Probability Integral Method and Its Application for Predicting Mining-Induced Horizontal and Vertical Displacements. IEEE Trans. Geosci. Remote Sens. 2016, 54, 4818–4832. [Google Scholar] [CrossRef]
- Bateson, L.; Cigna, F.; Boon, D.; Sowter, A. The Application of the Intermittent SBAS (ISBAS) InSAR Method to the South Wales Coalfield, UK. Int. J. Appl. Earth Obs. 2015, 34, 249–257. [Google Scholar] [CrossRef] [Green Version]
- Gee, D.; Bateson, L.; Grebby, S.; Novellino, A.; Sowter, A.; Wyatt, L.; Marsh, S.; Morgenstern, R.; Athab, A. Modelling Groundwater Rebound in Recently Abandoned Coalfields Using DInSAR. Remote Sens. Environ. 2020, 249, 112021. [Google Scholar] [CrossRef]
- Kim, J.; Lin, S.-Y.; Singh, R.P.; Lan, C.-W.; Yun, H.-W. Underground Burning of Jharia Coal Mine (India) and Associated Surface Deformation Using InSAR Data. Int. J. Appl. Earth Obs. 2021, 103, 102524. [Google Scholar] [CrossRef]
- Lee, S.-K.; Kugler, F.; Papathanassiou, K.P.; Hajnsek, I. Quantification of Temporal Decorrelation Effects at L-Band for Polarimetric SAR Interferometry Applications. IEEE J. Sel. Top. Appl. Earth Observ. Remote Sens. 2013, 6, 1351–1367. [Google Scholar] [CrossRef]
- Necsoiu, M.; Walter, G.R. Detection of Uranium Mill Tailings Settlement Using Satellite-Based Radar Interferometry. Eng. Geol. 2015, 197, 267–277. [Google Scholar] [CrossRef] [Green Version]
- Wang, L.; Teng, C.; Jiang, K.; Jiang, C.; Zhu, S. D-InSAR Monitoring Method of Mining Subsidence Based on Boltzmann and Its Application in Building Mining Damage Assessment. KSCE J. Civ. Eng. 2022, 26, 353–370. [Google Scholar] [CrossRef]
- Fan, H.D.; Cheng, D.; Deng, K.Z.; Chen, B.Q.; Zhu, C.G. Subsidence Monitoring Using D-InSAR and Probability Integral Prediction Modelling in Deep Mining Areas. Surv. Rev. 2015, 47, 438–445. [Google Scholar] [CrossRef]
- Casu, F.; Manzo, M.; Lanari, R. A Quantitative Assessment of the SBAS Algorithm Performance for Surface Deformation Retrieval from DInSAR Data. Remote Sens. Environ. 2006, 102, 195–210. [Google Scholar] [CrossRef]
- Wang, F.; Xu, J.; Xie, J. Effects of Arch Structure in Unconsolidated Layers on Fracture and Failure of Overlying Strata. Int. J. Rock Mech. Min. Sci. 2019, 114, 141–152. [Google Scholar] [CrossRef]
- Li, Z.; Dou, L.; Cai, W.; Wang, G.; He, J.; Gong, S.; Ding, Y. Investigation and Analysis of the Rock Burst Mechanism Induced within Fault-Pillars. Int. J. Rock Mech. Min. Sci. 2014, 70, 192–200. [Google Scholar] [CrossRef]
- Kuang, T.; Li, Z.; Zhu, W.; Xie, J.; Ju, J.; Liu, J.; Xu, J. The Impact of Key Strata Movement on Ground Pressure Behaviour in the Datong Coalfield. Int. J. Rock Mech. Min. 2019, 119, 193–204. [Google Scholar] [CrossRef]
- Wang, X.; Xie, J.; Zhu, W.; Xu, J. The Field Monitoring Experiment of the High-Level Key Stratum Movement in Coal Mining Based on Collaborative DOFS and MPBX. Sci. Rep. 2022, 12, 665. [Google Scholar] [CrossRef] [PubMed]
- Wu, Y.-X.; Lyu, H.-M.; Han, J.; Shen, S.-L. Dewatering—Induced Building Settlement around a Deep Excavation in Soft Deposit in Tianjin, China. J. Geotech. Geoenviron. Eng. 2019, 145, 05019003. [Google Scholar] [CrossRef]
- Zeng, C.-F.; Wang, S.; Xue, X.-L.; Zheng, G.; Mei, G.-X. Evolution of Deep Ground Settlement Subject to Groundwater Drawdown during Dewatering in a Multi-Layered Aquifer-Aquitard System: Insights from Numerical Modelling. J. Hydrol. 2021, 603, 127078. [Google Scholar] [CrossRef]
- Zeng, C.-F.; Wang, S.; Xue, X.-L.; Zheng, G.; Mei, G.-X. Characteristics of Ground Settlement Due to Combined Actions of Groundwater Drawdown and Enclosure Wall Movement. Acta Geotech. 2022. [Google Scholar] [CrossRef]
- Qu, Q.; Xu, J.; Wu, R.; Qin, W.; Hu, G. Three-Zone Characterisation of Coupled Strata and Gas Behaviour in Multi-Seam Mining. Int. J. Rock Mech. Min. 2015, 78, 91–98. [Google Scholar] [CrossRef]
- Zeng, C.-F.; Zheng, G.; Xue, X.-L. Responses of Deep Soil Layers to Combined Recharge in a Leaky Aquifer. Eng. Geol. 2019, 260, 105263. [Google Scholar] [CrossRef]
- Li, M.-G.; Chen, J.-J.; Xia, X.-H.; Zhang, Y.-Q.; Wang, D.-F. Statistical and Hydro-Mechanical Coupling Analyses on Groundwater Drawdown and Soil Deformation Caused by Dewatering in a Multi-Aquifer-Aquitard System. J. Hydrol. 2020, 589, 125365. [Google Scholar] [CrossRef]
Publisher’s Note: MDPI stays neutral with regard to jurisdictional claims in published maps and institutional affiliations. |
© 2022 by the authors. Licensee MDPI, Basel, Switzerland. This article is an open access article distributed under the terms and conditions of the Creative Commons Attribution (CC BY) license (https://creativecommons.org/licenses/by/4.0/).