Article

A Registration Method for Dual-Frequency, High-Spatial-Resolution SAR Images

College of Electronic Science and Technology, National University of Defense Technology, Changsha 410073, China
*
Author to whom correspondence should be addressed.
Remote Sens. 2022, 14(10), 2509; https://doi.org/10.3390/rs14102509
Submission received: 12 May 2022 / Accepted: 18 May 2022 / Published: 23 May 2022

Abstract

:
With the continuous development of synthetic-aperture-radar (SAR) technology, SAR-image data are becoming increasingly abundant. For the same scene, dual-frequency (high-frequency and low-frequency) SAR images can present different details and feature information. Image fusion of the two frequencies can combine the advantages of both, thus describing targets more comprehensively. Image registration is the key step of image fusion and determines the quality of fusion. Due to the complex geometric distortion and gray variance between dual-frequency SAR images with high resolution, it is difficult to realize accurate registration between the two. In order to solve this problem, this paper proposes a method to achieve accurate registration by combining edge features and gray information. Firstly, this paper applies the edge features of images and a registration algorithm based on fast Fourier transform (FFT) to realize rapid coarse registration. Then, combining a registration algorithm based on the enhanced correlation coefficient (ECC) with the concept of segmentation, the coarse-registration result is registered to achieve accurate registration. Finally, by processing the airborne L-band and Ku-band SAR data, the correctness, effectiveness, and practicability of the proposed method are verified, with a root mean square error (RMSE) of less than 2.

Graphical Abstract

1. Introduction

Synthetic aperture radar (SAR) is a microwave-imaging radar system that can achieve high-resolution imaging [1]. As an active means of microwave remote sensing, SAR offers all-time and all-weather reconnaissance and strong surface penetration, which are widely used in environmental protection, military reconnaissance, surface mapping, disaster assessment, and other fields. In recent years, SAR technology has made rapid developments, and the resolution of SAR images is constantly improving and has reached sub-meter levels. Compared to moderate- or low-resolution SAR images, high-resolution SAR images contain more details and texture information and can better represent the detailed structural characteristics of the target [2].
With the increasing requirements of reconnaissance technology in anti-spoofing, anti-jamming, anti-camouflage, and other applications, it is difficult for a single SAR system to meet the necessary requirements. Multi-mode, multi-polarization, and multi-band SAR technology has thus become an important development direction, and the multi-band SAR technology has been rapidly developed [3]. Compared to a single-band SAR system, the richness and diversity of information expression and the urgency of information processing in multi-band SAR systems greatly improve the complexity of information processing. The use of multi-source information-fusion technology can reduce the workload of manual information processing and improve the fault tolerance and robustness of the system, which is a key factor of multi-band SAR systems [4].
In practical applications, the characteristics of transmission and backscattering are different for different bands, which leads to different limitations and advantages among SAR images with different bands [5]. For the same scene, when the resolutions of SAR images are the same or similar, a high-frequency SAR image can obtain a clearer outline of the scene and richer detailed features of the target that are closer to those of an optical image. However, as the penetration of high-frequency electromagnetic waves is poor, high-frequency SAR images have difficulty representing hidden targets. Low-frequency SAR images are dim and have difficulty describing the details of targets. However, they have strong penetrating power and can image hidden targets better, such as scenes and hidden targets in the woods or under the ground. Therefore, fusing SAR images from different bands and synthesizing the information from different bands are beneficial for image interpretation, which is of great significance in military reconnaissance, disaster monitoring, etc.
For SAR-image fusion in different bands, the image-registration technique is a critical step. The registration accuracy will directly affect the results of subsequent image processing. Image registration is the process of aligning two or more images of the same scene with different acquisition conditions, sensors, and viewpoints at the pixel level or sub-pixel level [6]. Each registration method is not universal, so since the concept of image registration was put forward, many image-registration methods have appeared. In 2003, Zitova Barbara and Jan Flusser comprehensively and deeply investigated the available image-registration methods [7]. The authors analyzed and classified these methods, which were mainly divided into intensity-based registration methods, feature-based registration methods, and transform-domain-based registration methods.
The intensity-based registration method directly uses the gray values of images to calculate spatial transformation. This method usually defines a certain similarity-measurement criterion to measure the similarity of gray information between images and uses a certain search algorithm to obtain the extreme value of similarity, thus determining the transformation parameters and realizing image registration [8,9]. However, this kind of method is sensitive to light and has poor anti-noise abilities. The feature-based registration method first extracts the feature information of images (such as point, line, and area features), which is then taken as the basis of registration. Using a matching method to match the feature information, this method ultimately determines the registration parameters between two images through the matching relationship. This method does not directly use the gray information of images and has a certain adaptability to the gray differences, rotation, translation, and scale transformation between images [10]. However, this method is computationally expensive and has poor real-time features. The registration method based on the transform domain utilizes fast Fourier transform (FFT) and other principles. It can estimate the rotation, scale, and translation parameters between images well, and has an anti-interference ability to combat low-frequency noise in images [11,12]. Even if the images are obtained in different brightness situations, this method still works well and has better real-time features than other techniques [13,14,15,16,17]. However, it is limited by the properties of the corresponding transformation; when the transformation form between images is complex, the transformation needs to be solved by a more advanced algorithm.
For the same scene, there is a large difference in gray information when SAR images are located in different bands. At the same time, because of the greater amount of details and texture information contained in high-resolution SAR images, there are more complex geometric distortions between high-resolution SAR images in different bands, making it difficult to achieve accurate registration using traditional registration methods. For the registration of multi-band SAR images, in 2005, based on edge features, Chang et al. realized the relatively high-precision registration of multi-band SAR images with low resolution [18]. In addition, this method can achieve the registration of multi-band SAR images with large scenes by segmenting edge features. However, this method needs to select a certain number of registration control points, resulting in increased time costs. Fan et al. proposed an SAR-image-registration method based on phase congruency and nonlinear diffusion combined with a scale-invariant feature transform (SIFT) [19]. The experimental results of multi-band SAR images showed that this algorithm can improve the matching performance and achieve better accuracy than SIFT-based methods. However, due to the impact of speckle noise in SAR images, this method, which is based on feature points, has difficulty obtaining results with high precision. In 2014, Zhou et al. proposed automatic image registration based on both global and local methods [6]. This method has distinctive characteristics and robustness in the overall registration of SAR images with different bands. However, the thin-plate spline is not improved under this method, resulting in a low degree of improvement in local registration accuracy. Moreover, the time costs of this method are larger.
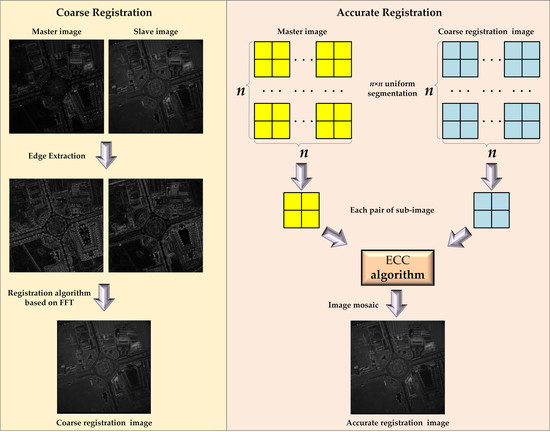
To solve the above problems, this paper proposes a registration method that is suitable for high-resolution SAR images from different bands. Firstly, based on the edge features of SAR images, we use an image-registration algorithm based on FFT to realize the coarse registration of high-resolution SAR images in different bands and thus correct the rotation, translation, and scale of the overall image. Then, we use the image-registration algorithm based on maximizing the enhanced correlation coefficient (ECC), combined with the concept of segmentation to correct the local geometric distortion between coarse-registration images, thus achieving the high-precision registration of different bands’ high-resolution SAR images. To make the experiment more convincing, we use Ku-band and L-band data, which are independently measured to verify these experiments.
This paper is organized as follows. In Section 2, the basic principles of the coarse image-registration method based on edge features and FFT are introduced. In Section 3, the accurate image-registration method based on the ECC is introduced. In Section 4, the experimental results are analyzed to verify the effectiveness of the method. Section 5 provides a summary of the paper.

2. The Method of Coarse Image Registration Based on Edge Features and FFT

For high-resolution SAR images with different bands, there exists a large gray difference and geometric distortion. The gray relationship is generally nonlinear. Therefore, in order to achieve accurate registration, it is necessary to overcome the nonlinear difference of gray information between images. The usual solution is to find the same information between images and then match the identical object positions in the images. Due to imaging of the same scene, the edge features of different images show strong consistency. Therefore, the interference caused by the nonlinear gray difference between images can be better solved by registering SAR images from different bands with a high resolution based on edge features.
The image-registration algorithm based on FFT offers rapid arithmetic speed and simple hardware implementation. It also works well on relatively large scaling and rotational images. However, when the transformation of images is more complex, the algorithm cannot achieve accurate registration. For high-resolution SAR images from different bands, there is a more complex transformation between the images. Thus, the realization of accurate registration between the images will undoubtedly lead to an increase in time costs. The registration algorithm based on FFT can quickly realize the coarse registration of two images, to reduce the search range of subsequent accurate registration and improve the arithmetic speed of registration.
Let F 1 u , v and F 2 x , y be the SAR images of the same area from different bands, f 1 u , v is the edge feature of F 1 u , v , and f 2 x , y is the edge feature of F 2 x , y . Taking f 1 and f 2 as the feature spaces, let f 1 u , v be the reference image (master image) and f 2 x , y be the image to be registered (slave image). The coordinate-transformation relationship between the images is estimated by using a similar transformation model:
u v = a cos β sin β sin β cos β x y + x 0 y 0
where a is the scale factor, β is the rotation angle, and x 0 , y 0 denotes the translation. Then, Equation (1) can be written as
f 1 ( u , v ) = f 2 a x cos β + y sin β + x 0 , a x sin β + y cos β + y 0
Taking the Fourier transform of f 1 and f 2 , respectively, to obtain F 1 and F 2 , F 1 and F 2 can be related as:
F 1 ( ξ , η ) = 1 a 2 e j 2 π ξ a x 0 + η a y 0 F 2 ξ a cos β + η a sin β , ξ a sin β + η a cos β
Ignoring the multiplication factor 1 a 2 , M 1 and M 2 , which are the magnitudes of F 1 and F 2 , are related by
M 1 ( ξ , η ) = M 2 ξ a cos β + η a sin β , ξ a sin β + η a cos β
Converting the axes to the log-polar domain ( ρ , θ ) ,
M 1 ( ξ , η ) M 1 ( ρ , θ )
M 2 ( ξ , η ) M 2 ( ρ , θ )
where
ρ = 1 2 log k ξ 2 + η 2 θ = tan 1 ( ρ / η )
and k denotes the base of the logarithm. Then, M 1 and M 2 are related by
M 1 ( ρ , θ ) = M 2 ρ log k a , θ β
Taking the Fourier transform of M 1 ( ρ , θ ) and M 2 ( ρ , θ ) , respectively, to obtain F M 1 and F M 2 , the cross-power spectrum of M 1 ( ρ , θ ) and M 2 ( ρ , θ ) can be defined as
F M C ( ρ , θ ) = F M 1 ( ρ , θ ) F M 2 ( ρ , θ ) F M 1 ( ρ , θ ) F M 2 ( ρ , θ ) = e j 2 π ρ log k a + θ β
where F is the complex conjugate of F , and     denotes the amplitude. The inverse Fourier transform (IFFT) of F M C ( ρ , θ ) is f m c ( m , n ) :
f m c ( m , n ) = 1 M N F M C ( ρ , θ ) exp j 2 π m ρ M + n θ N
where the size of F M C ( ρ , θ ) is M × N .
Assume that the coordinate corresponding to the peak value of f m c ( m , n ) is ( ϖ , θ 0 ) . According to the phase-correlation method [12], a , β , and ( ϖ , θ 0 ) are related as
ϖ = log k a θ 0 = β  
Then, the scale factor a and rotation angle β between f 1 u , v and f 2 x , y can be expressed as:
a = k ϖ β = θ 0
Using the calculated a and β values, f 2 x , y represents a scaled and rotated replica of f 2 x , y . At this time, there is only translation transformation between f 2 x , y and f 1 u , v :
u v = x y + x 0 y 0
where x , y denotes the coordinates of f 2 x , y .
Let f c ( m , n ) be the IFFT of the cross-power spectrum of f 2 x , y and f 1 u , v and ( m 0 , n 0 ) be the coordinate corresponding to the peak value of f c ( m , n ) . According to the phase-correlation method, the translation transformation between f 2 x , y and f 1 u , v is:
x 0 = m 0   y 0 = n 0
So far, all parameters of the similarity transformation between F 1 u , v and F 2 x , y have been determined.
The improved ratio of exponentially weighted averages (IROEWA) is an edge detector suitable for SAR images. Compared to Sobel, Prewitt, and Canny, which are based on the model of additive noise, IROEWA is a statistical edge detector suitable for the model of multiplicative noise. Compared to the ratio of averages (ROA), which is also a statistical edge detector, IROEWA is optimized for multi-edge models [20,21]. Compared to the ratio of exponentially weighted averages (ROEWA), IROEWA can correctly obtain the direction of edge points [22]. Therefore, we use IROEWA to obtain the edge feature of SAR images.
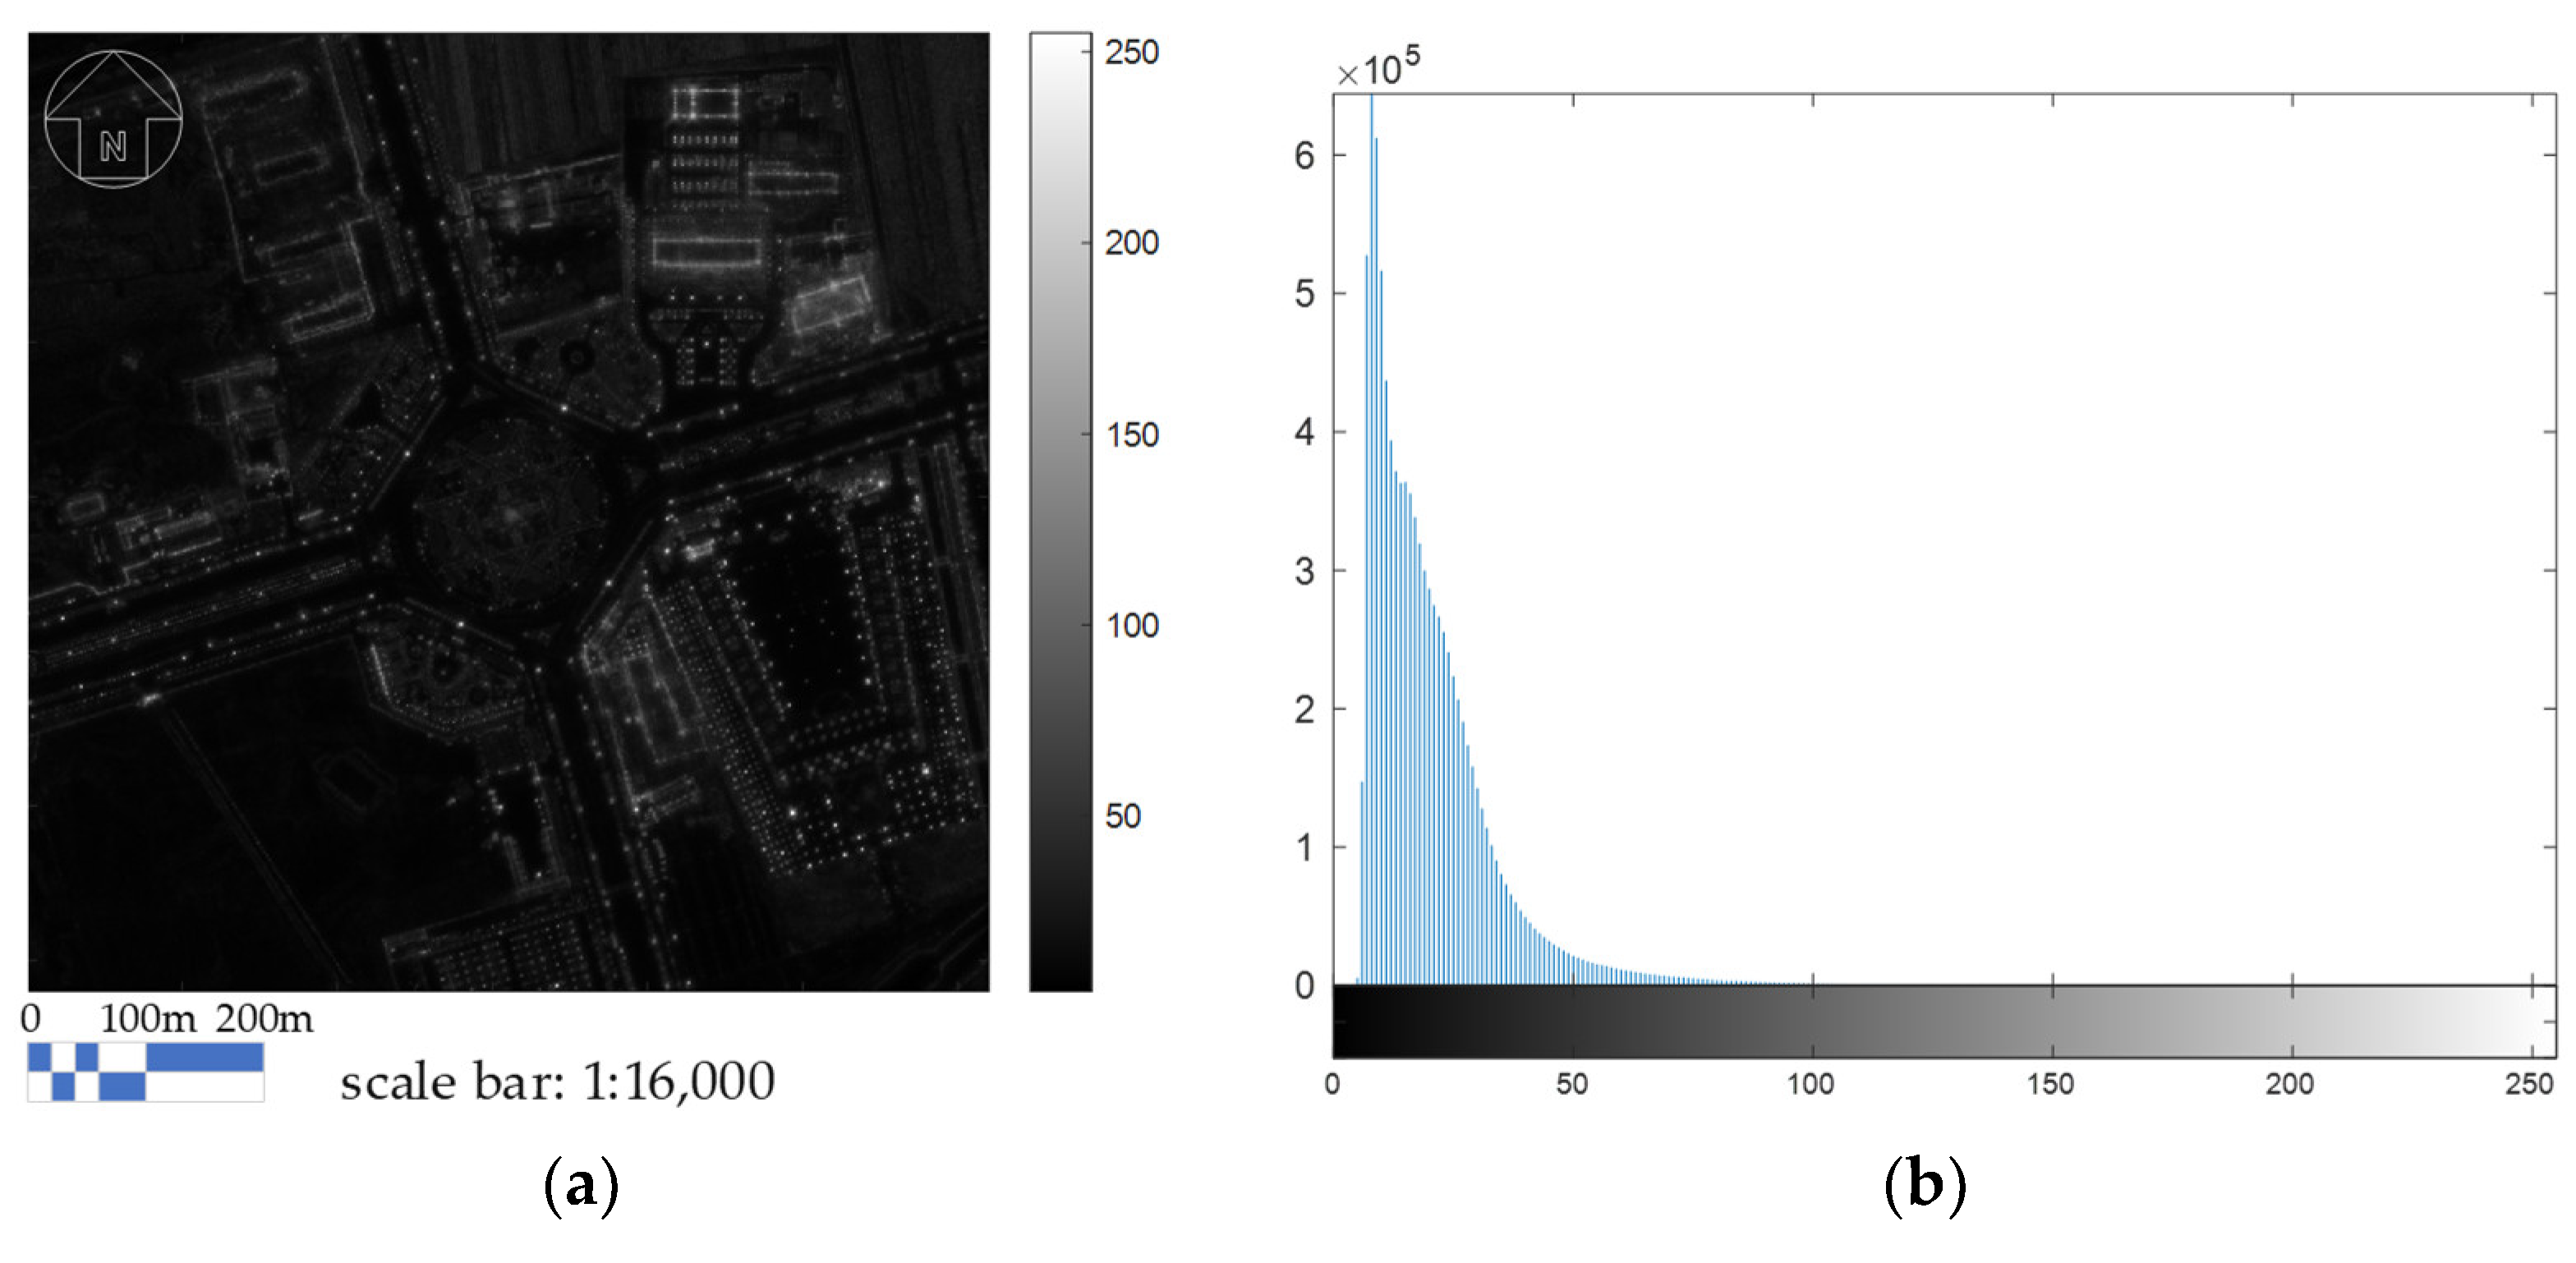
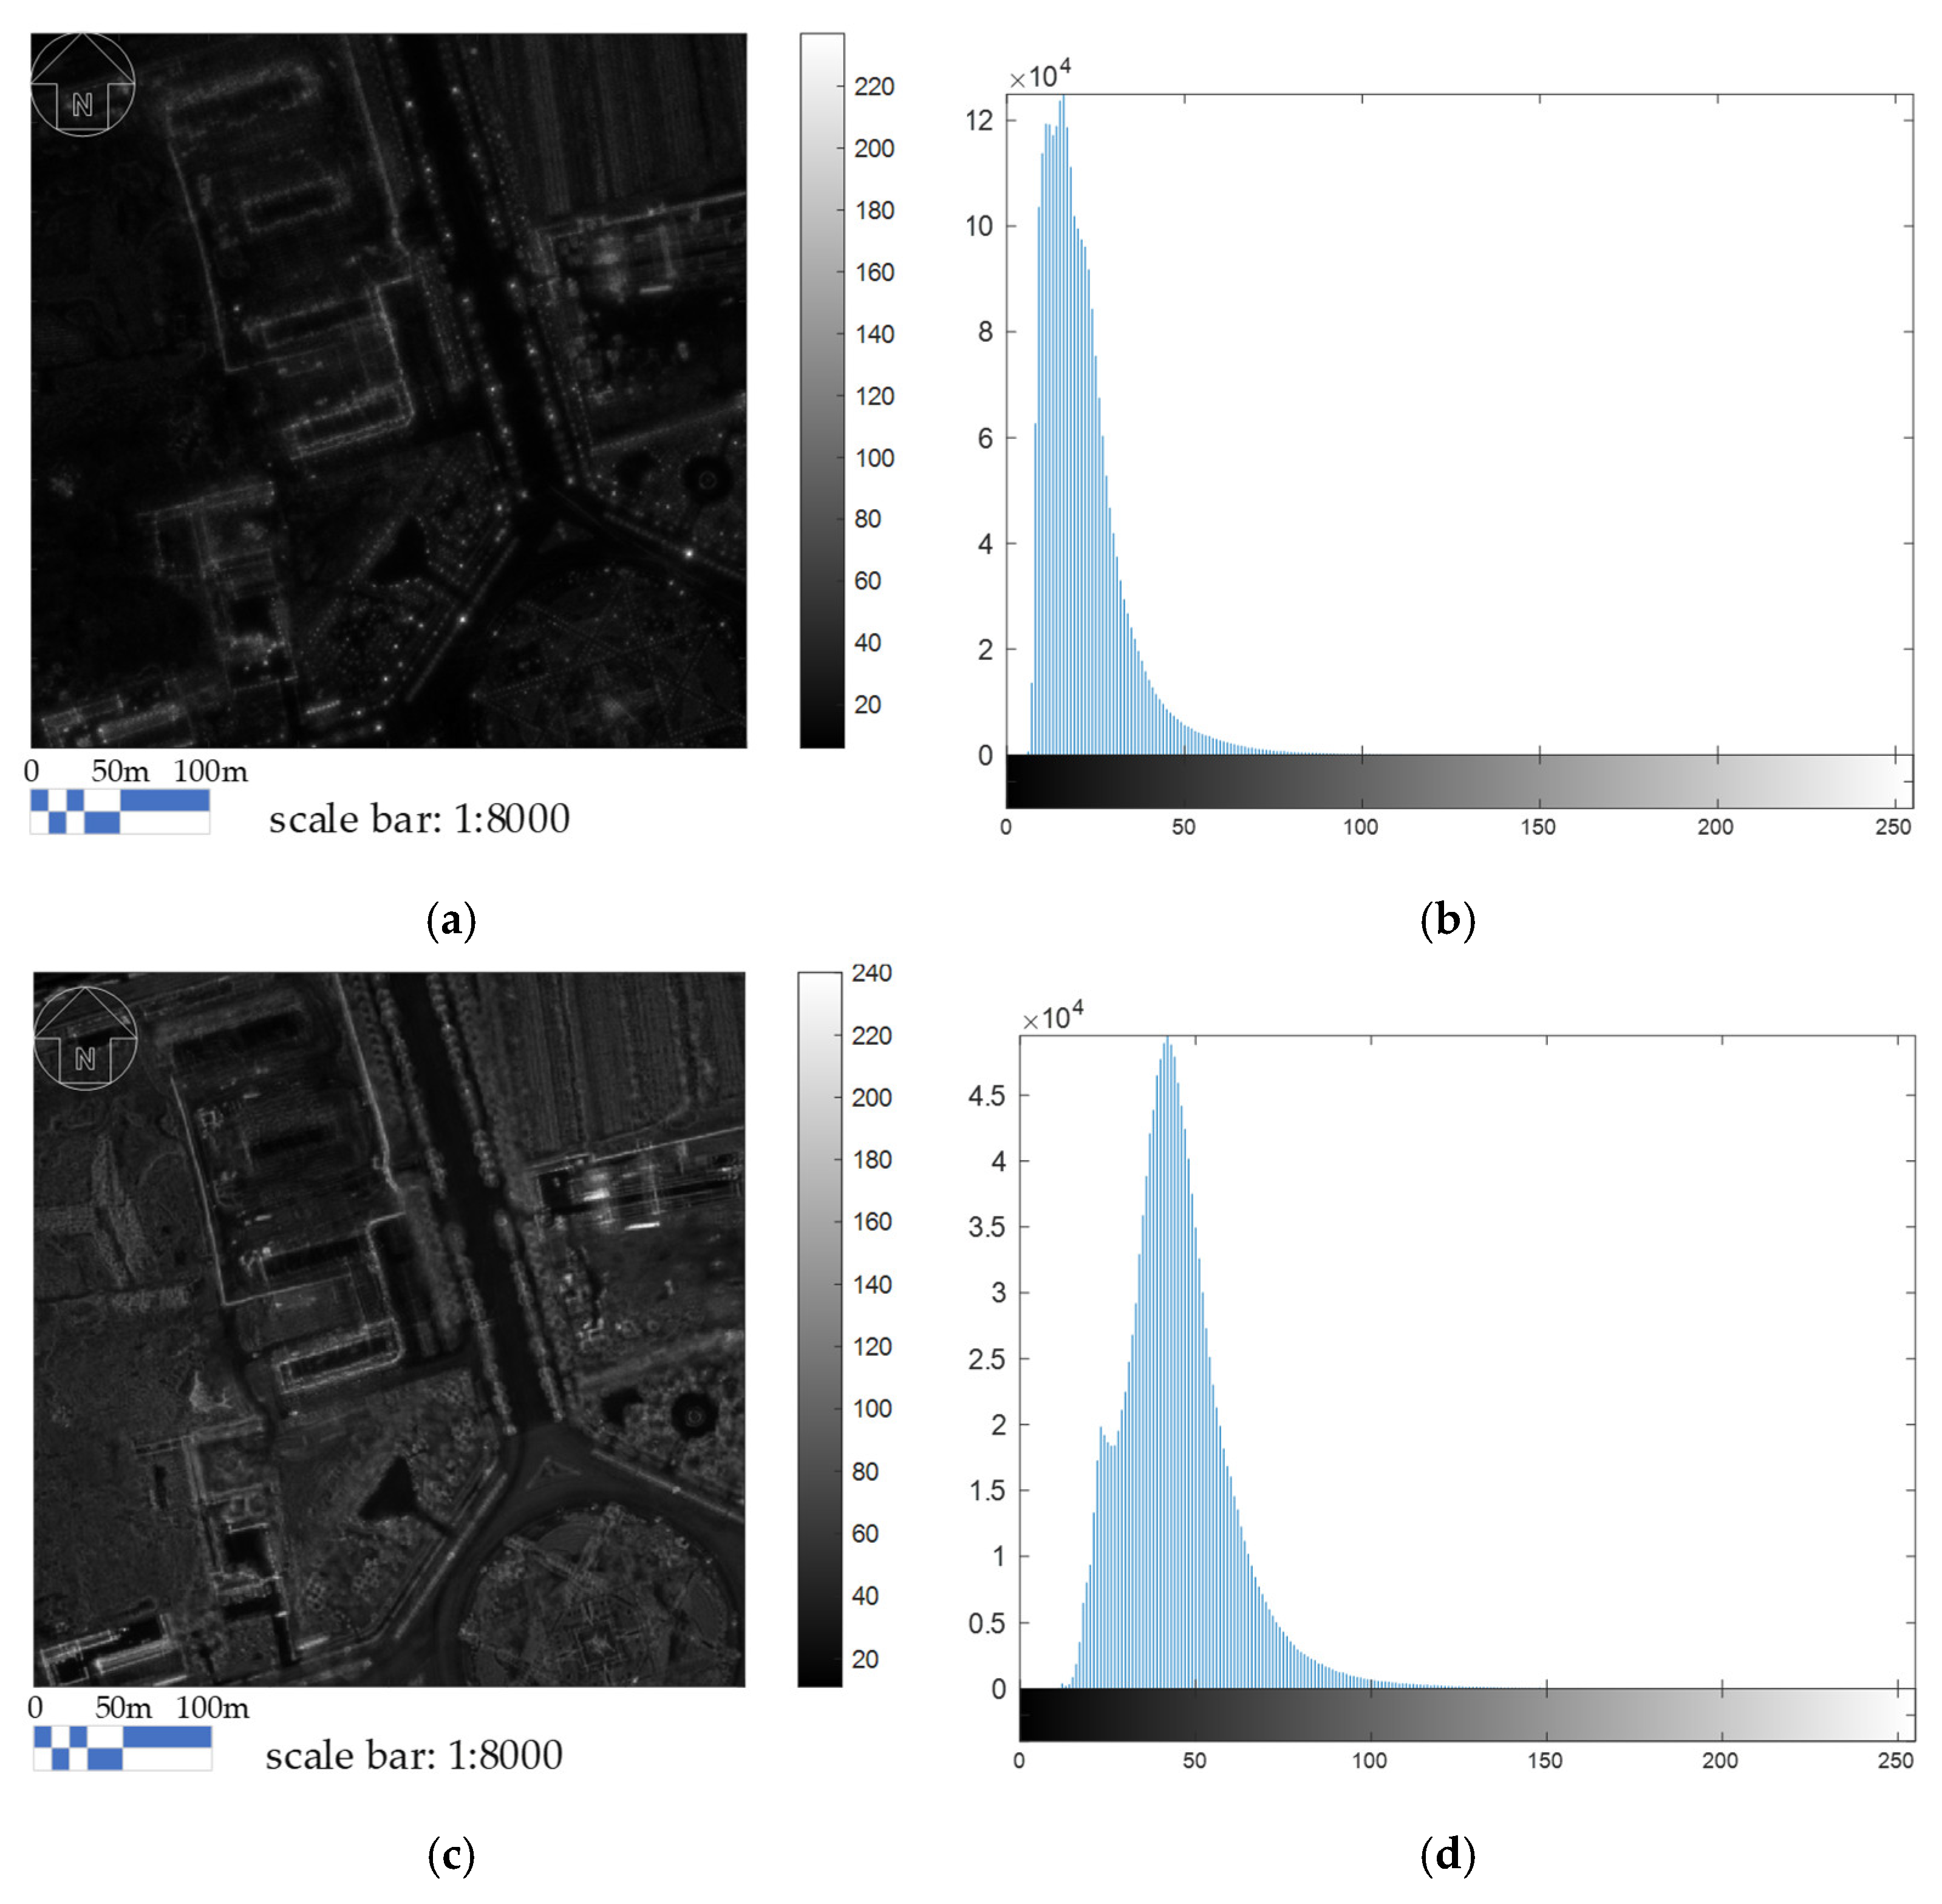
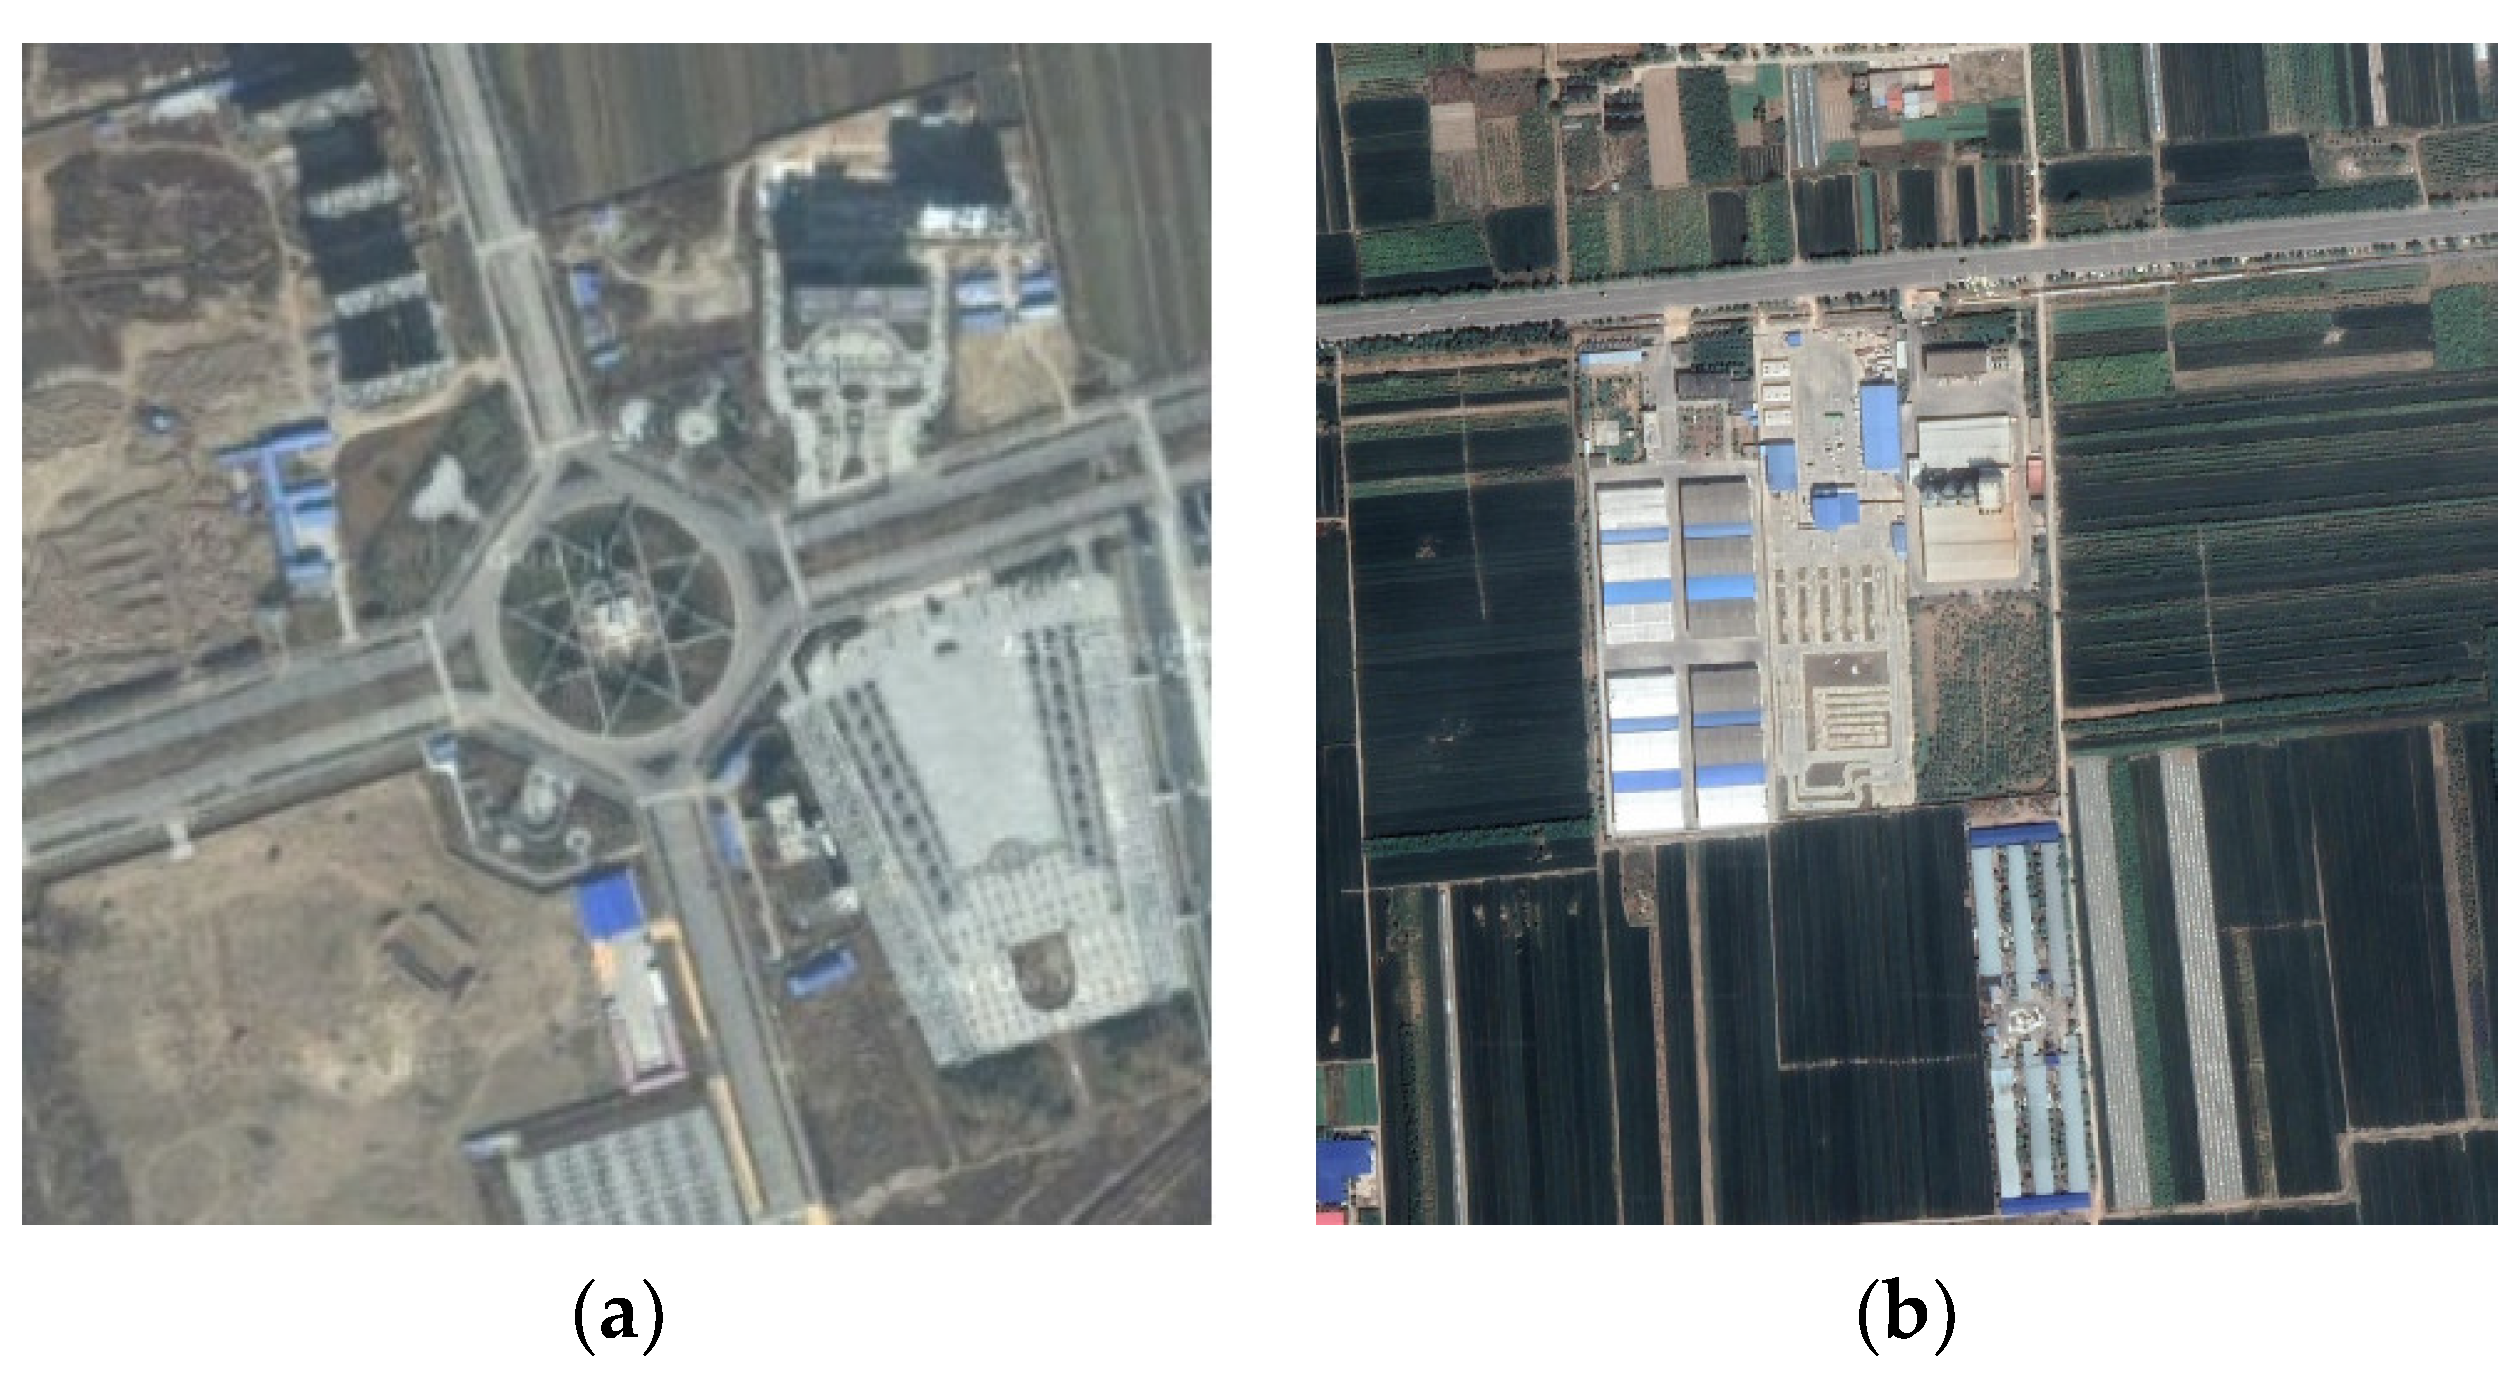
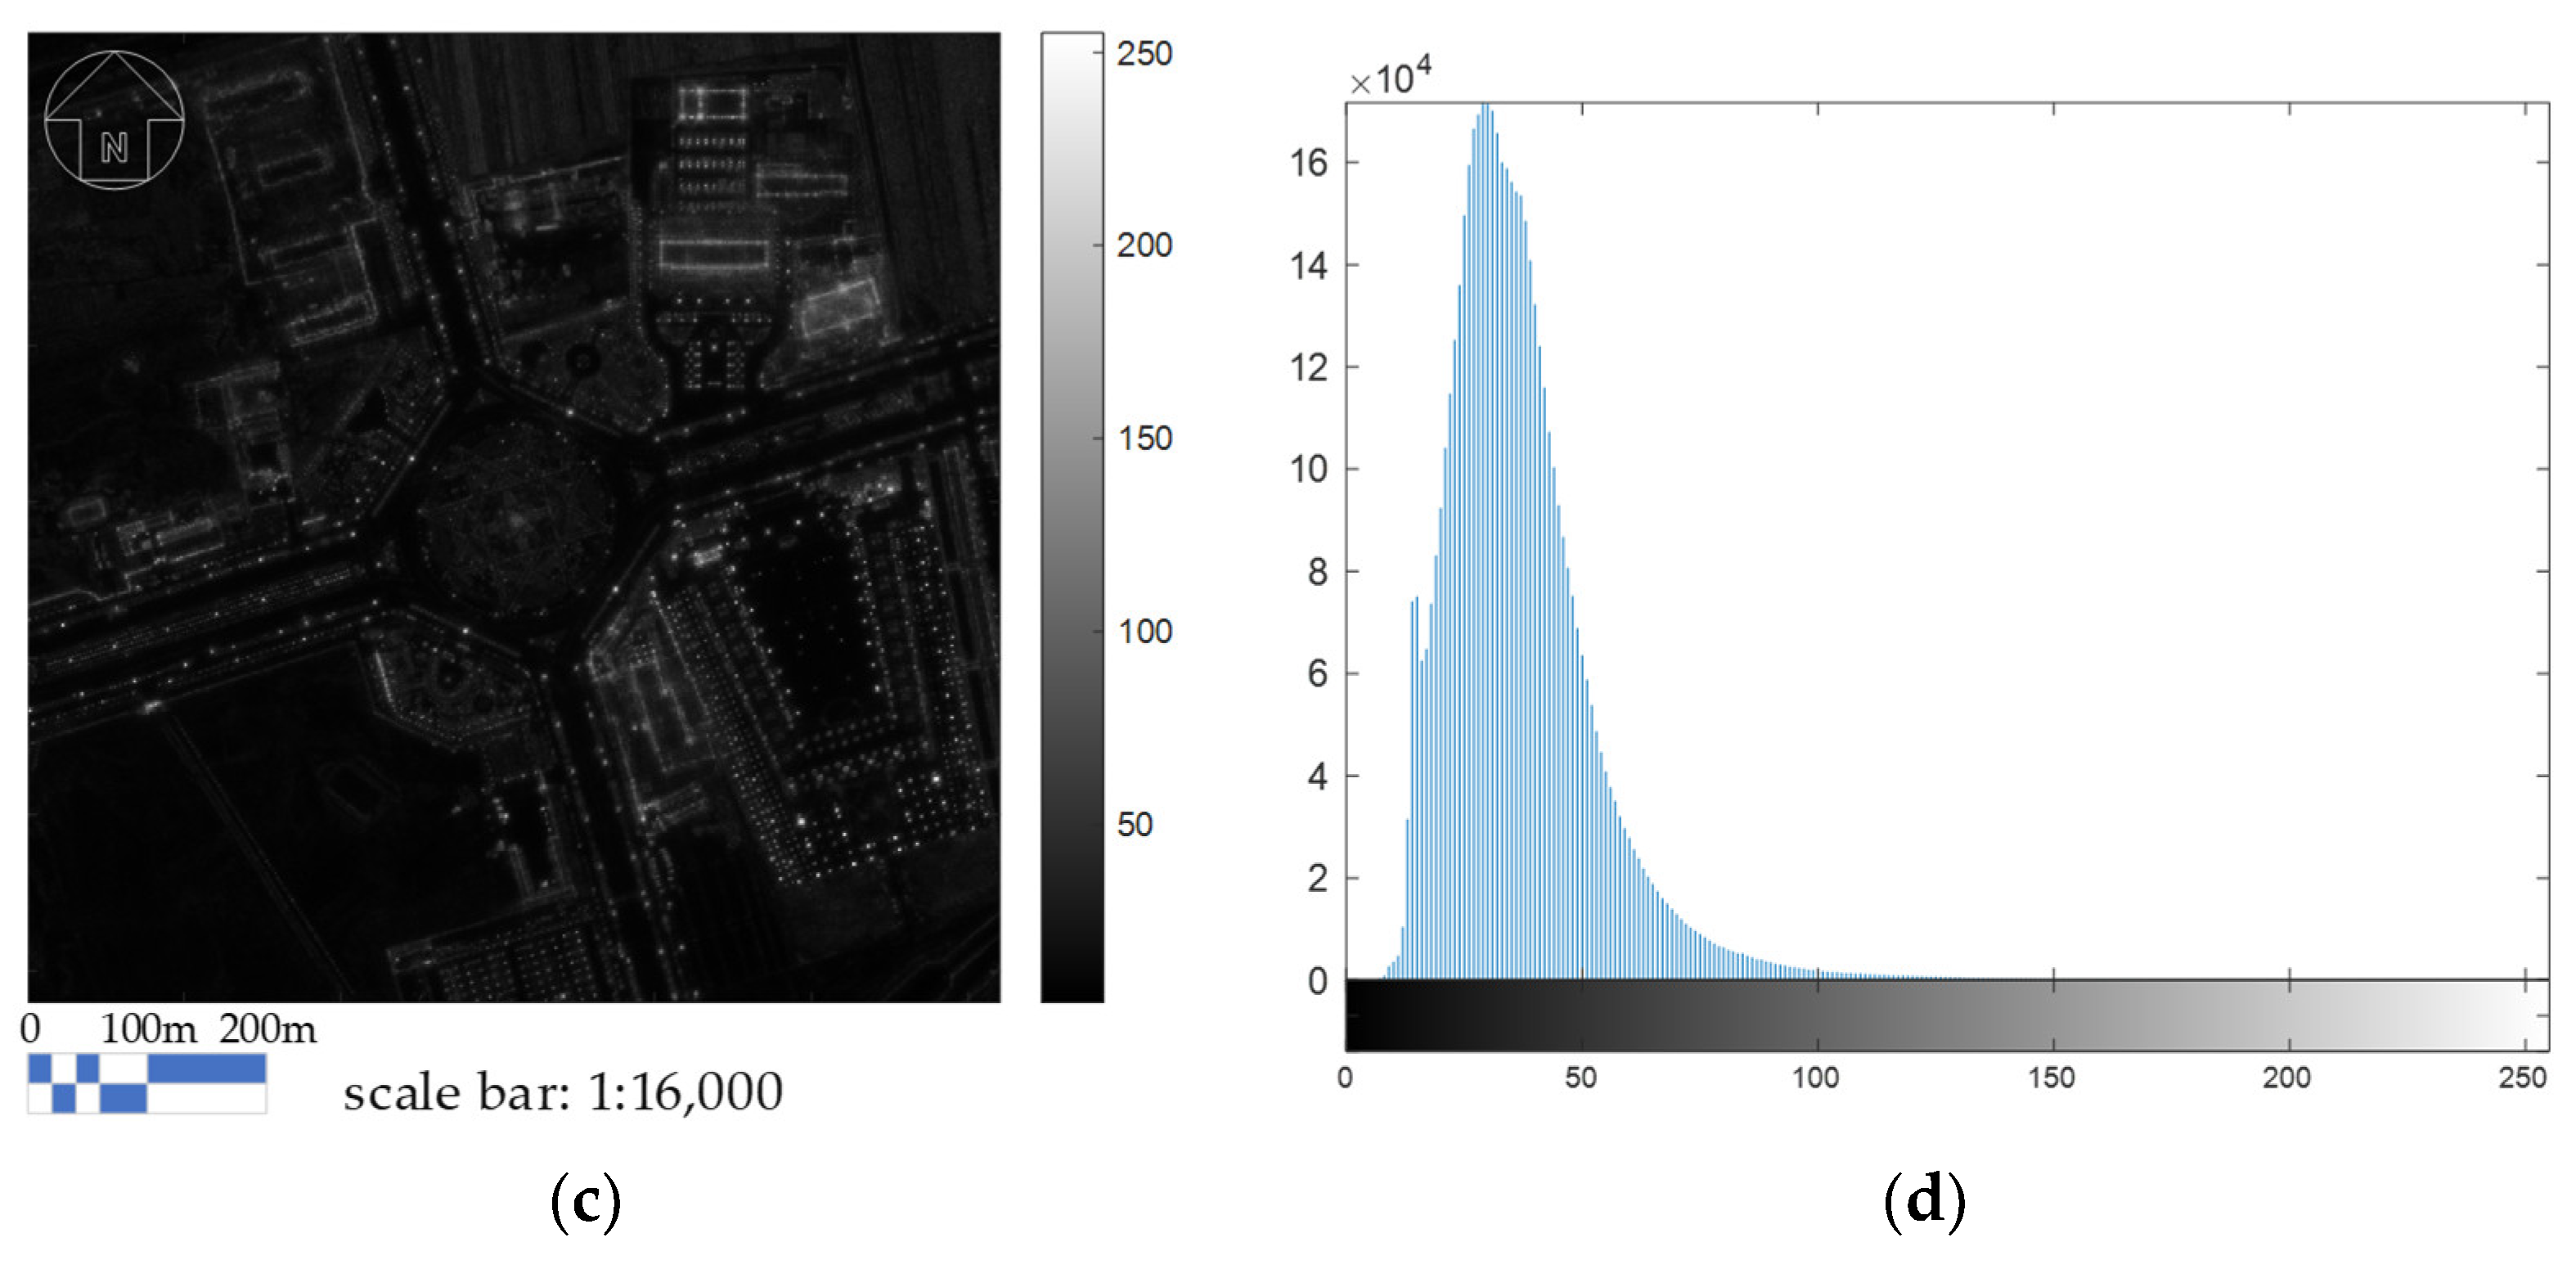
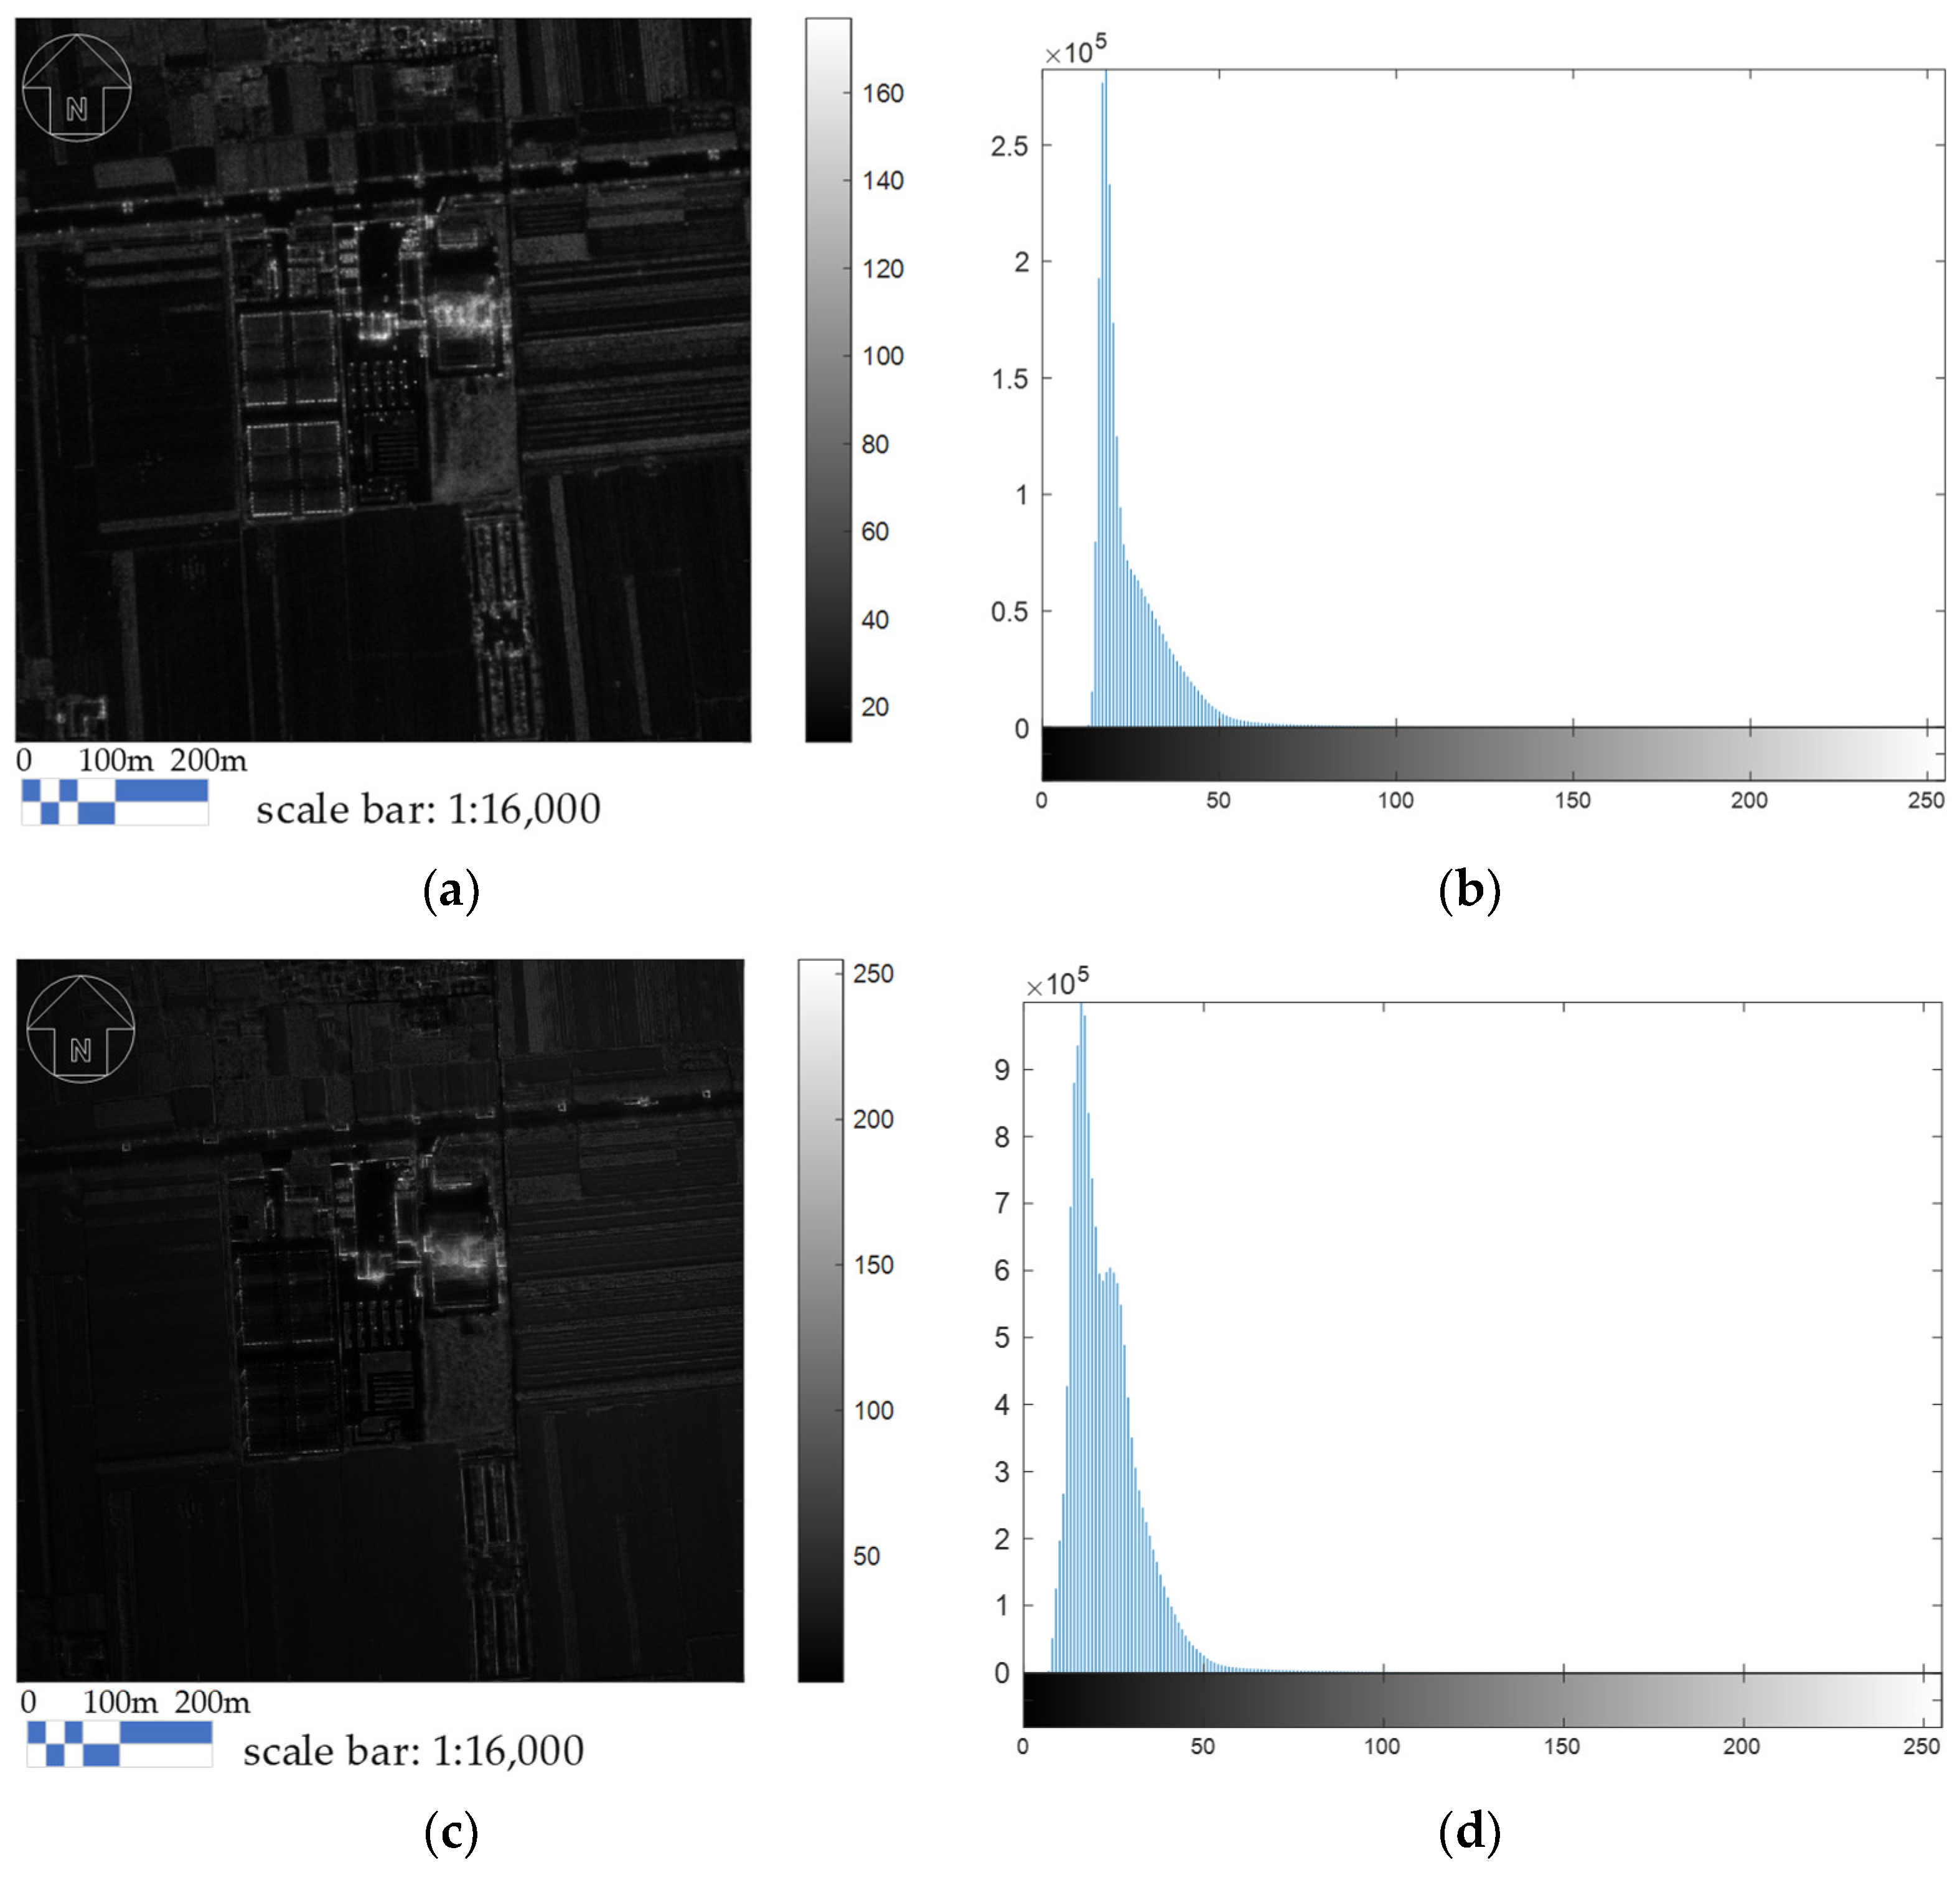
Figure 1a,c, respectively, show the L-band and Ku-band SAR images of an area with a latitude of 34°50′N and longitude of 109°35′E. Gray histograms of the L-band and Ku-band SAR images are shown in Figure 1b,d, respectively. As shown in 
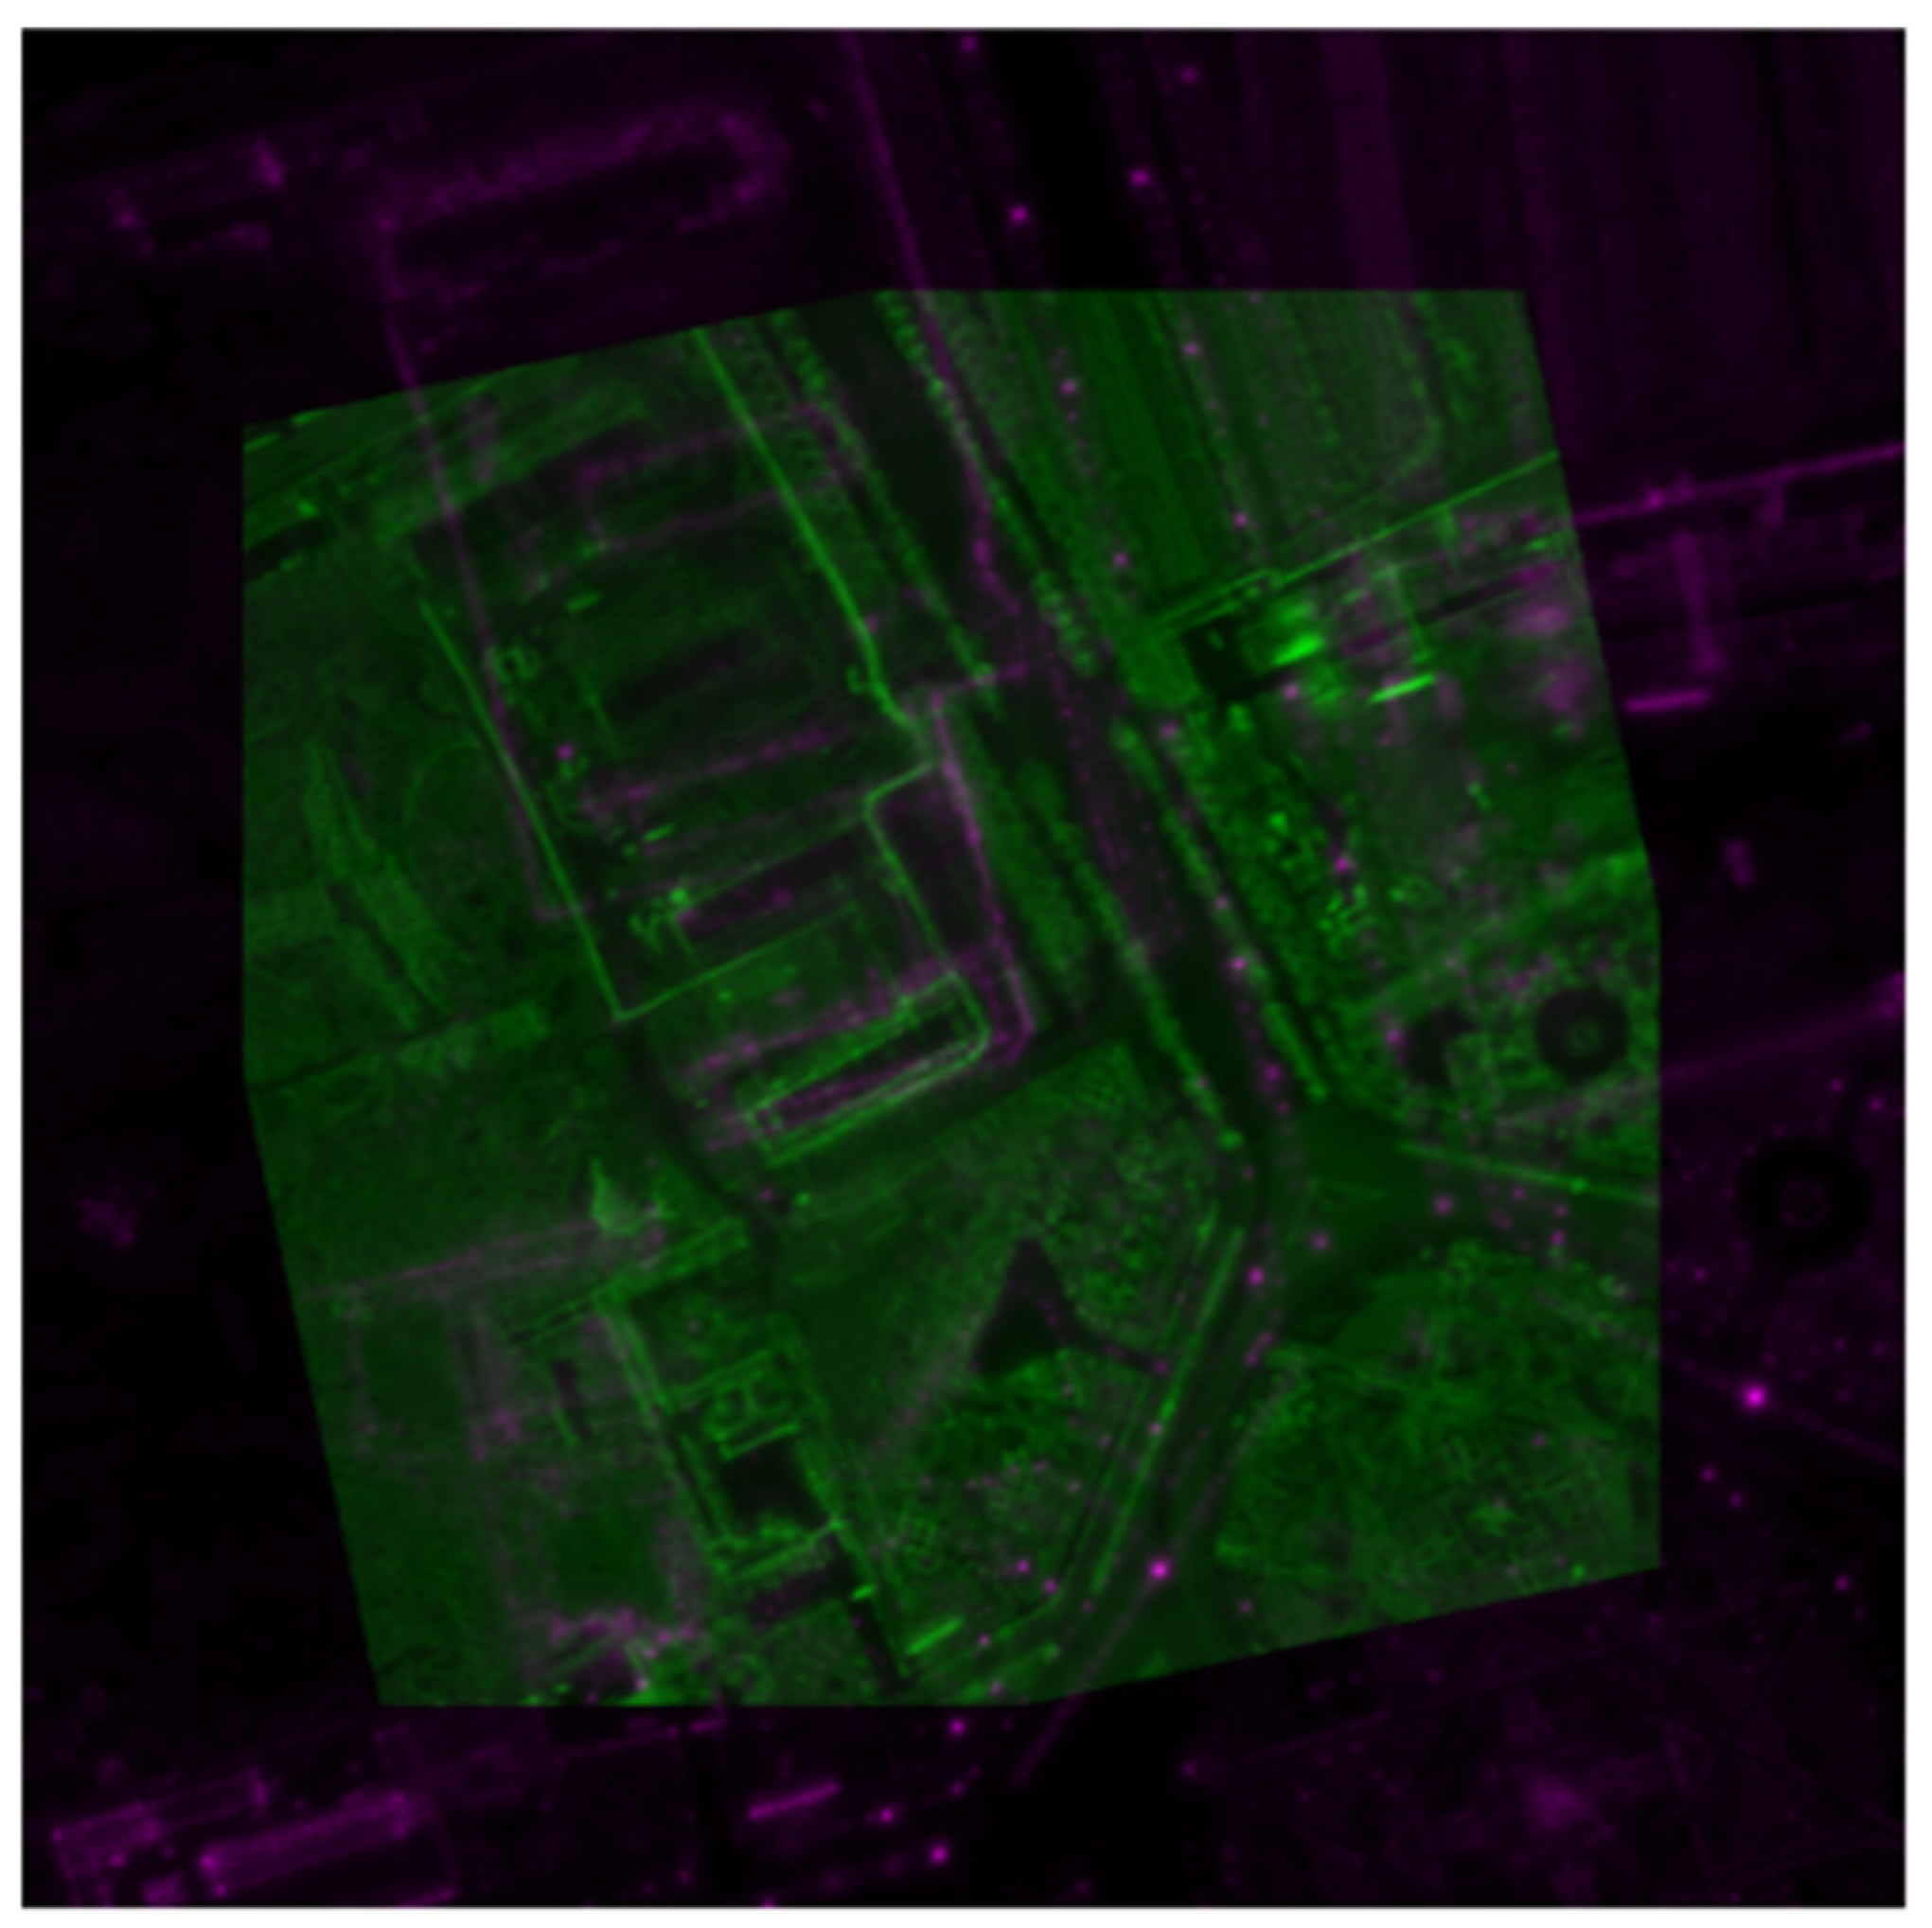
Figure 1, there is a large gray difference between the two images. It is assumed that the L-band SAR image is the master image, and the Ku-band SAR image is the slave image. Firstly, the gray information of the two images is directly used as the feature space, and the image-registration algorithm based on FFT is used to register the two images. As shown in Figure 2, the two images were not registered. Then, according to the method proposed in 
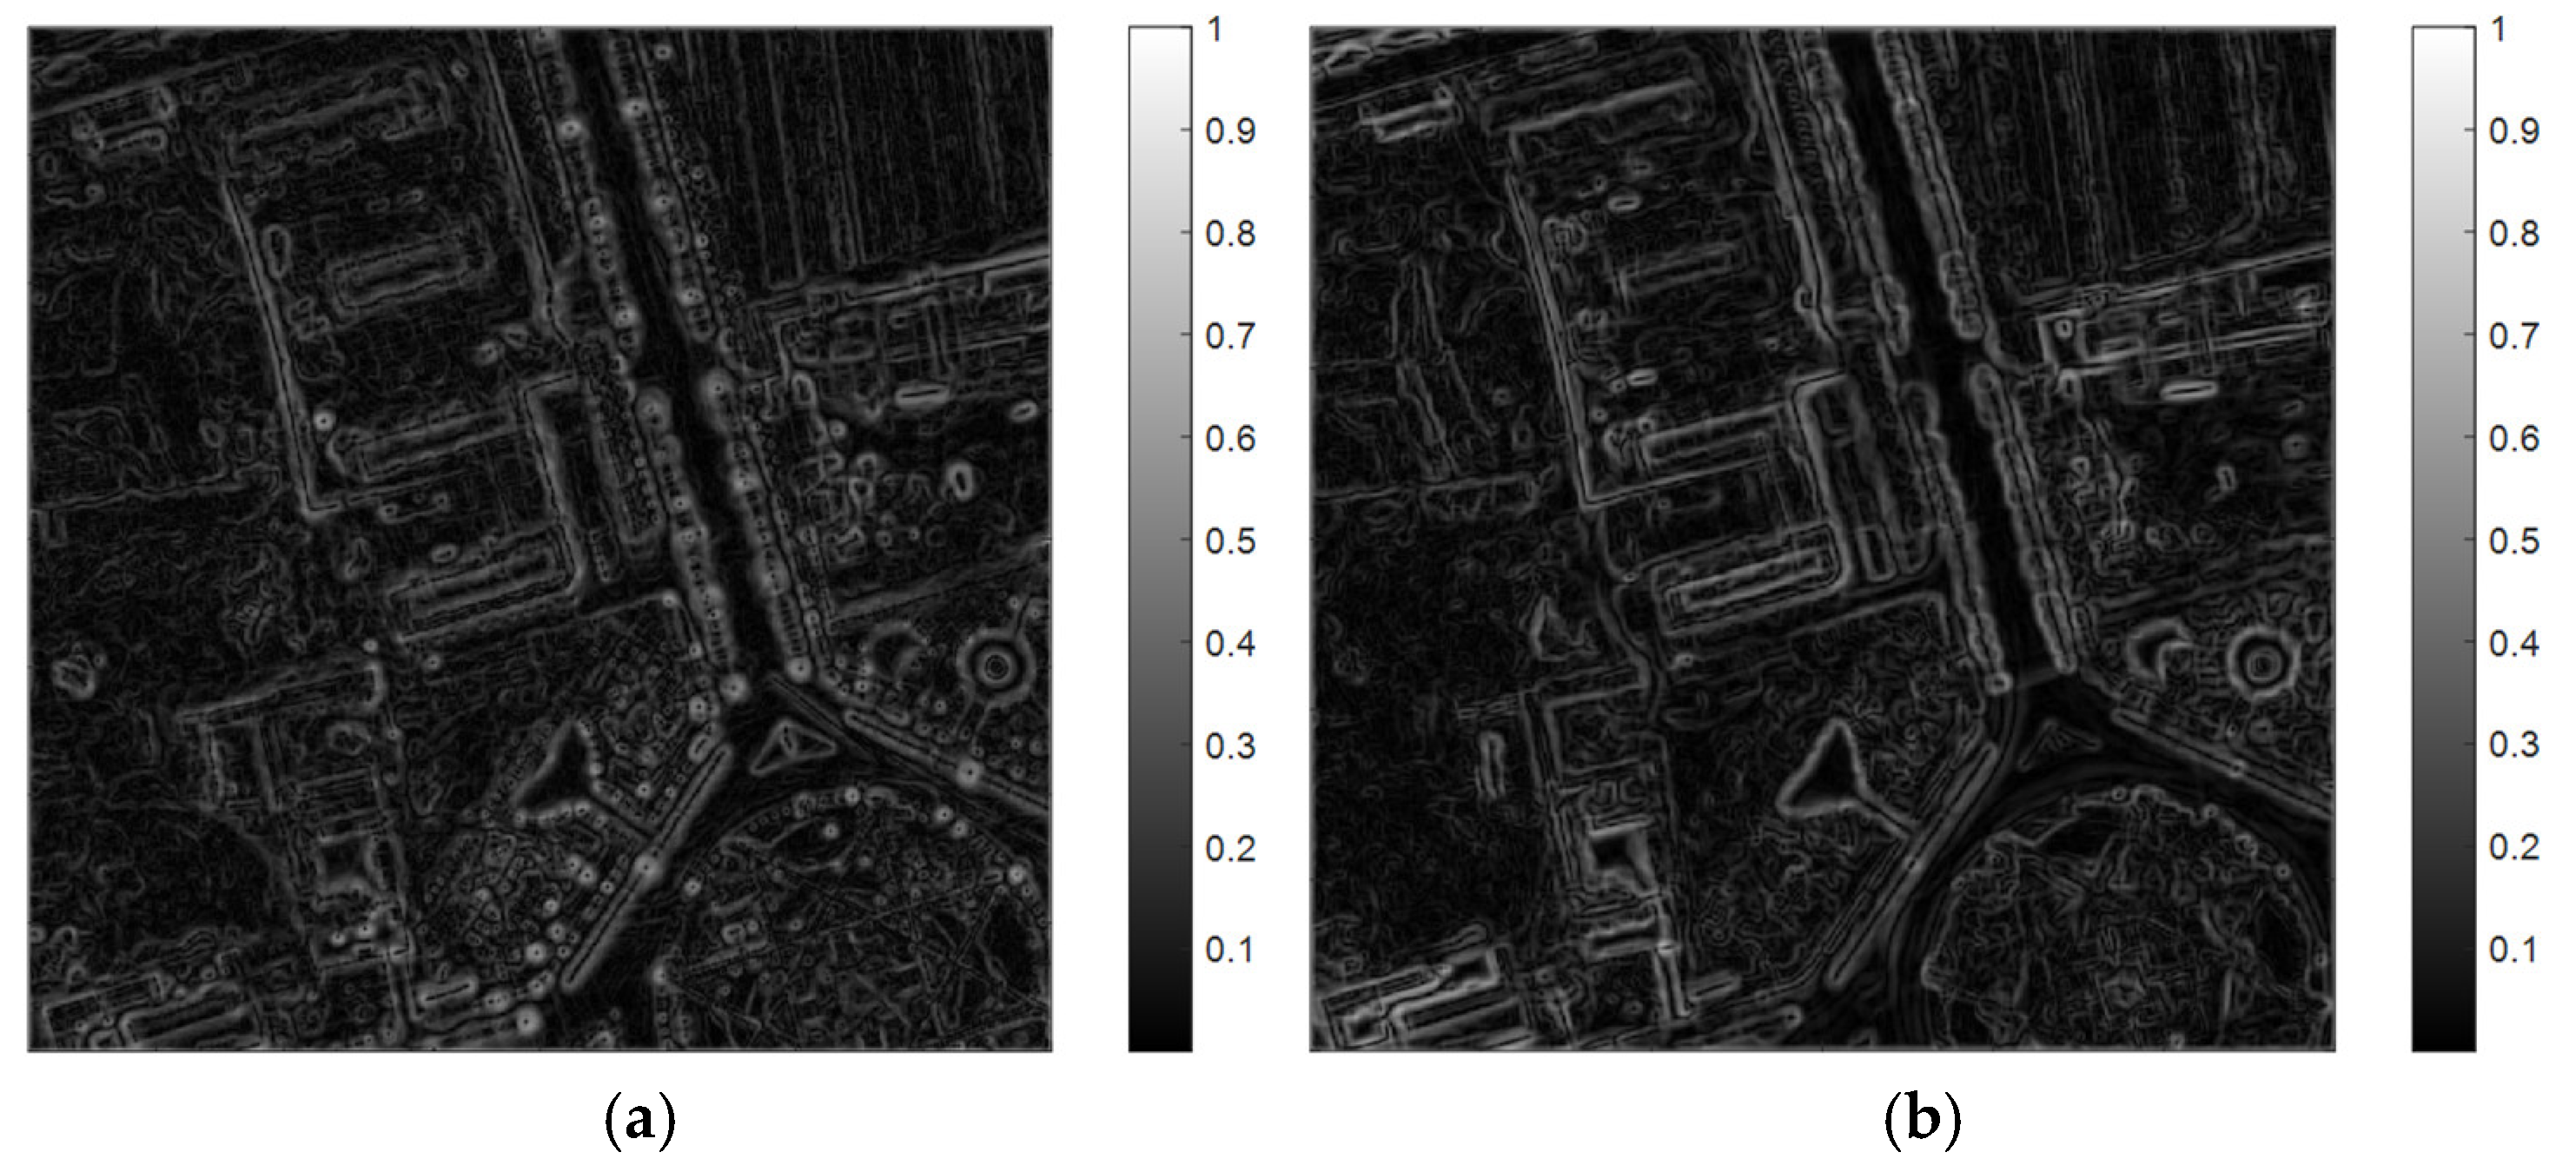
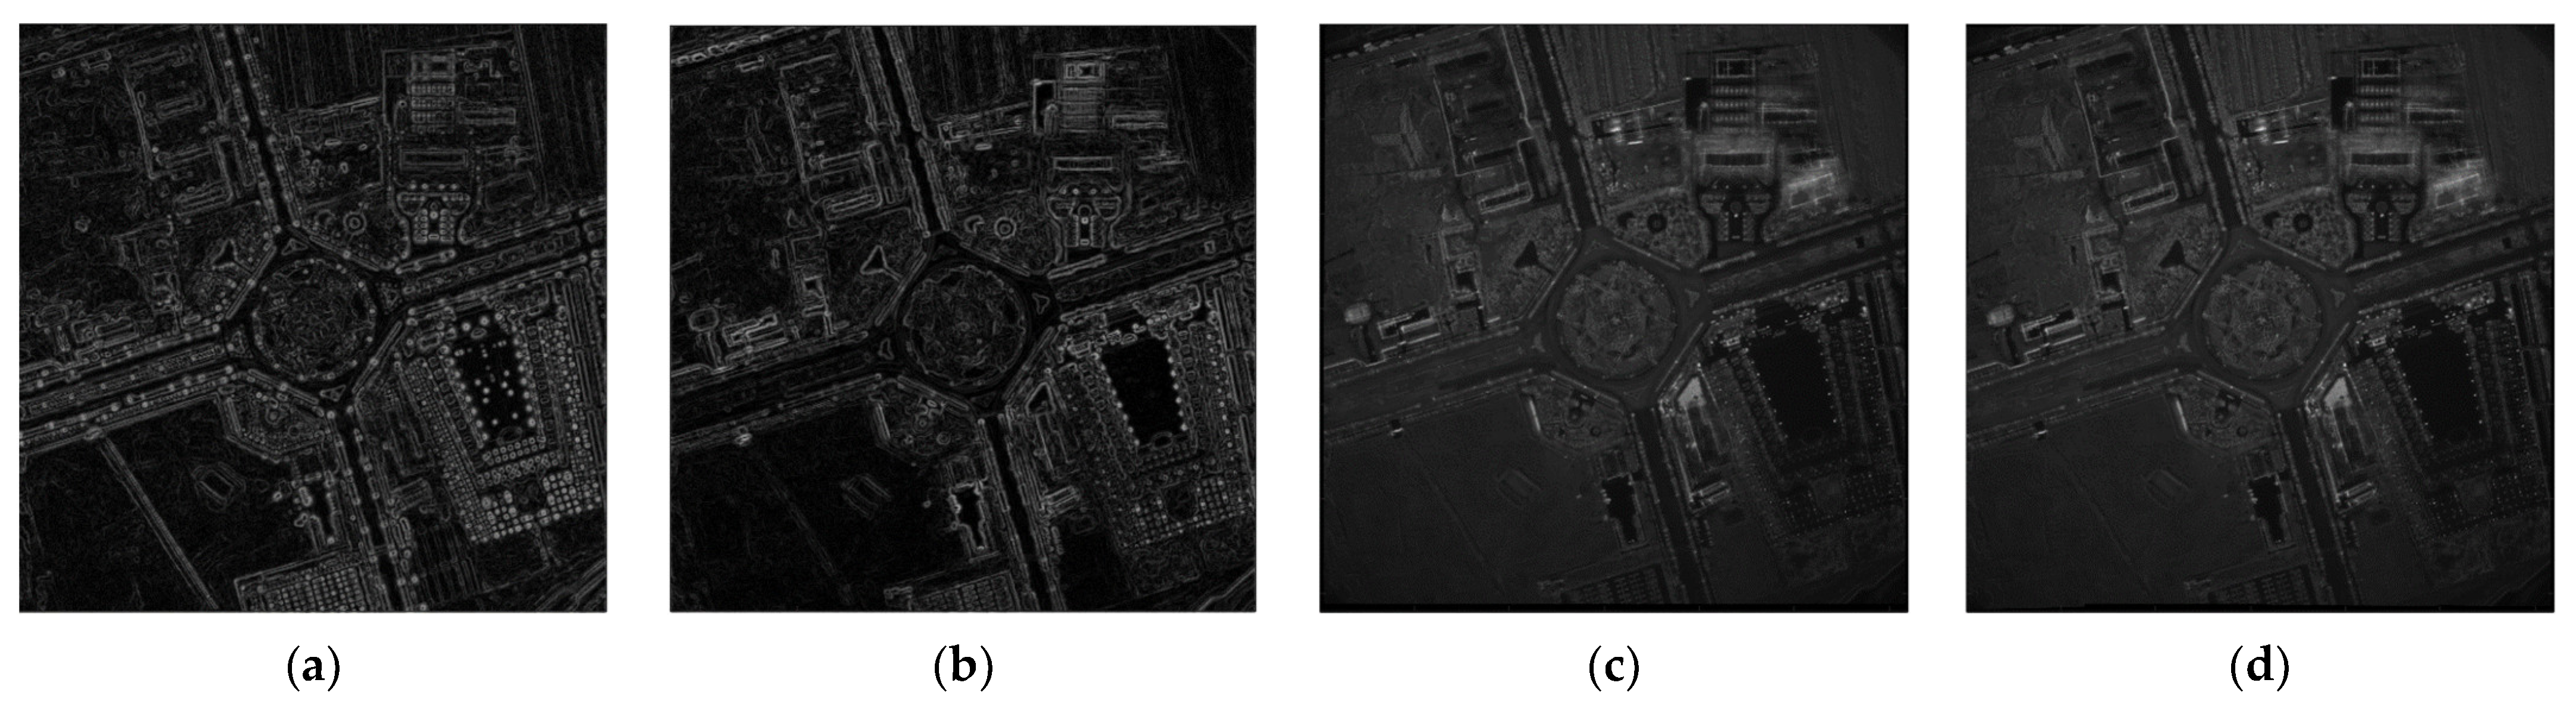
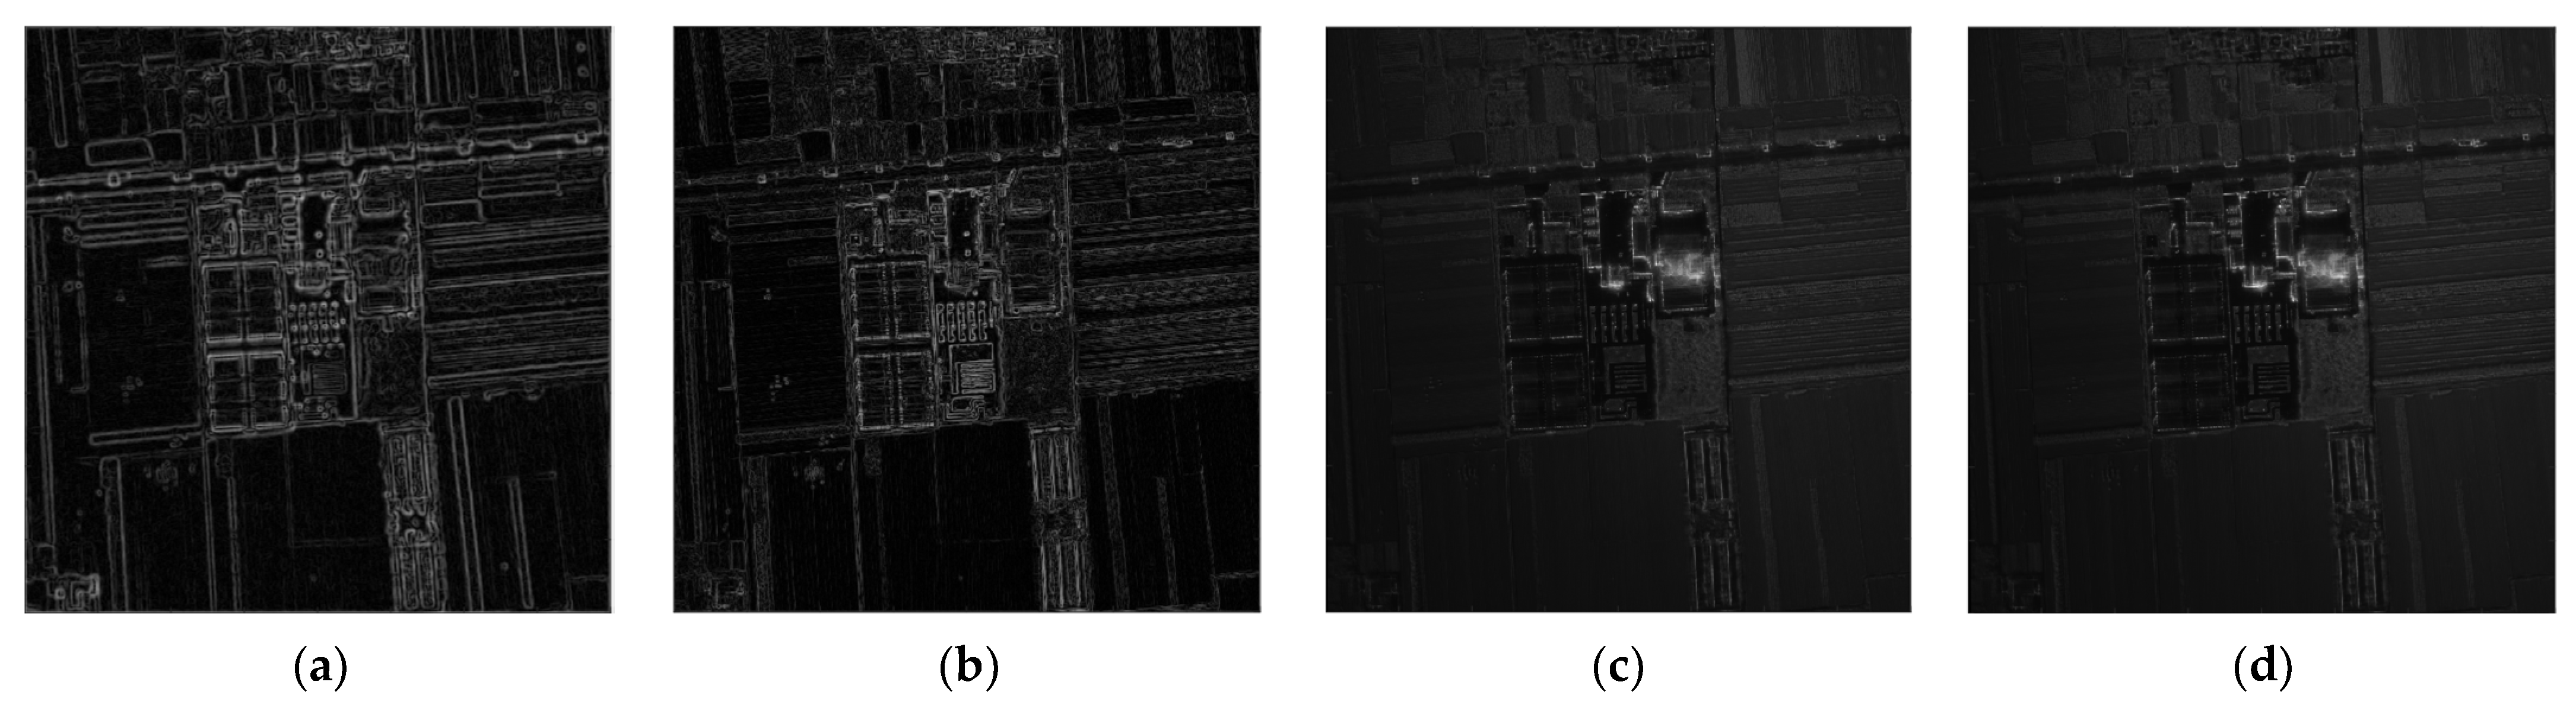
Section 2, we use IROEWA to extract the edge features of the L-band and Ku-band SAR images, respectively (as shown in 
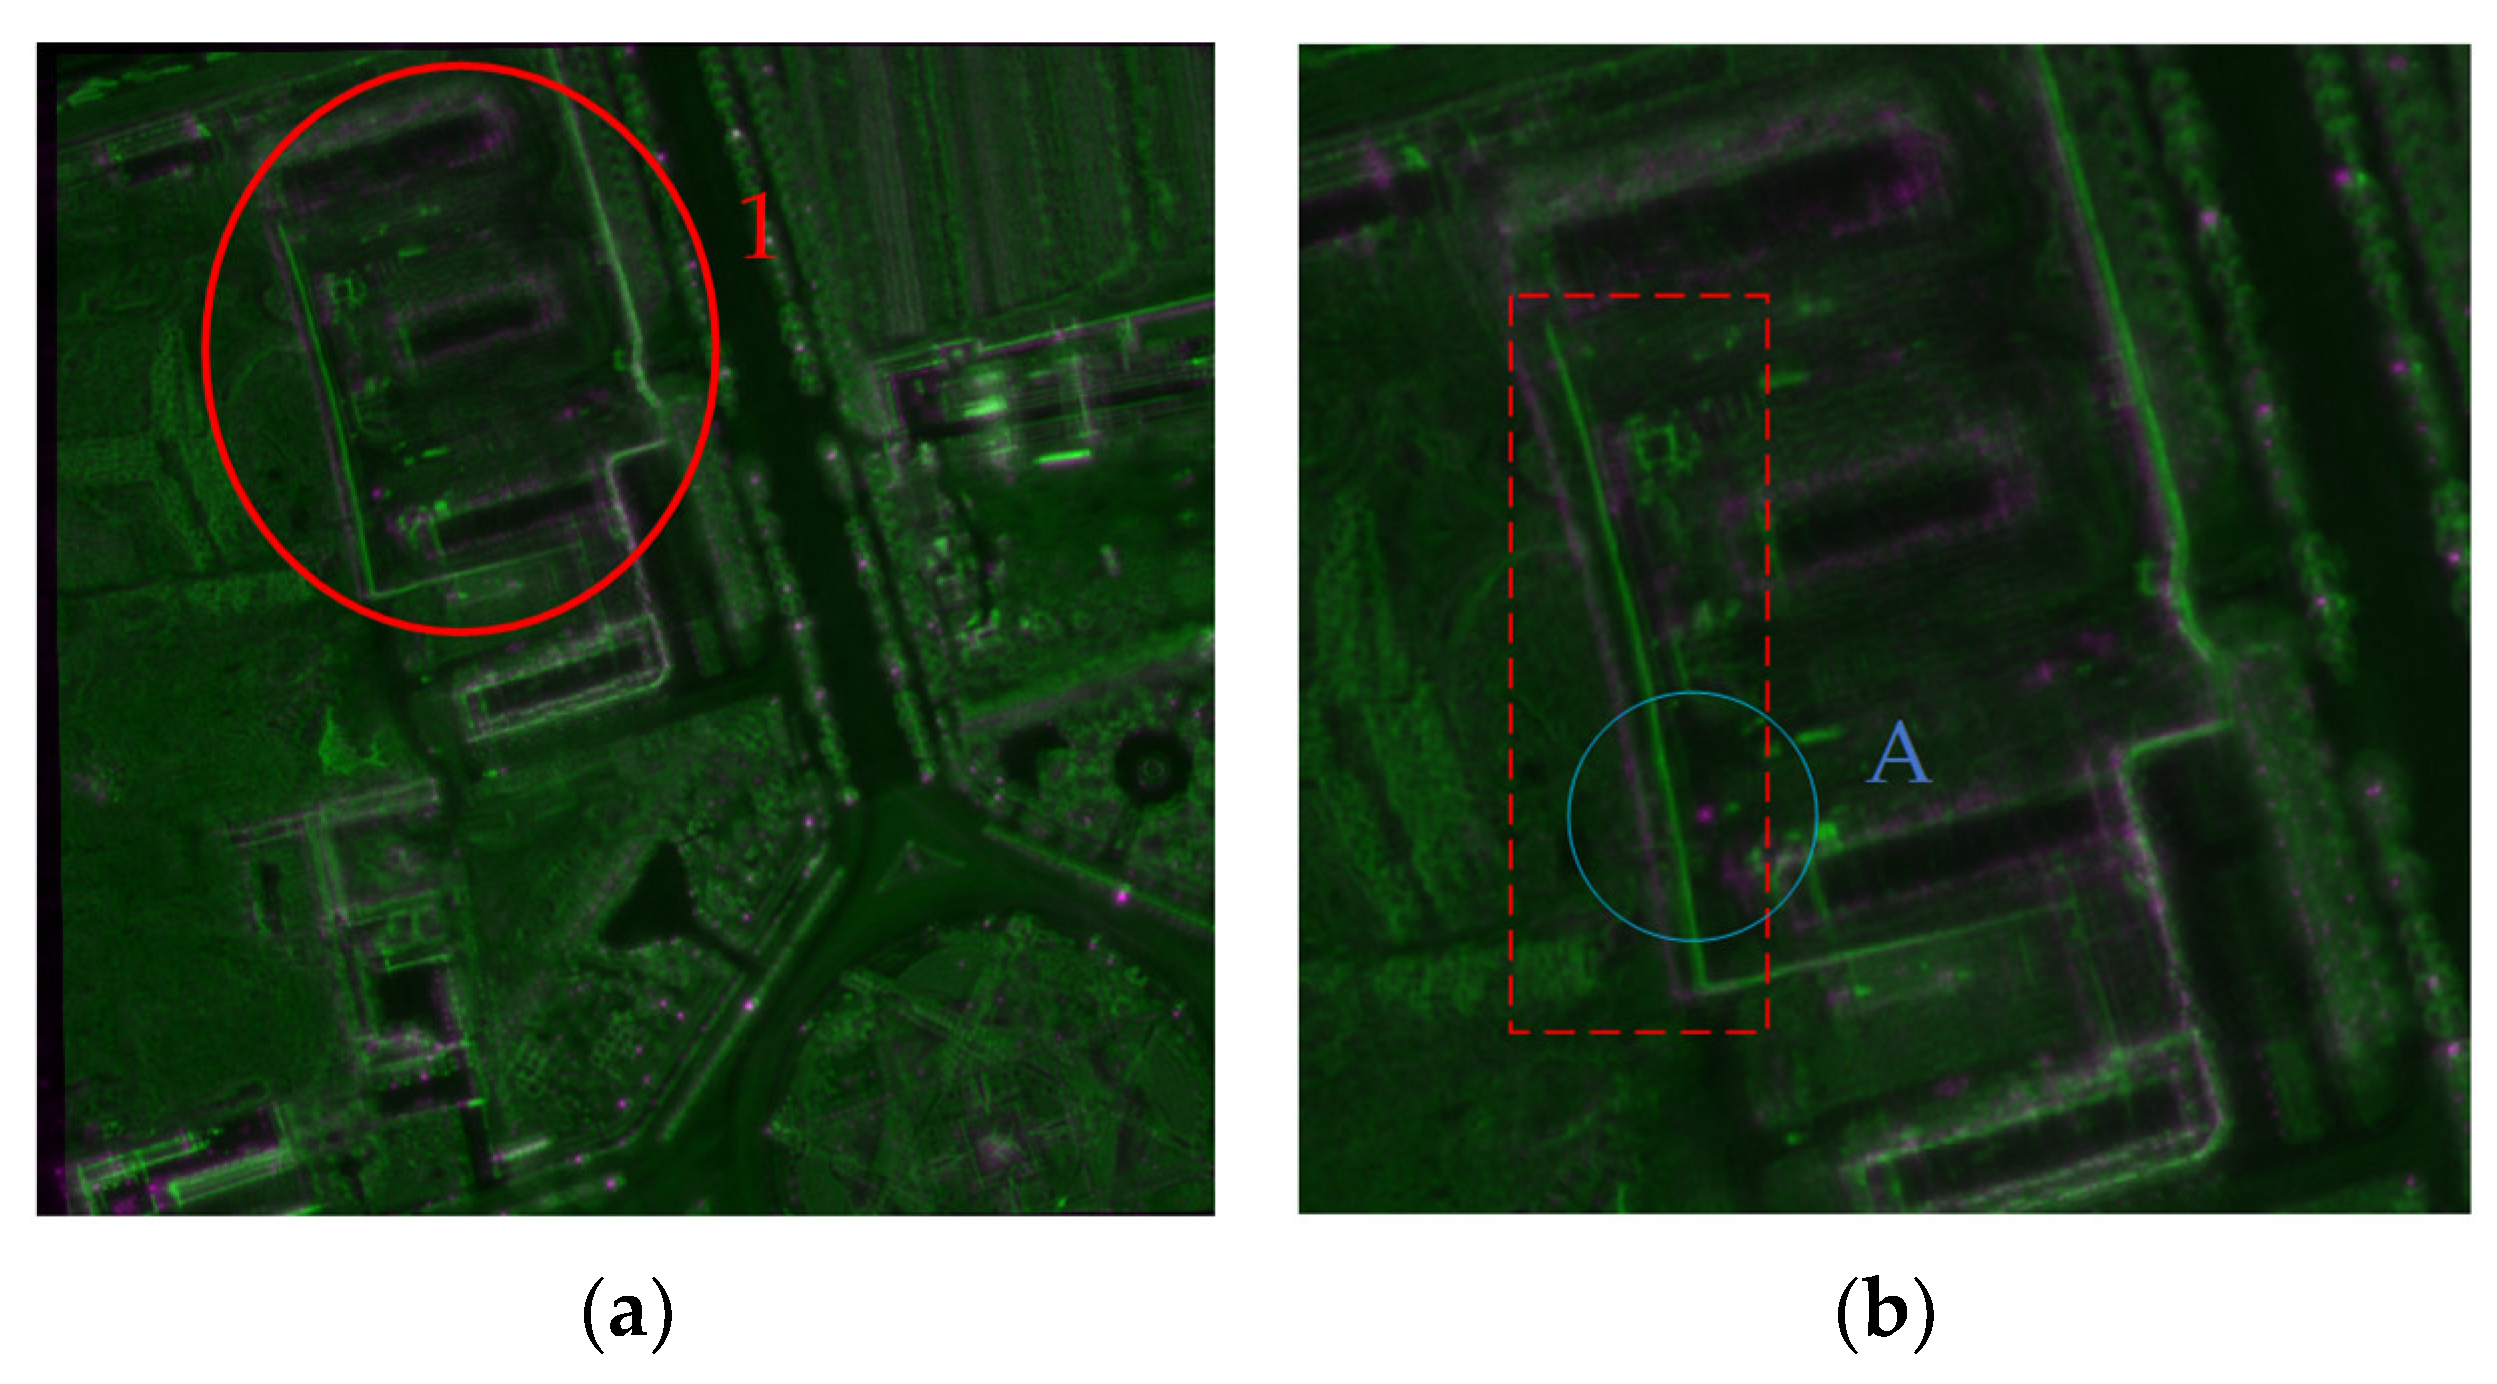
Figure 3), and then use the edge feature to register the two images with the image-registration algorithm based on FFT. As shown in Figure 4, a better registration result between the two was achieved, but the registration accuracy was not high enough. As shown in Figure 4b, the registration error in the red-dotted-line box reached more than 10 pixels.

3. Accurate Registration of Dual-Frequency SAR Images Based on ECC

As outlined in Section 2, the registration algorithm based on edge features and FFT is used to solve the problem of the large gray difference between SAR images with different bands and to correct the global difference of rotation, translation, and scaling between SAR images at high and low frequencies. However, the registration results show that the overall registration accuracy of the two SAR images is still too low in some regions. This low accuracy is due to the complex geometric distortions (such as nonlinear distortions caused by sensors, target deformation, and motion) between actual SAR images in different bands, while the registration algorithm based on edge features and FFT uses the global transformation model and cannot properly handle local geometric distortion [23]. Therefore, this registration algorithm has difficulty achieving high accuracy in high- and low-frequency SAR images.
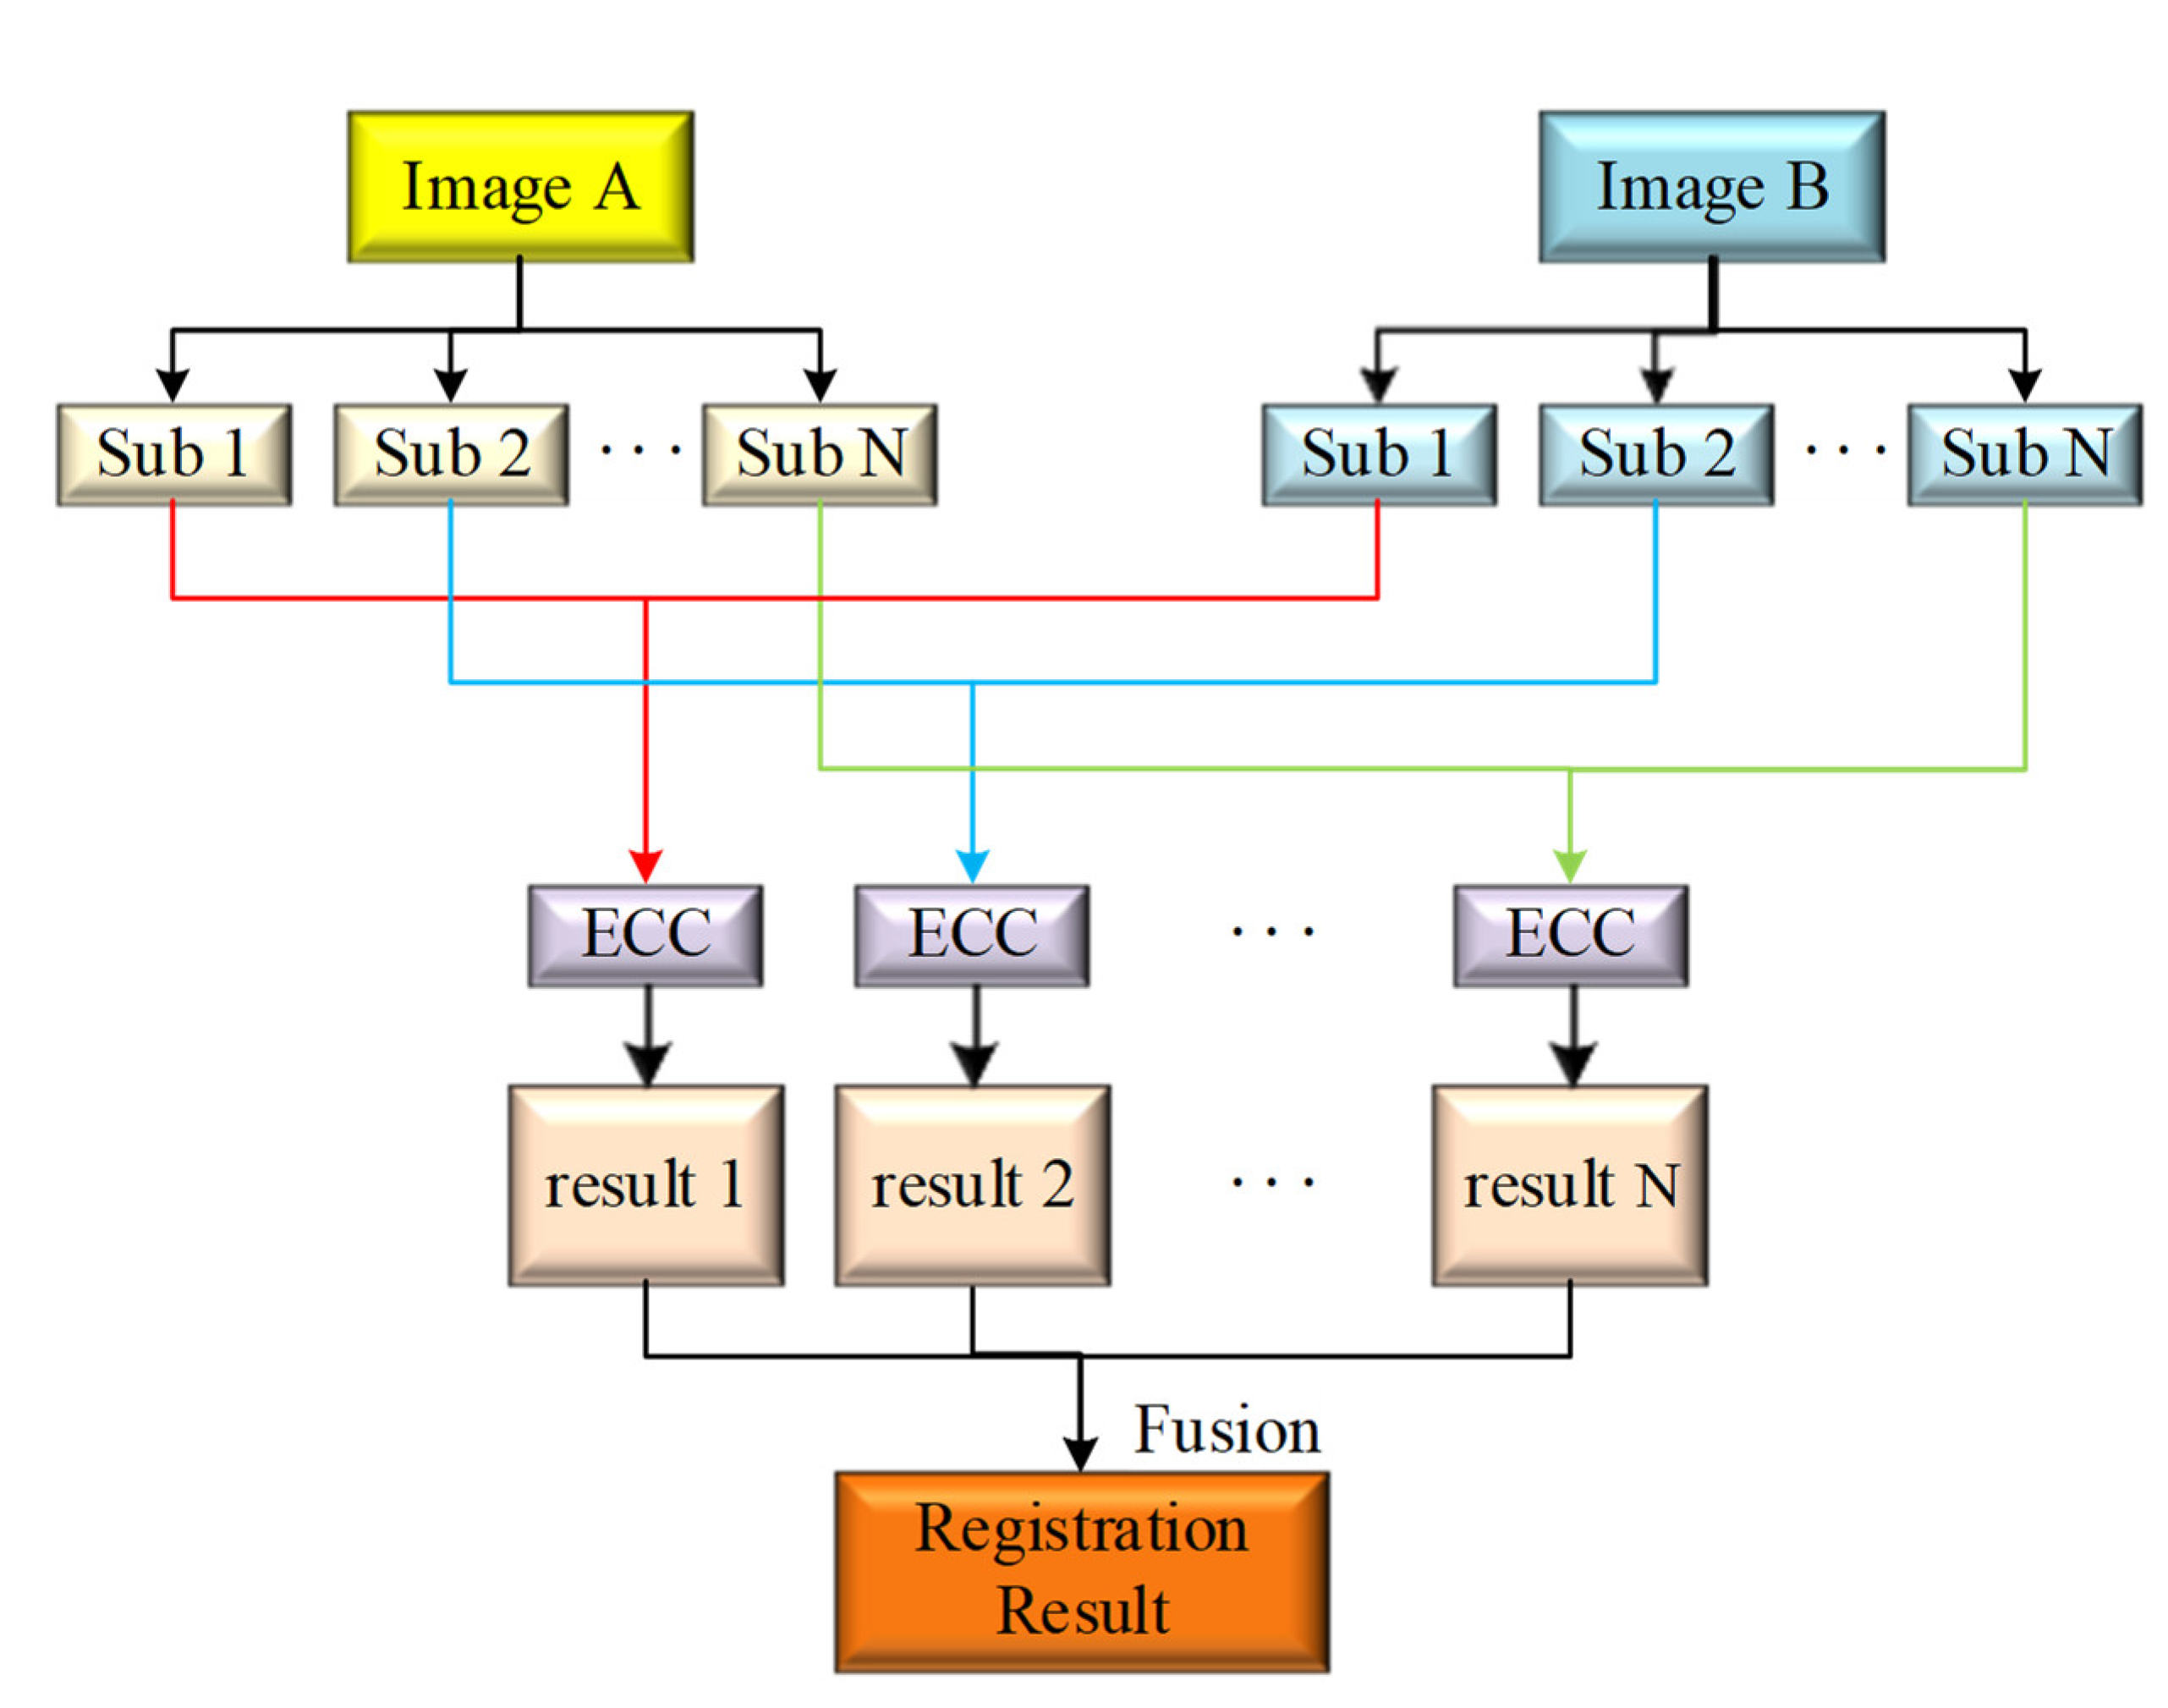
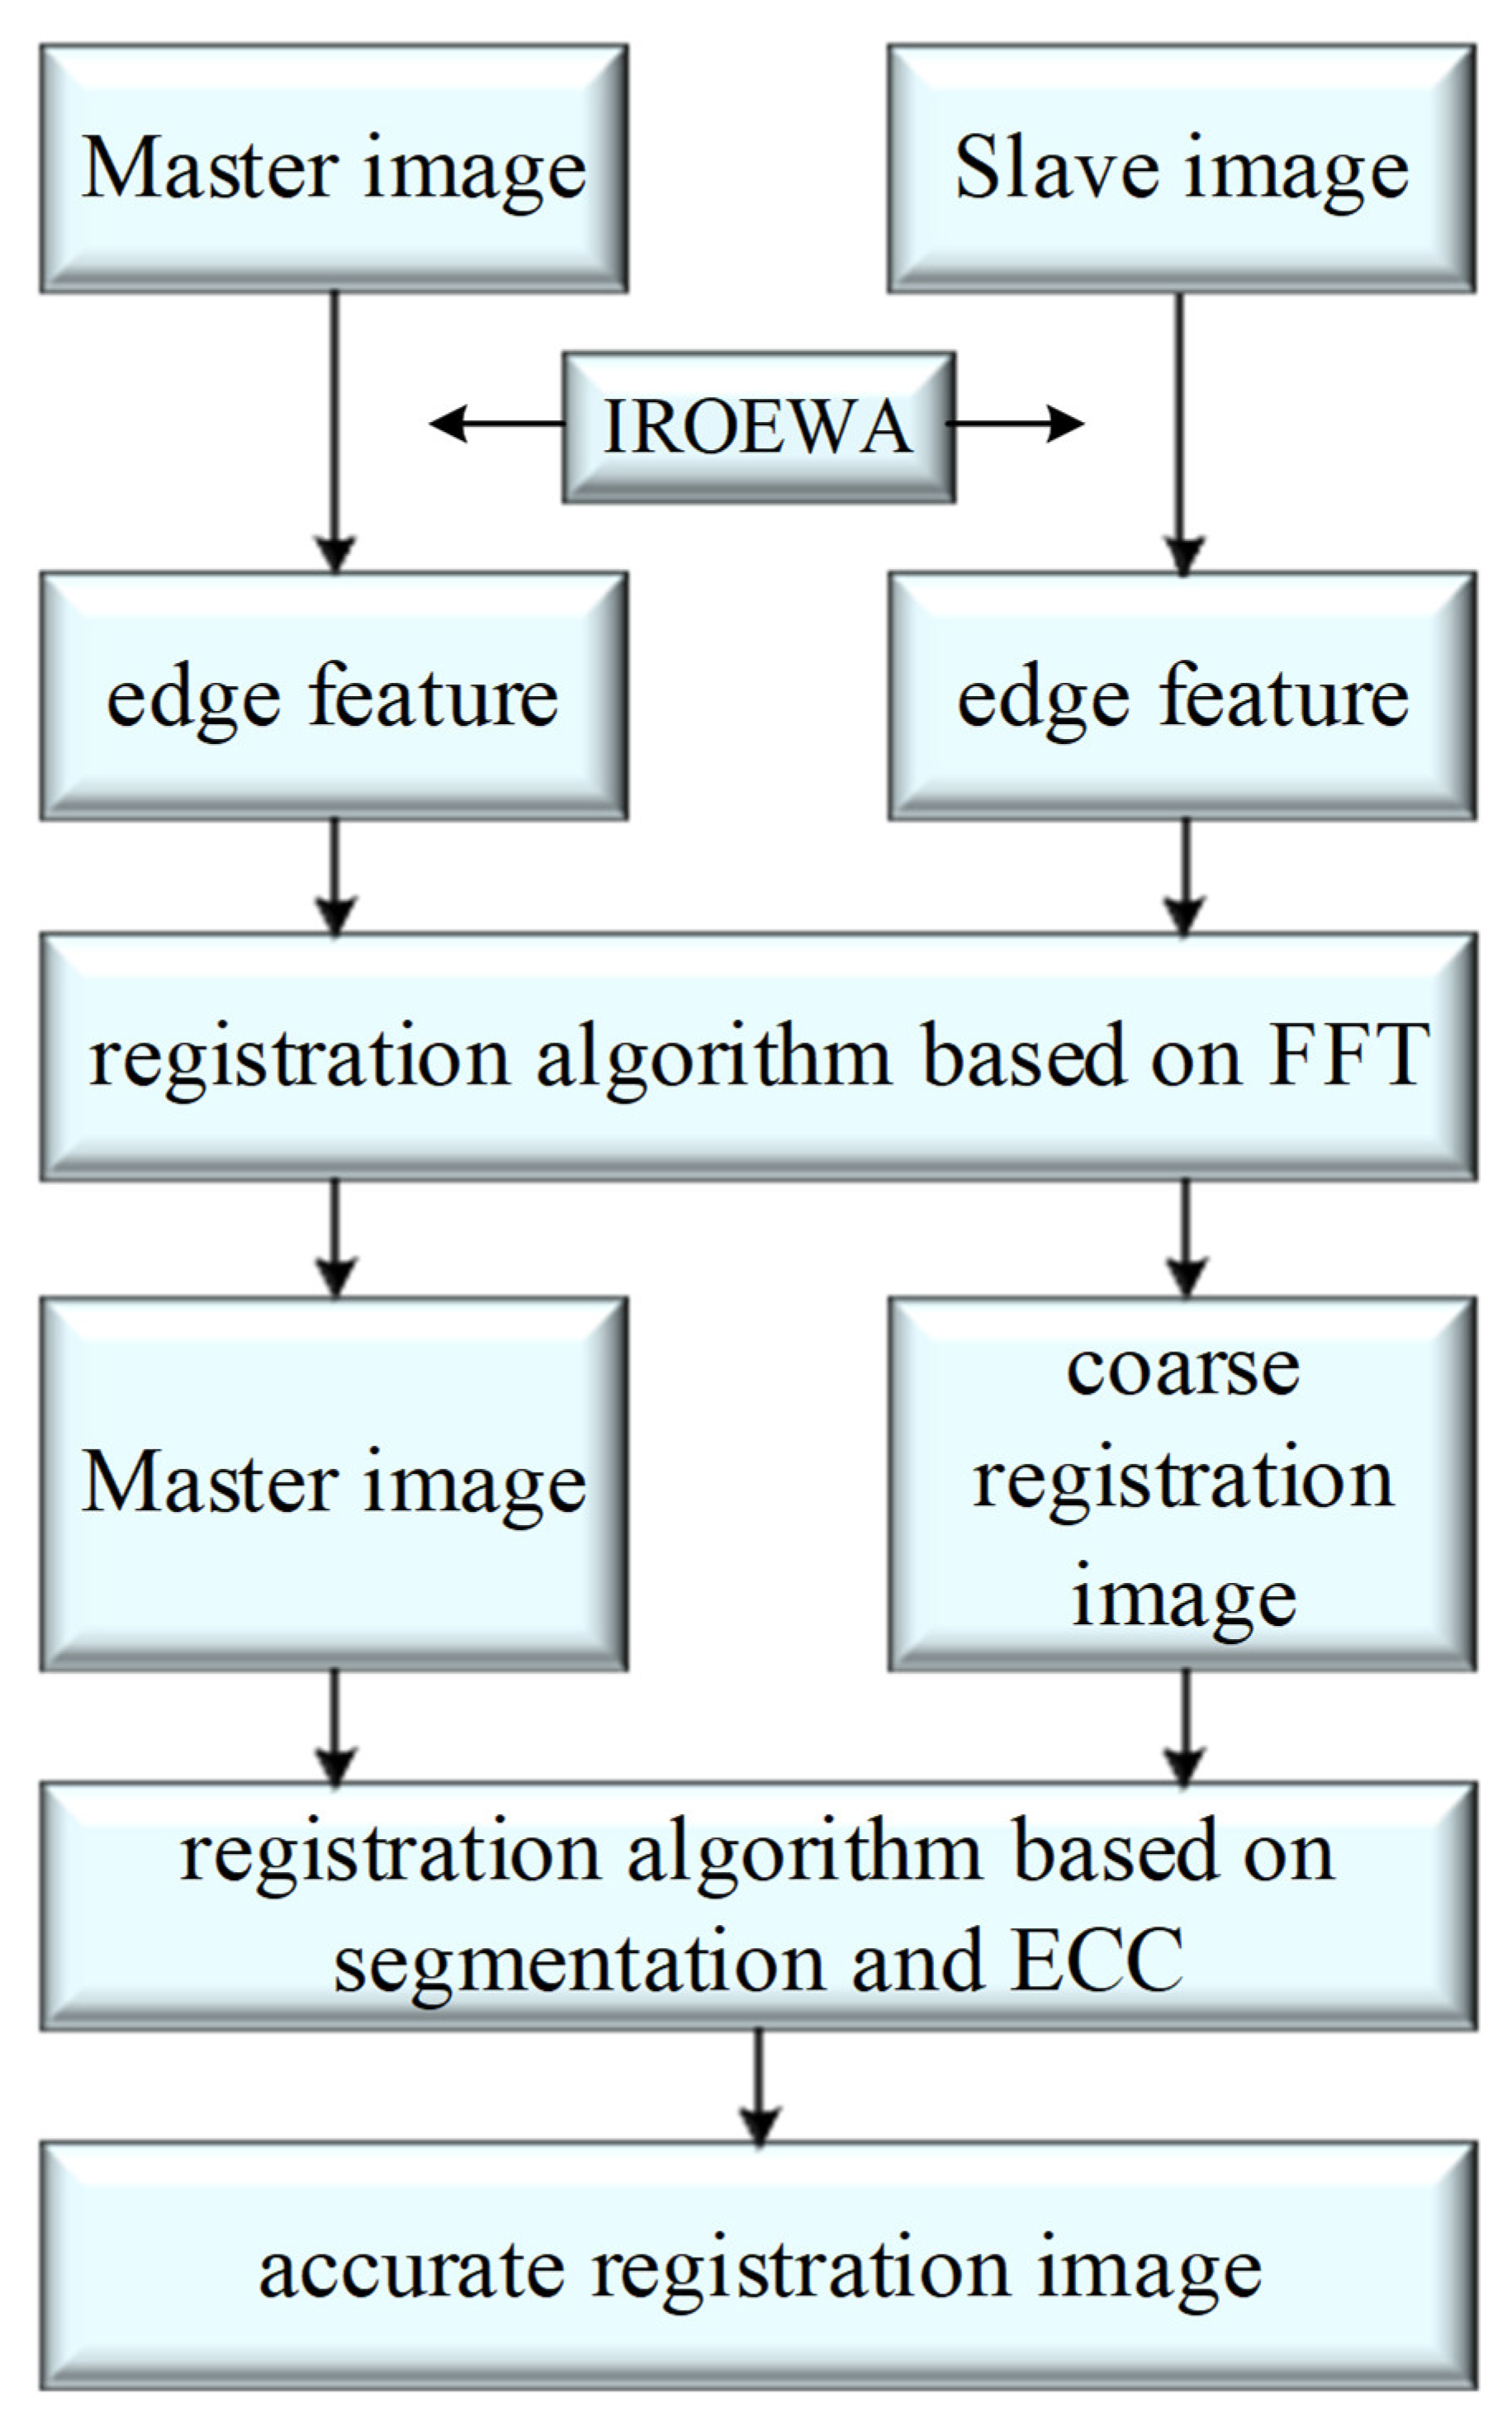
To solve the inability of the registration algorithm based on edge features and FFT to achieve high-accuracy registration between dual-frequency SAR images, we propose a registration algorithm, the flow chart of which is shown in Figure 5. In this algorithm, the master and slave images are coarsely registered using the registration algorithm based on edge features and FFT. Then, based on the ECC algorithm, the master image and the coarse-registration results are registered to realize accurate registration.

3.1. Principle of the Image-Registration Algorithm Based on ECC

The enhanced correlation coefficient (ECC) is an excellent similarity-evaluation index that has good invariance for brightness, contrast, and other distortions. Evagelidis et al. used the ECC as the optimization objective function and proposed an algorithm based on maximizing the ECC to realize image registration [24]. The authors also developed a linear iterative method to calculate the optimal parameters. This method solved the problem of the ECC transformation parameters being nonlinear functions and achieved excellent registration results while reducing the amount of calculations. At the same time, the algorithm offers certain invariance for gray deviations and gains between the master image and slave image [25].
The mathematical expression of image registration is outlined in Equation (15):
min p , α E ( p , α ) = min p , α x γ I 1 ( x ) H I 2 ( Φ ( x ; p ) ) , α p
where y = Φ ( x ; p ) denotes the coordinate-mapping relationship; H I , α denotes the brightness-transformation relationship and is parameterized by a vector of unknown parameters α ; I 1 and I 2 denote the master image and slave image, respectively; and p denotes the l p norm, usually p = 2 (Euclidean norm). In the algorithm based on the ECC, to eliminate the influence of the overall gray differences of the image, the expression of the objective function E p is
E ( p ) = i ¯   1 i ¯   1 i ¯   2 p i ¯   2 p 2
where     denotes the Euclidean norm, and i ¯   1 and i ¯   2 p denote the zero-mean vectors of i 1 and i 2 p , which are obtained by subtracting their corresponding arithmetic means from i 1 and i 2 p . Using the above process, to a certain extent, the algorithm based on the ECC cannot be affected by the overall gray level of the image and only considers geometric changes. As the minimization of E p can be equivalent to the maximization of the enhanced correlation coefficient, the registration problem can be transformed into finding the maximum value of the enhanced correlation coefficient. The expression of the enhanced correlation coefficient is outlined in Formula (17):
ρ ( p ) = i ¯ 1 t i ¯   2 p i ¯ 1 t i ¯   2 p = i ^ 1 t i ¯   2 p i ¯   2 p
where i ^ 1 = i ¯   1 / i ¯   1 is a constant that denotes the normalized version of the zero-mean reference vector. In Formula (17), the objective function ρ ( p ) has a nonlinear relationship with p , which means that the maximization of ρ ( p ) is a nonlinear problem. Finally, the algorithm based on the ECC continuously iterates through the gradient-based approaches to complete the optimization of the above nonlinear problem and correct the deformed image.
The authors in [26,27] noted that the algorithm based on the ECC is not significantly affected by the overall brightness of the image. Instead, the algorithm only focuses on geometric changes and has a certain ability to correct the deformation of images. However, for images with complex geometric distortions or large sizes, the homography matrix determined using the whole image cannot accurately correct the geometric misalignment caused by different degrees of distortion between images. Therefore, the registration of local images cannot be achieved well.

3.2. The Accurate Registration of Dual-Frequency SAR Images Based on Segmentation and ECC

To solve the problem of complex geometric distortions between high- and low-frequency SAR images, we divide the coarse-registration image and master image into blocks, apply the algorithm based on the ECC to register every block, and ultimately splice the registered blocks into the whole image. A schematic of the algorithm is shown in Figure 6.
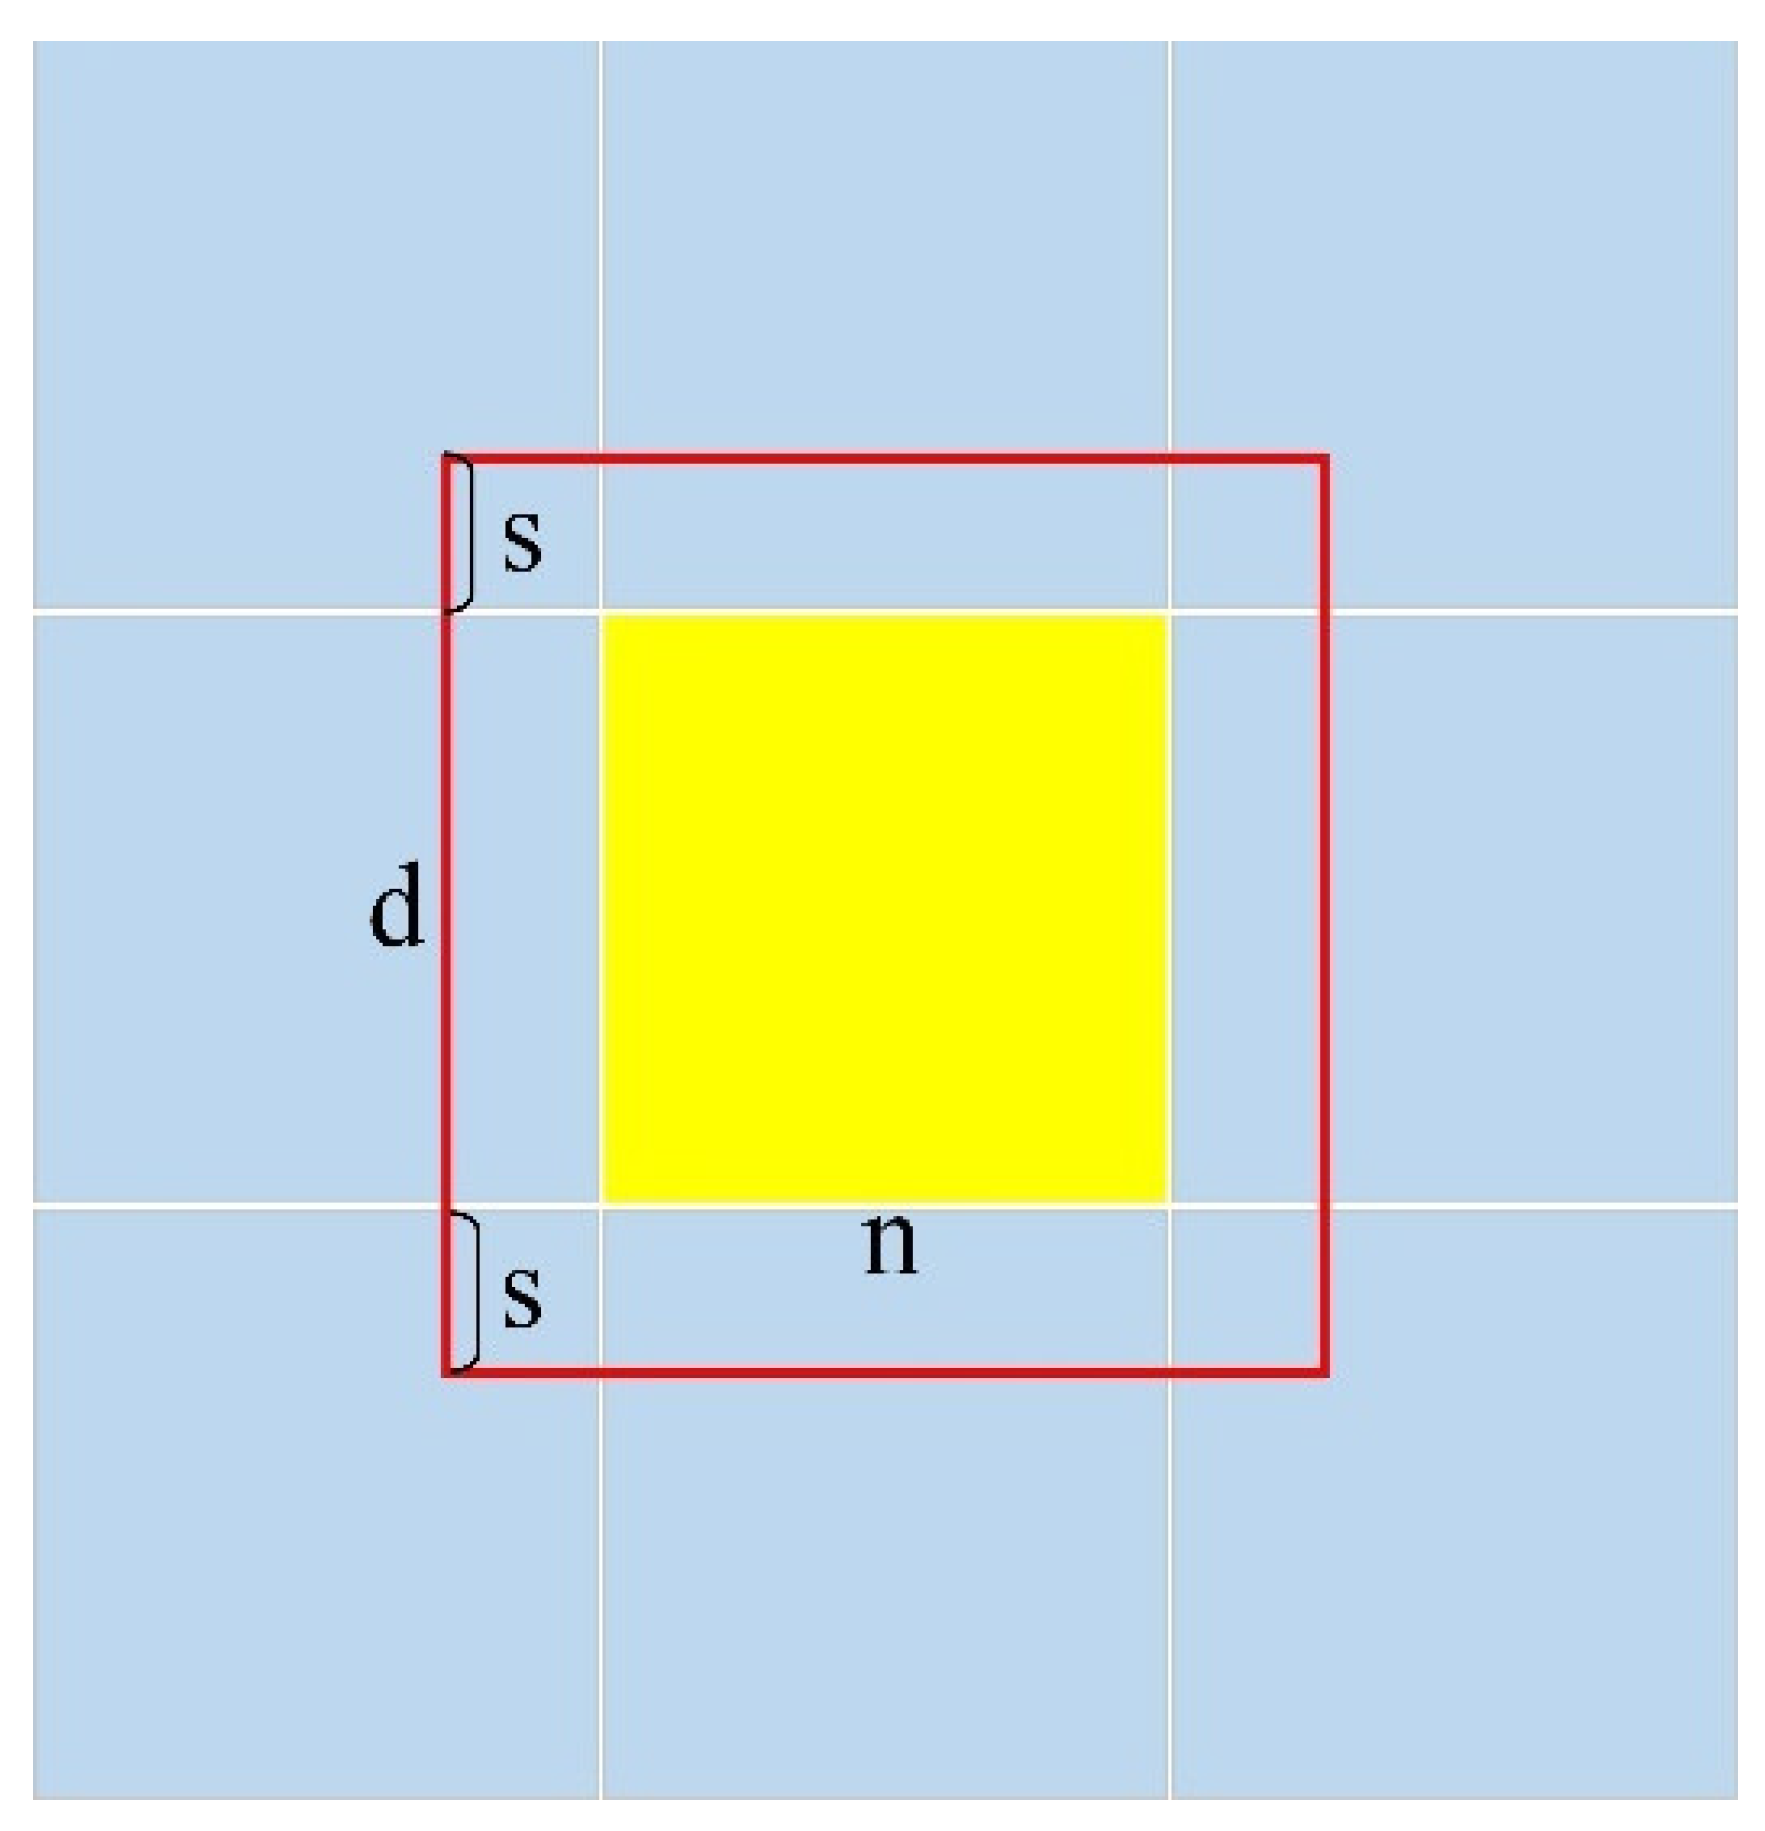
In the process of image segmentation, uniform segmentation is a simple and effective method by which the image is uniformly segmented into k × k sub-images. Figure 7 shows the 3 × 3 uniform blocking mode. After the image is evenly segmented, the size of each sub-image is n × n (as shown in the yellow area). There is no intersection between adjacent sub-images, which will lead to dislocation at the junction of sub-images in the process of creating the image mosaic. To solve the above problem, we make an improvement based on uniform segmentation. When dividing the image, each sub-image is expanded to a certain extent, as shown in the area marked with the red wireframe in Figure 7. The size of this area is d × d, which is obtained by enlarging s in four directions based on the yellow area. Through the above improvement, a common area is formed between adjacent sub-images. In the process of creating the image mosaic, the yellow area is involved in stitching, and the common area plays a transitional role in reducing splicing distortion.
Secondly, when the image is uniformly segmented into k × k sub-images, the value of k directly affects the quality of the registration. Experimental results show that too small a k value will lead to a poor correction effect in some local areas, while too large a k value will lead to an increase in the amount of computation, and the pair of sub-images may be mismatched. The structural-similarity index measure (SSIM) is an indicator of the similarity between two images, which is evaluated by comparing the structural information between the images [28]. This paper will determine the k value based on SSIM. Notably, due to the increase in the amount of computations and the possible mismatch of sub-image pairs when k is too large, the k value in this paper will not exceed 5. The specific method for determining k is as follows:
Step 1. Uniformly divide the image pairs into m × m sub-images.
Step 2. Calculate the SSIM values of each pair of sub-images.
Step 3. Find the minimum value of the SSIM values obtained in Step 2 and denote it as S S I M m .
Step 4. Compare all S S I M m values, and let k be equal to m, which corresponds to the minimum value of S S I M m .
When the SSIM between a pair of sub-images is smaller, the similarity of the structure between images is lower. That is to say, the quality of the registration is worse, which means that this pair of sub-images needs to be finely registered. Therefore, under this method, the SSIM values are minimum.
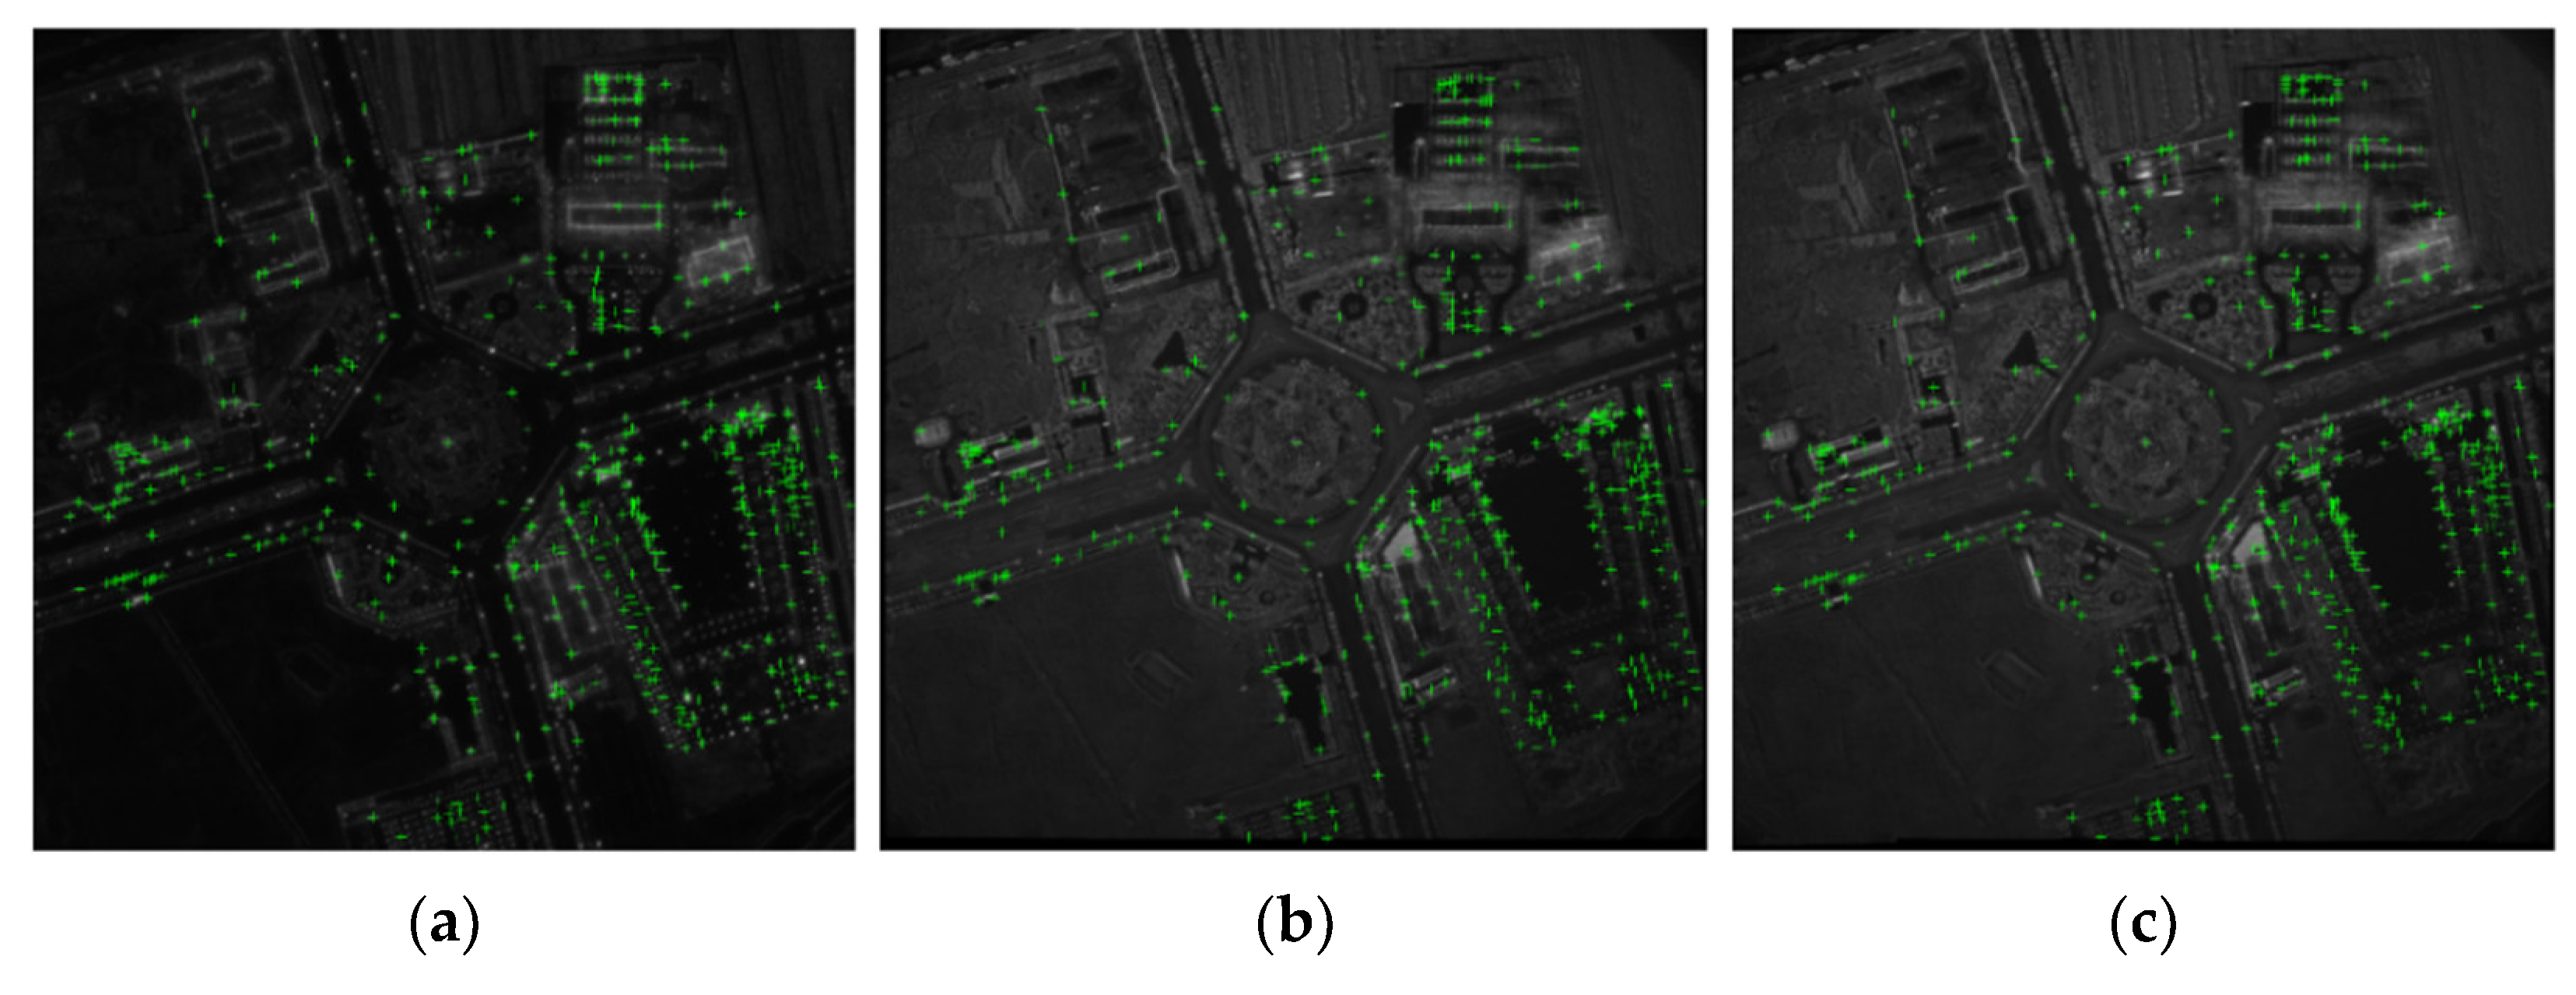
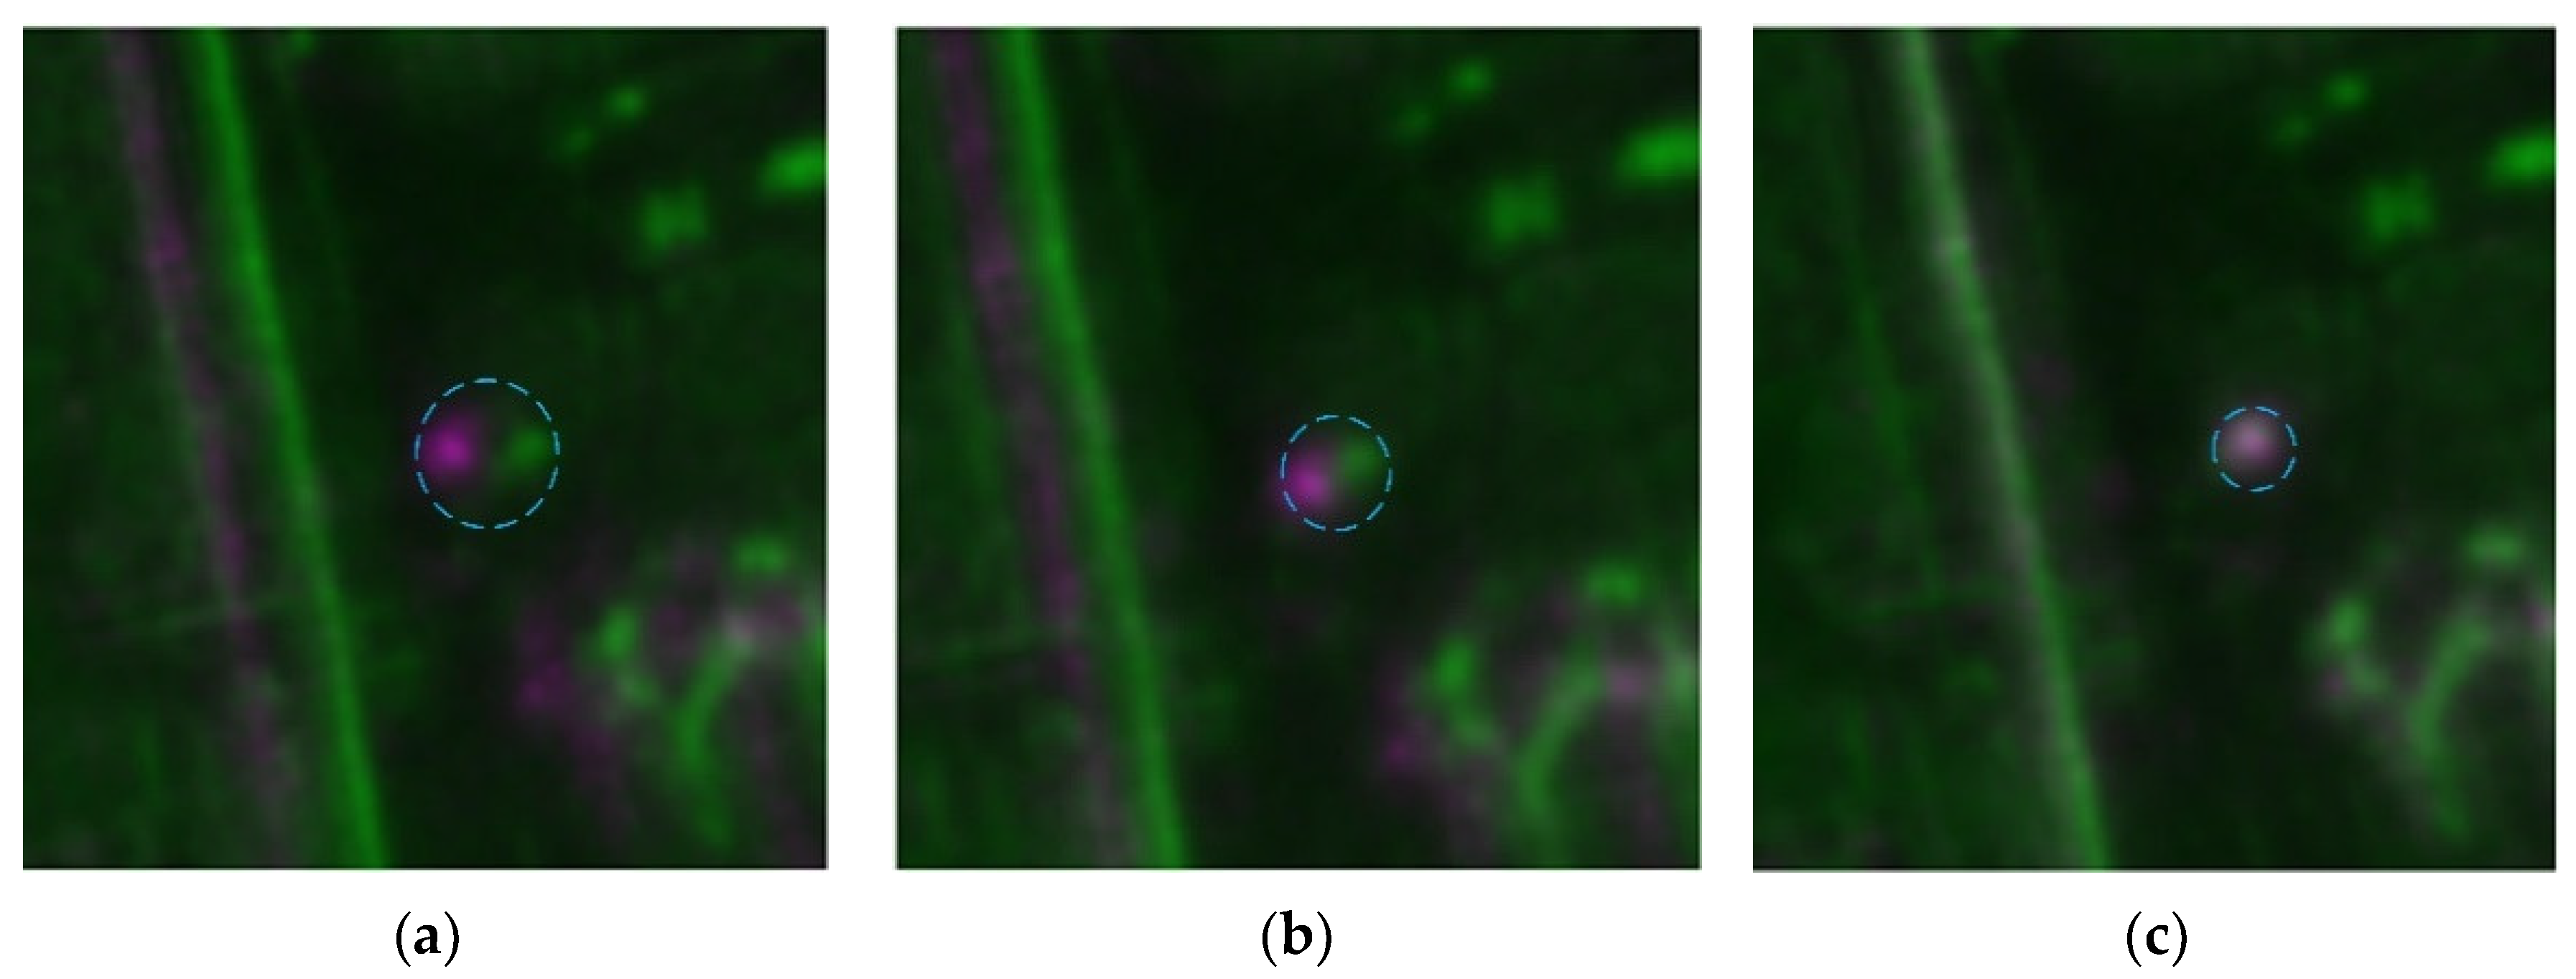
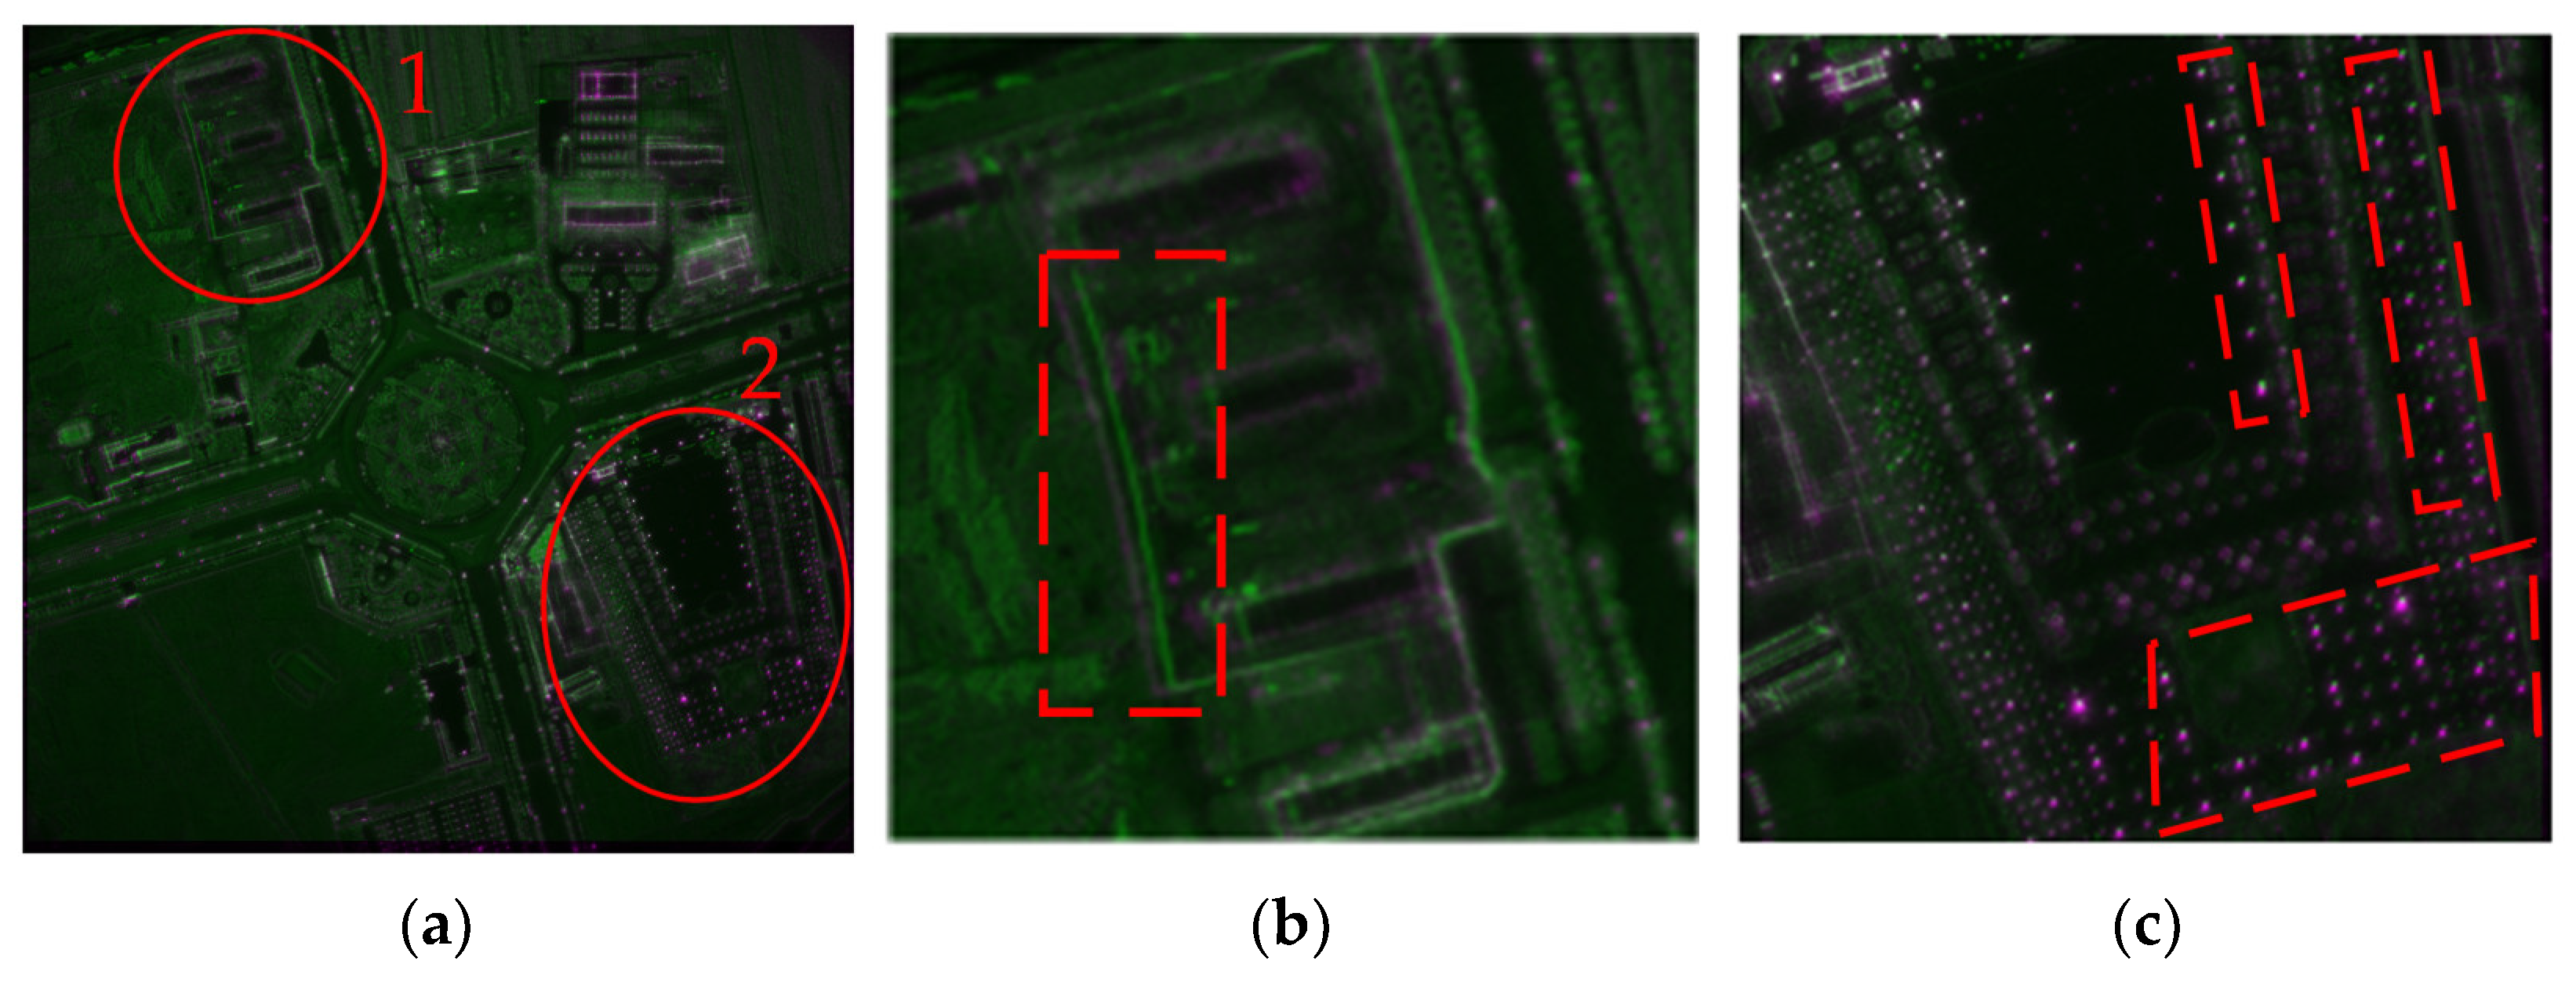
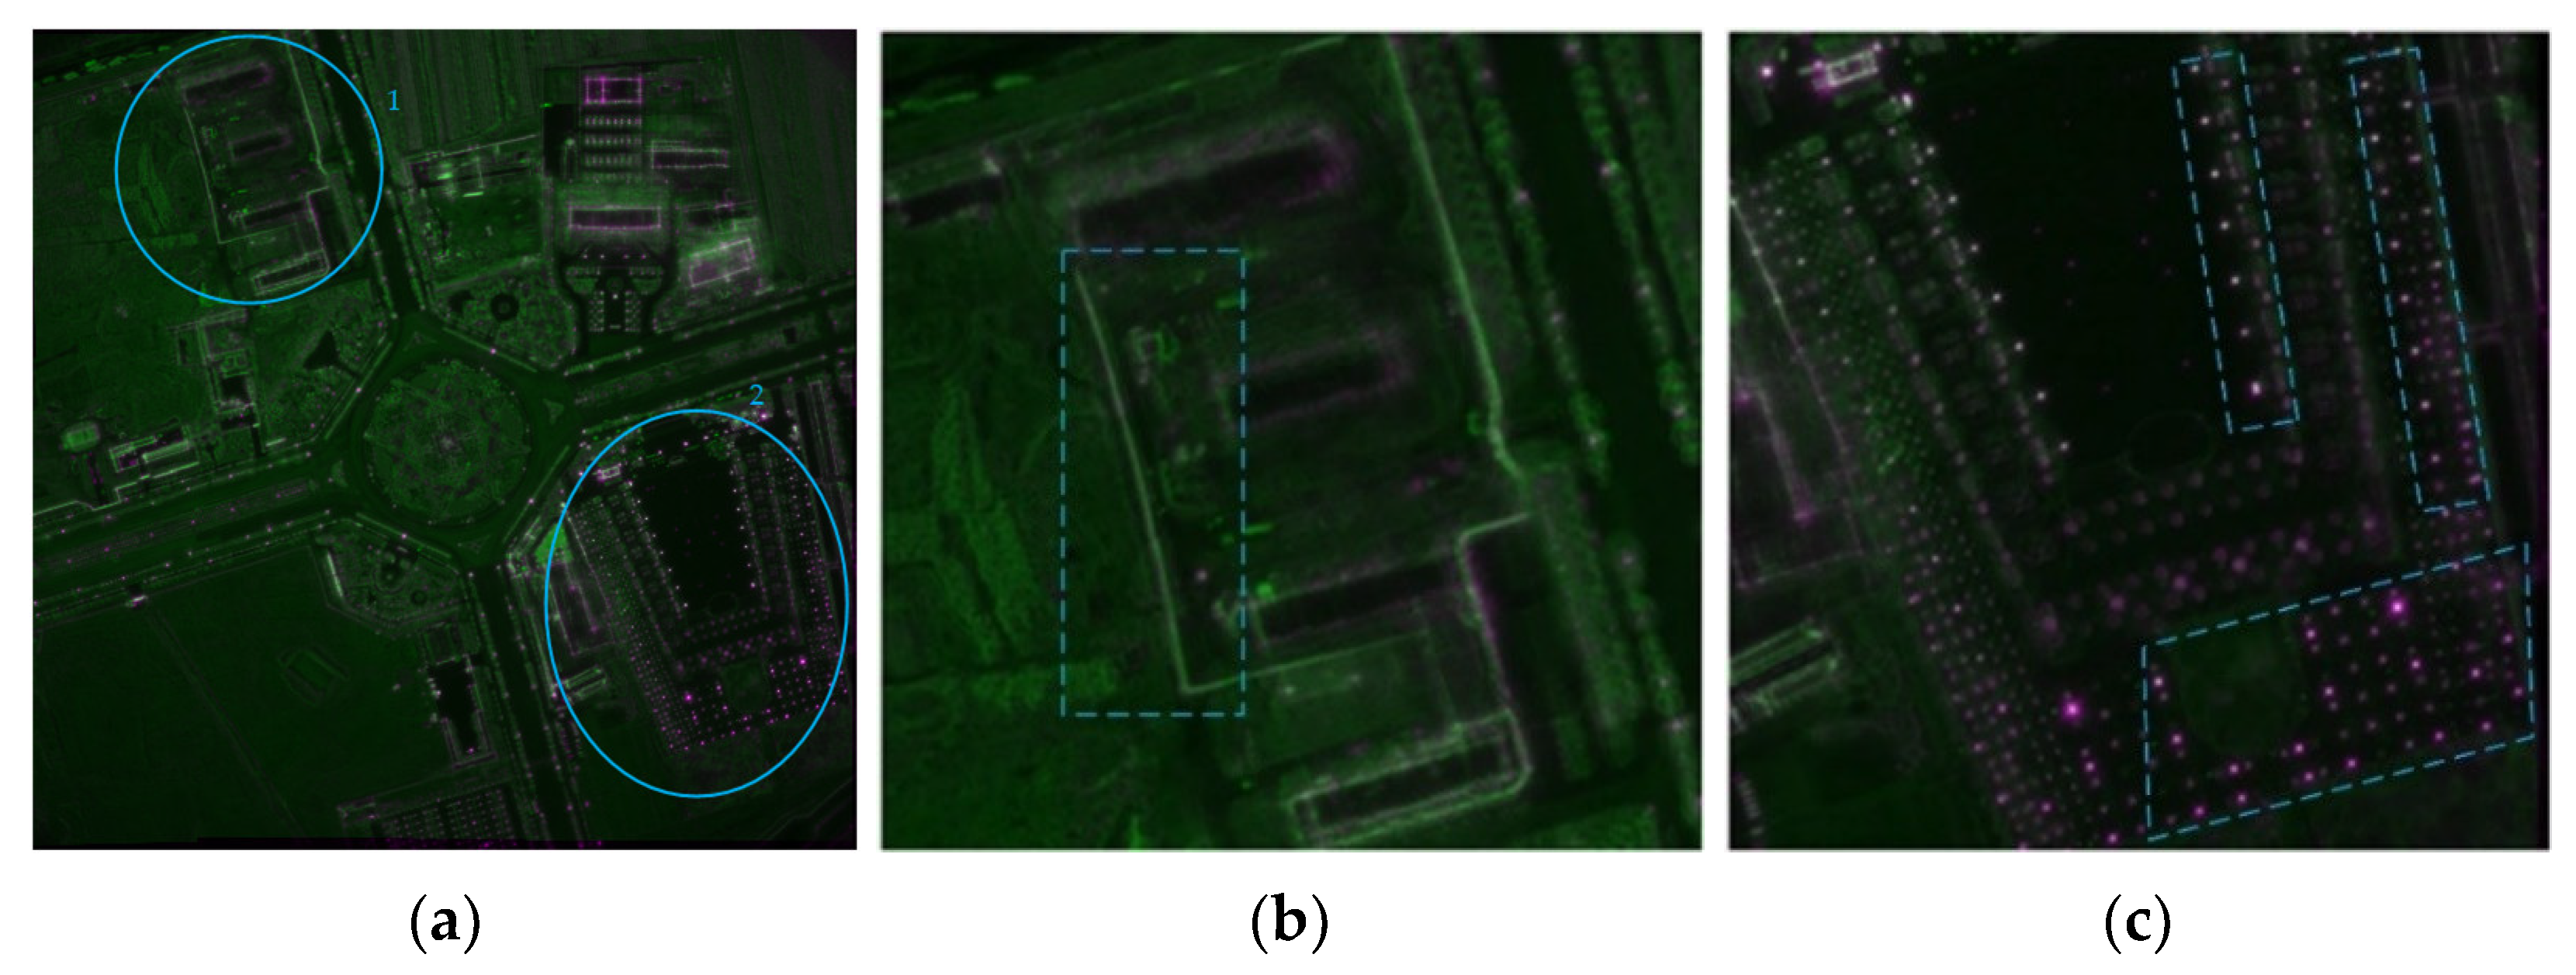
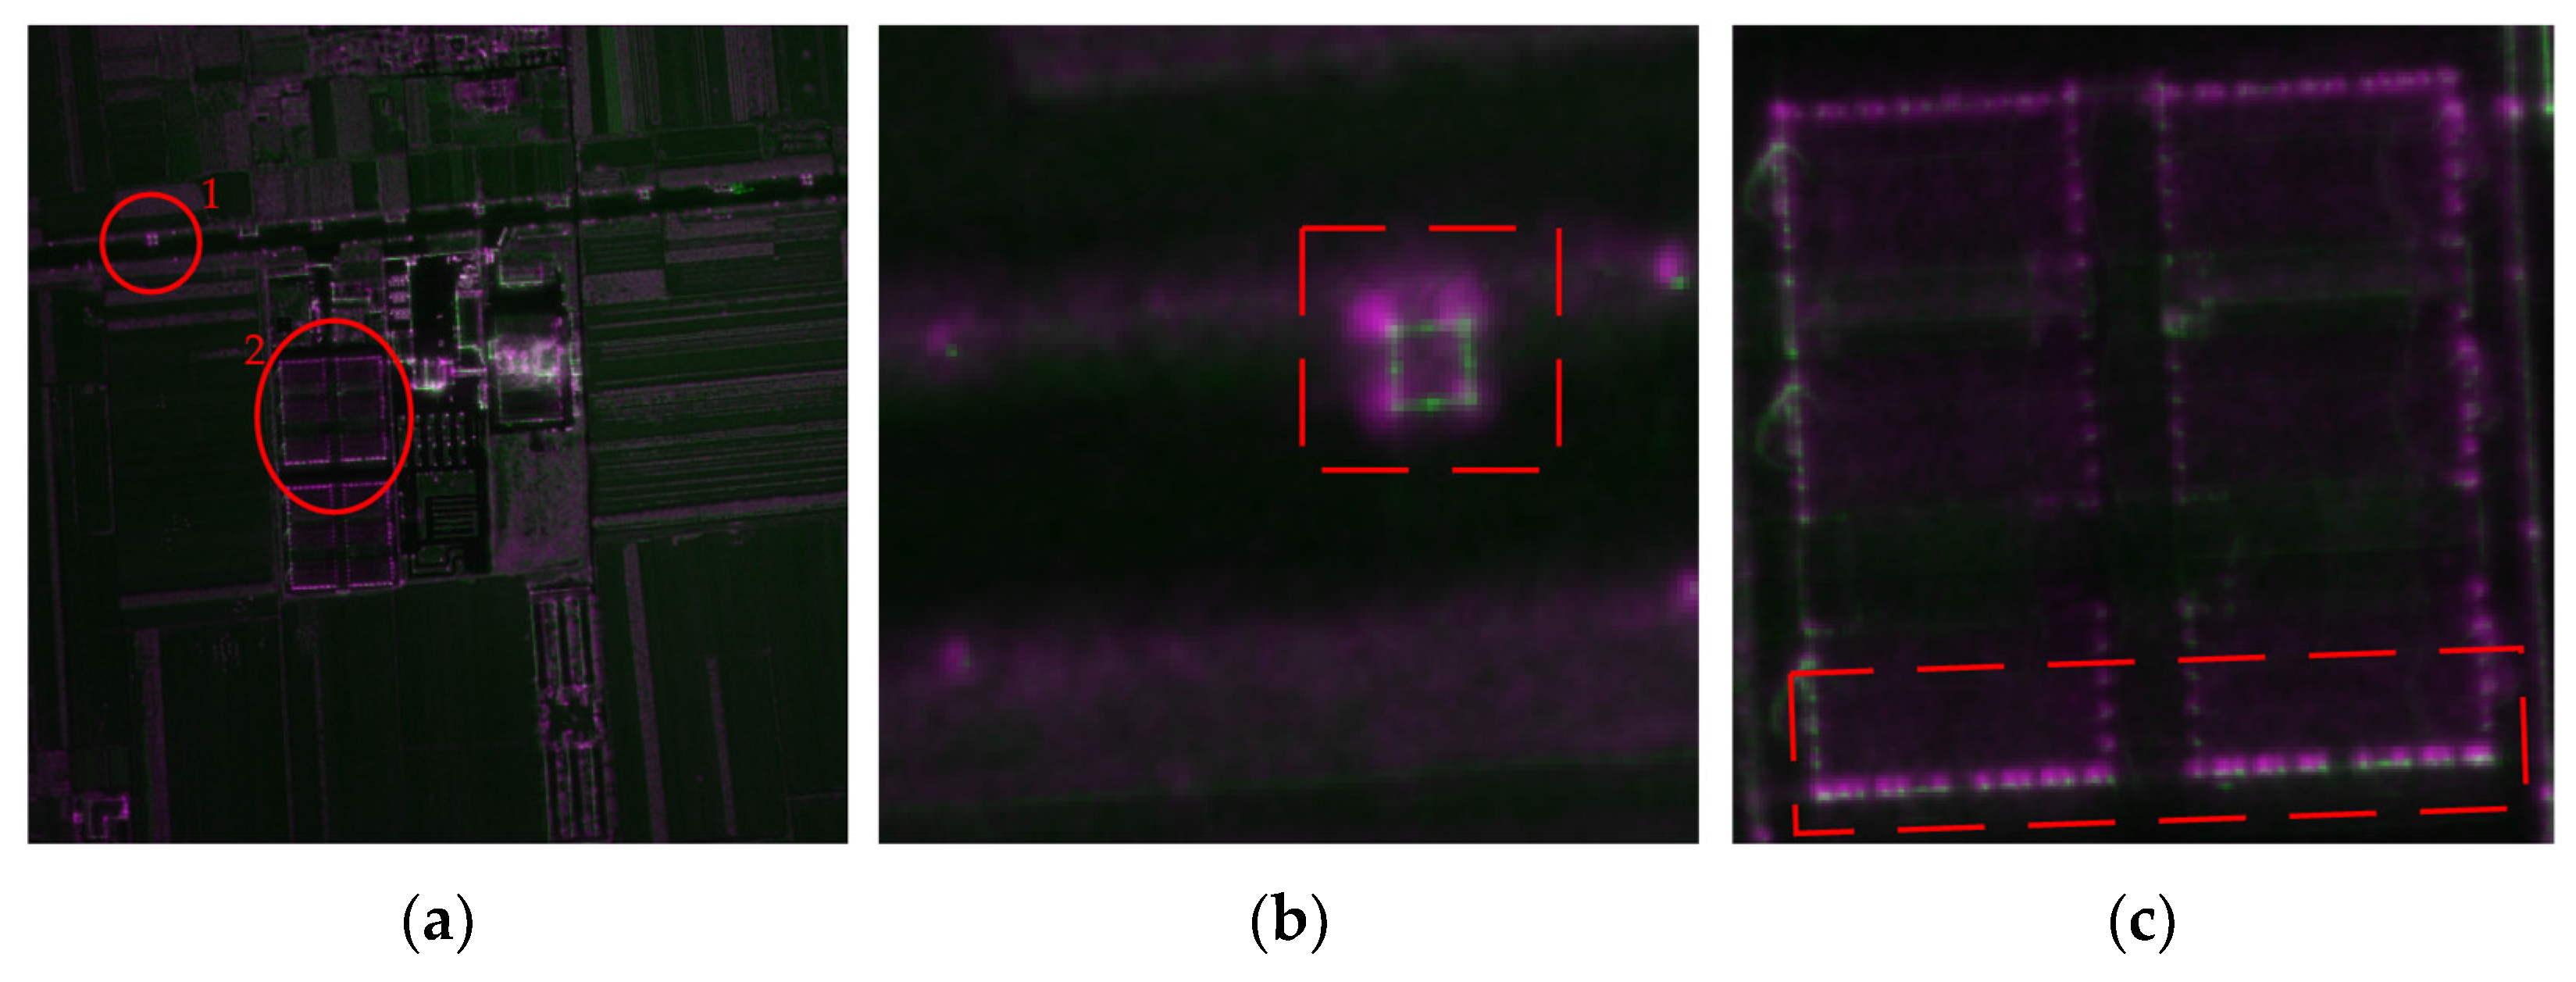
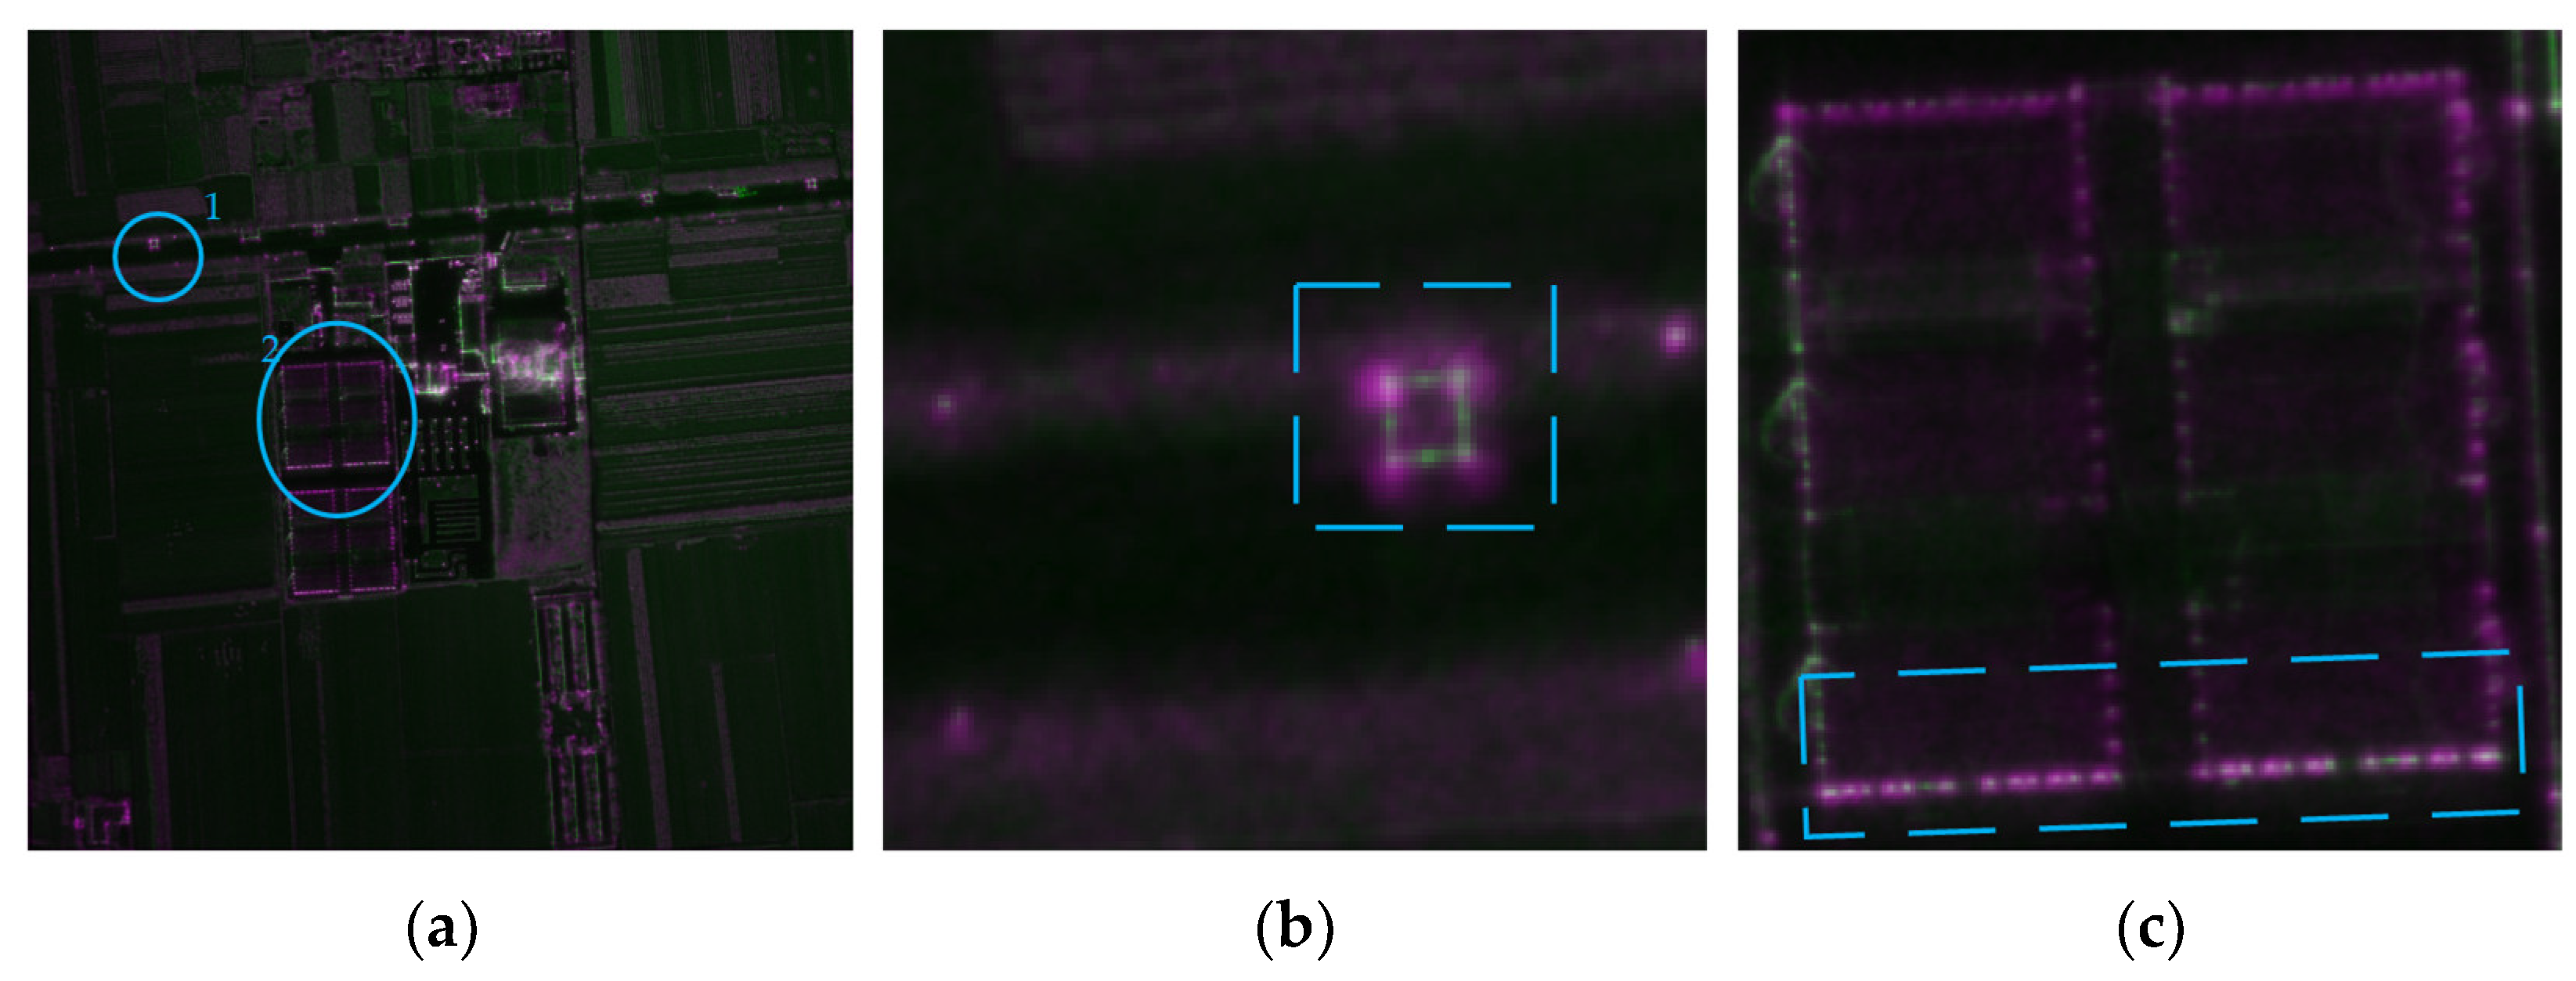
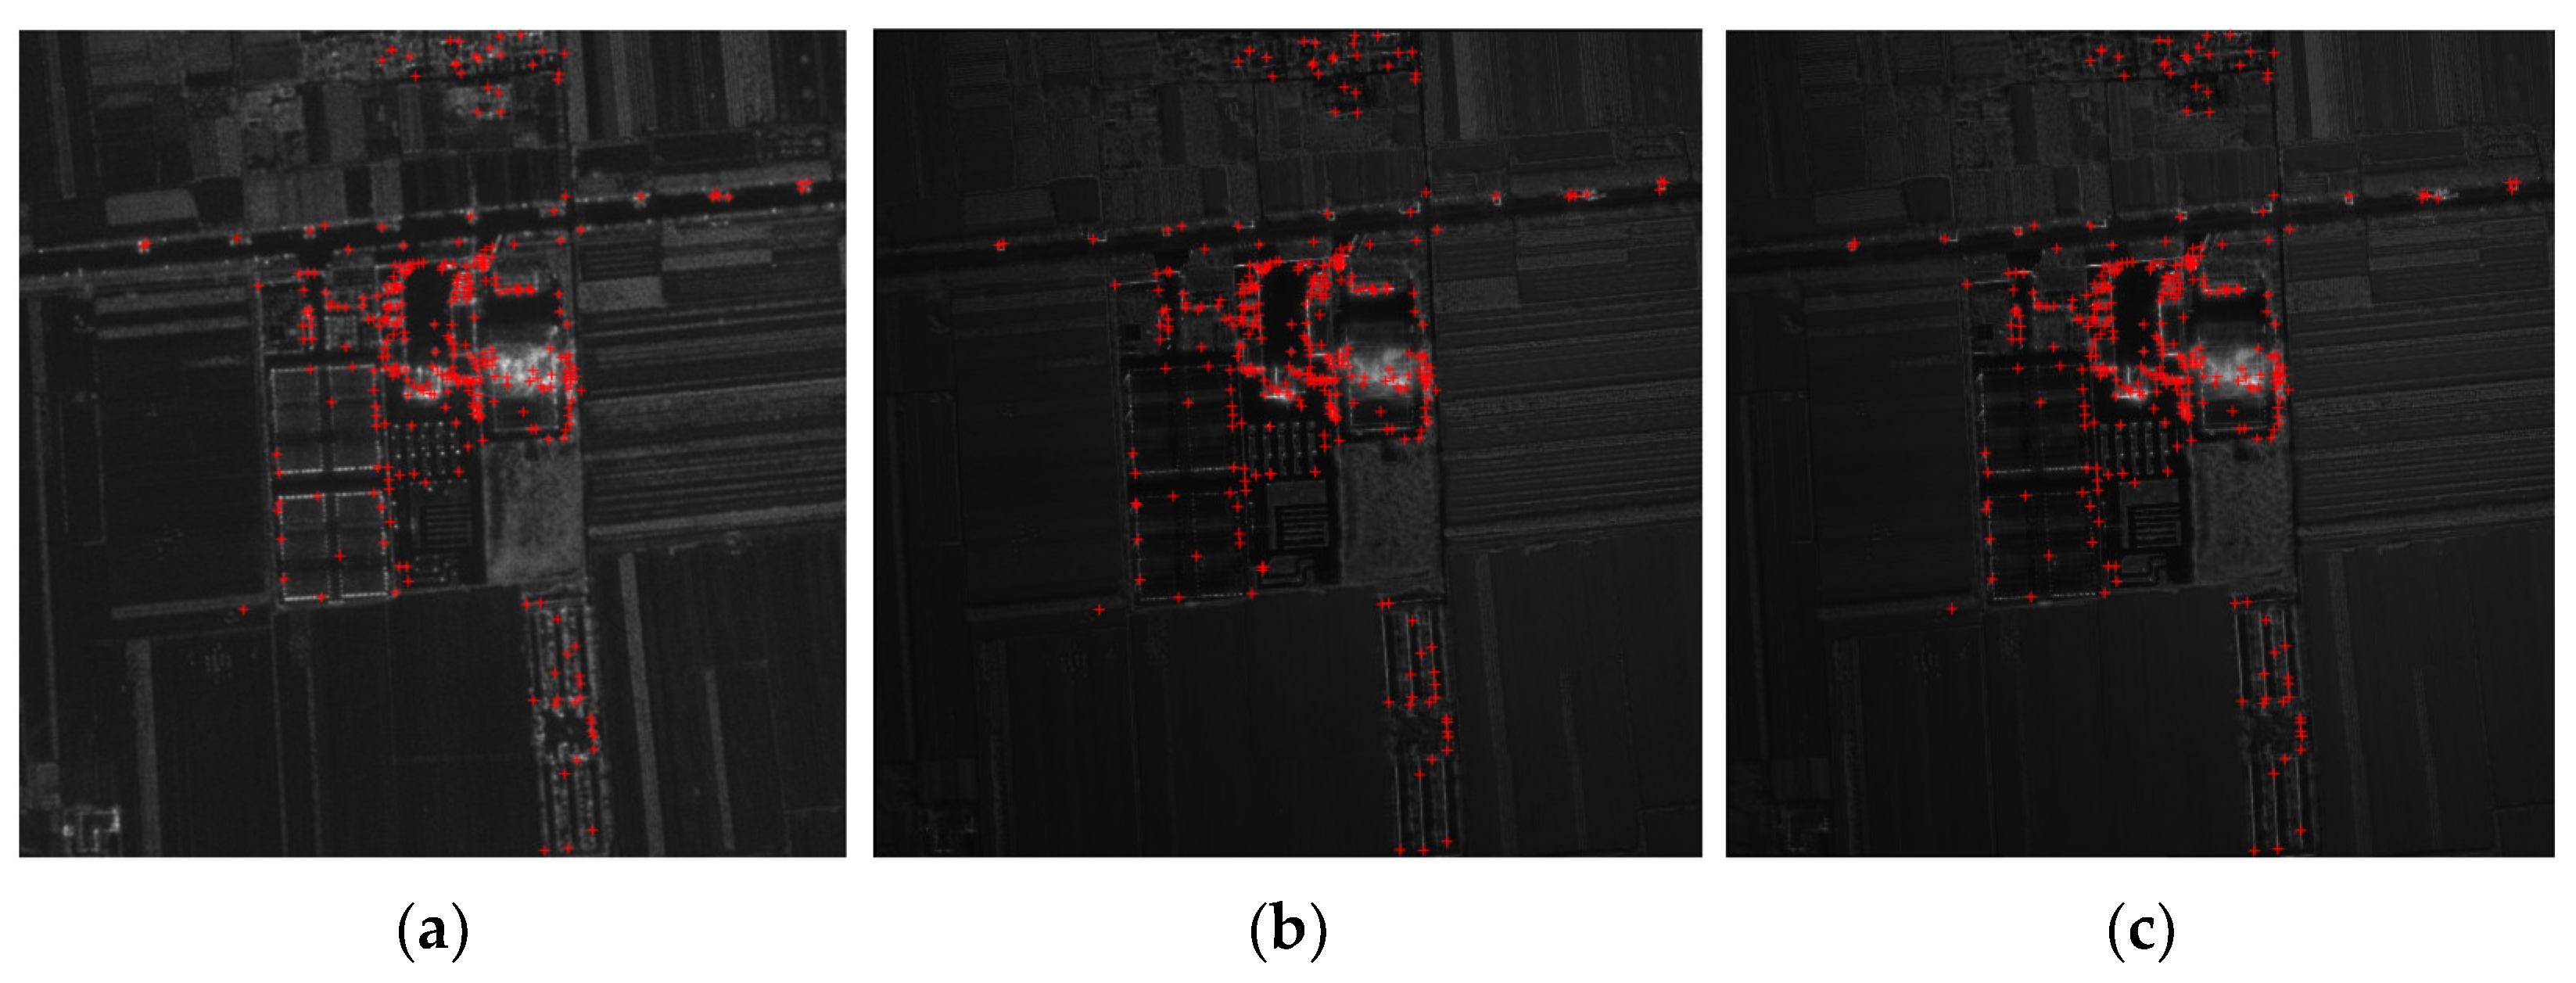
Figure 8a shows the pseudo-color superposition of the master image and coarse-registration image. Figure 8b shows the pseudo-color superposition of the master image and accurate-registration image obtained based on the registration results using the algorithm based on the ECC. Figure 8c shows the pseudo-color superposition of the master image and accurate-registration image obtained based on the registration results using the algorithm based on segmentation and the ECC. In the blue-dotted-line area of Figure 8, the red and green points represent the actual positions of the same target in different images. By calculating the distance between these two points, the error of the coarse-registration image is about 16 pixels. The error of the accurate-registration image based on the ECC is about 7 pixels, which shows that, to some extent, the algorithm based on the ECC can correct the geometric distortion between images, but the correction accuracy is still not sufficient. In the accurate-registration image based on segmentation and the ECC, the two points basically coincide, with no obvious difference in vision. The experimental results show that the algorithm based on segmentation and the ECC proposed in this paper can achieve a better correction effect for the local geometric distortion between images.

4. Experiment and Analysis

4.1. The Processing of Measured Data

To verify the effectiveness of the method proposed in this paper, we used airborne L-band and Ku-band CSAR images for experimental verification. The data were recorded by the National University of Defense Technology using the L-band and Ku-band SAR systems independently developed and enrolled in Weinan city, Shaanxi Province, in November 2020. Two groups of dual-frequency, high-spatial-resolution SAR images (Group 1 and Group 2, respectively) were processed. For Group 1, an optical image of the actual observation scene where the latitude is 34°50′N and the longitude is 109°35′E is shown in Figure 9a. The corresponding L-band and Ku-band CSAR images, for which the polarization is HH and the angle of incidence is 39°, are shown in Figure 10a,c, respectively. The resolution of the L-band CSAR image is 0.4 m, and the resolution of the Ku-band CSAR image is 0.15 m. For Group 2, an optical image of the actual observation scene where the latitude is 34°53′N and the longitude is 109°36′E is shown in Figure 9b. The corresponding L-band and Ku-band CSAR images, for which the polarization is HH and the angle of incidence is 43°, are shown in Figure 11a,c, respectively. The resolution of the L-band CSAR image is 1 m, and the resolution of the Ku-band CSAR image is 0.4 m.
According to the registration method proposed in this paper, first, the edge information of the L-band and Ku-band CSAR images are extracted using the IROEWA algorithm; the results are shown in Figure 12a,b (for Group 1) and Figure 13a,b (for Group 2). Secondly, the L-band CSAR image is set as the master image, and the Ku-band CSAR image is set as the slave image. Based on the edge features, the coarse-registration results are determined using the registration algorithm based on FFT; the results are shown in Figure 12c (for Group 1) and Figure 13c (for Group 2). Finally, using the image-registration method based on segmentation and the ECC, the coarse-registration results are registered again, and accurate registration of the L-band and Ku-band CSAR images is achieved. The results are shown in Figure 12d (Group 1) and Figure 13d (Group 2).

4.2. The Analysis of Experimental Results

To evaluate the quality of registration under the proposed method, we use both subjective and objective measurements. In the subjective evaluation, the registered image and master image are superimposed in pseudo-color, and the quality of the registration result can be visually determined, as shown in Figure 14, Figure 15, Figure 16 and Figure 17. The pseudo-color superposition is used to create a composite RGB image showing the master and registered image overlaid in different color bands, thereby offering a visualization of the differences between the images. The registered image is related to band G, the master image is related to bands R and B, and the registered image is overlaid on the master image. In the objective evaluation, we adopt the similarity measure, alignment metric, and root mean square error as evaluation indexes.
The similarity measure between images can be expressed as
C ( A , B ) = i j ( A ( i , j ) u ( A ) ) ( B ( i , j ) u ( B ) ) i j ( A ( i , j ) u ( A ) ) 2 i j ( B ( i , j ) u ( B ) ) 2 1 / 2
where u ( A ) and u ( B ) denote the mean values of gray pixels in image A and B, respectively. The similarity measure determines the correlation within an absolute scale [−1, 1]. Under appropriate assumptions, the value of the similarity measure is linearly related to the similarity between two images. Therefore, the greater the similarity measure is between two images, the smaller the difference and the higher the matching accuracy will be.
The alignment metric (AM) originates from the human eye’s understanding of the alignment of two images in content. When two images are aligned in the content, the staggered area after they overlap is the smallest. From a microscopic point of view, this means that the gray level of another image corresponding to each gray level of an image in the pixel position is the most stable, and the variance is the smallest in terms of mathematics, which is expressed as:
AM I 1 , I 2 = 1 σ 1 , 2 2 ¯ σ 2 2 + σ 2 , 1 2 ¯ σ 1 2 = σ 1 2 σ 2 2 σ 1 , 2 2 ¯ σ 1 2 + σ 2 , 1 2 ¯ σ 2 2
where σ 1 2 and σ 2 2 denote the variance of I 1 x , y and I 2 x , y , respectively, and σ 1 , 2 2 ¯ and σ 2 , 1 2 ¯ are determined in Equation (20).
For each gray level n = i , H 1 n and H 2 n represent the number of pixels with gray level i for image I 1 x , y and I 2 x , y , respectively. The ratio is, respectively, p 1 i = H 1 i M × N and p 2 i = H 2 i M × N . Then, σ 1 , 2 2 ¯ and σ 2 , 1 2 ¯ are expressed as:
{ σ 1 , 2 2 ¯ = n p 1 ( n ) σ 1 , 2 2 ( n )   σ 1 , 2 2 ( n ) = 1 H 1 ( n ) I 1 ( x , y ) = n ( I 2 ( x , y ) E 1 , 2 ¯ ( n ) ) 2 E 1 , 2 ¯ ( n ) = 1 H 1 ( n ) I 1 ( x , y ) = n I 2 ( x , y )     { σ 2 , 1 2 ¯ = n p 2 ( n ) σ 2 , 1 2 ( n )   σ 2 , 1 2 ( n ) = 1 H 2 ( n ) I 2 ( x , y ) = n ( I 1 ( x , y ) E 2 , 1 ¯ ( n ) ) 2 E 2 , 1 ¯ ( n ) = 1 H 2 ( n ) I 2 ( x , y ) = n I 1 ( x , y )  
It can be seen that the more aligned two images are, the greater their AM will be. Moreover, the establishment of this relationship is not affected by differences in the gray attributes of the two images, nor does it require a linear relationship between the gray information of the two images.
The root mean square error (RMSE) is an evaluation index that can accurately reflect the quality of the registration. The corresponding point pairs are needed to calculate the RMSE of registration results. RMSE refers to the deviation between the measured value and the true value in a limited number of measurements, which is expressed as:
RMSE = d i 2 n
where n is the number of measurements and d i denotes the deviation between a pair of the measured value and the true value.
Using the above evaluation indexes, the coarse-registration results and accurate-registration results are evaluated both subjectively and objectively. In the subjective evaluation, the coarse-registration image and accurate-registration image are superimposed with the master image in pseudo-color, as shown in Figure 14 and Figure 15 (for Group 1) and in Figure 16 and Figure 17 (for Group 2). Figure 14, Figure 15, Figure 16 and Figure 17, (b) and (c) illustrate two subsets of (a). In Figure 14 and Figure 16, it can be seen that the coarse-registration image is basically registered overall but with mismatches in some regions (the areas marked with a red dotted box). As shown in Figure 15 and Figure 17, the mismatched regions in the coarse-registration images have been solved well (the areas marked with a blue dotted box), and high-quality, high-precision registration has been obtained.
In the objective evaluation, the similarity measure, the AM and RMSE between the master image and coarse-registration image or accurate-registration image are calculated. The results are shown in Table 1. When calculating the RMSE, the feature points are first obtained using the SIFT algorithm [29], retaining 527 pairs in Group 1 and 319 pairs in Group 2 after selection, as shown in Figure 18 and Figure 19, respectively.
As can be seen from the results, after accurate registration, the similarity measure and AM between the master image and registered image are improved to a certain extent. The RMSE is greatly improved, with a reduction from 6.89 pixels in coarse registration to 1.87 pixels in Group 1 and from 5.46 pixels in coarse registration to 1.90 pixels in Group 2. This result indicates that high-quality registration is achieved, which proves the effectiveness of the method proposed in this paper.

5. Conclusions

This paper proposed a registration method that is suitable for dual-frequency SAR images with high resolution. Firstly, this method uses a registration algorithm based on FFT and the edge features of images to realize the rapid coarse registration of two images, which can avoid the interference of nonlinear gray differences between images. This measure reduces the search range of the subsequent accurate registration and improves the arithmetic speed of registration. Using the registration algorithm based on the ECC combined with the concept of segmenting can reduce the complexity of geometric distortions and the gray relationship between high-resolution SAR images from different bands, thereby achieving high-precision registration of the images. Finally, based on the measured data, we verified the effectiveness and practicability of the proposed method. Furthermore, this paper is based on dual-frequency CSAR data from the same platform. However, the availability of dual-frequency SAR satellite data from the same platform is not a reality yet. In this case, the imaging parameters (such as the imaging mode, the incidence angle, and the observing time, etc.) of dual-frequency SAR satellite data are different, and the edge feature of the same object may be largely deformed or even completely different. Extending this method to the registration of dual-frequency SAR satellite images will be the goal of our future work.

Author Contributions

Conceptualization, J.H. and D.A.; Data curation, D.A.; Formal analysis, D.A.; Funding acquisition, L.C. and D.F.; Investigation, Y.L.; Methodology, J.H.; Project administration, D.A.; Resources, D.A.; Software, J.H. and Y.L.; Supervision, Z.Z.; Validation, Z.Z.; Visualization, Y.L.; Writing—original draft, J.H.; Writing—review & editing, J.H. and J.C. All authors have read and agreed to the published version of the manuscript.

Funding

This work was supported in part by the National Science Foundation of China under Grants 62101566 and 62101562.

Conflicts of Interest

The authors declare no conflict of interest.

References

  1. Doerry, A.W.; Dickey, F.M. Synthetic aperture radar. Opt. Photonics News 2004, 15, 28–33. [Google Scholar] [CrossRef]
  2. Guo, H.D.; Zhang, L. 60 years of radar remote sensing: Four-stage development. J. Remote Sens. 2019, 23, 1023–1035. [Google Scholar]
  3. Chang, Y.; Zhou, Z.; Chang, W. A new algorithm for fusion of high and low band SAR images. In Proceedings of the 2005 China Conference on Synthetic Aperture Radar, Hefei, China, 2–4 November 2005; pp. 283–287. [Google Scholar]
  4. Li, S.T.; Li, C.Y.; Kang, X.D. Development status and future prospects of multi-source remote sensing image fusion. Natl. Remote Sens. Bull. 2021, 25, 148–166. [Google Scholar]
  5. Song, Y.; Zhou, L. Multi-bands SAR Image Fusion Algorithm Based on Dual-features and NSCT. J. Signal Process. 2020, 36, 93–101. [Google Scholar]
  6. Zhou, Y.; Yu, Q.; Hua, S.; Yin, W.; Li, Y. An automatic global-to-local image registration based on SIFT and thin-plate spline (TPS). In Proceedings of the IEEE Transactions on International Geoscience and Remote Sensing Symposium-IGARSS, Melbourne, VIC, Australia, 21–26 July 2013; pp. 2535–2538. [Google Scholar]
  7. Zitova, B.; Jan, F. Image registration methods: A survey. Image Vis. Comput. 2003, 21, 977–1000. [Google Scholar] [CrossRef] [Green Version]
  8. Pratt, W.K. Correlation techniques of image registration. IEEE Trans. Aerosp. Electron. Syst. 1974, 3, 353–358. [Google Scholar] [CrossRef]
  9. Maes, F.; Collignon, A.; Vandermeulen, D.; Marchal, G.; Suetens, P. Multimodality image registration by maximization of mutual information. IEEE Trans. Med. Imaging 1997, 16, 187–198. [Google Scholar] [CrossRef] [Green Version]
  10. Pang, B.; Yu, Q.; Sun, H.; Xiao, W.; Xu, Y.; Zhang, Y. Synthetic aperture radar image registration based on hybrid feature detection and multifeature constraint matching. J. Appl. Remote Sens. 2018, 12, 036012. [Google Scholar] [CrossRef]
  11. Kuglin, C.D.; Hines, D.C. The phase correlation image alignment method. In Proceedings of the IEEE International Conference on Cybernetics and Society, Canterbury, UK, 15–17 September 1975; pp. 163–165. [Google Scholar]
  12. Reddy, B.S.; Chatterji, B.N. An FFT-based technique for translation, rotation, and scale-invariant image registration. IEEE Trans. Image Process. 1996, 5, 1266–1271. [Google Scholar] [CrossRef] [Green Version]
  13. Dai, X.; Xie, Q. Research on Image Matching Algorithm Based on Fourier-Mellin Transform. Infrared Technol. 2016, 38, 860–863. [Google Scholar]
  14. Jiao, J.; Zhao, B.; Zhou, G. A Fast Image Registration Algorithm Based on Fourier-Mellin Transform for Space Image. Acta Armamentarii 2010, 31, 1551–1556. [Google Scholar]
  15. Qiang, Z.; Peng, J.; Wang, H. Remote Sensing Image Registration Algorithm Based on FFT. Infrared Laser Eng. 2004, 33, 385–387+413. [Google Scholar]
  16. Liu, H.; Guo, B.; Feng, Z. Fourier-based Registration Technique for Aligning Remote Sensing Images. J. Optoelectron. Laser 2006, 17, 1393–1397. [Google Scholar]
  17. Jiao, J.; Zhao, B.; Tang, L. SAR Image Registration Algorithm Based on FFT and Edge Detection. Comput. Eng. Appl. 2010, 46, 25–28. [Google Scholar]
  18. Chang, Y.; Zhou, Z.; Chang, W.; Jin, T. A New Registration Method for Multi-spectral SAR Images. In Proceedings of the 2005 IEEE International Geoscience and Remote Sensing Symposium, IGARSS’05, Seoul, Korea, 29 July 2005; Volume 3, pp. 1704–1708. [Google Scholar]
  19. Fan, J.; Wu, Y.; Wang, F.; Zhang, Q.; Liao, G.; Li, M. SAR Image Registration Using Phase Congruency and Nonlinear Diffusion-Based SIFT. IEEE Geosci. Remote Sens. Lett. 2014, 12, 562–566. [Google Scholar] [CrossRef]
  20. Fjortoft, R.; Lopes, A.; Marthon, P.; Cubero-Castan, E. An optimal multiedge detector for SAR image segmentation. IEEE Trans. Geosci. Remote Sens. 1998, 36, 793–802. [Google Scholar] [CrossRef] [Green Version]
  21. Airouche, M.; Zelmat, M.; Kidouche, M. Statistical edge detectors applied to SAR images. Int. J. Comput. Commun. Control 2008, 3, 144–149. [Google Scholar]
  22. Liu, H.; He, Z.W.; Zhao, Y.B.; Teng, J.; Wang, Y. Improved ROEWA edge detector for SAR Images. J. Remote Sens. 2017, 21, 273–279. [Google Scholar]
  23. Lin, Y.; Feng, W.; Chen, H. A FFT-based SAR Image Registration Algorithm Via Priority Estimation of Scale Distortion. Modem Radar 2010, 32, 39–44. [Google Scholar]
  24. Evangelidis, G.D.; Emmanouil, Z.P. Parametric image alignment using enhanced correlation coefficient maximization. IEEE Trans. Pattern Anal. Mach. Intel. 2008, 30, 1858–1865. [Google Scholar] [CrossRef] [Green Version]
  25. Emmanouil, G.D.; Psarakis, E.Z. An ECC-Based Iterative Algorithm for Photometric Invariant Projective Registration. Int. J. Artif. Intell. Tools 2009, 18, 121–139. [Google Scholar]
  26. Wenwei, S. Abnormal Target Recognition for D-Series High-Speed Train Body Images Based on Convolutional Neural Network; Southwest Jiaotong University: Chengdu, China, 2019. [Google Scholar]
  27. Hannan, L. Blind Image Super-Resolution Based on Convolutional Neural Network; Harbin Institute of Technology: Harbin, China, 2019. [Google Scholar]
  28. Wang, Z.; Bovik, A.; Sheikh, H.; Simoncelli, E. Image Quality Assessment: From Error Visibility to Structural Similarity. IEEE Trans. Image Process. 2004, 13, 600–612. [Google Scholar] [CrossRef] [PubMed] [Green Version]
  29. Lowe, D.G. Distinctive image features from scale-invariant keypoints. Int. J. Comput. Vis. 2004, 60, 91–110. [Google Scholar] [CrossRef]
Figure 1. (a) L-band SAR image (image size: 1600 × 1600 pixels, pixel spacing: 0.25 m). (b) Gray histogram of L-band SAR image. (c) Ku-band SAR image (image size: 1200 × 1200 pixels, pixel spacing: 1/3 m). (d) Gray histogram of the Ku-band SAR image.
Remotesensing 14 02509 g001
Figure 2. Pseudo-color superposition of the master image and registration result based on fast Fourier transform (FFT). The pseudo-color image is used to create a composite RGB image showing the master image and registration result overlaid in different color bands. The registration result is related to band G, the master image is related to bands R and B, and the registration result is overlaid on the master image.
Remotesensing 14 02509 g002
Figure 3. (a) Edge features of the master image (L-band SAR image). (b) Edge features of the slave image (Ku-band SAR image). Edge features of master and slave images obtained based on improved ratio of exponentially weighted averages (IROEWA).
Remotesensing 14 02509 g003
Figure 4. Registration result based on edge features and FFT. (a) Pseudo-color superposition of the master image and registered image. (b) Region 1 of (a), red frame marks an area of concern, and blue circle named A marks an area to be enlarged. The pseudo-color image was used to create a composite RGB image showing the master and registered images overlaid in different color bands. The registered image is related to band G, the master image is related to bands R and B, and the registered image is overlaid on the master image.
Remotesensing 14 02509 g004
Figure 5. Flow chart of the registration method proposed in this paper.
Remotesensing 14 02509 g005
Figure 6. Schematic of the image-registration method based on segmentation and enhanced correlation coefficient (ECC).
Remotesensing 14 02509 g006
Figure 7. The 3 × 3 uniform segmentation. The size of each sub-block shown by the yellow area is n × n, the size of the area marked with the red wireframe is d × d, and s is half the difference between d and n.
Remotesensing 14 02509 g007
Figure 8. The pseudo-color superposition of region A as shown in Figure 4b: (a) between the master image and coarse-registration image; (b) between the master image and registration image based on ECC; (c) between the master image and the accurate-registration image based on segmentation and ECC. Blue circles mark areas of concern. The pseudo-color image is used to create a composite RGB image showing the master and registered images overlaid in different color bands. The registered image is related to band G, the master image is related to bands R and B, and the registered image is overlaid on the master image.
Remotesensing 14 02509 g008
Figure 9. (a) Optical image of the actual observation scene in Group 1. (b) Optical image of the actual observation scene in Group 2.
Remotesensing 14 02509 g009
Figure 10. CSAR images and gray histograms of Group 1. (a) L-band CSAR image (image size: 3100 × 3100 pixels). (b) Gray histogram of the L-band CSAR image. (c) Ku-band CSAR image (image size: 2300 × 2300 pixels). (d) Gray histogram of the Ku-band CSAR image.
Remotesensing 14 02509 g010aRemotesensing 14 02509 g010b
Figure 11. CSAR images and gray histograms of Group2. (a) L-band CSAR image (image size: 1600 × 1600 pixels). (b) Gray histogram of the L-band CSAR image. (c) Ku-band CSAR image (image size: 4000 × 4000 pixels). (d) Gray histogram of the Ku-band CSAR image.
Remotesensing 14 02509 g011
Figure 12. (a) Edge information of Group 1 (L-band). (b) Edge information of Group 1 (Ku-band). (c) Coarse-registration image of Group 1. (d) Accurate-registration image of Group 1.
Remotesensing 14 02509 g012
Figure 13. (a) Edge information of Group 2 (L-band). (b) Edge information of Group 2 (Ku-band). (c) Coarse-registration image of Group 2. (d) Accurate-registration image of Group 2.
Remotesensing 14 02509 g013
Figure 14. (a) Pseudo-color superposition between the master image and coarse-registration image in Group 1. (b) Region 1. (c) Region 2. The registered image is related to band G, the master image is related to bands R and B, and the registered image is overlaid on the master image. Red circle marks an area to be enlarged, and red frame marks an area of concern.
Remotesensing 14 02509 g014
Figure 15. (a) Pseudo-color superposition between the master image and accurate-registration image of Group 1. (b) Region 1. (c) Region 2. The registered image is related to band G, the master image is related to bands R and B, and the registered image is overlaid on the master image. Blue circle marks an area to be enlarged, and blue frame marks an area of concern.
Remotesensing 14 02509 g015
Figure 16. (a) Pseudo-color superposition between the master image and coarse-registration image of Group 2. (b) Region 1. (c) Region 2. The registered image is related to band G, the master image is related to bands R and B, and the registered image is overlaid on the master image. Red circle marks an area to be enlarged, and red frame marks an area of concern.
Remotesensing 14 02509 g016
Figure 17. (a) Pseudo-color superposition between the master image and accurate-registration image of Group 2. (b) Region 1. (c) Region 2. The registered image is related to band G, the master image is related to bands R and B, and the registered image is overlaid on the master image. Blue circle marks an area to be enlarged, and blue frame marks an area of concern.
Remotesensing 14 02509 g017
Figure 18. Feature points (marked in green) of Group 1. (a) Master image. (b) Coarse-registration image. (c) Accurate-registration image.
Remotesensing 14 02509 g018
Figure 19. Feature points (marked in red) of Group 2. (a) Master image. (b) Coarse-registration image. (c) Accurate-registration image.
Remotesensing 14 02509 g019
Table 1. Results of the objective evaluation index.
Similarity MeasureAMRMSE
Group 1: Coarse Registration0.690.746.89
Group 1: Accurate Registration0.710.811.87
Group 2: Coarse Registration0.730.995.46
Group 2: Accurate Registration0.781.121.90
Publisher’s Note: MDPI stays neutral with regard to jurisdictional claims in published maps and institutional affiliations.

