Article

Divergent Climate Sensitivities of the Alpine Grasslands to Early Growing Season Precipitation on the Tibetan Plateau

1
Lhasa Plateau Ecosystem Research Station, Key Laboratory of Ecosystem Network Observation and Modeling, Institute of Geographic Sciences and Natural Resources Research, Chinese Academy of Sciences, Beijing 100101, China
2
School of Water Conservancy and Hydropower, Hebei University of Engineering, Handan 056038, China
3
College of Resources and Environment, University of Chinese Academy of Sciences, Beijing 100190, China
4
School of Earth Science and Engineering, Hebei University of Engineering, Handan 056038, China
5
Department of Resource Management, Tangshan Normal University, Tangshan 063000, China
6
Institute of Environment and Sustainable Development in Agriculture, Chinese Academy of Agricultural Sciences, Beijing 100081, China
*
Author to whom correspondence should be addressed.
Remote Sens. 2022, 14(10), 2484; https://doi.org/10.3390/rs14102484
Submission received: 8 April 2022 / Revised: 18 May 2022 / Accepted: 20 May 2022 / Published: 22 May 2022

Abstract

:
Warming is expected to intensify hydrological processes and reshape precipitation regimes, which is closely related to water availability for terrestrial ecosystems. Effects of the inter-annual precipitation changes on plant growth are widely concerned. However, it is not well-known how plant growth responds to intra-annual precipitation regime changes. Here, we compiled reanalysis climate data (ERA5) and four satellite-based vegetation indices, including the Normalized Difference Vegetation Index (NDVI), the Enhanced Vegetation Index (EVI), the Solar-induced Chlorophyll Fluorescence (SIF), and the Modified Triangular Vegetation Index (MTVI2), to evaluate the response of alpine grasslands (including alpine meadow and alpine steppe) to the change of precipitation regimes, especially to the intra-annual precipitation regimes on the Tibetan Plateau. We found monthly precipitation over the alpine steppe significantly increased in the growing season (May–September), but precipitation over the alpine meadow significantly increased only in the early growing season (May–June) (MJP) during the past four decades (1979–2019). The inter-annual plant growth (vegetation indices changes) on the alpine meadow was dominated by temperature, but it was driven by precipitation for the alpine steppe. On the intra-annual scale, the temperature sensitivity of the vegetation indices generally decreased but precipitation sensitivity increased during the growing season for both the alpine meadow and steppe. In response to the increase in MJP, we found the temperature sensitivity of the vegetation indices during the mid-growing season (July–August) (MGNDVI, MGEVI, MGSIF, and MGMTVI2) in the alpine meadow significantly increased (p < 0.01) while its precipitation sensitivity significantly decreased (p < 0.01). We infer that more MJP over the meadow may be the result of enhanced evapotranspiration, which is at the expense of soil moisture and even induces soil “drought” in the early growing season. This may be to elevate community water acquisition capacity through altering root mass allocation and community composition, consequently regulating the divergent climate sensitivities of vegetation growth in the mid-growing season. Our findings highlight that it is inadequate to regard precipitation as an indicator of water availability conditions for plant growth, which may limit our understanding of the response and acclimatization of plants to climate change.

Graphical Abstract

1. Introduction

Precipitation is one of the dominant climatic drivers regulating abiotic and biotic ecosystem processes and functions, such as drought-induced wildfire and plant mortality, wet-promoted soil mineralization, and terrestrial carbon sink. Drought stress likely increases under a warming climate, which has potential implications for biodiversity and ecosystem services [1,2]. For example, drought tends to shift community composition from mesic species-dominated toward xeric species-dominated [1,3] and may change the global terrestrial net primary production (NPP) [4]. On the contrary, wet conditions enhance the water availability of terrestrial ecosystems and thus increase gross primary productivity (GPP) and enhance land carbon sink [5,6].
Warming is expected to intensify the hydrological cycle, but it was spatially heterogeneous across the globe [7,8]. A concise pattern, “dry gets drier and wet gets wetter”, has been especially proposed and evidenced in some studies, which is robust over the oceanic tropics but indistinct over lands [9,10,11]. Greve et al. (2014) examined the pattern and found it was demonstrated over only 10.8% of the global lands, while 9.5% of the lands showed the opposite pattern [8]. Temporally, an intensified hydrological cycle is manifested in not only reshaping the precipitation amount but also the variability, including seasonality, frequency, and extremes. It was proved that over two-thirds of the Northern Hemisphere land area has experienced intensified heavy precipitation events [12]. The increase in extreme daily precipitation over both dry and wet regions on the earth is also historically observed and projected by climate models [7]. For example, the seasonality and frequency of precipitation have been evidenced in China, where winter precipitation over the northwest and southwest increased dramatically between the 1960s and the 2010s [13] and precipitation frequency increased notably in south China [14]. However, the spatial and temporal change patterns of precipitation and their potential impacts on terrestrial ecosystems under climate warming have not been comprehensively evaluated.
Effects of altered precipitation regimes on plants depend on both the abiotic (e.g., precipitation and soil texture) and biotic factors (e.g., plant species and traits) [15,16,17]. Heavy precipitation events are effective in infiltration and increase deep soil moisture, which improves water availability and benefits the photosynthetic production of plants with deep roots [18,19,20]. Small precipitation events tend to increase surface soil moisture and might be stimulations for microbial respiration and plants with shallow roots [16,19]. However, more precipitation in the early or late growing season may mismatch the large water demand and water supply in the middle growing season thus reducing plant productivity [21]. On the other hand, the biotic acclimation or adaptation of plants (or communities) also mitigates the impacts of water supply through biomass allocation and shifting dominated species. For example, a recent meta-analysis examining the response of plant biomass allocation to drought showed that drought significantly increases the root mass meanwhile decreasing stem, leaf, and reproductive mass [22]. With a 4-year experimental drought treatment on alpine grassland, previous study also suggested that drought does not affect total NPP but shifts more NPP allocation belowground [3]. Therefore, the response of plants (or communities) to precipitation change may be diverse in structure and function [23].
The Tibetan Plateau (TP), known as the “Third Pole” of the world, is the highest plateau on the earth [24]. Vegetation productivity (biomass) and respirations on the TP were extremely sensitive to climate change [25,26,27,28]. Generally, low temperature is widely recognized as the limited climatic factor for vegetation growth and carbon budgets overall the TP [29,30,31,32]. The dominant driver is spatially heterogeneous [26,33]. Specifically, temperature generally regulates the vegetation dynamics (e.g., NPP and spring phenology) in the southeast but precipitation-related water supply drive that in the northwest [34,35]. Warming has elevated and is expected to increase the productivity of vegetation overall the TP [36,37]. However, it is reported that water constraints on vegetation growth and productivity increased across the Northern Hemisphere and global lands under long-term warming in the past decades [38,39]. Meanwhile, about 70% of the areas on the TP are in arid and semi-arid climate zones on the northwest TP, where the plants are widely recognized as water-limited [40,41]. In the past decades, the TP experienced throughout warming but changes in precipitation were less consistent and spatially heterogeneous [37,42,43]. Thus, including but not limited to the water-limited land, warming effects on vegetation growth and productivity are uncertain and may highly depend on water availability.
Precipitation changes over the TP are heterogeneous both in spatial and temporal patterns. Spatially, summer precipitation over the northwestern TP experienced a significant increase, contributing to the drastic lake expansion in the past four decades [43,44,45,46]. However, precipitation over the southeast TP had no obvious change [43]. Temporally, changes in the seasonality and the frequency of precipitation are also observed in the past six decades. Specifically, Li et al. [47] and Piao et al. [13] evidenced that the precipitation amount and the number of precipitation days in winter and spring increased during the period between the 1960s and the 2000s [13,44]. From 1979 to 2014, both precipitation amount and frequency in May over the southeastern TP increased significantly (p < 0.05), which was attributed to the earlier outbreak of the South Asian summer monsoon [48]. Recently, Sun et al. [43] and Zhang et al. [44] also suggested that the northwest TP becomes wetter in recent four decades, which positively stimulated the rate of vegetation expansion from barrens to grasslands in the northwestern TP [41,49].
The change in precipitation regimes has been documented while the response of vegetation growth remains poorly understood on the TP. Most previous studies, employing annual precipitation or growing season precipitation as an indicator of water supply, focus on the inter-annual response of vegetation growth to climate [3,41,50,51], which is largely thoughtless of the potential impact of whether the altered intra-annual precipitation regimes/distribution match the water demand of vegetation growth in different stages. That may limit our understanding of vegetation growth in response to changes in precipitation. For example, Guo et al. [52] revealed that the precipitation seasonal distribution (PSD) also plays an important role in dominating the spatial variation in productivity for the steppe in Inner Mongolia. Chelli et al. [53] conducted a study on the sub-Mediterranean grasslands and found that spring precipitation is relatively important to annual productivity because they found that spring drought caused a decrease in annual productivity even when summer precipitation increased. While Chen et al. [54] suggested that the loss of carbon uptake caused by drought in early summer may be compensated by a post-drought regrowth when precipitation increases in late summer for alpine grasslands on the TP. Therefore, understandings the response of grassland to altered precipitation regimes require, on the one hand, clarifying the sensitivity of vegetation growth to climatic factors at different stages, and on the other hand, to deepen the acclimatization /adaptation strategies of grassland to humidity or drought.
In this study, we aim to (1) characterize the inter-annual and intra-annual precipitation regimes over the TP, and (2) examine the precipitation regimes’ changes effects, especially intra-annual variations, on the climatic sensitivity of vegetation growth in the alpine meadow and alpine steppe, and (3) reveal the vegetation climatic sensitivity change in response to changes in annual precipitation regimes.

2. Materials and Methods
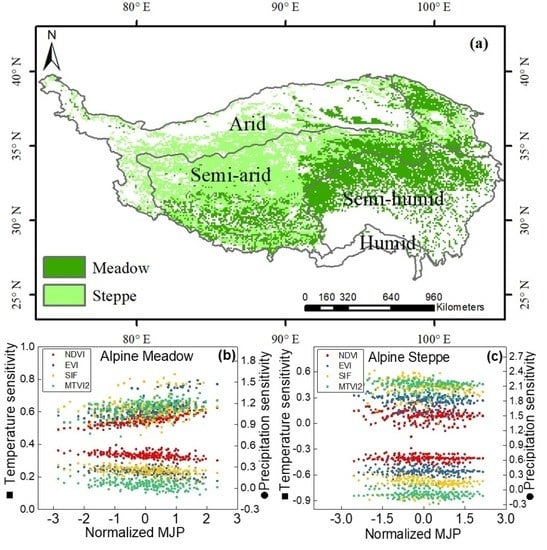
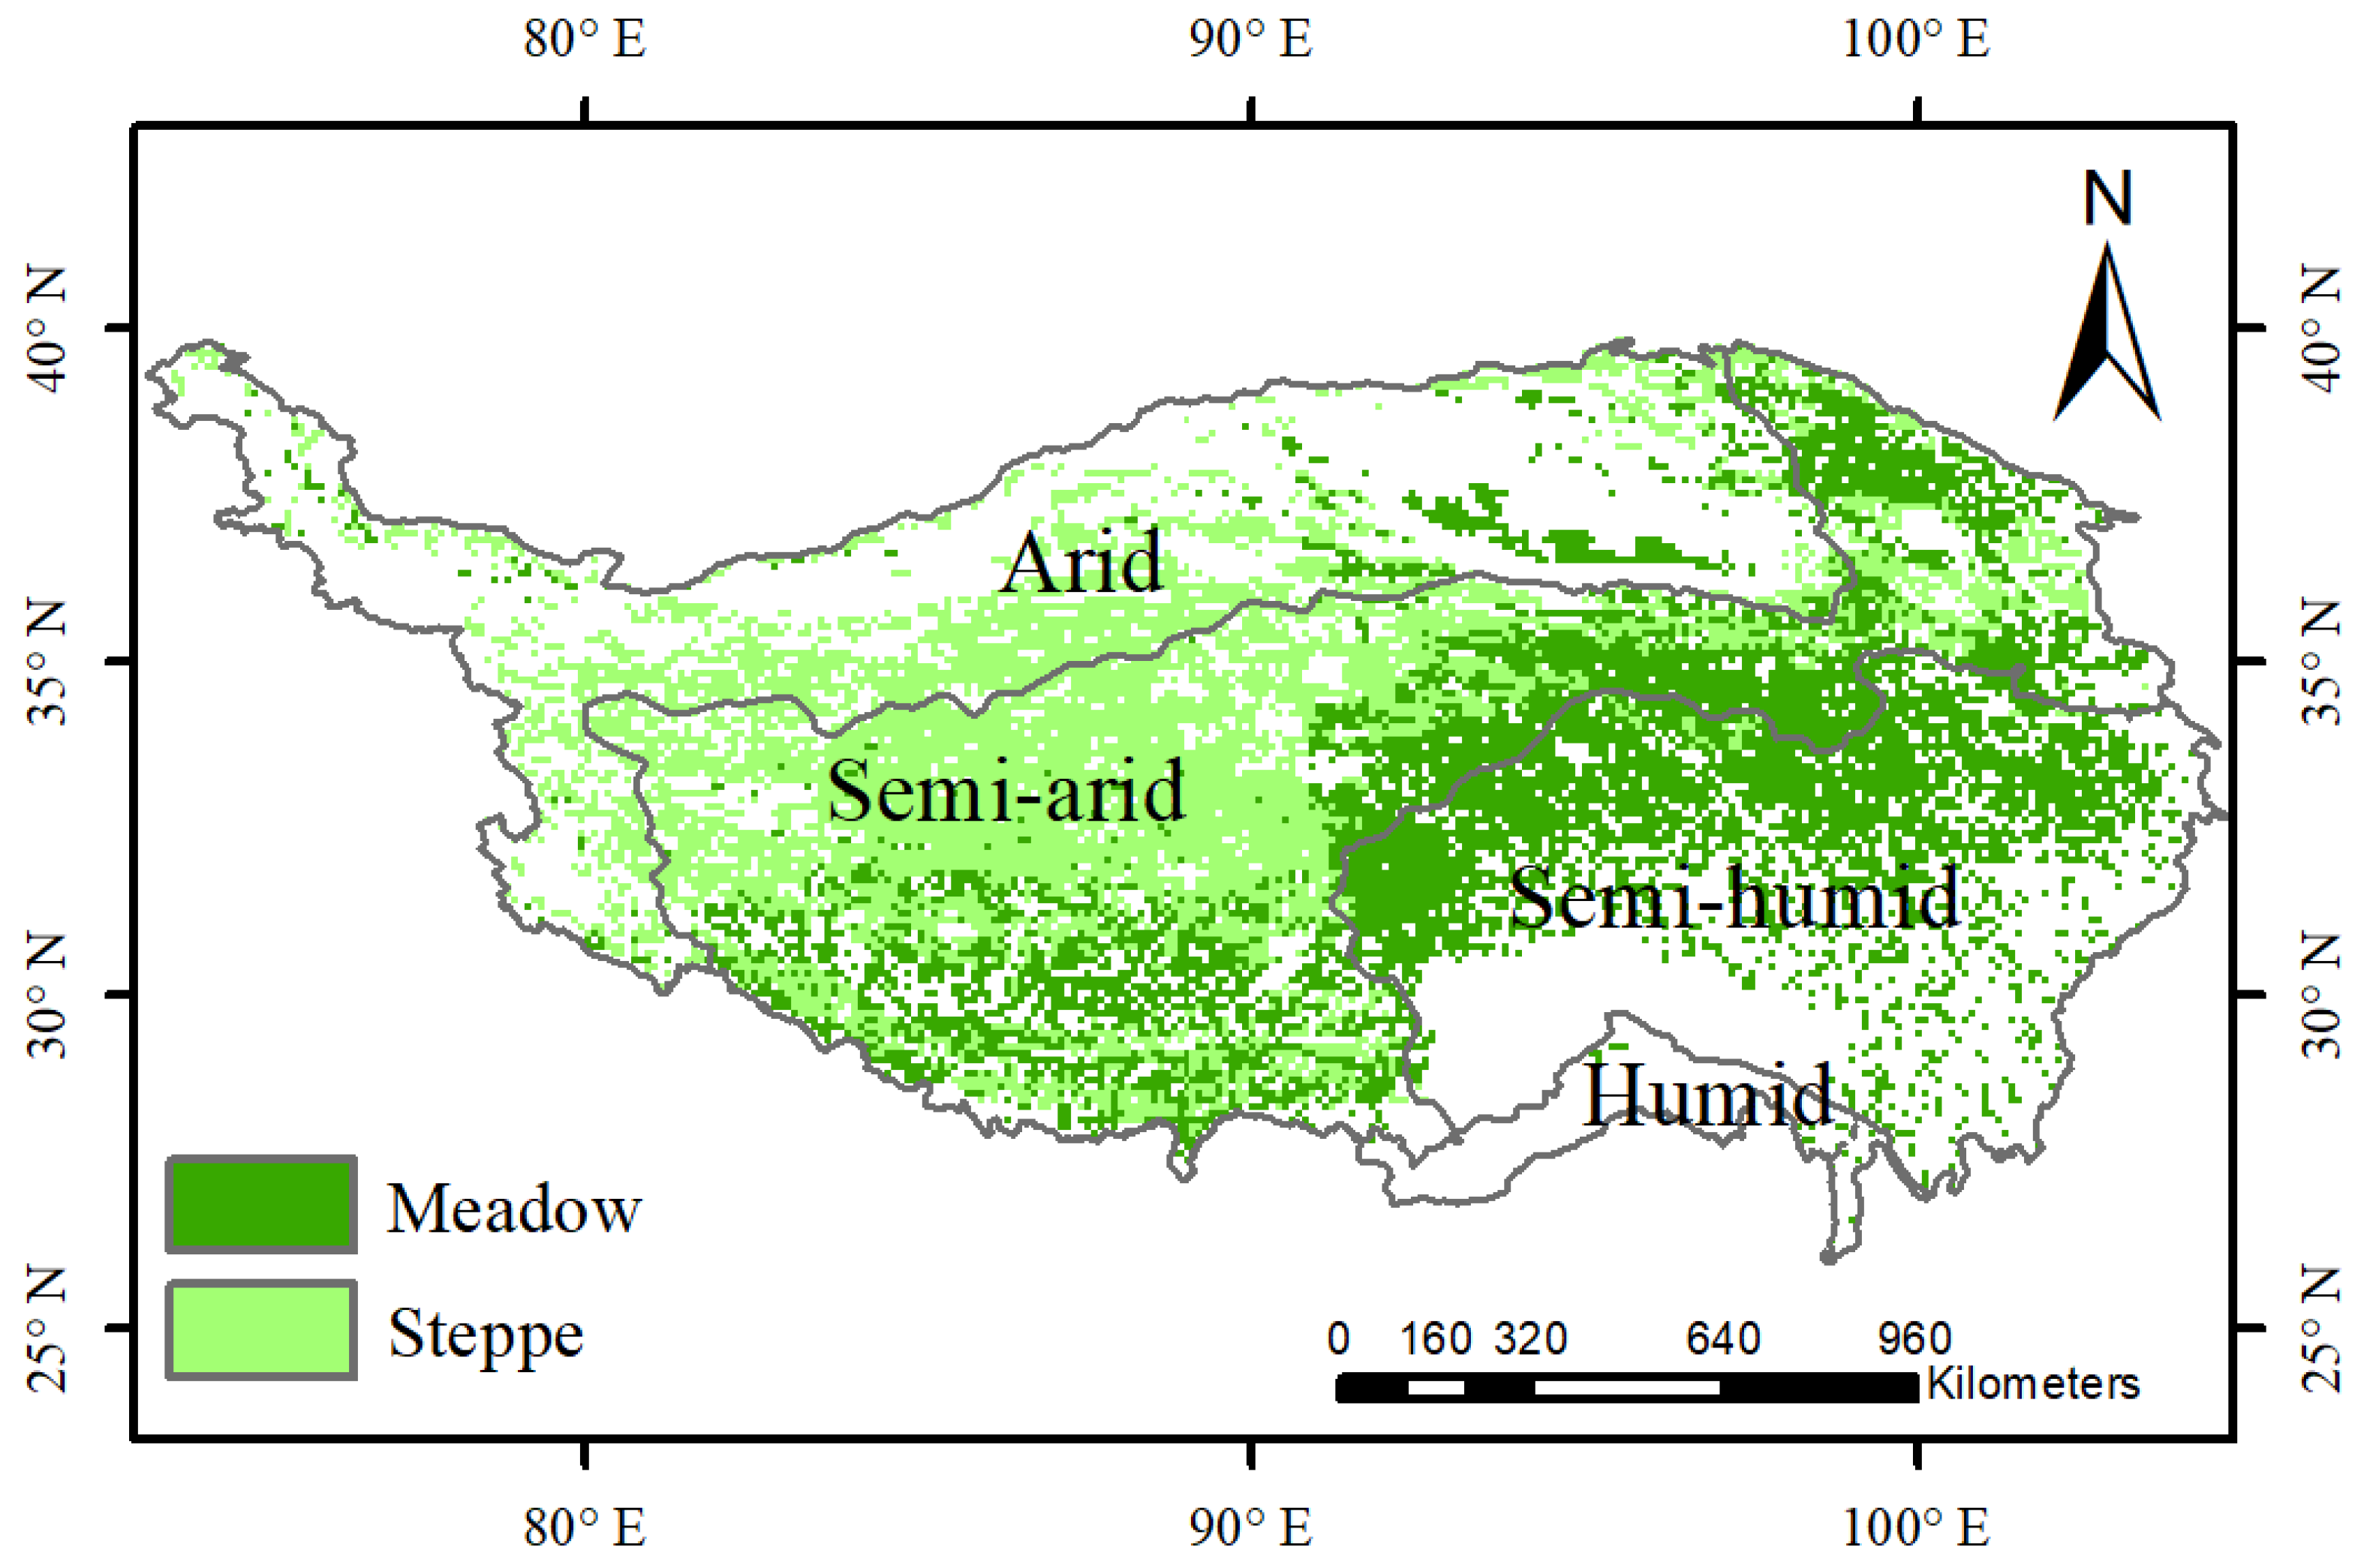
2.1. Study Area

Located in southwest China, the TP is the highest region on the earth. Alpine grassland accounts for approximately 65% of the total area of the TP [41,49,55]. Alpine meadow and alpine steppe are the main body of grassland on the TP [56]. Based on temperature, wet and dry conditions, the TP can be divided into the arid, semi-arid, semi-humid, and humid climate zones according to the Ecological Geographical Division of China (http://www.geodata.cn, accessed on 9 June 2020) (Figure 1). Specifically, the meadows are mainly distributed in the semi-humid southeast TP, and the steppes spread in the arid and semi-arid northwest according to the Editorial Board of Vegetation Map of China CAS (2001) (Figure 1).

2.2. Climate, Evapotranspiration, and Soil Moisture Datasets

We compiled the fifth-generation ECMWF (European Centre for Medium-Range Weather Forecasts) reanalysis assimilation data (ERA5) [57]. It is data assimilation that combines model data with observations from across the world into a globally complete and consistent dataset. ERA5 is a replacement for the ERA-Interim reanalysis and more relevant information can be found on the official website (https://www.ecmwf.int/, accessed on 6 February 2020). We obtained the monthly climatic datasets, including accumulated precipitation, and mean air temperature (2 m), which cover the period 1979–2019 and are at 0.25° spatial resolution. Based on the monthly data, we calculated the early growing season (May–June) precipitation (MJP), mid-growing season (July–August) temperature (JAT) and precipitation (JAP), growing season (May–September) temperature (GST) and precipitation (GSP). Moreover, we also selected the ERA5 datasets that contained monthly evapotranspiration (ET) and volumetric soil water/moisture (SM) in four soil layers (0–7 cm, 7–28 cm, 28–100 cm, and 100–289 cm) in this study.

2.3. Vegetation Indices

Four vegetation indices were employed as the proxy of vegetation growth. The Normalized Difference Vegetation Index (NDVI) data and the Enhanced Vegetation Index (EVI) are derived from the Moderate Resolution Imaging Spectroradiometer (MODIS) onboard NASA’s Terra (MOD13C2) and Aqua (MYD13C2) satellites. The monthly NDVI and EVI datasets we acquired were produced at 0.05° spatial resolution and the MOD13C2 covers the period 2000–2019 meanwhile MYD13C2 covers the period 2002–2019, and we further combined the two sources (MOD13C2 and MYD13C2) by averaging the overlapped (2002–2019) monthly NDVI and EVI to mitigate the impacts of the gaps in data. More details can be found on the official website (https://modis.gsfc.nasa.gov/, accessed on 22 December 2019). The monthly Solar-induced Chlorophyll Fluorescence (SIF) dataset over the TP, obtained from the National Tibetan Plateau Data Center (http://data.tpdc.ac.cn, accessed on 14 May 2022), covers the period 2000–2018 and is produced at 0.05° spatial resolution. The modified triangular vegetation index (MTVI2) is one of the spectral indices proved to be sensitive to vegetation biophysical parameters [58]. The formula of the MTVI2 is as below, where R800, R550, and R680 represent the surface reflectance at the 800 nm, 550 nm, and 680 nm wavelengths, respectively [58]. The MODIS surface reflectance products (MOD09A1) provide an estimation of high-quality surface spectral reflectance at 8 days and 500 m spatiotemporal resolution, but these exact wavelengths to use to calculate the MTVII2 were not available. Therefore, we used the closest available wavelength, and the actual bands contained in MOD09A1 used in this study were band1 (620–670 nm), band2 (841–876 nm), and band4 (545–565 nm).
M T V I 2 = 1.5 [ 1.2 ( R 800 R 550 ) 2.5 ( R 680 R 550 ) ] ( 2 R 800 + 1 ) 2 ( 6 R 800 5 R 680 ) 0.5
To match the climatic data, we firstly aggregated all the gridded monthly NDVI, EVI, and SIF data by averaging the values of each 5 × 5-pixel matrices (in 0.25° × 0.25°), but 50 × 50 pixels (nearly to 0.25° × 0.25°) for the MTVI2 data. Then, we resampled all the layers with the “nearest neighbor” method. The growing season vegetation indices (GSNDVI, GSEVI, GSSIF, GSMTVI2) were calculated as the mean monthly NDVI from May to September. The mid-growing season vegetation indices (MGNDVI, MGEVI, MGSIF, MGMTVI2) were defined as the mean value in July and August. Areas with GSNDVI less than 0.1 were eliminated in this study to minimize the impacts of soil on vegetation in sparse areas [59].

2.4. Statistical Analysis

We used Sen’s slope estimator [60] to obtain the changing trend of precipitation and applied the nonparametric Mann–Kendall test [61,62] to examine the significance of the trend. We applied multiple linear regression analysis to quantify the effect of temperature and precipitation on the four vegetation indices, and the standard regression coefficients were defined as the sensitivity of vegetation indices to climatic variables. Specifically, to test the response of the temperature and precipitation sensitivity of the middle growing season vegetation indices (MGNDVI, MGEVI, MGSIF, and MGMTVI2) to the change of precipitation in the early growing season (MJP), we chose each combination of 18 out of 20 years (190 combinations in total) to build a multiple regression model and the standard regression coefficients were regarded as the climatic sensitivity of the middle growing season vegetation indices. All statistical and modeling procedures were performed in the R statistical computing package (Version 4.0.3).

3. Results

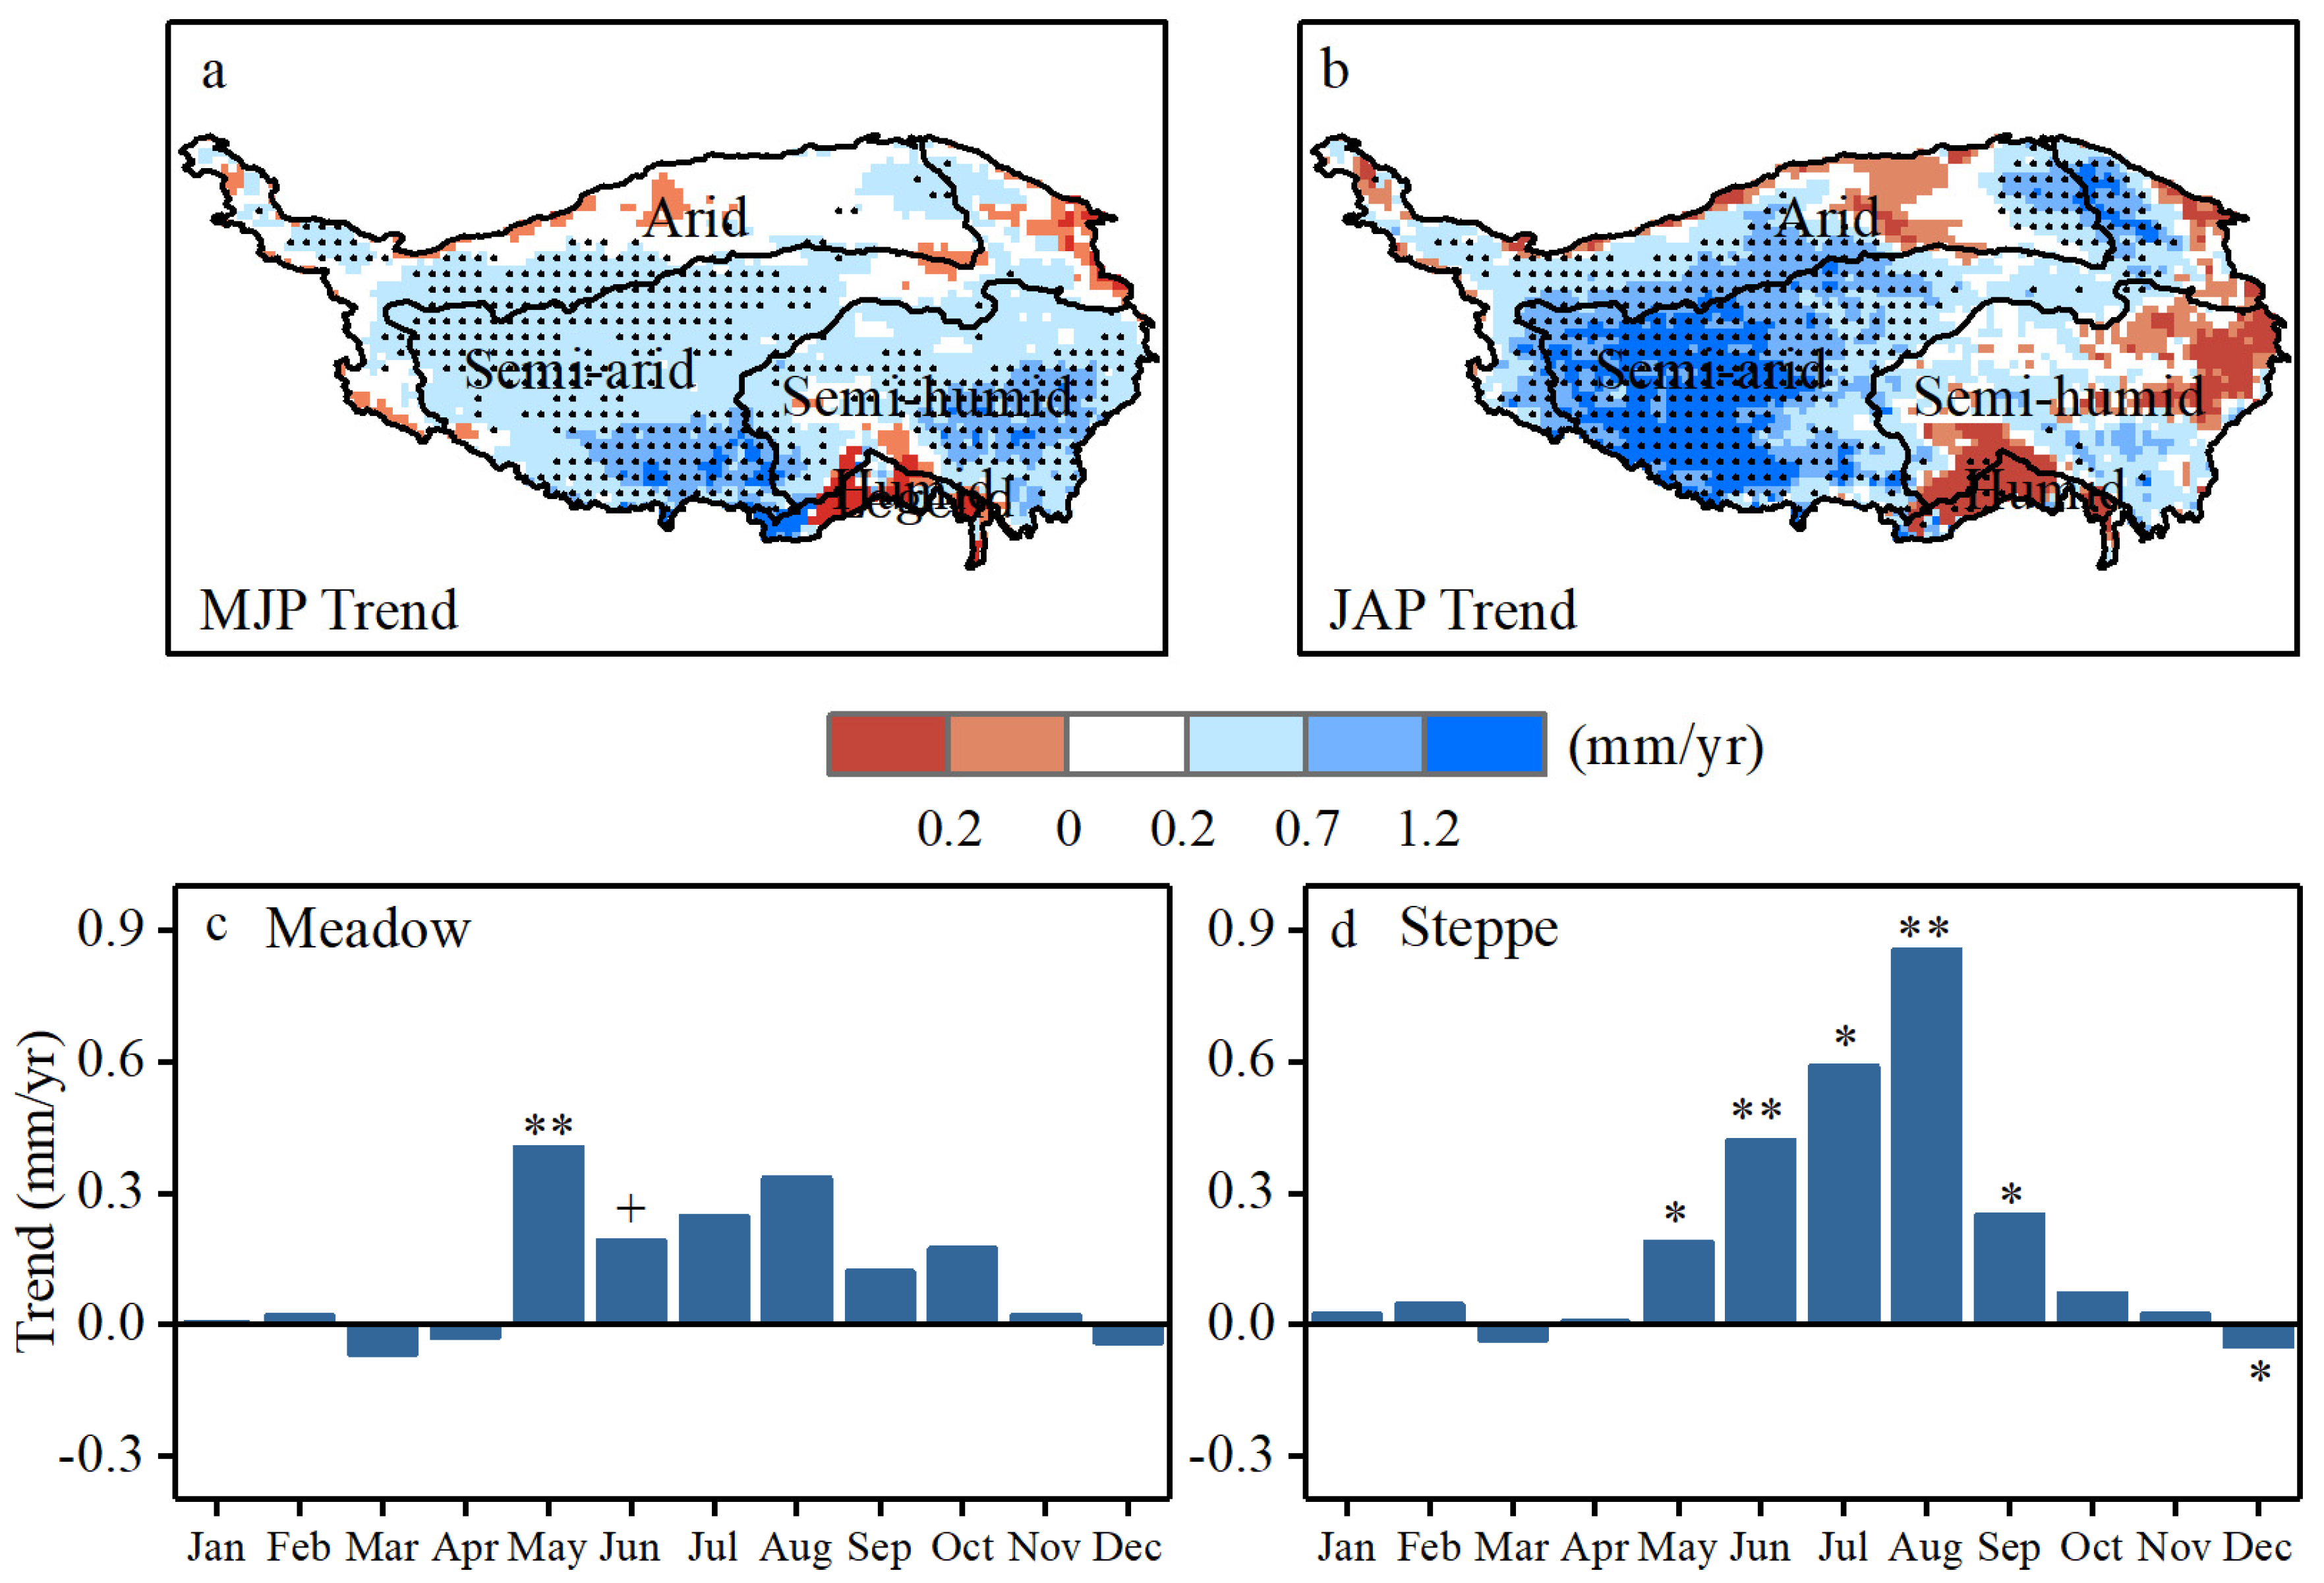
3.1. Spatiotemporal Precipitation Regimes on the TP

Precipitation in the early growing season (MJP) increased for most of the TP (more than 90%), among which MJP in the south and northwest significantly increased (p < 0.05) during the past four decades (Figure 2a). Precipitation in the later growing season (JAP) increased remarkably (p < 0.05) with a larger magnitude over the central to the west and northeastern TP (Figure 2b). JAP over most areas in the southeast TP had no significant (p > 0.05) change trend (Figure 2b). Precipitation in May (p < 0.01) and June (p < 0.1) increased significantly overall in the meadow (Figure 2c), meanwhile monthly precipitation in May–September overall in the steppe experienced a significant (p < 0.05) increase during 1979–2019 (Figure 2d).

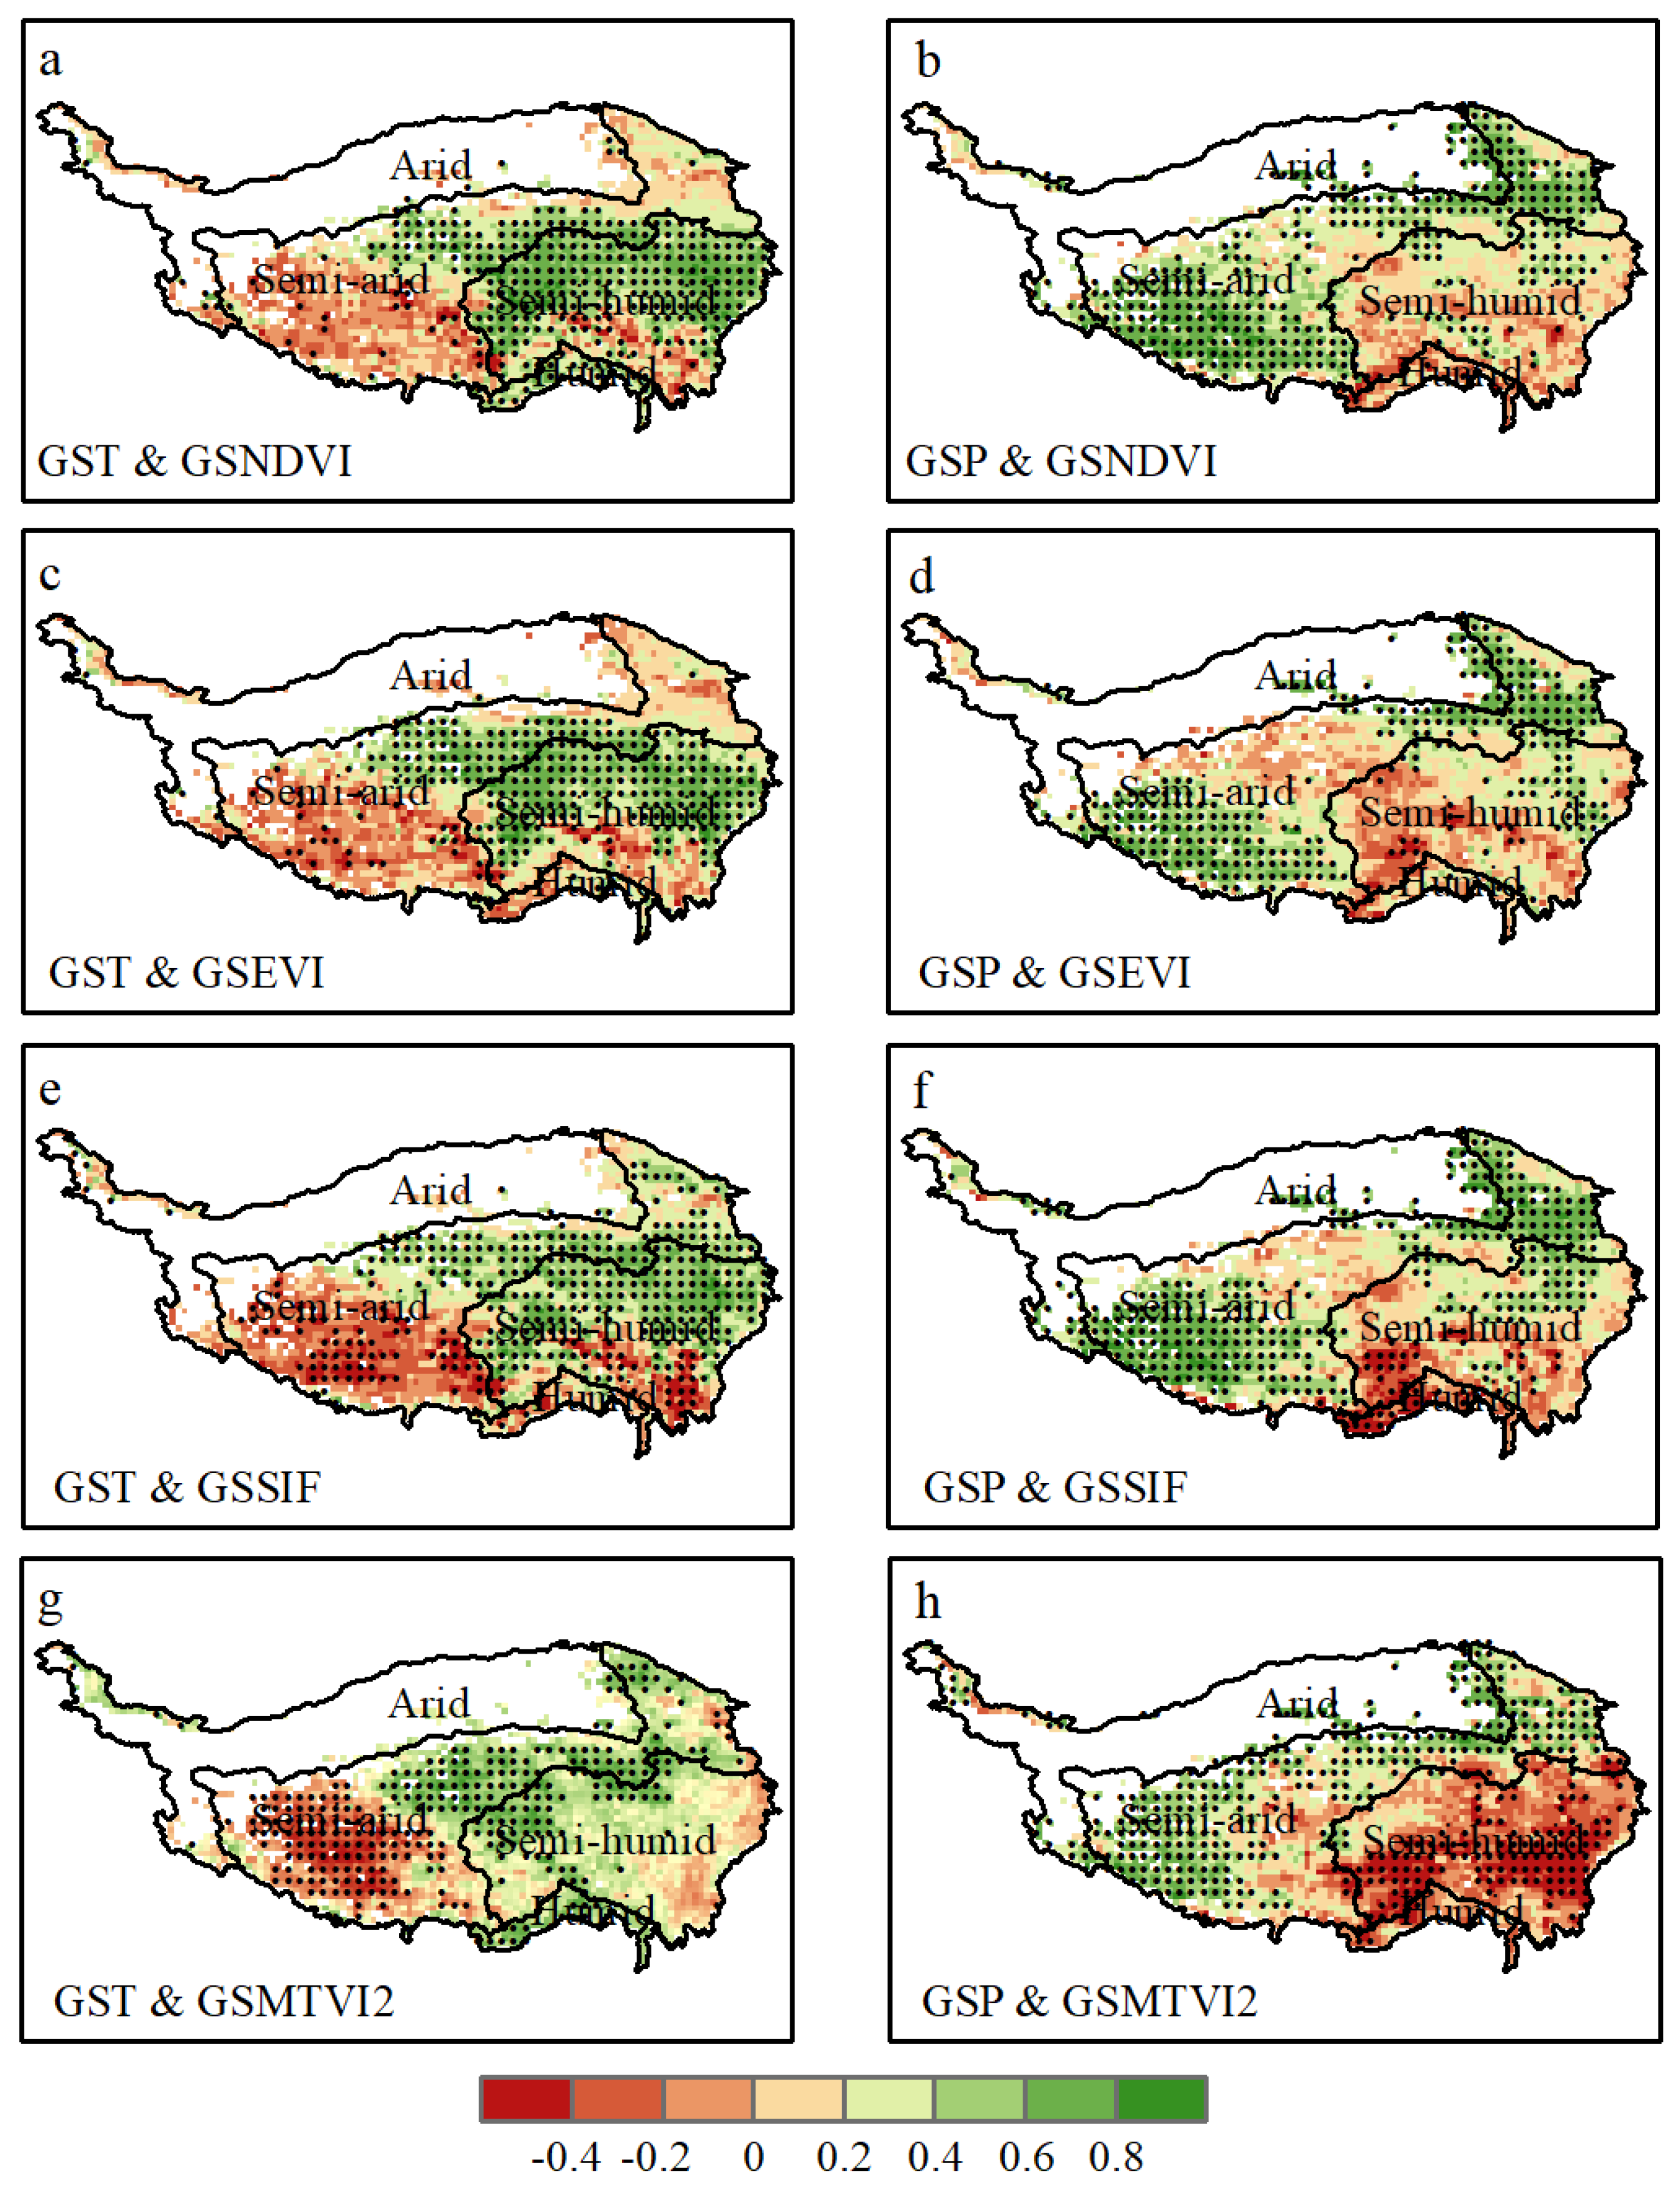
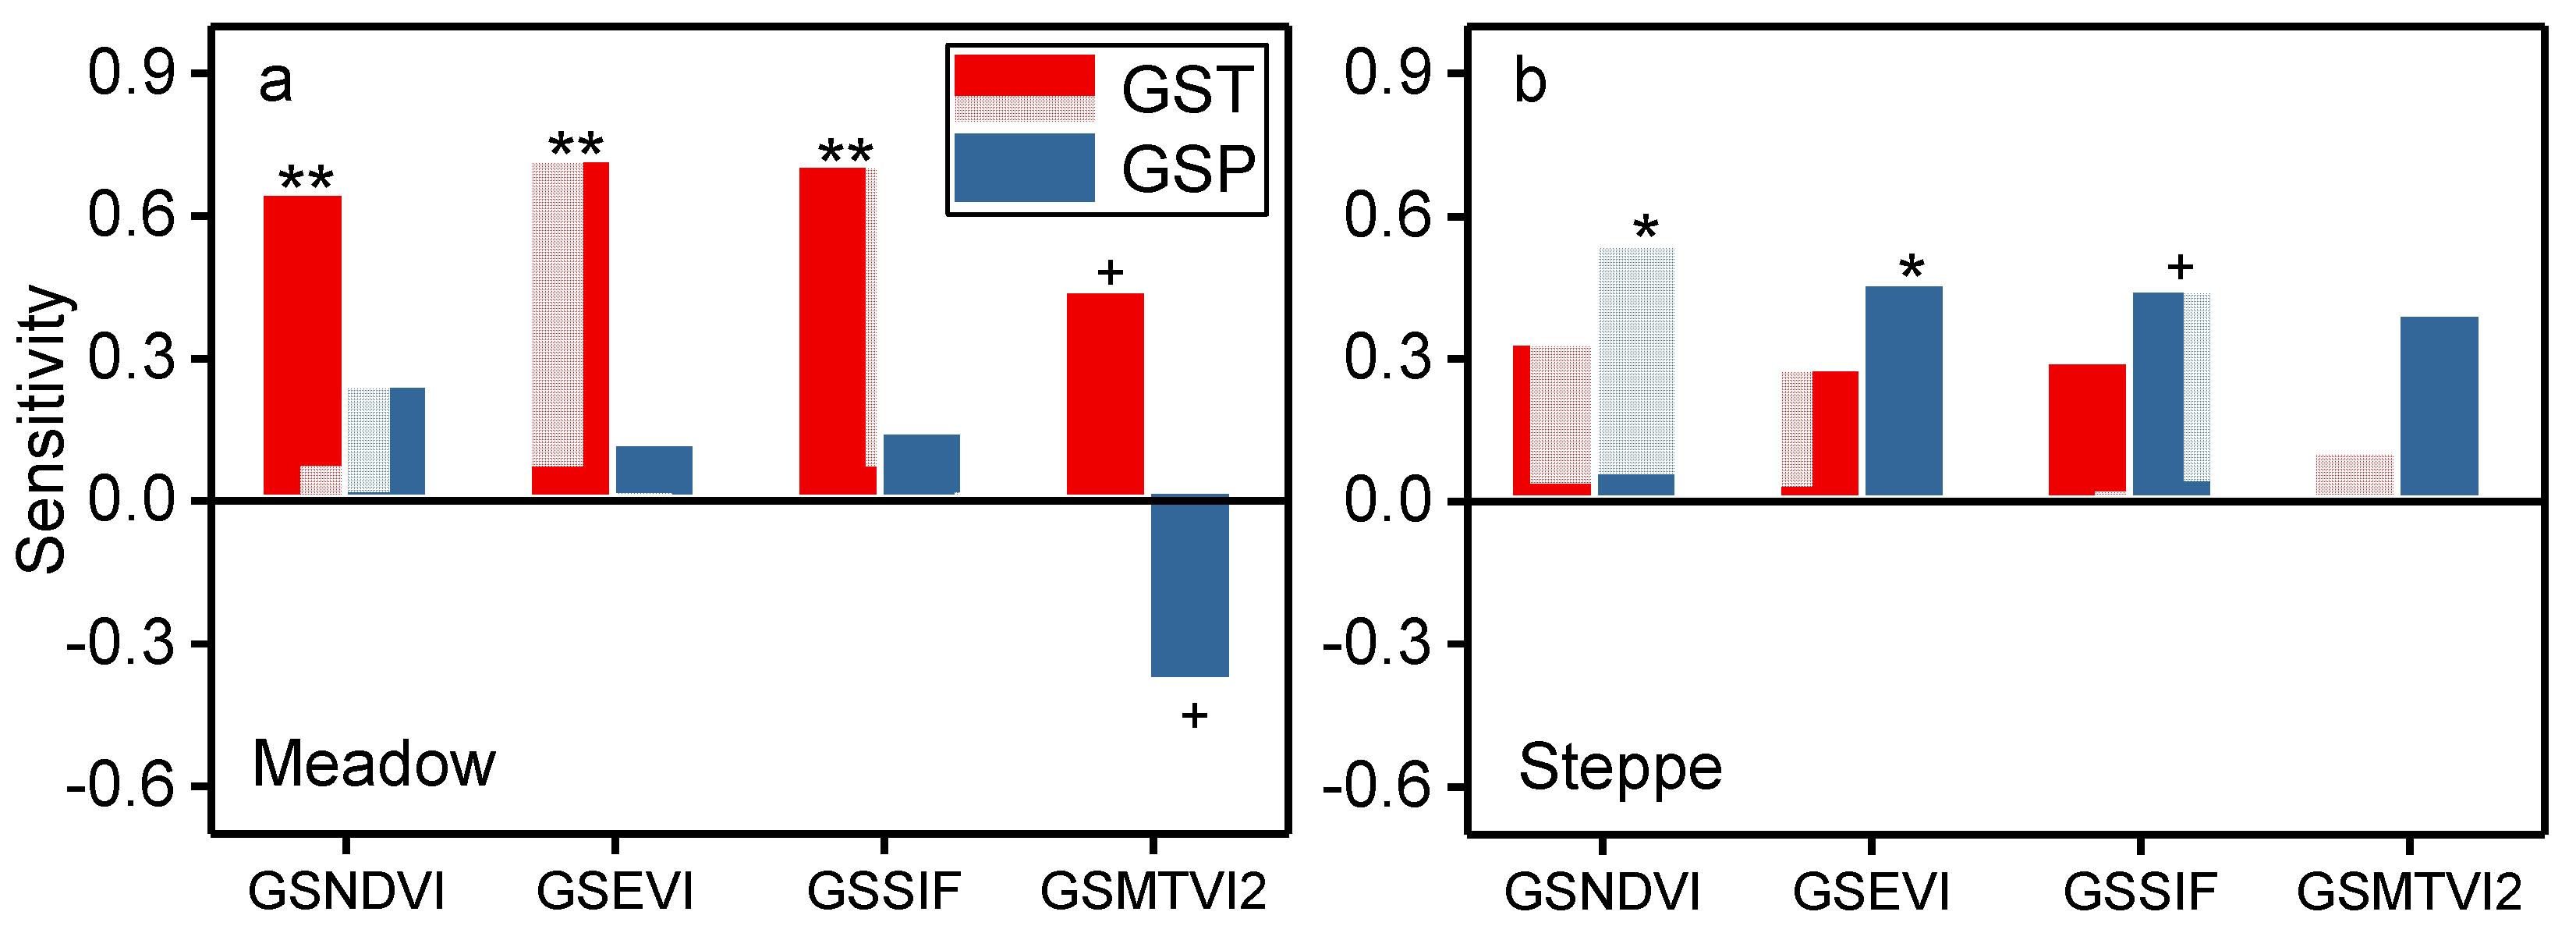
3.2. Climatic Sensitivity of Vegetation Indices

Spatially, we found the vegetation indices (GSNDVI, GSEVI, GSSIF, and GSMTVI2), in the southeast semi-humid TP, positively and significantly correlated (p < 0.05) with GST, while the relationship between the vegetation indices and GSP was inapparent (p > 0.05) except the GSMTVI2, which negatively and notably (p < 0.05) correlated with GSP on most lands (Figure 3). For most of the semi-arid areas in the southwest and northeast TP, the vegetation indices displayed remarkably positive relationships (p < 0.05) with GSP and negatively correlated with GST (Figure 3). Temporally, the variability in the vegetation indices for the meadow was dominated by GST (Figure 4a), but it was mainly driven by GSP for the steppe (Figure 4b).
On the intra-annual scale, the temperature sensitivity of the monthly vegetation indices generally decreased from April to September, meanwhile the precipitation sensitivity increased and peaked in July (except the MTVI2) on the meadow (Figure 5a,c,e,g). The temperature sensitivity of the vegetation indices fell off from April to July and then increased, meanwhile precipitation sensitivity increased and peaked in July for the alpine steppe (Figure 5b,d,f,h).

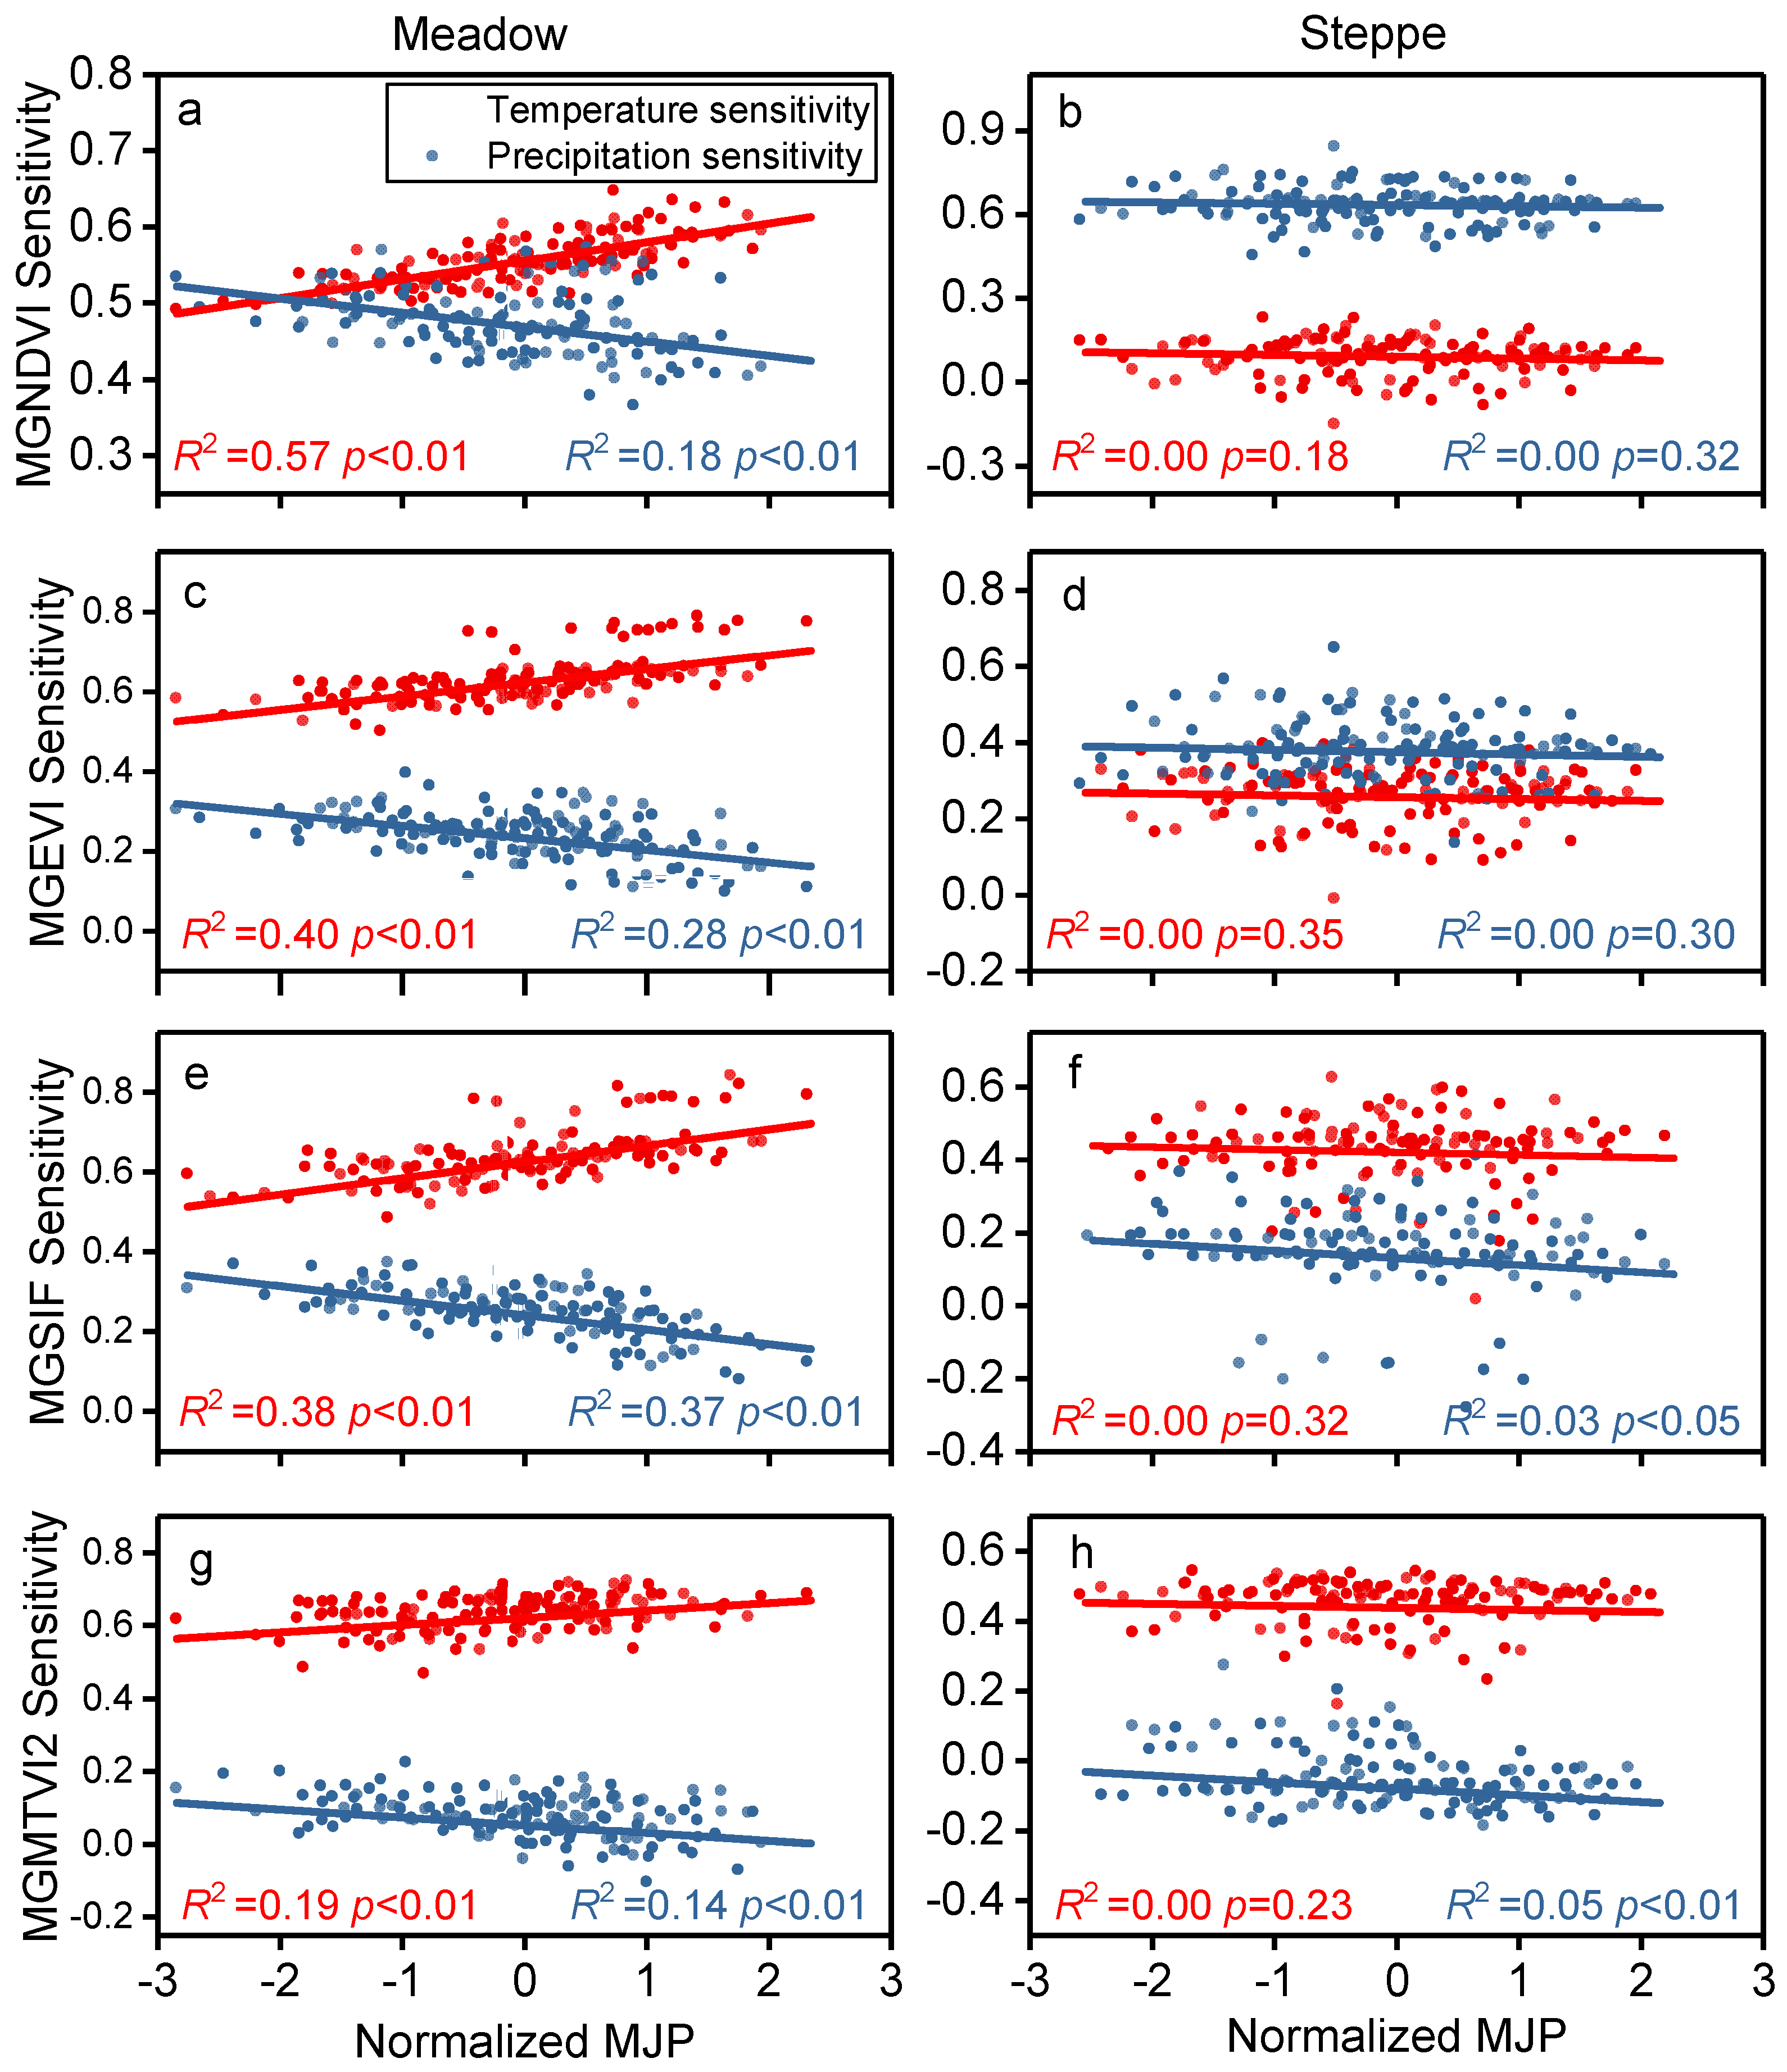
3.3. Response of Climatic Sensitivity of Vegetation Indices to Precipitation Change

The temperature sensitivity of the vegetation indices during the middle growing season (MGNDVI, MGEVI, MGSIF, MGMTVI2) consistently showed a significantly (p < 0.01) positive trend in the alpine meadow, but the precipitation sensitivity had a remarkably (p < 0.01) negative trend in response to increasing MJP (Figure 6a,c,e,g). In contrast, no consistent and significant relationships were found between the temperature or precipitation sensitivity of the steppe vegetation indices and the MJP (Figure 6b,d,f,h).

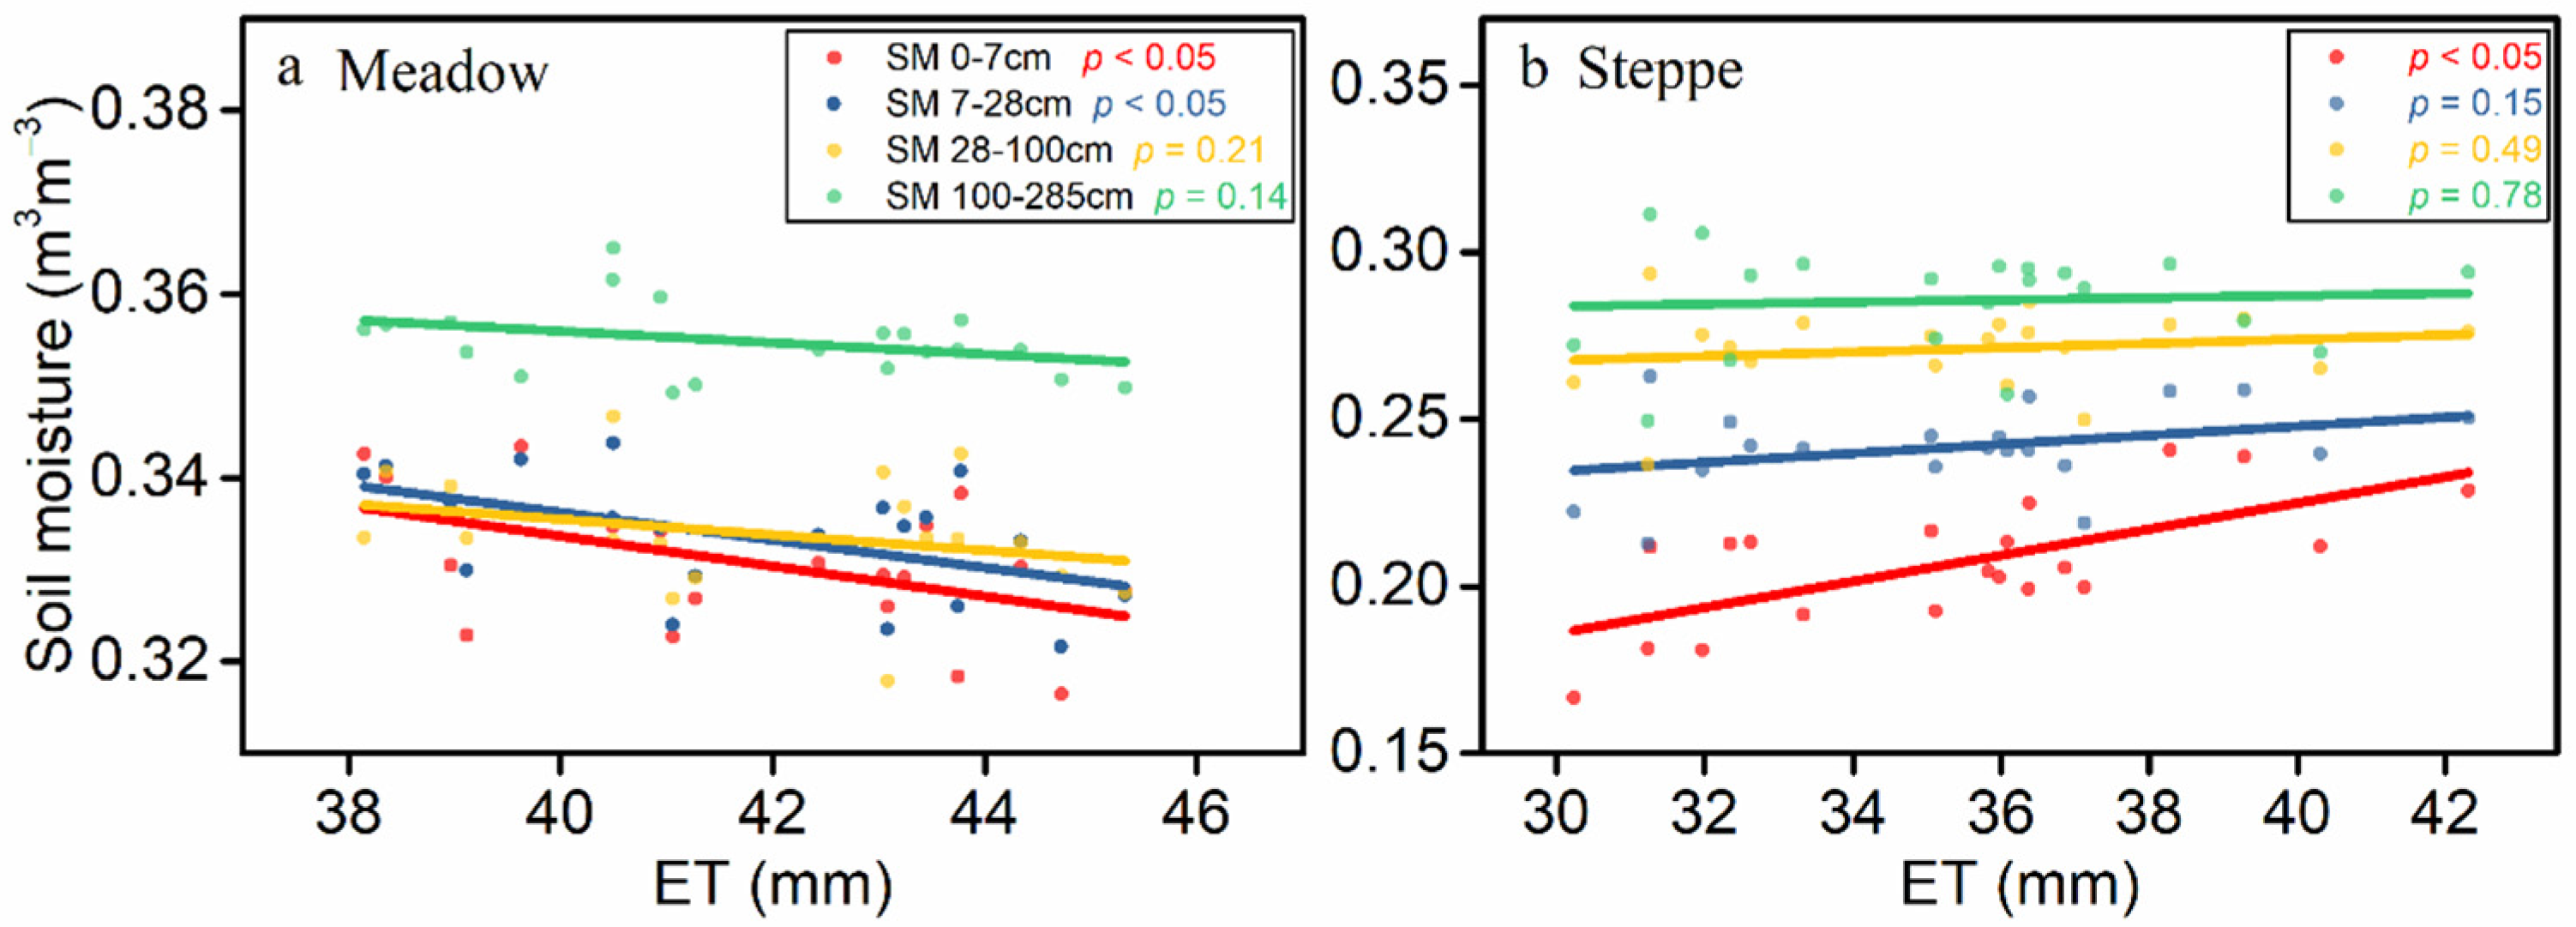
3.4. Response of Different Depth Soil Moisture to Monthly Precipitation

For the alpine meadow on the TP, precipitation in May negatively correlated with soil moisture in all depths from May to September (Figure 7a). Precipitation in June was positively correlated with soil moisture in the growing season (Figure 7b). Precipitation in both July and August can instantly change (p < 0.1) soil moisture at 0–28 cm depth during the month (Figure 7c). Generally, the correlation coefficients between soil moisture in the deep soil (28–289 cm depths) reached the maximum in the next month, indicating the lagged effects of precipitation on deep soil moisture (Figure 7c,d).
In the alpine steppe, precipitation in May showed a delayed effect on 0–28 cm soil moisture in June (p < 0.1) but can hardly influence soil moisture at 28–289 cm depth in the following months (Figure 7e). Precipitation in June–August instantly altered 0–7 cm soil moisture and the 7–100 cm soil moisture responded significantly (p < 0.1) in the next month (Figure 7f–h). Precipitation over the steppe in the growing season scarcely affected soil moisture at the depth of 100–289 cm in all months (Figure 7e–h).

4. Discussion

4.1. Precipitation Regimes on the TP

Precipitation significantly increased (p < 0.01) in early summer (in May) over the meadow on the southeast TP during 1979 to 2019 (Figure 2c). The wetting trend in early summer is mainly attributed to the advanced onset of the South Asian summer monsoon [48], promoting moisture convergence over the southeastern part and increased precipitation in May. On the other hand, precipitation over the steppe on the northwest TP in May–September experienced a significant increase (p < 0.05) (Figure 2d) in the past four decades, which is widely recognized but the underlying reasons and mechanisms remain unclear [43,44,63,64]. The main reasons are climate observations in the northwestern TP are quite rare [34], leading to greatly uncertain precipitation simulation. With multi-source precipitation datasets, a recent study also revealed that summer precipitation over the Inner Tibetan Plateau (ITP, mainly in the northwestern TP) increased significantly during 1979 to 2018 [43], which is consistent with our results. The wetting trend over the northwest TP is mainly caused by the shift in AMO (Atlantic multidecadal oscillation) from the negative phase (period with a colder North Atlantic Ocean) to the positive phase (period with a warmer North Atlantic Ocean), weakening westerly wind over the TP and enhancing moisture transport into the ITP in summer since the mid-1990s [43].

4.2. Climatic Sensitivity of Vegetation Indices

The sensitivity of monthly vegetation indices in April–September to monthly temperature and precipitation is heterogeneous for both the meadow and the steppe (Figure 5). Generally, the temperature played a key climatic role in driving the “greenness” (indicated by the vegetation indices) anomalies in the early growing season (before July). However, the contribution of precipitation increased and even a dominant role in the later growing season (July and August) (Figure 5). Temperature is commonly and widely considered as the key role to trigger the green-up of vegetation on the TP [29,59,65,66]. Meanwhile, the sensitivity of green-up dates to preseason precipitation increases in drier areas and periods [34,66]. Thus, the “greenness” during the early growing season for both the meadow and the steppe is highly correlated with temperature. However, during the middle and later growing season, high radiation and temperature may weaken the heat limitation, meanwhile high radiation and temperature-driven higher evapotranspiration directly increase the “water stress” [23,67], which prompted temperature sensitivity to decrease but precipitation sensitivity to increase.
Precipitation sensitivity of monthly vegetation indices nearly peaked in July for both the meadow and the steppe (Figure 5). Generally, July is the warmest month on the TP [68]; thus, precipitation-related water availability dominates the variations in vegetation growth and plant productivity [49]. Specifically, variations in the steppe vegetation indices in July were sensitive to precipitation and the contributions of temperature were quite limited (Figure 5), which may be the result of high temperature and radiation-induced water stress, and the coarser soil texture induced poor water-holding capacity [18,50]. Moreover, we also found the relationship between July precipitation and the 28–100 cm depth soil moisture in August is significant (p < 0.05) for the steppe (Figure 7g). It may be caused by the infiltration-induced lagged effect, and July precipitation may partly contribute to water availability in August, leading to the increase in temperature sensitivity of the vegetation indices in August for the steppe (Figure 5).
Overall, changes in the intra-annual climate regimes are expected to change the supply of heat or water for plants and alter the climatic sensitivity of alpine grasslands. For example, in a temperate steppe in Mongolia, both advanced and delayed precipitation peaks suppressed annual soil respiration, plant growth, and soil microbial activities in the middle growing season [21]. The suppression effects were attributed to the lack of water supply in the middle growing season when large water is in demand. The response of GPP to precipitation monthly distribution is biome-specific, and the mismatch between water demand and supply generally leads to the different responses [23].

4.3. Response of Climatic Sensitivity of Vegetation Indices to MJP

In this study, we found the temperature sensitivity of the mid-growing season vegetation indices in the meadow consistently and significantly increased (p < 0.01) while precipitation sensitivity decreased (p < 0.01) with the increase in the early growing season (May–June) precipitation (MJP) (Figure 6a,c,e,g). We assumed that more precipitation in the early growing season (May–June) may be an antecedent signal of a wet mid-growing season, which means that more MJP is an indicator of more coming JAP (precipitation in July–August) thus a wet year is well-deserved. Thus, more JAP would enhance the temperature sensitivity of vegetation indices and lower the precipitation sensitivity of the meadow. However, we examined the relationship between MJP and JAP, and the relationship was indistinct and insignificant (p > 0.1; not shown).
It is widely recognized that, besides the climate factors, the acclimation of plant and community, such as plant biomass allocation and community composition changes, is also an important biotic factor regulating the relationship between climate and vegetation functions [1,3,15,69]. More MJP may be the result of higher surface evapotranspiration (ET) at the expense of soil water. It may induce soil “drought” and affect the biomass allocation (more biomass in root) and community composition (dominance of xeric and mesic species) during the early growing season, which probably enhances the water acquisition capacity of the meadow in the mid-growing season and consequently increases the temperature sensitivity but decreases the precipitation sensitivity (Figure 6a,c,e,g). Indeed, we found a negative correlation between precipitation and soil moisture in May (Figure 7a), and precipitation in June had no significant effect on the soil moisture of each layer in June (Figure 7b). We also examined the relationship between monthly mean surface ET and the top four layers of soil moisture in May–June, and it was proved to be negative; meanwhile, the relationship between ET and 0–28 cm depth soil moisture was statistically significant (p < 0.05) (Figure 8a). In contrast to the meadow, the correlation was positive for the ET and soil moisture on the steppe, and the relationship between ET and the top layer soil moisture was notably (p < 0.05) (Figure 8b). In addition, we also examined the spatial and temporal correlation between MJP and ET over the alpine meadow, and the results showed that MJP and ET were positively correlated in nearly 70% of the areas (by counting the number of pixels), and more than 60% of the areas reached the statistical significance level (p < 0.05). Temporally, for ET and precipitation in May overall the meadow positivity correlated (R = 0.38, p < 0.1), while the relationship is indistinct in June (R = 0.19, p = 0.42). Thus, more ET might cause a higher MJP in the early growing season.
Previous studies also showed that plant biomass allocation or community composition changes responded to climate change. For example, with 164 published studies, Eziz et al. [22] showed that drought significantly increases the root mass and decreases the allocation of biomass in the stem and leaf. For a semiarid temperate steppe in Inner Mongolia, it was proved that the community composition was dominated by precipitation through changes soil moisture [17]. On the TP, based on 4-year drought manipulation on the meadow in the TP, it was also proved that drought manipulation truly shifted more NPP allocation belowground because a developed root system promotes the ability of vegetation to obtain water [3]. We also found that the below-ground net primary production (BNPP) of the grasslands on the northern TP is mainly affected by precipitation rather than temperature [70]. A meta-analysis across nine sites suggested warming and drought increase the abundance of grass, which has a deeper root system and a higher tolerance to drought but decreases the abundance of the sedge and forb (mesic species) [3]. For the sub-Mediterranean grasslands, Chelli et al. [53] found spring precipitation is important for above-ground net primary productivity (ANPP), and a dry spring results in lower annual ANPP, even as the summer precipitation increases. This is consistent with our results that early soil drought reduces the sensitivity of vegetation to precipitation in the middle growing season; thus, the increase in precipitation in summer may not affect ANPP and the greenness. Thus, a dry or wet early growing season may regulate the community composition and shift the dominance of xeric and mesic species, which possibly results in the inverse trend of temperature and precipitation sensitivity in response to altered MJP over the meadow (Figure 6a,c,e,g).
However, the climatic sensitivity of the steppe vegetation indices responds indistinctly to MJP (Figure 6b,d,f,h). On the one hand, the green-up date of the alpine steppe on the TP is later than the alpine meadow. In particular, some areas in the southwest TP green two months later than the eastern region [71,72]. It may make the steppe insensitive to precipitation in May and June. On the other hand, the alpine steppe had a higher above-ground productivity allocation that was dominated by temperature but not precipitation [70]. Moreover, we found precipitation in May over the steppe had no significant effect on soil moisture, but significantly correlated (p < 0.1) with the 0–28 cm depth soil moisture in June (Figure 7e). This may be due to precipitation in May partly in the form of snowfall and the negative feedback of snow and cloud cover on temperature may delay the greening up of the steppe [73,74]. However, previous studies also showed the positive effects of snow and preseason precipitation on spring phenology, especially for the arid areas [34,66,75]. Therefore, the positive and negative effects may complicate the influence of the precipitation changes in May and June on the steppe “greenness”. Future studies are necessary to examine the effects of precipitation in May and June on the climatic sensitivity of the alpine steppe.

5. Conclusions

In this study, we found MJP over the southeast meadow on the TP significantly increased, while precipitation over the northwest steppe increased remarkably (p < 0.05) in May–September from 1979 to 2019. On the interannual scale, temperature and precipitation dominated the variability in vegetation indices (NDVI, EVI, SIF, and MTVI2) for the meadow and the steppe, respectively. On the intra-annual scale, we specifically showed that the temperature sensitivity of vegetation indices generally decreased but precipitation sensitivity increased for both the alpine meadow and alpine steppe during April to September. However, our results suggested that the climate (temperature and precipitation) sensitivity of alpine grasslands to the precipitation changes on the TP were divergent among different alpine grasslands. Specifically, in response to the MJP increase over the alpine meadow, the temperature sensitivity of the mid-growing season vegetation indices (MGNDVI, MGEVI, MGSIF, and MGMTVI2) increased significantly while the precipitation sensitivity significantly decreased (p < 0.01). We infer that more MJP over the meadow may be the result of enhanced evapotranspiration, which is at the expense of soil moisture and even induces soil “drought” in the early growing season. This may be to elevate community water acquisition capacity through altering root mass allocation and community composition, consequently regulating the divergent climate sensitivities of vegetation growth in the mid-growing season. Our findings suggest that it is inadequate to regard precipitation as an indicator of moisture conditions for plant growth, at least in the alpine meadow on the TP, which may limit our understanding of the acclimatization of alpine ecosystems to climate change.

Author Contributions

Z.W. and B.N. conceived and designed the study. Z.W., B.N. and Y.Z. collected and analyzed the data; X.Z. and B.N. funded this study; Z.W., B.N. and J.W. wrote the paper and all other co-authors provided valuable suggestions for the revision. All authors have read and agreed to the published version of the manuscript.

Funding

This research was jointly funded by the Strategic Priority Research Program of the Chinese Academy of Sciences (XDA19070303, XDA2005010203), and the West Light Foundation of the Chinese Academy of Sciences (2018).

Data Availability Statement

The ERA5 datasets are available at https://www.ecmwf.int (accessed on 6 February 2020). The MOD13C2, MYD13C2 and MOD09A1 datasets are available at https://modis.gsfc.nasa.gov (accessed on 22 December 2019). The SIF data is available at http://data.tpdc.ac.cn (accessed on 14 May 2022).

Conflicts of Interest

The authors declare no conflict of interest.

References

  1. Batllori, E.; Lloret, F.; Aakala, T.; Anderegg, W.R.L.; Aynekulu, E.; Bendixsen, D.P.; Bentouati, A.; Bigler, C.; Burk, C.J.; Camarero, J.J.; et al. Forest and woodland replacement patterns following drought-related mortality. Proc. Natl. Acad. Sci. USA 2020, 117, 29720–29729. [Google Scholar] [CrossRef] [PubMed]
  2. Anderegg, W.R.L.; Kane, J.M.; Anderegg, L.D.L. Consequences of widespread tree Mortality triggered by drought and temperature stress. Nat. Clim. Chang. 2013, 3, 30–36. [Google Scholar] [CrossRef]
  3. Liu, H.; Mi, Z.; Lin, L.; Wang, Y.; Zhang, Z.; Zhang, F.; Wang, H.; Liu, L.; Zhu, B.; Cao, G.; et al. Shifting plant species composition in response to climate change stabilizes grassland primary production. Proc. Natl. Acad. Sci. USA 2018, 115, 4051–4056. [Google Scholar] [CrossRef] [PubMed] [Green Version]
  4. Huang, L.; He, B.; Chen, A.; Wang, H.; Liu, J.; Lu, A.; Chen, Z. Drought dominates the interannual variability in global terrestrial net primary production by controlling semi-arid ecosystems. Sci. Rep. 2016, 6, 24639. [Google Scholar] [CrossRef] [PubMed] [Green Version]
  5. Jung, M.; Reichstein, M.; Schwalm, C.R.; Huntingford, C.; Sitch, S.; Ahlstrom, A.; Arneth, A.; Camps-Valls, G.; Ciais, P.; Friedlingstein, P.; et al. Compensatory water effects link yearly global land CO2 sink changes to temperature. Nature 2017, 541, 516–520. [Google Scholar] [CrossRef] [Green Version]
  6. Poulter, B.; Frank, D.; Ciais, P.; Myneni, R.B.; Andela, N.; Bi, J.; Broquet, G.; Canadell, J.G.; Chevallier, F.; Liu, Y.Y.; et al. Contribution of semi-arid ecosystems to interannual variability of the global carbon cycle. Nature 2014, 509, 600–603. [Google Scholar] [CrossRef] [Green Version]
  7. Donat, M.G.; Lowry, A.L.; Alexander, L.V.; O’Gorman, P.A.; Maher, N. More extreme precipitation in the world’s dry and wet regions. Nat. Clim. Chang. 2016, 6, 508–513. [Google Scholar] [CrossRef]
  8. Greve, P.; Orlowsky, B.; Mueller, B.; Sheffield, J.; Reichstein, M.; Seneviratne, S.I. Global assessment of trends in wetting and drying over land. Nat. Geosci. 2014, 7, 716–721. [Google Scholar] [CrossRef]
  9. Held, I.M.; Soden, B.J. Robust responses of the hydrological cycle to global warming. J. Clim. 2006, 19, 5686–5699. [Google Scholar] [CrossRef]
  10. Liu, C.; Allan, R.P. Observed and simulated precipitation responses in wet and dry regions 1850–2100. Environ. Res. Lett. 2013, 8, 034002. [Google Scholar] [CrossRef]
  11. Allan, R.P.; Soden, B.J.; John, V.O.; Ingram, W.; Good, P. Current changes in tropical precipitation. Environ. Res. Lett. 2010, 5, 025205. [Google Scholar] [CrossRef] [Green Version]
  12. Min, S.K.; Zhang, X.; Zwiers, F.W.; Hegerl, G.C. Human contribution to more-intense precipitation extremes. Nature 2011, 470, 378–381. [Google Scholar] [CrossRef] [PubMed]
  13. Piao, S.; Ciais, P.; Huang, Y.; Shen, Z.; Peng, S.; Li, J.; Zhou, L.; Liu, H.; Ma, Y.; Ding, Y.; et al. The impacts of climate change on water resources and agriculture in China. Nature 2010, 467, 43–51. [Google Scholar] [CrossRef] [PubMed]
  14. Piao, S.; Yin, L.; Wang, X.; Ciais, P.; Peng, S.; Shen, Z.; Seneviratne, S.I. Summer soil moisture regulated by precipitation frequency in China. Environ. Res. Lett. 2009, 4, 549–567. [Google Scholar] [CrossRef]
  15. Beier, C.; Beierkuhnlein, C.; Wohlgemuth, T.; Penuelas, J.; Emmett, B.; Korner, C.; de Boeck, H.; Christensen, J.H.; Leuzinger, S.; Janssens, I.A.; et al. Precipitation manipulation experiments—Challenges and recommendations for the future. Ecol. Lett. 2012, 15, 899–911. [Google Scholar] [CrossRef]
  16. Huxman, T.E.; Snyder, K.A.; Tissue, D.; Leffler, A.J.; Ogle, K.; Pockman, W.T.; Sandquist, D.R.; Potts, D.L.; Schwinning, S. Precipitation pulses and carbon fluxes in semiarid and arid ecosystems. Oecologia 2004, 141, 254–268. [Google Scholar] [CrossRef]
  17. Yang, H.; Wu, M.; Liu, W.; Zhang, Z.; Zhang, N.; Wan, S. Community structure and composition in response to climate change in a temperate steppe. Glob. Chang. Biol. 2011, 17, 452–465. [Google Scholar] [CrossRef]
  18. Guo, Q.; Hu, Z.; Li, S.; Yu, G.; Sun, X.; Zhang, L.; Mu, S.; Zhu, X.; Wang, Y.; Li, Y.; et al. Contrasting responses of gross primary productivity to precipitation events in a water-limited and a temperature-limited grassland ecosystem. Agric. For. Meteorol. 2015, 214–215, 169–177. [Google Scholar] [CrossRef]
  19. Parton, W.; Morgan, J.; Smith, D.; Del Grosso, S.; Prihodko, L.; LeCain, D.; Kelly, R.; Lutz, S. Impact of precipitation dynamics on net ecosystem productivity. Glob. Chang. Biol. 2012, 18, 915–927. [Google Scholar] [CrossRef]
  20. Heisler-White, J.L.; Blair, J.M.; Kelly, E.F.; Harmoney, K.; Knapp, A.K. Contingent productivity responses to more extreme rainfall regimes across a grassland biome. Glob. Chang. Biol. 2009, 15, 2894–2904. [Google Scholar] [CrossRef]
  21. Ru, J.; Zhou, Y.; Hui, D.; Zheng, M.; Wan, S. Shifts of growing-season precipitation peaks decrease soil respiration in a semiarid grassland. Glob. Chang. Biol. 2018, 24, 1001–1011. [Google Scholar] [CrossRef] [PubMed]
  22. Eziz, A.; Yan, Z.; Tian, D.; Han, W.; Tang, Z.; Fang, J. Drought effect on plant biomass allocation: A meta-analysis. Ecol. Evol. 2017, 7, 11002–11010. [Google Scholar] [CrossRef] [PubMed]
  23. Wang, Z.P.; He, Y.T.; Niu, B.; Wu, J.S.; Zhang, X.Z.; Zu, J.X.; Huang, K.; Li, M.; Cao, Y.A.; Zhang, Y.J.; et al. Sensitivity of terrestrial carbon cycle to changes in precipitation regimes. Ecol. Indic. 2020, 113, 106223. [Google Scholar] [CrossRef]
  24. Yao, T.; Wu, F.; Ding, L.; Sun, J.; Zhu, L.; Piao, S.; Deng, T.; Ni, X.; Zheng, H.; Ouyang, H. Multispherical interactions and their effects on the Tibetan Plateau’s earth system: A review of the recent researches. Natl. Sci. Rev. 2015, 2, 468–488. [Google Scholar] [CrossRef] [Green Version]
  25. Li, M.; Wu, J.; Feng, Y.; Niu, B.; He, Y.; Zhang, X. Climate Variability Rather Than Livestock Grazing Dominates Changes in Alpine Grassland Productivity Across Tibet. Front. Ecol. Evol. 2021, 9, 631024. [Google Scholar] [CrossRef]
  26. Li, M.; Wu, J.S.; Song, C.Q.; He, Y.T.; Niu, B.; Fu, G.; Tarolli, P.; Tietjen, B.; Zhang, X.Z. Temporal Variability of Precipitation and Biomass of Alpine Grasslands on the Northern Tibetan Plateau. Remote Sens. 2019, 11, 360. [Google Scholar] [CrossRef] [Green Version]
  27. Niu, B.; He, Y.; Zhang, X.; Fu, G.; Shi, P.; Du, M.; Zhang, Y.; Zong, N. Tower-Based Validation and Improvement of MODIS Gross Primary Production in an Alpine Swamp Meadow on the Tibetan Plateau. Remote Sens. 2016, 8, 592. [Google Scholar] [CrossRef] [Green Version]
  28. Niu, B.; He, Y.; Zhang, X.; Zong, N.; Fu, G.; Shi, P.; Zhang, Y.; Du, M.; Zhang, J. Satellite-Based Inversion and Field Validation of Autotrophic and Heterotrophic Respiration in an Alpine Meadow on the Tibetan Plateau. Remote Sens. 2017, 9, 615. [Google Scholar] [CrossRef] [Green Version]
  29. Shen, M.; Piao, S.; Chen, X.; An, S.; Fu, Y.H.; Wang, S.; Cong, N.; Janssens, I.A. Strong impacts of daily minimum temperature on the green-up date and summer greenness of the Tibetan Plateau. Glob. Chang. Biol. 2016, 22, 3057–3066. [Google Scholar] [CrossRef]
  30. Shen, M.; Piao, S.; Jeong, S.J.; Zhou, L.; Zeng, Z.; Ciais, P.; Chen, D.; Huang, M.; Jin, C.S.; Li, L.Z.; et al. Evaporative cooling over the Tibetan Plateau induced by vegetation growth. Proc. Natl. Acad. Sci. USA 2015, 112, 9299–9304. [Google Scholar] [CrossRef] [Green Version]
  31. Niu, B.; Zhang, X.; Piao, S.; Janssens, I.A.; Fu, G.; He, Y.; Zhang, Y.; Shi, P.; Dai, E.; Yu, C.; et al. Warming homogenizes apparent temperature sensitivity of ecosystem respiration. Sci. Adv. 2021, 7, eabc7358. [Google Scholar] [CrossRef] [PubMed]
  32. Piao, S.; Niu, B.; Zhu, J.; Zhang, X.; Wang, T.; Wang, S.; Liang, E. Responses and feedback of the Tibetan Plateau’s alpine ecosystem to climate change. Chin. Sci. Bull. 2019, 64, 2842–2855. [Google Scholar] [CrossRef]
  33. Huang, K.; Zhang, Y.; Zhu, J.; Liu, Y.; Zu, J.; Zhang, J. The Influences of Climate Change and Human Activities on Vegetation Dynamics in the Qinghai-Tibet Plateau. Remote Sens. 2016, 8, 876. [Google Scholar] [CrossRef] [Green Version]
  34. Shen, M.; Piao, S.; Cong, N.; Zhang, G.; Janssens, I.A. Precipitation impacts on vegetation spring phenology on the Tibetan Plateau. Glob. Chang. Biol. 2015, 21, 3647–3656. [Google Scholar] [CrossRef] [Green Version]
  35. Li, L.; Zhang, Y.; Wu, J.; Li, S.; Zhang, B.; Zu, J.; Zhang, H.; Ding, M.; Paudel, B. Increasing sensitivity of alpine grasslands to climate variability along an elevational gradient on the Qinghai-Tibet Plateau. Sci. Total Environ. 2019, 678, 21–29. [Google Scholar] [CrossRef]
  36. Gao, Q.; Guo, Y.; Xu, H.; Ganjurjav, H.; Li, Y.; Wan, Y.; Qin, X.; Ma, X.; Liu, S. Climate change and its impacts on vegetation distribution and net primary productivity of the alpine ecosystem in the Qinghai-Tibetan Plateau. Sci. Total Environ. 2016, 554–555, 34–41. [Google Scholar] [CrossRef]
  37. Chen, H.; Zhu, Q.; Peng, C.; Wu, N.; Wang, Y.; Fang, X.; Gao, Y.; Zhu, D.; Yang, G.; Tian, J.; et al. The impacts of climate change and human activities on biogeochemical cycles on the Qinghai-Tibetan Plateau. Glob. Chang. Biol. 2013, 19, 2940–2955. [Google Scholar] [CrossRef]
  38. Jiao, W.; Wang, L.; Smith, W.K.; Chang, Q.; Wang, H.; D’Odorico, P. Observed increasing water constraint on vegetation growth over the last three decades. Nat. Commun. 2021, 12, 3777. [Google Scholar] [CrossRef]
  39. Feng, X.; Fu, B.; Zhang, Y.; Pan, N.; Zeng, Z.; Tian, H.; Lyu, Y.; Chen, Y.; Ciais, P.; Wang, Y.; et al. Recent leveling off of vegetation greenness and primary production reveals the increasing soil water limitations on the greening Earth. Sci. Bull. 2021, 66, 1462–1471. [Google Scholar] [CrossRef]
  40. Fensholt, R.; Langanke, T.; Rasmussen, K.; Reenberg, A.; Prince, S.D.; Tucker, C.; Scholes, R.J.; Le, Q.B.; Bondeau, A.; Eastman, R.; et al. Greenness in semi-arid areas across the globe 1981–2007—An Earth Observing Satellite based analysis of trends and drivers. Remote Sens. Environ. 2012, 121, 144–158. [Google Scholar] [CrossRef]
  41. Wang, Z.; Wu, J.; Niu, B.; He, Y.; Zu, J.; Li, M.; Zhang, X. Vegetation Expansion on the Tibetan Plateau and Its Relationship with Climate Change. Remote Sens. 2020, 12, 4150. [Google Scholar] [CrossRef]
  42. Kang, S.C.; Xu, Y.W.; You, Q.L.; Flugel, W.A.; Pepin, N.; Yao, T.D. Review of climate and cryospheric change in the Tibetan Plateau. Environ. Res. Lett. 2010, 5, 015101. [Google Scholar] [CrossRef]
  43. Sun, J.; Yang, K.; Guo, W.; Wang, Y.; He, J.; Lu, H. Why Has the Inner Tibetan Plateau Become Wetter since the Mid-1990s? J. Clim. 2020, 33, 8507–8522. [Google Scholar] [CrossRef]
  44. Zhang, C.; Tang, Q.H.; Chen, D.L. Recent Changes in the Moisture Source of Precipitation over the Tibetan Plateau. J. Clim. 2017, 30, 1807–1819. [Google Scholar] [CrossRef]
  45. Zhang, G.; Yao, T.; Piao, S.; Bolch, T.; Xie, H.; Chen, D.; Gao, Y.; O’Reilly, C.M.; Shum, C.K.; Yang, K.; et al. Extensive and drastically different alpine lake changes on Asia’s high plateaus during the past four decades. Geophys. Res. Lett. 2017, 44, 252–260. [Google Scholar] [CrossRef] [Green Version]
  46. Song, C.; Huang, B.; Ke, L.; Richards, K.S. Remote sensing of alpine lake water environment changes on the Tibetan Plateau and surroundings: A review. Isprs J. Photogramm. Remote Sens. 2014, 92, 26–37. [Google Scholar] [CrossRef]
  47. Li, L.; Yang, S.; Wang, Z.Y.; Zhu, X.D.; Tang, H.Y. Evidence of Warming and Wetting Climate over the Qinghai-Tibet Plateau. Arct. Antarct. Alp. Res. 2010, 42, 449–457. [Google Scholar] [CrossRef]
  48. Zhang, W.; Zhou, T.; Zhang, L. Wetting and greening Tibetan Plateau in early summer in recent decades. J. Geophys. Res. Atmos. 2017, 122, 5808–5822. [Google Scholar] [CrossRef]
  49. Zhang, X.; Li, M.; Wu, J.; He, Y.; Niu, B. Alpine Grassland Aboveground Biomass and Theoretical Livestock Carrying Capacity on the Tibetan Plateau. J. Resour. Ecol. 2022, 13, 129–141. [Google Scholar] [CrossRef]
  50. Fu, G.; Shen, Z.X.; Zhang, X.Z. Increased precipitation has stronger effects on plant production of an alpine meadow than does experimental warming in the Northern Tibetan Plateau. Agric. For. Meteorol. 2018, 249, 11–21. [Google Scholar] [CrossRef]
  51. Ma, Z.; Liu, H.; Mi, Z.; Zhang, Z.; Wang, Y.; Xu, W.; Jiang, L.; He, J.S. Climate warming reduces the temporal stability of plant community biomass production. Nat. Commun. 2017, 8, 15378. [Google Scholar] [CrossRef] [PubMed]
  52. Guo, Q.; Hu, Z.; Li, S.; Li, X.; Sun, X.; Yu, G. Spatial variations in aboveground net primary productivity along a climate gradient in Eurasian temperate grassland: Effects of mean annual precipitation and its seasonal distribution. Glob. Chang. Biol. 2012, 18, 3624–3631. [Google Scholar] [CrossRef]
  53. Chelli, S.; Canullo, R.; Campetella, G.; Schmitt, A.O.; Bartha, S.; Cervellini, M.; Wellstein, C.; Vandvik, V. The response of sub-Mediterranean grasslands to rainfall variation is influenced by early season precipitation. Appl. Veg. Sci. 2016, 19, 611–619. [Google Scholar] [CrossRef] [Green Version]
  54. Chen, N.; Zhang, Y.; Zu, J.; Zhu, J.; Zhang, T.; Huang, K.; Cong, N.; Wang, Z.; Li, J.; Zheng, Z.; et al. The compensation effects of post-drought regrowth on earlier drought loss across the tibetan plateau grasslands. Agric. For. Meteorol. 2020, 281, 107822. [Google Scholar] [CrossRef]
  55. Long, R.J.; Apori, S.O.; Castro, F.B.; Ørskov, E.R. Feed value of native forages of the Tibetan Plateau of China. Anim. Feed Sci. Technol. 1999, 80, 101–113. [Google Scholar] [CrossRef]
  56. Li, M.; Wu, J.; He, Y.; Wu, L.; Niu, B.; Song, M.; Zhang, X. Dimensionality of grassland stability shifts along with altitudes on the Tibetan Plateau. Agric. For. Meteorol. 2020, 291, 108080. [Google Scholar] [CrossRef]
  57. Hersbach, H.; Bell, B.; Berrisford, P.; Biavati, G.; Horányi, A.; Muñoz Sabater, J.; Nicolas, J.; Peubey, C.; Radu, R.; Rozum, I.; et al. ERA5 Monthly Averaged Data on Single Levels from 1979 to Present. Copernicus Climate Change Service (C3S) Climate Data Store (CDS). 2019. Available online: https://cds.climate.copernicus.eu/ (accessed on 6 February 2020).
  58. Haboudane, D.; Miller, J.R.; Pattey, E.; Zarco-Tejada, P.J.; Strachan, I.B. Hyperspectral vegetation indices and novel algorithms for predicting green LAI of crop canopies: Modeling and validation in the context of precision agriculture. Remote Sens. Environ. 2004, 90, 337–352. [Google Scholar] [CrossRef]
  59. Zhang, G.; Zhang, Y.; Dong, J.; Xiao, X. Green-up dates in the Tibetan Plateau have continuously advanced from 1982 to 2011. Proc. Natl. Acad. Sci. USA 2013, 110, 4309–4314. [Google Scholar] [CrossRef] [Green Version]
  60. Sen, P.K. Estimates of the regression coefficient based on Kendall’s tau. J. Am. Stat. Assoc. 1968, 63, 1379–1389. [Google Scholar] [CrossRef]
  61. Mann, H.B. Nonparametric tests against trend. Econometrica 1945, 13, 245–259. [Google Scholar] [CrossRef]
  62. Kendall, M.G. Rank Correlation Methods; Griffin: London, UK, 1975. [Google Scholar]
  63. Zhang, C.; Tang, Q.H.; Chen, D.L.; van der Ent, R.J.; Liu, X.C.; Li, W.H.; Haile, G.G. Moisture Source Changes Contributed to Different Precipitation Changes over the Northern and Southern Tibetan Plateau. J. Hydrometeorol. 2019, 20, 217–229. [Google Scholar] [CrossRef]
  64. Yao, T.; Thompson, L.; Yang, W.; Yu, W.; Gao, Y.; Guo, X.; Yang, X.; Duan, K.; Zhao, H.; Xu, B.; et al. Different glacier status with atmospheric circulations in Tibetan Plateau and surroundings. Nat. Clim. Chang. 2012, 2, 663–667. [Google Scholar] [CrossRef]
  65. Piao, S.; Cui, M.; Chen, A.; Wang, X.; Ciais, P.; Liu, J.; Tang, Y. Altitude and temperature dependence of change in the spring vegetation green-up date from 1982 to 2006 in the Qinghai-Xizang Plateau. Agric. For. Meteorol. 2011, 151, 1599–1608. [Google Scholar] [CrossRef]
  66. Cong, N.; Wang, T.; Nan, H.; Ma, Y.; Wang, X.; Myneni, R.B.; Piao, S. Changes in satellite-derived spring vegetation green-up date and its linkage to climate in China from 1982 to 2010: A multimethod analysis. Glob. Chang. Biol. 2013, 19, 881–891. [Google Scholar] [CrossRef]
  67. Song, L.; Zhuang, Q.; Yin, Y.; Zhu, X.; Wu, S. Spatio-temporal dynamics of evapotranspiration on the Tibetan Plateau from 2000 to 2010. Environ. Res. Lett. 2017, 12, 014011. [Google Scholar] [CrossRef]
  68. Niu, B.; He, Y.; Zhang, X.; Du, M.; Shi, P.; Sun, W.; Zhang, L. CO2 Exchange in an Alpine Swamp Meadow on the Central Tibetan Plateau. Wetlands 2017, 37, 525–543. [Google Scholar] [CrossRef]
  69. Li, M.; Zhang, X.; Niu, B.; He, Y.; Wang, X.; Wu, J. Changes in plant species richness distribution in Tibetan alpine grasslands under different precipitation scenarios. Glob. Ecol. Conserv. 2020, 21, e00848. [Google Scholar] [CrossRef]
  70. Niu, B.; Zeng, C.; Zhang, X.; He, Y.; Shi, P.; Tian, Y.; Feng, Y.; Li, M.; Wang, Z.; Wang, X.; et al. High Below-Ground Productivity Allocation of Alpine Grasslands on the Northern Tibet. Plants 2019, 8, 535. [Google Scholar] [CrossRef] [Green Version]
  71. Shen, M.; Zhang, G.; Cong, N.; Wang, S.; Kong, W.; Piao, S. Increasing altitudinal gradient of spring vegetation phenology during the last decade on the Qinghai–Tibetan Plateau. Agric. For. Meteorol. 2014, 189–190, 71–80. [Google Scholar] [CrossRef]
  72. Yu, H.; Luedeling, E.; Xu, J. Winter and spring warming result in delayed spring phenology on the Tibetan Plateau. Proc. Natl. Acad. Sci. USA 2010, 107, 22151–22156. [Google Scholar] [CrossRef] [Green Version]
  73. You, Q.L.; Kang, S.C.; Pepin, N.; Flugel, W.A.; Yan, Y.P.; Behrawan, H.; Huang, J. Relationship between temperature trend magnitude, elevation and mean temperature in the Tibetan Plateau from homogenized surface stations and reanalysis data. Glob. Planet. Chang. 2010, 71, 124–133. [Google Scholar] [CrossRef]
  74. Xu, X.; Riley, W.J.; Koven, C.D.; Jia, G.; Zhang, X. Earlier leaf-out warms air in the north. Nat. Clim. Chang. 2020, 10, 370–375. [Google Scholar] [CrossRef]
  75. Wang, X.; Wang, T.; Guo, H.; Liu, D.; Zhao, Y.; Zhang, T.; Liu, Q.; Piao, S. Disentangling the mechanisms behind winter snow impact on vegetation activity in northern ecosystems. Glob. Chang. Biol. 2018, 24, 1651–1662. [Google Scholar] [CrossRef] [PubMed]
Figure 1. Ecological Geographical Division of Tibetan Plateau and the spatial distribution of alpine meadow and alpine steppe.
Remotesensing 14 02484 g001
Figure 2. Spatial patterns of precipitation in MayJune (MJP) (a) and July–August (JAP) (b) change the trend and monthly precipitation trend overall the meadow (c) and the steppe (d) on the TP during the past four decades (1979–2019). The black dots in (a,b) suggest that the trends are statistically significant (Mann–Kendall test, p < 0.05). Labels +, * and ** in (c,d) indicate the Mann–Kendall test significance levels of 0.1, 0.05 and 0.01, respectively.
Remotesensing 14 02484 g002
Figure 3. Spatial patterns of sensitivity of the vegetation indices to GST and GSP during 2000–2019. (a,c,e,g) show the spatial patterns of climatic sensitivity of GSNDVI, GSEVI, GSSIF, and GSMTVI2 to GST, respectively. (b,d,f,h) show the spatial patterns of climatic sensitivity of GSNDVI, GSEVI, GSSIF, and GSMTVI2 to GSP, respectively. The black dots indicate the relationship is statistically significant at the 0.05 significance level.
Remotesensing 14 02484 g003
Figure 4. Sensitivity of the vegetation indices to GST and GSP during 2000–2019 for the meadow (a) and steppe (b) on the TP during 2000–2019. Labels +, * and ** in (c,d) indicate the significance levels of 0.1, 0.05 and 0.01, respectively.
Remotesensing 14 02484 g004
Figure 5. The temperature and precipitation sensitivity of intra-annual variability of the monthly vegetation indices in the meadow (a) NDVI; (c) EVI; (e) SIF; (g) MTVI2 and the steppe (b) NDVI; (d) EVI; (f) SIF; (h) MTVI2.
Remotesensing 14 02484 g005
Figure 6. Response of temperature and precipitation sensitivity of the MGNDVI (a,b), MGEVI (c,d), MGSIF (e,f), and MGMTVI2 (g,h) to MJP change on the meadow and the steppe on the TP. The red and blue points show the temperature sensitivity and precipitation sensitivity, and the red and blue lines indicate the linear trends of the climate sensitivity as MJP changes. The R2 is the coefficient of determination and p reveals the significance level.
Remotesensing 14 02484 g006
Figure 7. Lagged correlation between precipitation from May to August and soil moisture (SM) in different layers in the meadow (ad) and the steppe (eh). Lines in (ah) are B-spline curves derived from the correlation coefficient between monthly precipitation in May-August and monthly soil moisture at different depths (0–7 cm, 7–28 cm, 28–100 cm, and 100–289 cm) in the meadow (ad) and the steppe (eh), respectively. Green and yellow bars are growing and non-growing seasons on the TP, respectively. The dashed line is the 0.1 significance level.
Remotesensing 14 02484 g007
Figure 8. Relationship between monthly mean evapotranspiration (ET, mm) and soil moisture content (m3 m−3) in May–June in the meadow (a) and the steppe (b). The color lines indicate the least-squares fit between ET and soil moisture in each depth (red: 0–7 cm; blue: 7–28 cm; yellow: 28–100 cm; green: 100–285 cm) and the corresponding p indicates the significance level.
Remotesensing 14 02484 g008
Publisher’s Note: MDPI stays neutral with regard to jurisdictional claims in published maps and institutional affiliations.

