Abstract
Vegetation in the terrestrial ecosystem, sensitive to climate change and human activities, exerts a crucial influence on the carbon cycles in land, ocean, and atmosphere. Discrimination between climate and human-induced vegetation dynamics is advocated but still limited, especially in coastal China, which is characterized by a developed economy, a large population, and high food production, but also by unprecedented climate change and warming. Taking coastal China as the research area, our study used the normalized difference vegetation index (NDVI) in growing seasons, as well as precipitation, temperature, and sunlight hours datasets, adopted residual trend analysis at pixel and regional scales in coastal China from 2000–2019 and aims to (1) delineate the patterns and processes of vegetation changes, and (2) separate the relative contributions of climate and human activities by adopting residual trend analysis. The results indicated that (1) coastal China experienced the most vegetation greening (83.04% of the whole region) and partial degradation (16.86% of the whole region) with significant spatial heterogeneity; (2) compared with climate change, human activities have a greater positive impact on NDVI, and the regions were mainly located in the north of the North China Plain and the south of southern China; (3) the relative contribution rates of climate change and human activities were detected to be 0–60% and 60–100%, respectively; (4) in the northern coastal areas, the improvement of cultivated land management greatly promoted the greening of vegetation and thus the increase of grain yield, while in southern coastal areas, afforestation and the restoration of degraded forest were responsible for vegetation restoration; and (5) similar results obtained by partial correlation between nighttime lights and NDVI indicated the reliability of the residual trend analysis. The linear relationships of precipitation, temperature, and radiation on NDVI may limit the accurate estimation of climate drivers on vegetation, and further ecosystem process-modeling approaches can be used to estimate the relative contribution of climate change and human activities. The findings in our research emphasized that the attribution for vegetation dynamics with heterogeneity can provide evidence for the designation of rational ecological conservation policies.
1. Introduction
With the continuous intensification of climate change and human activities, global natural ecosystems have been severely threatened [1,2,3,4]. As one of the most critical components of the terrestrial ecosystem, vegetation has functioned as the nexus in the atmosphere, soil, and hydrology and guaranteed the supply of ecosystem services [5,6,7,8]. It is also the main factor that affects the carbon source and carbon sink, regulates the ecological process, and plays an essential role in the carbon cycle and global change [9,10,11]. As the land–sea transitional zone, the coastal area is one of the most frequently fluctuating areas on the Earth’s surface. The terrestrial ecosystem is simultaneously affected by land, ocean, atmosphere, and human activities; thus, its fragility is highly prominent [12,13].
Temperature and precipitation are the key climatic factors that affect the growth and development of vegetation. The average and extreme temperatures in China’s coastal areas show a rising trend, but there is no significant change in precipitation [14]. In the northern coastal areas, drought caused by warming is an important reason for decreasing vegetation coverage [15]. In southern coastal regions, floods caused by extreme precipitation reduce solar radiation and temperature, adversely affecting vegetation [16,17]. It is found that climate warming leads to the earlier germination of vegetation in spring, the later fall of leaves in autumn, and a more extended growth period [18,19]. Due to the differences in underlying surface properties, hydrothermal conditions, and vegetation types in different regions, there are significant spatial differences in vegetation change and its response to climate change. Zheng et al., (2017) [20] discussed the relationship between vegetation, climate, and human activities in southwest China. The results showed that the vegetation coverage had increased significantly, and it has the best correlation with autumn precipitation and summer average temperature. In addition, human activities also benefit vegetation vitality.
The impact of human activities on vegetation dynamics are both positive and negative. Approximately one-third to one-half of the landmass has been modified by anthropogenic forces [2]. The coastal areas are characterized by rapid economic growth. More than 70% of large Chinese cities are located in the coastal regions, playing a leading role in the national economy, accounting for 48.53% of its gross domestic product (GDP) in 2020 (National Bureau of Statistics) [21]. Unprecedented urbanization has led to cities’ encroachment on much farmland and woodland, resulting in a significant decline in vegetation coverage, which reduces ecosystem services. In contrast, ecological conservation projects such as the Grain for Green Program are conducive to vegetation restoration [22,23]. Zhao et al. [24] reported that compared with meteorological factors, socio-economic factors have a more noticeable impact on vegetation changes. Natural reserves have played a certain role in controlling land degradation, but large-scale natural forest protection projects have sounder effects, but heterogeneity exists. Deng et al. [25] and Shi et al. [26] found that human activities improved and destroyed vegetation in the Loess Plateau and Qinling Mountains at the same time; still, the positive effects were more significant than the negative ones. In addition, increased atmospheric carbon dioxide concentration and nitrogen deposition are also the main driving factors for vegetation growth [27]. Both human activities and climate change can impact vegetation changes and may cause significant differences in vegetation cover changes in different world regions.
The earlier studies often use correlation analysis to investigate the causes of vegetation changes and rarely separate the impact of different driving forces. The detection of changes in terrestrial ecosystems mainly adopted (i) long-term observational data like carbon flux data using the eddy covariance technique, (ii) statistical analysis, and (iii) mechanism model simulation. First, long-term observational data analysis provides evidence for detecting and attributing vegetation changes on a longer time scale and a larger spatial scale [28], such as the AmeriFlux network, ChinaFlux network, and Chinese Phenological Observation Network. It can provide accurate first-hand data, but long-term continuous observations and complete time series are required. In addition, based on a satellite-derived database, some studies calculated net primary production that was changed by humans to quantify humans’ contribution to vegetation [29,30]. Wang et al., (2021) [31] discriminated between the contribution of climatic and non-climatic factors to interannual changes in the NDVI (normalized difference vegetation index) based on partial derivatives. Qiao et al., (2018) [32] used multiple stepwise regression models to determine standardized regression coefficients and then quantified the relative contributions of different variables. Statistical analysis methods are simple and easy to use, and large-scale research can be carried out in auxiliary by remote sensing data [33]. However, it is challenging to understand its mechanisms and processes. Process-based models can explore the mechanism of the relative contributions. The Carnegie–Ames–Stanford approach (CASA) [34] is often used to calculate the actual NPP (net primary productivity). Then the climate productivity model, such as the Thornthwaite memorial model [35], is used to calculate the potential NPP [36]. The difference between actual and potential represents the interference of human activities, but the mechanism model is more difficult in parameterization. In addition, if different models are used, the error of the models themselves will also reduce the accuracy of the results. While well-established schemes are still required, residual trend analysis—a statistical approach based on the regression residuals between NDVI and climate factors—has been advocated by several recent studies [37,38,39].
The normalized difference vegetation index (NDVI) routinely derived from AVHRR (advanced very high-resolution radiometer), SPOT/VGT (SPOT/VEGETATION), and MODIS (moderate-resolution imaging spectroradiometer) Earth observation has been used for a range of local- to global-scale vegetation investigations [40,41,42]. NDVI has a linear or near-linear relationship with green-leaf density, net primary production, and cumulative biomass. It is one of the effective indicators reflecting large-scale vegetation’s greenness and growth status [43,44]. Although the time series of AVHRR-NDVI is more extended, the spatial resolution is lower. SPOT/VGT-NDVI and MODIS-NDVI have finer spatial resolution and have a complete time series covering 2000 to 2019. Both have a strong linear relationship and high similarity, and they can accurately reflect the diversity, changing trends, and fluctuations of the vegetation [45,46]. However, Hou et al. (2013) reported that in eastern China, the seasonality of NDVI intrinsically overshadowed the difference of the three datasets. However, only the de-seasonal SPOT/VEG-NDVI showed significant correlation both with AVHRR-NDVI and with MODIS-NDVI. Therefore, SPOT/VGT-NDVI was used as the index of vegetation dynamics in this study. SPOT/VGT-NDVI has been widely and successfully applied in China, including south China [46], the Yangtze River Basin [47], and north China [48], showing that it can match the requirements of vegetation detection in China’s coastal areas.
Our place-based study adopted the precipitation, temperature data, and 1 km resolution NDVI dataset from 2000 to 2019, with linear trend analysis, residual trend analysis, and partial correlation analysis to characterize the drivers of vegetation dynamics in coastal China at the pixel and regional scales. The purpose of our research focuses on the following scientific questions explicitly. (1) Under the influence of climate change and human activities, what changes have taken place in the vegetation patterns in coastal China? (2) What are the separate contributions of climate change and human activities to vegetation changes? (3) Can the residual trend analysis method effectively identify the relative contributions? We can test the following hypotheses by answering the above questions. (1) Due to complex driving forces, vegetation greening and degradation coexist in coastal China. (2) From 2000 to 2019, vegetation changes were mainly related to human activities and showed spatial heterogeneity. The research highlights the scientific novelty that we try to answer the scientific questions systematically involving patterns, processes, and drivers at multiple scales, with multiple methods and from multiple perspectives (‘3-M’ framework).
2. Materials and Methods
2.1. Study Area
The coastal China region (34°35′–45°30′ N, 102°55′–123°28′ E) lies in eastern China and the western Pacific, covering a total area of 1.32 × 10⁶ km2 (square kilometers) (13.7% of Chinese territory). Thirteen provinces are included in our research (Taiwan province is excluded because of data limitation). The study area was divided into six sub-regions from north to south, according to the China Meteorological Administration’s (CMA, http://www.cma.gov.cn, accessed on 1 May 2021) partition standard: Northeast Region (Area I), North China Region (Area II), Huanghuai Region (Area III), Jianghuai Region (Area IV), Jiangnan Region (Area V), and South China Region (Area VI) (Figure 1).
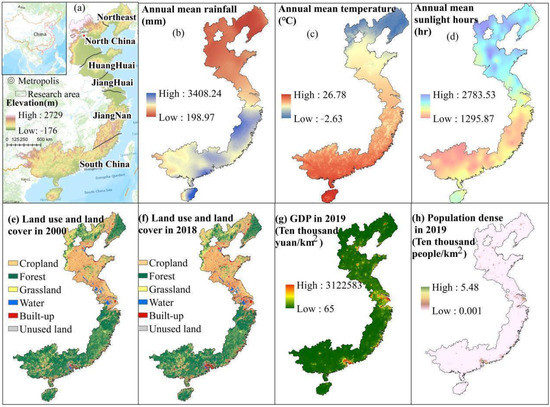
Figure 1.
Background information for coastal China.
In 2020, the total population in coastal China accounted for 44.95% of China’s total population; the total GDP accounted for 52.85% of China’s; and the urbanization rate is over 67.97%, more than the same period national urbanization level (60.60%) (National Bureau of Statistics) [21]. The climate type is mainly monsoon climate, which is characterized by being cold and dry in winter, hot and rainy in summer. The annual average temperature is 16.5 °C (http://cdc.cma.gov.cn/, accessed on 1 May 2021). The minimum annual precipitation in north China is 537.7 mm, belonging to temperate and warm temperate climate zones, while the maximum annual precipitation in south China is 1660.7 mm, belonging to subtropical and tropical climate zones. In coastal China from 1986 to 2015, the maximum 1-day and maximum 5-day precipitation increased at rates of 0.25 mm y−1 and 0.49 mm y−1, respectively, although the trend was not significant [14,15]. Besides, the temperature was generally increased with the background of global warming [14,15]. The terrain in the study area is complex and diverse, and there are plains, plateaus, and hills. The average altitude is 300 m. The soils in the north are mainly brown and dark brown, while those in the south are mainly red and yellow soils. The urbanization rate of China’s 11 coastal provinces increased from 48.93% to 67.97% from 2000 to 2020, while China’s urbanization rate increased from 36.22% to 60.6% during the same period (National Bureau of Statistics, 2000; 2020). It should be noted that some research mainly concentrated on arid and semi-arid regions of China, especially the Loess Plateau [26,49,50], southwest China [51], and the Qinghai-Tibet Plateau [52,53]. There are few studies on the southeast coastal area because the southeast coastal area is not the main implementation area of the Grain for Green Project [54].
2.2. Data
The daily temperature, precipitation, and sunlight hours data with 1 km resolution, covering 2000 to 2019, were derived from the China Meteorological Data Sharing Service Network, China Ground Climate Daily Data Set (V3.0) (http://cdc.cma.gov.cn, accessed on 1 May 2021). This dataset does not include weather stations in Hong Kong, Macau, and Taiwan provinces. After strict quality control, the dataset is significantly improved in terms of the quality and integrity of the same data type; the correct rate is close to 100%. As for the time range of studies, due to data limitations, many studies have been carried out to 2015 or even earlier [55,56], and just a few studies have been conducted in the last 20 years [57,58]. We have extended the data to the recent 20 years in our research.
The 1 km SPOT-VEGETATION NDVI dataset was downloaded from the Chinese Academy of Sciences Resources and Environment Science and Data Center (https://www.spot-vegetation.com/, accessed on 1 May 2021). The 1 km MODIS NDVI dataset was downloaded from the website of EARTHDATA (https://earthdata.nasa.gov, accessed on 1 May 2021). The maximum value component method generates both of the two NDVI datasets in the growing season (March to September) [59]. They have a fundamental reference significance for vegetation monitoring, rational use of natural resources, and other ecological-related fields.
The nighttime light data were downloaded from the National Earth System Science Data Center, National Science & Technology Infrastructure of China (http://www.geodata.cn, accessed on 1 May 2022). It is an extended time series (2000–2018) of Global NPP-VIIRS-like nighttime light data from a cross-sensor calibration. The dataset solves the problem that the two sets of nighttime light data of DMSP-OLS and NPP-VIIRS cannot be used at the same time.
Urbanization and agricultural practices shifts were responsible for the socio-economic drivers of vegetation changes. LULC data with 1 km resolution were derived from Resource and Environment Science and Data Center (https://www.resdc.cn/, accessed on 1 May 2021). The data included two phases (2000 and 2018), and six land-use and land-cover types (i.e., cropland, forest, grassland, water body, built-up area, and unused land) (IGBP, International Geosphere-Biosphere Programme). Their accuracy was assessed by on-site verification, with an overall classification accuracy of 94.3%. For the quantifying of agricultural practices shifts, the dataset including crop yield, fertilizer application amount, and total power of agricultural machinery on the prefecture level in 10 coastal provinces from 2000 to 2019 were collected from the statistical yearbook (http://www.stats.gov.cn/, accessed on 1 May 2021). Besides, all maps of administrative regions were derived from the National Geomatics Center of China (http://www.ngcc.cn/ngcc/, accessed on 1 May 2021).
In coastal China under the influence of the monsoon, rain and heat are in the same season. Phenology has important applications in directing agricultural production [59]. During the non-growing season, vegetation does not grow because of low temperatures and very little precipitation. Therefore, when studying the relationship between climate and NDVI, the data in the growing season and NDVI are used. In eastern China, the growing season is from April to October [60].
2.3. Methodology
2.3.1. Preprocessing
Preprocessing for meteorological data mainly includes weather station screening, missing data filling, and spatial interpolation. First, the missing data is interpolated according to the binary linear interpolation and the data of adjacent years. The missing data only accounts for 0.5% of the weather stations with missing data, so their impact on the analysis results could be ignored. Then, the Kriging interpolation is employed to interpolate the panel data to grid raster at a 1 km resolution matching with the NDVI dataset [61]. Preprocessing of SPOT/VEGETATION NDVI data includes format conversion, projection, data mask, and maximum value component (MVC) [26].
2.3.2. Computation of Trends
The NDVI time-series trend analysis is suitable for monitoring subtle, long-term vegetation changes. The annual changing rate of the growing season NDVI is fitted by the linear regression model (LRM), and the changing trend of the LRM is defined as the trend of NDVI. The calculation formula for the trend (slope) is in Equation (1):
where y is the NDVI value of each year from 2000 to 2019, x is the time series, from 2000 to 2019, a is the intercept, b is changing trend (slope) of annual NDVI, and b < 0 and b > 0 indicate that the tendency of NDVI is decrease and increase, respectively, over time.
y = b × x + a
2.3.3. Residual Trend Analysis
Residual trend analysis, developed by Evans and Geerken [62], was employed in our study to disentangle the relative contribution of climate change and anthropogenic causes to vegetation dynamics. This method has been extensively adopted in dryland [63], alpine grassland [64], South Africa [65], China [39], and even at a global scale [66]. The fundamental assumption behind residual trend analysis is that if there is any significant human signal in addition to the climate signal, it will be displayed in the unexplained variation after removing the climate signal from the NDVI dataset [62]. The response of vegetation to temperature, precipitation, and sunshine hours is nonlinear and the effect would change with various local conditions [67]. The impact of light or sunlight hours on vegetation change was rarely considered in climate-based vegetation models in previous studies [57,58,68]. Choosing a non-linear model requires observation of multiple data types and detailed statistical analysis, making the results difficult to interpret; besides, the multiple linear regression model also performs well in many studies [68,69]. Considering that the purpose of the model in our study is to reveal an empirical regulation, so, in our study, a multiple linear regression model among maximum growing season NDVI, accumulating growing season precipitation (Prec), mean growing season temperature (Tem), and accumulating growing season sunlight hours (Slt) was established to predict climate-driven NDVI (NDVICC, Equation (2)). Then, changes in human-induced NDVI (NDVIHA, Equation (3)) could be indicated by the difference between observed NDVI (NDVIobs, Equation (3)) and climate-driven NDVI (NDVICC, Equation (3)). This is calculated in Equations (2) and (3):
where a and b are the fitting parameters; represents the predicted climate-driven NDVI under the impact of accumulating growing season precipitation (Prec, mm) and mean growing season temperature (Tem, degree centigrade), and sunlight hours (Slt, h); is the residual representing changes in human-induced NDVI; and NDVIobs is derived from remote sensing data. The R square for Equation (2) in coastal China was presented in Figure S1a.
Six scenarios (Table 1) were developed to distinguish the relative contributions between climate and human-induced vegetation dynamics [70,71]. , and represent the slope of NDVIobs, NDVIHA, and NDVICC, respectively. The pattern of in coastal China was presented in Figure S1b,c.

Table 1.
Scenarios for the relative contribution of climatic and anthropogenic impacts on vegetation dynamics.
2.3.4. Partial Correlation Analysis between NDVI and Climate Factors
Partial correlation was widely adopted to quantify the relationship between two factors, as well as excluding other potential variables. This study analyzes the correlation between NDVI and rainfall, temperature, and sunlight hours. The partial correlation is in Equation (4):
where v denotes NDVI, p represents precipitation, t represents temperature, and s represents sunlight hours. Rvp,t,s indicate the partial correlation coefficient between NDVI and precipitation after excluding the impact of temperature and sunlight hours; Rvp,t, Rvs,t, and Rps,t represent the partial correlation coefficients between NDVI and precipitation, between NDVI and sunlight hours, and between precipitation and sunlight hours, respectively, after excluding the impact of temperature.
2.3.5. Processing of LULC Transition
A pixel, representing a certain type of land use, with a resolution of 1 km served as the analytical unit. The georeferenced coordinates of land-use maps in 2000 and 2018 were all matches, and pixels in the same position in the multi-phase images can assure spatial matching. Between 2000 and 2018, the area of each land-use category was aggregated (averaged) by several pixels belonging to the same land-use category. The LULC transition indicates that one pixel in the same location in LULC in 2000 may be converted into other categories in LULC in 2018 or stay intact. To produce land transition maps from 2000 to 2018, the pre-matrix (LULC in 2000) and post-matrix (LULC in 2018) were compared and mapped using ArcGIS (Version 10.2, Environmental Systems Research Institute, Inc., Redlands, CA, USA).
3. Results
3.1. Spatio-Temporal Pattern and Heterogeneity of Vegetation Dynamics
Within last two decades, China’s coastal NDVI in the growing season had a significant spatial heterogeneity, generally manifested as higher in the south and lower in the north (Figure 2(A1,B1)). Specifically, NDVI is lower in the northwest mountainous area, Bohai Rim region, Yangtze River Delta, and Pearl River Delta, and is higher in the south, southeast, and northeast areas. The averaged NDVI is 0.75 across the whole region, with 65.74% of NDVI over it.
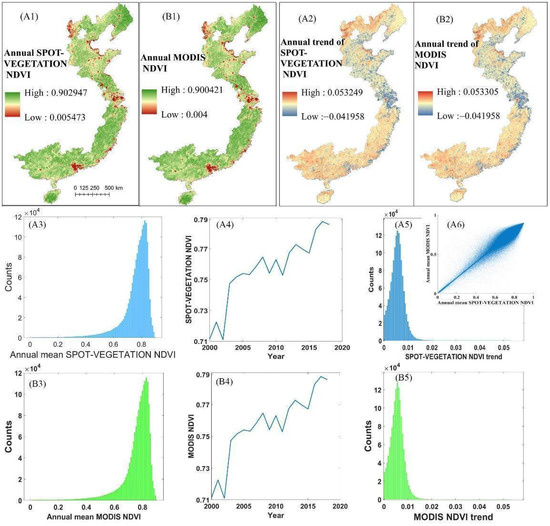
Figure 2.
Spatio-temporal pattern and heterogeneity of vegetation dynamics. (A1) represents the annual SPOT-VEGETATION NDVI from 2000–2019; (B1) shows the annual MODIS NDVI from 2000–2019; (A2) represents the annual trend of SPOT-VEGETATION NDVI; (B2) represents the annual trend of MODIS NDVI; (A3) shows frequency distribution histogram for A1; (B3) shows frequency distribution histogram for B1; (A4) shows annual changes of SPOT-VEGETATION NDVI across entire coastal China from 2000 to 2019; (B4) shows annual changes of MODIS NDVI across entire coastal China from 2000 to 2019; (A5) is the frequency distribution histogram for A2; (B5) is the frequency distribution histogram for B2; and (A6) shows the scatter plot of annual mean SOPT-VEGETATION NDVI against MODIS NDVI in pixel scale.
Most of the landscapes in coastal China had a stable vegetation restoration trend (Figure 2(A2,B2,A4,B4)). Spatially, the noticeable vegetation recovery trend was monitored primarily on the North Mountain area, and in southeast and south China; in contrast, the significant degradation trend in growing season NDVI was mainly found in the Bohai region, in the Pearl River Delta region, and especially in the Yangtze River Delta region. In total, 83.04% of the coastal territory for vegetation was greening, while 16.86% showed brown status (Figure 2(A2,B2)). Generally, growing season NDVI in coastal China increased in fluctuations, with an average trend of 3.3 × 10⁻⁴ y−1 (Figure 2(A4,B4)), p < 0.01) and a variation range between 0.712–0.789.
Besides, MOD13A3-NDVI and SPOT/VGT-NDVI have similar performances to describe the changing processes of NDVI in coastal China from the perspectives of annual mean NDVI, annual trend of NDVI, and their frequency distribution histogram based on Figure 2(A3,B3,A5,B5), especially Figure 2(A6). It can provide the evidence that in coastal China, SPOT/VGT NDVI could reflect the reality of coastal vegetation, at least as expressive as MODIS MDVI.
3.2. Driving Forces of Vegetation Dynamics at Regional and Landscape Scales
The combined effect of climate change and human activities was the main driver for the dynamics of growing season NDVI in coastal China during the past 20 years. Figure 3B shows that 70.47% of regions with increased NDVI were attributed to the combined effect. Simultaneously, only 2.14% of the areas with greening trends were caused by climate change alone, scattered in the central part of the North China Plain. In addition, the greening area only induced by human activities accounted for 9.93%, distributed mainly in the middle of Shandong province and the Huanghuai region and the southwest part of south China (Figure 3A). Figure 3C summaries area percentages for driving forces in various landscape components, all the LULC types are mainly affected by both climate change and human activities. For cropland, 60.98% of the area was influenced by a combined effect. Besides, 11.81% of the area is only positively affected by human activities, and was larger than the proportion that is only positively affected by climate change, 2.67% (Figure 3C). As to forest, under the combined effect, 84.71% of forests show the increased NDVI, and 8.41% of forests was promoted by only human activities. Cultivated land is the type of land use that is most positively affected only by human activities.
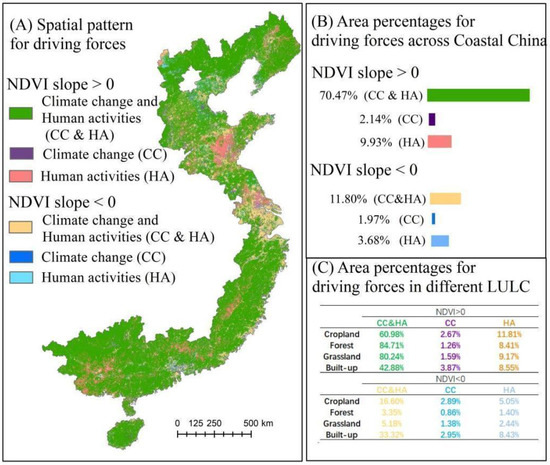
Figure 3.
Driving forces of vegetation dynamics in coastal China during 2000–2019. CC and HA represent climatic change and human activities, respectively. The color in (C) is same as that in (A,B).
On the other hand, the combined effect was also responsible for reducing NDVI in 11.8% of the area at regional scale, mainly centered in the Yangtze River Delta. The area of NDVI reduction caused by only climate change and only human activities accounted for 1.97% and 3.68%, respectively, and the pattern is relatively scattered. At the landscape scale, 16.6% of the reduced NDVI of cultivated land is due to the combined effect of climate change and human activities, and 5.05% of the area is related to human activities only; 5.6% of the forest land NDVI showed a decreasing trend, of which only 0.86% was only due to the effect of climate change (Figure 3C). Vegetation in urban areas is the type of land use that is most negatively affected only by human activities.
3.3. The Relative Contribution Rates of Climate Change and Human Activities to Vegetation Dynamics
Figure 4(A1,A2) shows that as to the contribution rate of climate change, the area with a positive effect to NDVI accounted for 72.62%, of which the area with a contribution rate of 0~+60% was the largest, accounting for nearly 64.11% of the whole area; the contribution rate of more than +80% of the area accounted for only 3.45%, mainly in the North China Plain with a large area of arable land. In contrast, the negative contribution rate of climate change to the NDVI accounted for 13.78%, mainly in the Yangtze River Delta, where the land cover was built up.
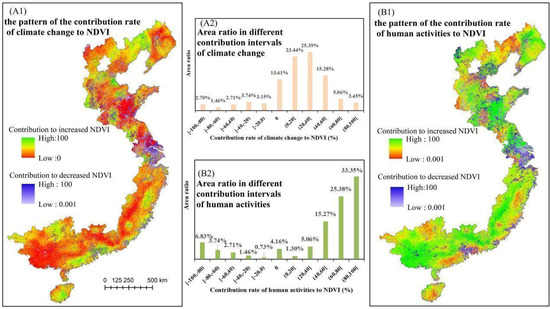
Figure 4.
The relative contribution of driving forces to vegetation dynamics.
In the perspective of human activities, the area with a positive effect to NDVI accounted for 80.37%; the area is relatively large where the contribution rate of human activities is in the range of +60~+100%, mainly distributed in the northeast region, Huanghuai region, and south China region. Adversely, NDVI in 15.47% of the region, the Yangtze River Delta in particular, has negative feedback with human activities (Figure 4(B1,B2)).
From our analysis, the contribution of human activities to the increased NDVI is generally greater than that of climate change. Specifically, the contribution of climate change and human activities to vegetation dynamics is about 0–60% and 60–100%, respectively.
3.4. Changes of Human Activities across Coastal China
At the landscape scale, land-use change can reflect well the transformation of natural land cover by human activities. First, through the analysis of land-use conversion from 2000 to 2018, it is found that in the areas with reduced NDVI, 21% of cultivated land is converted to construction land, and 4.21% of forest land is converted to construction land. However, the proportion of cultivated land is very small (Figure 5). Second, the Euclidean distance from the impervious surface is further calculated to represent the disturbance ability of human activities. It is found that with the attenuation of human disturbance, the decline of the NDVI’s decreasing rates is in logarithmic form, and the disturbance intensity may drop to 0 at about 40 km (Figure 5d).
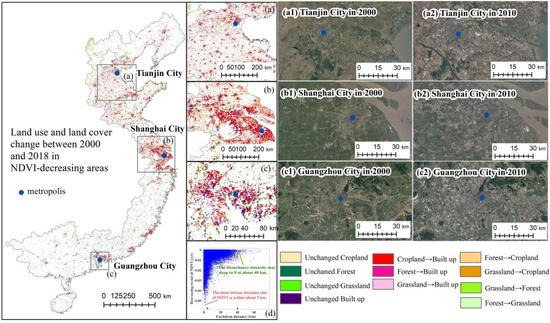
Figure 5.
Land-use and land-cover change between 2000 and 2018 in NDVI-decreasing areas. In (d), P1 indicates the disturbance intensity may drop to 0 at about 40 km; P2 indicated the most drastic reduction rate of NDVI is within about 5 km.
Based on the statistical yearbook data, the spatial and temporal patterns of crop yield, fertilizer application amount, and total power of agricultural machinery in coastal areas are analyzed. In the northern region, especially in the North China Plain, crop yield has increased in the last 20 years (Figure 6a), but fertilizer application has decreased, especially in central Shandong province (Figure 6b). Simultaneously, total power of agricultural machinery continued to increase, except in Tianjin, the Yangtze River Delta, and the Pearl River Delta (Figure 6c). The construction of irrigation and water conservancy facilities makes the change of NDVI strongly depend on irrigation and less dependent on precipitation. The results showed that the improvement of agricultural management practices was beneficial to the increase of crop yield and vegetation greenness. The spatial pattern of afforestation in coastal areas from 2000 to 2019 was also drawn. It is found that the area with the largest total area of afforestation was located in the northern part of the North China Plain, around the Beijing–Tianjin–Hebei region (Figure 6d), which was the promotion of the projects named ‘Beijing–Tianjin–Hebei Sandstorm Source Area Control’ and ‘Green for Grain’ [72,73,74]. The afforestation area in southeast China showed an increasing trend (Figure 5e). Besides, the “Restoration Projects of Degraded Forests” in the recent five years were also mainly carried out in the southeast regions of coastal China (Figure 5f).
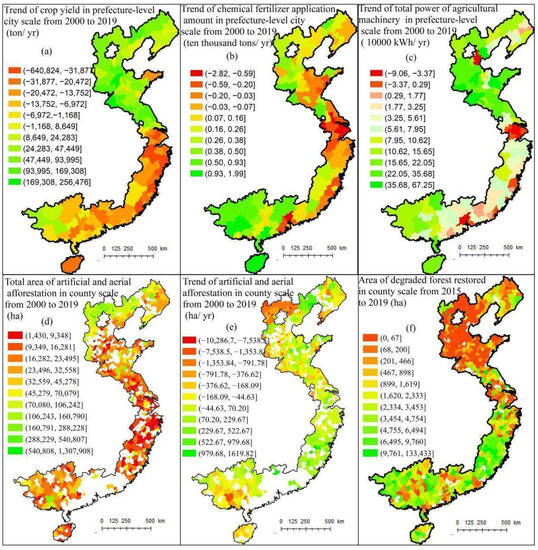
Figure 6.
Crop yield and afforestation patterns.
3.5. Effectiveness of Residual Trend Analysis Method to Separate the Contribution of Climate Change and Human Activities to NDVI
To verify that the residual trend analysis can effectively separate the effects of climate change and human activities on NDVI, we analyzed the partial correlation between NDVI and nighttime lights by using nighttime light data to represent the intensity of human activities, excluding the effect of precipitation and temperature, and sunlight hours.
Residual trend analysis shows that human activities harmed NDVI in the Bohai Rim, Yangtze River Delta, and Pearl River Delta (Figure 7a1–a4). Through the nighttime light data, the vigorous light intensity in these areas reflected frequent human activities (Figure 7b1–b4). Further analysis by the partial correlation between nighttime lights and NDVI showed a strong negative correlation (Figure 5c1–c4). Similar results obtained by these two methods indicated the reliability of the residual trend analysis.
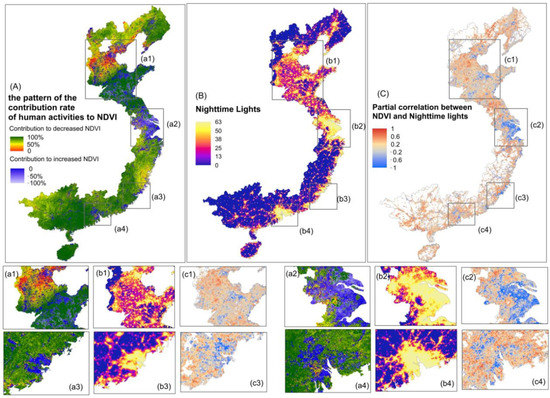
Figure 7.
Validation for residual trend analysis. (A) The spatial pattern of the contribution rate of human activities to NDVI separated by the residual trend analysis; (B) the spatial pattern of the average annual nighttime light from 2000 to 2013; and (C) the partial correlation coefficient between NDVI and nighttime lights by excluding the effect of precipitation and temperature. (a1–a4) represent the Beijing–Tianjin–Hebei urban agglomeration, the Yangtze River Delta, the Fuzhou–Xiamen–Quanzhou urban agglomeration, and the Pearl River Delta region, respectively. (b1–b4) and (c1–c4) circles the consistent regions.
The contribution of human activities to NDVI in the North China Plain and Shandong Peninsula (Figure 7a1,b1 and c1) separated by residual trend analysis showed a promoting effect, while partial correlation analysis also captured the same pattern.
4. Discussion
4.1. Impact of Climate Change on Vegetation Dynamics
Climate change was responsible for vegetation restoration in most areas of coastal China. Overall warming in coastal China is indisputable. A warming climate quickly alters terrestrial vegetation. It has not only prolonged the growth season of vegetation [75], but also accelerated the decomposition of soil organic matter and released more nutrient elements [76], which was conducive to ecosystem conservation.
However, climate change, like increased extreme high temperature and extreme precipitation, can also result in land degradation, which is mainly manifested in metropolitan regions, the Yangtze River Delta in particularly. First, Xu et al. [14] reported that the temperature increase at night was greater than that in daytime in coastal China from 1986 to 2015. This might enhance plant respiration in nighttime, while inhibit leaf photosynthesis in daytime, reducing accumulation of dry matter. Second, Xu et al. [14] and Wang et al. [15] reported that the extreme precipitation in coastal China showed an increased trend in recent decades, which may inhibit vegetation growth. More importantly, some studies have shown that in metropolitan areas, the combined effects of extreme climate and negative human activities amplify the effects of both on vegetation [77,78]. The heat island effect caused by the modified heat-energy balance during urbanization processes, as well as the rain island effect, may lead to urban waterlogging and threaten urban green space [79,80].
4.2. Urbanization, Agricultural Practices and Policy Shifts as Socio-Economic Drivers
Anthropogenic causes are not easy to be quantified since the statistical data are rare and incomplete. Many studies did not mention what the specific human activities were, nor did they quantify such impacts at the landscape scale. Thus, we explicitly quantify several human-induced drivers to the vegetation dynamics along coastal China. For the regions with reduced NDVI, the driving force is mainly the combined effect of climate change and human activities (Figure 3A), and human activities have a greater impact (Figure 4B2). The negative effects of human activities may mainly hinge on (i) urban expansion or (ii) land reclamation. First, for urban expansion, many studies supported our assumption that with the rapid economic development in coastal China, the rapidly growing population stimulates the ever-increasing demands on urban land, occupying the surrounding high-quality farmland, grassland, or forest, removing native vegetation and replacing it with an impervious water surface, ultimately reducing NDVI [81,82]. Second, as to the reason for cropland reclamation, native vegetation, such as grassland or woodland, tends to be more productive in wet and warm coastal China, and when converted to cropland, productivity might be reduced [83,84,85].
In addition, the area with the most serious decrease rate of NDVI is within about 5 km around the built-up area, indicating the instability of vegetation around the settlement places. We speculate that for people who live near cities, there is less willingness to farm. The higher income of migrant workers leads to an increase in the proportion of abandoned farmland [50]. Besides, the discharge of industrial pollutants and tilling soil without fallow or nutrient replenishment also damaged vegetation to a certain extent. So, on the eastern coast, vegetation degradation is mainly due to urban expansion and its correspondingly negative effects.
For the attribution of vegetation greening, we divided the study area into northern and southern parts on the land-use and land-cover basis. In northern coastal China, especially in the North China Plain, the main crop-producing zone, the dominant land use type is arable land, while in southern coastal China, it is mainly forestland. Let us assume that (i) in northern coastal areas, sound agricultural practices promote greening, especially in the North China Plain, (ii) while in the south, it is the implementation of forest conservation policies. First, studies at the global scale showed that the patterns of the global greening trend were very consistent with the global distribution of agricultural land. China had played a leading role in the greening of global terrestrial vegetation by improving agricultural efficiency [22]. This phenomenon has also been observed in India, a major food-producing country [86]. On the other hand, since 2000, China has implemented the policy of returning farmland to forest and vigorously promoting afforestation, making the southeast coastal China the main region of plantation forestland.
Land reclamation from the sea can meet the social and economic benefits, but it also poses a threat to the coastal ecosystem. In the past 70 years, on the east coast of mainland China, more than 68% of the coast was expanded toward the sea and more than 22% of the coast contracted [87]. The net change resulted in an increase in land area of nearly 14,200 km2, with an average growth rate of 202.82 km2/y. Shandong, Jiangsu, and Zhejiang provinces showed significant net increases in coastal land areas [84]. Coastal types, land requirements, and policies determine the land-use type, which in turn affects the structure and function of coastal ecosystems [88]. Specifically, on the one hand, agricultural reclamation can increase ecosystem productivity and increase NDVI. On the other hand, due to the high groundwater level and high salinity in the land reclamation area, the surface soil is prone to salinization, and the surface plants will wither because of a lack of water. In addition, the reclamation of tidal flats tends to accumulate heavy metals and other difficult-to-degrade pollutants, thereby destroying terrestrial ecosystems, reducing the area and quality of wetland habitats, degrading mangrove ecosystems, and reducing NDVI [89].
4.3. Limitation and Prospects
The pattern of vegetation degradation caused by human activities captured by the method of partial correlation analysis is consistent with the pattern analyzed by the method of residual analysis, indicating the effectiveness of residual analysis in separating the effects of climate change and human activities on vegetation. While residual trend analysis is a convincing quantitative method to disentangle the relative contribution of multiple drivers to vegetation changes, the limitation and uncertainty still need to be addressed [37,63]. For one aspect, vegetation responds to the climate system in complicated processes [33,90], so choose which climate factors are the most appropriate to quantify NDVI under the influence of climate change. Furthermore, since the impact of climatic conditions on vegetation is non-linear and non-stationary [91], the uncertainty still exists when choosing the adequate model to describe their relationship. The multi-criteria decision algorithms are among the state-of-the-art and easy methods to quantify influencing factors, which have been adopted to determine the probability of glacial lake outburst flooding in the Himalayas [92]. Besides, feature importance techniques can be learned to know which parameters have more control on vegetation since it has been successfully used in the analysis of lake stability [93].
When referring to the impact of human activities, there is no specific quantification of the impact of carbon dioxide emissions [94,95] and nitrogen deposition on vegetation [96,97] caused by human activities. These problems should be further clarified in future studies. The development of a mechanism model based on the ecosystem process, coupled with the climate and socio-economic systems [98,99], can effectively distinguish the effects of different components on vegetation and improve the accuracy of analysis and the credibility of problem solving.
Besides, this paper distinguishes the signals of human activities in the process of vegetation cover change on a large scale, and further field investigation on a finer scale is needed to verify the specific vegetation construction and restoration work. Some ‘non-zonal’ vegetation types like Spartina alterniflora Loisel. are often associated with local environments including topography, water bodies, and salinization. Improving the detection and research of invasive species, which are less affected by precipitation and temperature, is very important for the sustainable development of coastal areas.
4.4. Implications
Taken together, our study supports the potentially broad application of residual trend analysis as an effective method for discriminating drivers of vegetation dynamics. In the Jianghuai region, the dotted areas in the North China Plain, and metropolitan agglomerations, degradation vegetation deserves the most attention. It is very pervasive in developing countries [100,101], causing landscape fragmentation, the loss of natural habitat quality [102] and ecosystem structural and functional diversity [103]. He et al. [104] pointed out that economic growth has been the cause of accelerating human damage to China’s coastal ecosystems. Controlling city size and optimizing the urban spatial configuration, like the design of urban green space, can reduce the loss of habitat and land degradation caused by urban expansion [105].
In the north of northern China and the southwest of the southern region, the contribution of climate change to degradation is greater than that of human activities. Thus, some mitigation and adaptation measures can deal with the “black rhino” of climate change in coastal China [106]. For example, selecting suitable cold- and drought-tolerant species in the arid and semi-arid regions of the north can effectively adapt to climate change, especially extreme climates. Furthermore, in the central part of the North China Plain, vegetation greening was mainly promoted by climate change, so it does not need to rely too much on human management. Indeed, allowing vegetation restoration through a natural process is low-cost and effective for ecological restoration [107].
5. Conclusions
Based on the NDVI dataset, precipitation, temperature, and sunlight hours, we depicted the spatial patterns, change processes, and heterogeneity of vegetation across coastal China from 2000 to 2019 and the hypothesis that vegetation greening and degradation coexist in coastal China has been tested. Then, a multi-scale analysis was conducted on the driving factors and corresponding contributions to NDVI using residual trend analysis. So, we can establish the hypothesis that vegetation changes were mainly related to human activities and showed spatial heterogeneity. The residual trend analysis performs well to distinguish the relative role of climate and human activities to vegetation dynamics. NDVI increased significantly (83.04% of the whole region) in coastal areas of China from 2000 to 2019, especially in the north of the North China Region and the west of the southern China region. Rapidly decreasing areas are mainly distributed in urban agglomerations and economically developed regions such as the Yangtze River Delta of the Jianghuai region and the Pearl River Delta of south China. We suggest controlling city size and optimizing the urban spatial configuration to reduce the loss of habitat and land degradation. The relative contribution rates of climate change and human activities to NDVI have been 0–60% and 60–100%, respectively. In the northern coastal areas, the improvement of cultivated land management greatly promoted the greening of vegetation and thus the increase of the grain yield. In addition, the amount of fertilizer application was decreasing, while the total power of agricultural machinery was increasing. On the other hand, in southern coastal areas, artificial afforestation, aerial seeding afforestation, and restoration of degraded forest have promoted vegetation restoration. For the vegetation in the region promoted by climate change, management investment can be reduced to reduce investment in ecological protection projects. This study can also provide a theoretical basis for the designation of rational ecological conservation policies.
Supplementary Materials
The following supporting information can be downloaded at: https://www.mdpi.com/article/10.3390/rs14102485/s1, Figure S1. The details on calculation for Equation (2) and Equation (3); (a) represents the R square for NDVIcc calculation in Equation (2); (b), (c) and (d) represents the SLOPobs, SLOPCC and SLOPHA, retrospectively.
Author Contributions
Conceptualization, X.X.; methodology, H.X. and Y.H.; software, H.J. and X.X.; validation, S.Q.; formal analysis, H.J.; resources, T.Z.; writing—original draft preparation, H.J.; writing—review and editing, X.X. and H.J. All authors have read and agreed to the published version of the manuscript.
Funding
This research was funded by the National Key Research and Development Program of China, grant numbers 2017YFA0604902; and the Foundation for Innovative Research Groups of the National Natural Science Foundation of China, grant number 41621061; Project Supported by State Key Laboratory of Earth Surface Processes and Resource Ecology.
Data Availability Statement
The data used to support the findings of this study are available from the corresponding authors upon request. The data are not publicly available because of privacy concerns.
Acknowledgments
We also give thanks for the high-performance computing support from the Center for Geodata and Analysis, Faculty of Geographical Science, Beijing Normal University. We are pleased to acknowledge Hongqiao Ling (Wuhan University) for the invaluable assistance and pre-editing on the original manuscript.
Conflicts of Interest
The authors declare no conflict of interest.
References
- Lambin, E.F.; Turner, B.L.; Geist, H.J.; Agbola, S.B.; Angelsen, A.; Bruce, J.W.; Coomes, O.T.; Dirzo, R.; Fischer, G.; Folke, C.; et al. The causes of land-use and land-cover change: Moving beyond the myths. Glob. Environ. Chang. 2001, 11, 261–269. [Google Scholar] [CrossRef]
- Foley, J.A.; DeFries, R.; Asner, G.P.; Barford, C.; Bonan, G.; Carpenter, S.R.; Chapin, F.S.; Coe, M.T.; Daily, G.C.; Gibbs, H.K.; et al. Global consequences of land use. Science 2005, 309, 570–574. [Google Scholar] [CrossRef] [PubMed]
- Zheng, K.; Tan, L.; Sun, Y.; Wu, Y.; Duan, Z.; Xu, Y.; Gao, C. Impacts of climate change and anthropogenic activities on vegetation change: Evidence from typical areas in China. Ecol. Indic. 2021, 126, 107648. [Google Scholar] [CrossRef]
- Zhang, T.; Xu, X.; Jiang, H.; Qiao, S.; Guan, M.; Huang, Y.; Gong, R. Widespread decline in winds promoted the growth of vegetation. Sci. Total Environ. 2022, 825, 153682. [Google Scholar] [CrossRef] [PubMed]
- Melillo, J.M.; Mcguire, A.D.; Kicklighter, D.W.; Moore, B.; Vorosmarty, C.J.; Schloss, A.L. Global climate change and terrestrial net primary production. Nature 1993, 363, 234–240. [Google Scholar] [CrossRef]
- Jiang, H.; Xu, X.; Wang, L.; Zhang, T. Integrating Ecosystem Service Values and Economic Benefits for Sustainable Land Use Management in Semi-Arid Regions in Northern China. Sustainability 2021, 13, 10431. [Google Scholar] [CrossRef]
- Chen, Y.; Feng, X.; Tian, H.; Wu, X.; Gao, Z.; Feng, Y.; Piao, S.; Lv, N.; Pan, N.; Fu, B. Accelerated increase in vegetation carbon sequestration in China after 2010: A turning point resulting from climate and human interaction. Glob. Chang. Biol. 2021, 27, 5848–5864. [Google Scholar] [CrossRef]
- Jiang, H.; Xu, X.; Guan, M.; Wang, L.; Huang, Y.; Liu, Y. Simulation of spatiotemporal land use changes for integrated model of socioeconomic and ecological processes in China. Sustainability 2019, 11, 3627. [Google Scholar] [CrossRef]
- Xu, X.; Jiang, H.; Wang, L.; Guan, M.; Zhang, T.; Qiao, S. Major consequences of land-use changes for ecosystems in the future in the agro-pastoral transitional zone of Northern China. Appl. Sci. 2020, 10, 6714. [Google Scholar] [CrossRef]
- McGuire, A.D.; Anderson, L.G.; Christensen, T.R.; Dallimore, S.; Guo, L.; Hayes, D.J.; Heimann, M.; Lorenson, T.D.; Macdonald, R.W.; Roulet, N. Sensitivity of the carbon cycle in the Arctic to climate change. Ecol. Monogr. 2009, 79, 523–555. [Google Scholar] [CrossRef]
- Loisel, J.; Gallego-Sala, A.V.; Amesbury, M.J.; Magnan, G.; Anshari, G.; Beilman, D.W.; Benavides, J.C.; Blewett, J.; Camill, P.; Charman, D.J.; et al. Expert assessment of future vulnerability of the global peatland carbon sink. Nat. Clim. Chang. 2021, 11, 70–77. [Google Scholar] [CrossRef]
- Harley, C.D.; Randall Hughes, A.; Hultgren, K.M.; Miner, B.G.; Sorte, C.J.; Thornber, C.S.; Rodriguez, L.F.; Tomanek, L.; Williams, S.L. The impacts of climate change in coastal marine systems. Ecol. Lett. 2006, 9, 228–241. [Google Scholar] [CrossRef] [PubMed]
- He, Q.; Silliman, B.R. Climate change, human impacts, and coastal ecosystems in the Anthropocene. Curr. Biol. 2019, 29, R1021–R1035. [Google Scholar] [CrossRef] [PubMed]
- Xu, X.; Jiang, H.; Guan, M.; Wang, L.; Huang, Y.; Jiang, Y.; Wang, A. Vegetation responses to extreme climatic indices in coastal China from 1986 to 2015. Sci. Total Environ. 2020, 744, 140784. [Google Scholar] [CrossRef] [PubMed]
- Yao, Y.; Zou, X.; Zhao, Y.; Wang, T. Rapid changes in land-sea thermal contrast across China’s coastal zone in a warming climate. J. Geophys. Res. Atmos. 2019, 124, 2049–2067. [Google Scholar] [CrossRef]
- Wang, X.; Hou, X. Variation of normalized difference vegetation index and its response to extreme climate in coastal China during 1982–2014. Geogr. Res. 2019, 38, 807–821. [Google Scholar]
- Williamson, C.E.; Madronich, S.; Lal, A.; Zepp, R.G.; Lucas, R.M.; Overholt, E.P.; Rose, K.C.; Schladow, S.G.; Lee-Taylor, J. Climate change-induced increases in precipitation are reducing the potential for solar ultraviolet radiation to inactivate pathogens in surface waters. Sci. Rep. 2017, 7, 13033. [Google Scholar] [CrossRef]
- Piao, S.; Wang, X.; Park, T.; Chen, C.; Lian, X.U.; He, Y.; Bjerke, J.W.; Chen, A.; Ciais, P.; Tømmervik, H.; et al. Characteristics, drivers and feedbacks of global greening. Nat. Rev. Earth Environ. 2020, 1, 14–27. [Google Scholar] [CrossRef]
- Zhu, W.; Tian, H.; Xu, X.; Pan, Y.; Chen, G.; Lin, W. Extension of the growing season due to delayed autumn over mid and high latitudes in North America during 1982–2006. Glob. Ecol. Biogeogr. 2012, 21, 260–271. [Google Scholar] [CrossRef]
- Zheng, Z.; Yuan, Z.; Zhao, Y.; Dan, Z.; Wu, B. Monitoring and dynamic analysis of fractional vegetation cover in southwestern china over the past 15 years based on modis data. Remote Sens. Land Resour. 2017, 29, 128–136. [Google Scholar]
- National Bureau of Statistics. China Statistics Yearbook; China Statistics Press: Beijing, China, 2020. [Google Scholar]
- Bryan, B.A.; Gao, L.; Ye, Y.; Sun, X.; Connor, J.D.; Crossman, N.D.; Stafford-Smith, M.; Wu, J.; He, C.; Yu, D.; et al. China’s response to a national land-system sustainability emergency. Nature 2018, 559, 193–204. [Google Scholar] [CrossRef] [PubMed]
- Wu, X.; Wang, S.; Fu, B.; Feng, X.; Chen, Y. Socio-ecological changes on the Loess Plateau of China after Grain to Green Program. Sci. Total Environ. 2019, 678, 565–573. [Google Scholar] [CrossRef] [PubMed]
- Zhao, H.; Wu, R.; Hu, J.; Yang, F.; Wang, J.; Guo, Y.; Zhou, J.; Wang, Y.; Zhang, C.; Feng, Z. The contrasting east–west pattern of vegetation restoration under the large-scale ecological restoration programmes in southwest China. Land Degrad. Dev. 2020, 31, 1688–1698. [Google Scholar] [CrossRef]
- Deng, C.H.; Bai, H.Y.; Gao, S.; Liu, R.J.; Ma, X.P.; Huang, X.Y.; Meng, Q. Spatial-temporal variation of the vegetation coverage in qinling mountains and its dual response to climate change and human activities. J. Nat. Resour. 2018, 33, 425–438. [Google Scholar]
- Shi, S.; Yu, J.; Wang, F.; Wang, P.; Zhang, Y.; Jin, K. Quantitative contributions of climate change and human activities to vegetation changes over multiple time scales on the Loess Plateau. Sci. Total Environ. 2021, 755, 142419. [Google Scholar] [CrossRef]
- Piao, S.; Yin, G.; Tan, J.; Cheng, L.; Huang, M.; Li, Y.; Liu, R.; Mao, J.; Myneni, R.B.; Peng, S.; et al. Detection and attribution of vegetation greening trend in China over the last 30 years. Glob. Chang. Biol. 2015, 21, 1601–1609. [Google Scholar] [CrossRef]
- Ge, Q.; Dai, J.; Zheng, J. The progress of phenology studies and challenges to modern phenology research in china. Bull. Chin. Acad. Sci. 2010, 25, 310–316. [Google Scholar]
- Vitousek, P.M.; Ehrlich, P.R.; Ehrlich, A.H.; Matson, P.A. Human appropriation of the products of photosynthesis. BioScience 1986, 36, 368–373. [Google Scholar] [CrossRef]
- Rojstaczer, S.; Sterling, S.M.; Moore, N.J. Human appropriation of photosynthesis products. Science 2001, 294, 2549–2552. [Google Scholar] [CrossRef]
- Wang, Y.; Hao, L.; Zhao, M.; Xu, X.; Li, C. Variation of vegetation NDVI and its response to climate change and human activities in Chongqing from 2001 to 2018. Res. Soil Water Conserv. 2021, 28, 222–229. [Google Scholar]
- Qiao, J.; Yu, D.; Wu, J. How do climatic and management factors affect agricultural ecosystem services? A case study in the agro-pastoral transitional zone of northern China. Sci. Total Environ. 2018, 613, 314–323. [Google Scholar] [CrossRef] [PubMed]
- Jiang, H.; Xu, X.; Guan, M.; Wang, L.; Huang, Y.; Jiang, Y. Determining the contributions of climate change and human activities to vegetation dynamics in agro-pastural transitional zone of northern China from 2000 to 2015. Sci. Total Environ. 2020, 718, 134871. [Google Scholar] [CrossRef] [PubMed]
- Potter, C.S.; Davidson, E.A.; Verchot, L.V. Estimation of global biogeochemical controls and seasonality in soil methane consumption. Chemosphere 1996, 32, 2219–2246. [Google Scholar] [CrossRef]
- Lieth, H. Evapotranspiration and primary productivity: CW Thornthwaite memorial model. Pub. Climatol. 1972, 25, 37–46. [Google Scholar]
- Du, J.; Yu, D. Impact of climate change and human activities on net primary productivity of grassland in agro–pastoral transitional zone in northern China. J. Beijing Norm. Univ. Nat. Sci. 2018, 54, 365–372. [Google Scholar]
- Evans, J.; Geerken, R. Discrimination between climate and human-induced dryland degradation. J. Arid Environ. 2004, 57, 535–554. [Google Scholar] [CrossRef]
- Li, A.; Wu, J.; Huang, J. Distinguishing between human-induced and climate-driven vegetation changes: A critical application of RESTREND in inner Mongolia. Landsc. Ecol. 2012, 27, 969–982. [Google Scholar] [CrossRef]
- Jin, K.; Wang, F.; Han, J.; Shi, S.; Ding, W. Contribution of climatic change and human activities to vegetation NDVI change over China during 1982–2015. Acta Geogr. Sin. 2020, 75, 05000961. [Google Scholar]
- Tucker, C.J.; Pinzon, J.E.; Brown, M.E.; Slayback, D.A.; Pak, E.W.; Mahoney, R.; Vermote, E.F.; El Saleous, N. An extended AVHRR 8-km NDVI dataset compatible with MODIS and SPOT vegetation NDVI data. Int. J. Remote Sens. 2005, 26, 4485–4498. [Google Scholar] [CrossRef]
- Delbart, N.; Le Toan, T.; Kergoat, L.; Fedotova, V. Remote sensing of spring phenology in boreal regions: A free of snow-effect method using NOAA-AVHRR and SPOT-VGT data (1982–2004). Remote Sens. Environ. 2006, 101, 52–62. [Google Scholar] [CrossRef]
- Fensholt, R.; Rasmussen, K.; Nielsen, T.T.; Mbow, C. Evaluation of earth observation based long term vegetation trends—Intercomparing NDVI time series trend analysis consistency of Sahel from AVHRR GIMMS, Terra MODIS and SPOT VGT data. Remote Sens. Environ. 2009, 113, 1886–1898. [Google Scholar] [CrossRef]
- Carlson, T.N.; Ripley, D.A. On the relation between NDVI, fractional vegetation cover, and leaf area index. Remote Sens. Environ. 1997, 62, 241–252. [Google Scholar] [CrossRef]
- Pettorelli, N.; Vik, J.O.; Mysterud, A.; Gaillard, J.M.; Tucker, C.J.; Stenseth, N.C. Using the satellite-derived NDVI to assess ecological responses to environmental change. Trends Ecol. Evol. 2005, 20, 503–510. [Google Scholar] [CrossRef] [PubMed]
- Tarnavsky, E.; Garrigues, S.; Brown, M.E. Multiscale geostatistical analysis of AVHRR, SPOT-VGT, and MODIS global NDVI products. Remote Sens. Environ. 2008, 112, 535–549. [Google Scholar] [CrossRef]
- Liu, Y.; Zhou, M. A comparative analysis of avhrr,spot-vgt and modis ndvi remote sensing data over hanjiang river basin. J. South China Agric. Univ. 2015, 36, 106–112. [Google Scholar]
- Li, G.Y.; Chen, S.S.; Yan, Y.; Yu, C. Effects of urbanization on vegetation degradation in the Yangtze River Delta of China: Assessment based on SPOT-VGT NDVI. J. Urban Plan. Dev. 2015, 141, 05014026. [Google Scholar] [CrossRef]
- Liu, S.; Wang, T.; Guo, J.; Qu, J.; An, P. Vegetation change based on SPOT-VGT data from 1998 to 2007, northern China. Environ. Earth Sci. 2010, 60, 1459–1466. [Google Scholar] [CrossRef]
- Qu, L.; Huang, Y.; Yang, L.; Li, Y. Vegetation Restoration in Response to Climatic and Anthropogenic Changes in the Loess Plateau, China. Chin. Geogr. Sci. 2020, 30, 89–100. [Google Scholar] [CrossRef]
- Hu, Y.; Dao, R.; Hu, Y. Vegetation change and driving factors: Contribution analysis in the loess plateau of China during 2000–2015. Sustainability 2019, 11, 1320. [Google Scholar] [CrossRef]
- Tong, X.; Wang, K.; Yue, Y.; Brandt, M.; Liu, B.; Zhang, C.; Liao, C.; Fensholt, R. Quantifying the effectiveness of ecological restoration projects on long-term vegetation dynamics in the karst regions of Southwest China. Int. J. Appl. Earth Obs. Geoinf. 2017, 54, 105–113. [Google Scholar] [CrossRef]
- Wu, J.; Li, M.; Zhang, X.; Fiedler, S.; Gao, Q.; Zhou, Y.; Cao, W.; Hassan, W.; Mărgărint, M.C.; Tarolli, P.; et al. Disentangling climatic and anthropogenic contributions to nonlinear dynamics of alpine grassland productivity on the Qinghai-Tibetan Plateau. J. Environ. Manag. 2021, 281, 111875. [Google Scholar] [CrossRef] [PubMed]
- Liu, N.; Ding, Y.; Peng, S. Temporal effects of climate on vegetation trigger the response biases of vegetation to human activities. Glob. Ecol. Conserv. 2021, 31, e01822. [Google Scholar] [CrossRef]
- Wang, S.; Fu, B.; Zhao, W.; Liu, Y.; Wei, F. Structure, function, and dynamic mechanisms of coupled human–natural systems. Curr. Opin. Environ. Sustain. 2018, 33, 87–91. [Google Scholar] [CrossRef]
- Cui, L.; Wang, L.; Singh, R.P.; Lai, Z.; Jiang, L.; Yao, R. Association analysis between spatiotemporal variation of vegetation greenness and precipitation/temperature in the Yangtze River Basin (China). Environ. Sci. Pollut. Res. 2018, 25, 21867–21878. [Google Scholar] [CrossRef]
- Berdimbetov, T.; Ilyas, S.; Ma, Z.; Bilal, M.; Nietullaeva, S. Climatic Change and Human Activities Link to Vegetation Dynamics in the Aral Sea Basin Using NDVI. Earth Syst. Environ. 2021, 5, 303–318. [Google Scholar] [CrossRef]
- Tian, M.; Zhou, J.; Jia, B.; Lou, S.; Wu, H. Impact of Three Gorges Reservoir Water Impoundment on Vegetation–Climate Response Relationship. Remote Sens. 2020, 12, 2860. [Google Scholar] [CrossRef]
- Chen, S.; Wen, Z.; Ma, M.; Wu, S. Disentangling Climatic Factors and Human Activities in Governing the Old and New Forest Productivity. Remote Sens. 2021, 13, 3746. [Google Scholar] [CrossRef]
- Liu, J.; Zhu, W.; Atzberger, C.; Zhao, A.; Pan, Y.; Huang, X. A phenology-based method to map cropping patterns under a wheat-maize rotation using remotely sensed time-series data. Remote Sens. 2018, 10, 1203. [Google Scholar] [CrossRef]
- Xia, J.; Yan, Z. Changes in the local growing season in eastern China during 1909–2012. Sola 2014, 10, 163–166. [Google Scholar] [CrossRef][Green Version]
- Olea, R.A. Geostatistics for Engineers and Earth Scientists; Kluwer Academic: Philip Drive Norwell, MA, USA, 1999; ISBN 978-1-4615-5001-3. [Google Scholar]
- Geerken, R.; Ilaiwi, M. Assessment of rangeland degradation and development of a strategy for rehabilitation. Remote Sens. Environ. 2004, 90, 490–504. [Google Scholar] [CrossRef]
- Burrell, A.L.; Evans, J.P.; Liu, Y. Detecting dryland degradation using time series segmentation and residual trend analysis (TSS-RESTREND). Remote Sens. Environ. 2017, 197, 43–57. [Google Scholar] [CrossRef]
- Li, H.X.; Liu, G.H.; Fu, B.J. Response of vegetation to climate change and human activity based on NDVI in the Three-River Headwaters region. Acta Ecol. Sin. 2011, 31, 5495–5504. [Google Scholar]
- Wessels, K.J.; Prince, S.D.; Malherbe, J.; Small, J.; Frost, P.E.; VanZyl, D. Can human-induced land degradation be distinguished from the effects of rainfall variability? A case study in South Africa. J. Arid. Environ. 2007, 68, 271–297. [Google Scholar] [CrossRef]
- De Jong, R.; de Bruin, S.; de Wit, A.; Schaepman, M.E.; Dent, D.L. Analysis of monotonic greening and browning trends from global NDVI time-series. Remote Sens. Environ. 2011, 115, 692–702. [Google Scholar] [CrossRef]
- Wania, R.; Ross, I.; Prentice, I.C. Integrating peatlands and permafrost into a dynamic global vegetation model: 1. Evaluation and sensitivity of physical land surface processes. Glob. Biogeochem. Cycles 2009, 23. [Google Scholar] [CrossRef]
- Liu, Z.; Liu, Y.; Li, Y. Anthropogenic contributions dominate trends of vegetation cover change over the farming-pastoral ecotone of northern China. Ecol. Indic. 2018, 95, 370–378. [Google Scholar] [CrossRef]
- Ge, W.; Deng, L.; Wang, F.; Han, J. Quantifying the contributions of human activities and climate change to vegetation net primary productivity dynamics in China from 2001 to 2016. Sci. Total Environ. 2021, 773, 145648. [Google Scholar] [CrossRef]
- Sun, Y.; Yang, Y.; Zhang, L.; Wang, Z. The relative roles of climate variations and human activities in vegetation change in North China. Phys. Chem. Earth Parts A B C 2015, 87, 67–78. [Google Scholar] [CrossRef]
- Gao, W.; Zheng, C.; Liu, X.; Lu, Y.; Chen, Y.; Wei, Y.; Ma, Y. NDVI-based vegetation dynamics and their responses to climate change and human activities from 1982 to 2020: A case study in the Mu Us Sandy Land, China. Ecological Indicators. 2022, 137, 108745. [Google Scholar] [CrossRef]
- Yang, X.; Xu, B.; Jin, Y.; Qin, Z.; Ma, H.; Li, J.; Zhao, F.; Chen, S.; Zhu, X. Remote sensing monitoring of grassland vegetation growth in the Beijing–Tianjin sandstorm source project area from 2000 to 2010. Ecol. Indic. 2015, 51, 244–251. [Google Scholar] [CrossRef]
- Feng, X.; Fu, B.; Piao, S.; Wang, S.; Ciais, P.; Zeng, Z.; Lü, Y.; Zeng, Y.; Li, Y.; Jiang, X.; et al. Revegetation in China’s Loess Plateau is approaching sustainable water resource limits. Nat. Clim. Chang. 2016, 6, 1019–1022. [Google Scholar] [CrossRef]
- Zhu, Z.; Piao, S.; Myneni, R.B.; Huang, M.; Zeng, Z.; Canadell, J.G.; Ciais, P.; Sitch, S.; Friedlingstein, P.; Arneth, A.; et al. Greening of the Earth and its drivers. Nat. Clim. Chang. 2016, 6, 791–795. [Google Scholar] [CrossRef]
- Zeng, Z.; Piao, S.; Li, L.Z.X.; Zhou, L.; Ciais, P.; Wang, T.; Li, Y.; Lian, X.; Wood, E.F.; Friedlingstein, P.; et al. Climate mitigation from vegetation biophysical feedbacks during the past three decades. Nat. Clim. Chang. 2017, 7, 432–436. [Google Scholar] [CrossRef]
- Luo, Y.; Wan, S.; Hui, D.; Wallace, L.L. Acclimatization of soil respiration to warming in a tall grass prairie. Nature 2001, 413, 622–625. [Google Scholar] [CrossRef]
- Liu, Y.; Li, Y.; Li, S.; Motesharrei, S. Spatial and temporal patterns of global NDVI trends: Correlations with climate and human factors. Remote Sens. 2015, 7, 13233–13250. [Google Scholar] [CrossRef]
- Yu, D.; Liu, Y.; Shi, P.; Wu, J. Projecting impacts of climate change on global terrestrial ecoregions. Ecol. Indic. 2019, 103, 114–123. [Google Scholar] [CrossRef]
- Almeida, C.R.d.; Teodoro, A.C.; Gonçalves, A. Study of the Urban Heat Island (UHI) Using Remote Sensing Data/Techniques: A Systematic Review. Environments 2021, 8, 105. [Google Scholar] [CrossRef]
- Kotharkar, R.; Ramesh, A.; Bagade, A. Urban heat island studies in South Asia: A critical review. Urban Clim. 2018, 24, 1011–1026. [Google Scholar] [CrossRef]
- Chen, Y.; Huang, B.; Zeng, H. How does urbanization affect vegetation productivity in the coastal cities of eastern China? Sci. Total Environ. 2022, 811, 152356. [Google Scholar] [CrossRef]
- Wu, S.; Zhou, S.; Chen, D.; Wei, Z.; Dai, L.; Li, X. Determining the contributions of urbanisation and climate change to NPP variations over the last decade in the Yangtze River Delta, China. Sci. Total Environ. 2014, 472, 397–406. [Google Scholar] [CrossRef]
- Zhang, L.; Sun, P.; Huettmann, F.; Liu, S. Where should China practice forestry in a warming world? Glob. Change Biol. 2022, 28, 2461–2475. [Google Scholar] [CrossRef] [PubMed]
- Guan, X.; Shen, H.; Li, X.; Gan, W.; Zhang, L. A long-term and comprehensive assessment of the urbanization-induced impacts on vegetation net primary productivity. Sci. Total Environ. 2019, 669, 342–352. [Google Scholar] [CrossRef] [PubMed]
- Guo, J.; Gong, P.; Dronova, I.; Zhu, Z. Forest cover change in China from 2000 to 2016. Int. J. Remote Sens. 2022, 43, 593–606. [Google Scholar] [CrossRef]
- Chen, C.; Park, T.; Wang, X.; Piao, S.; Xu, B.; Chaturvedi, R.K.; Fuchs, R.; Brovkin, V.; Ciais, P.; Fensholt, R.; et al. China and India lead in greening of the world through land-use management. Nat. Sustain. 2019, 2, 122–129. [Google Scholar] [CrossRef]
- Hou, X.Y.; Wu, T.; Hou, W.; Chen, Q.; Wang, Y.D.; Yu, L.J. Characteristics of coastline changes in mainland China since the early 1940s. Sci. China Earth Sci. 2016, 59, 1791–1802. [Google Scholar] [CrossRef]
- Gao, Z.; Liu, X.; Ning, J.; Lu, Q. Analysis on changes in coastline and reclamation area and its causes based on 30-year satellite data in China. Trans. Chin. Soc. Agric. Eng. Trans. CSAE 2014, 30, 140–147. [Google Scholar]
- Zhu, G.; Xu, X. Research review on environmental effects of land reclamation from sea. Ecol. Environ. Sci. 2011, 20, 761–766. [Google Scholar]
- Richardson, A.D.; Keenan, T.F.; Migliavacca, M.; Ryu, Y.; Sonnentag, O.; Toomey, M. Climate change, phenology, and phenological control of vegetation feedbacks to the climate system. Agric. For. Meteorol. 2013, 169, 156–173. [Google Scholar] [CrossRef]
- Scheiter, S.; Higgins, S.I. Impacts of climate change on the vegetation of Africa: An adaptive dynamic vegetation modelling approach. Glob. Change Biol. 2009, 15, 2224–2246. [Google Scholar] [CrossRef]
- Mohanty, L.; Maiti, S. Probability of glacial lake outburst flooding in the Himalaya. Resour. Environ. Sustain. 2021, 5, 100031. [Google Scholar] [CrossRef]
- Mohanty, L.K.; Maiti, S. Regional morphodynamics of supraglacial lakes in the Everest Himalaya. Sci. Total Environ. 2021, 751, 141586. [Google Scholar] [CrossRef] [PubMed]
- Diffenbaugh, N.S.; Sloan, L.C.; Snyder, M.A.; Bell, J.L.; Kaplan, J.; Shafer, S.L.; Bartlein, P.J. Vegetation sensitivity to global anthropogenic carbon dioxide emissions in a topographically complex region. Glob. Biogeochem. Cycles 2003, 17. [Google Scholar] [CrossRef]
- Wang, S.; Zhang, Y.; Ju, W.; Chen, J.M.; Ciais, P.; Cescatti, A.; Sardans, J.; Janssens, I.A.; Wu, M.; Berry, J.A.; et al. Recent global decline of CO2 fertilization effects on vegetation photosynthesis. Science 2020, 370, 1295–1300. [Google Scholar] [CrossRef] [PubMed]
- Heijmans, M.M.; Berendse, F.; Arp, W.J.; Masselink, A.K.; Klees, H.; De Visser, W.; Van Breemen, N. Effects of elevated carbon dioxide and increased nitrogen deposition on bog vegetation in the Netherlands. J. Ecol. 2001, 89, 268–279. [Google Scholar] [CrossRef]
- Dirnböck, T.; Grandin, U.; Bernhardt-Römermann, M.; Beudert, B.; Canullo, R.; Forsius, M.; Grabner, M.; Holmberg, M.; Kleemola, S.; Lundin, L.; et al. Forest floor vegetation response to nitrogen deposition in Europe. Glob. Change Biol. 2014, 20, 429–440. [Google Scholar] [CrossRef] [PubMed]
- Filatova, T.; Verburg, P.H.; Parker, D.C.; Stannard, C.A. Spatial agent-based models for socio-ecological systems: Challenges and prospects. Environ. Model. Softw. 2013, 45, 1–7. [Google Scholar] [CrossRef]
- Liu, X.; Liang, X.; Li, X.; Xu, X.; Ou, J.; Chen, Y.; Li, S.; Wang, S.; Pei, F. A future land use simulation model (FLUS) for simulating multiple land use scenarios by coupling human and natural effects. Landsc. Urban Plan. 2017, 168, 94–116. [Google Scholar] [CrossRef]
- Jiang, L.; Bao, A.; Guo, H.; Ndayisaba, F. Vegetation dynamics and responses to climate change and human activities in Central Asia. Sci. Total Environ. 2017, 599, 967–980. [Google Scholar] [CrossRef]
- Lü, Y.; Zhang, L.; Feng, X.; Zeng, Y.; Fu, B.; Yao, X.; Li, J.; Wu, B. Recent ecological transitions in China: Greening, browning, and influential factors. Sci Rep. 2015, 5, 8732. [Google Scholar] [CrossRef]
- Song, S.; Liu, Z.; He, C.; Lu, W. Evaluating the effects of urban expansion on natural habitat quality by coupling localized shared socioeconomic pathways and the land use scenario dynamics-urban model. Ecol. Indic. 2020, 112, 106071. [Google Scholar] [CrossRef]
- Dewan, A.M.; Yamaguchi, Y. Land use and land cover change in Greater Dhaka, Bangladesh: Using remote sensing to promote sustainable urbanization. Appl. Geogr. 2009, 29, 390–401. [Google Scholar] [CrossRef]
- He, Q.; Bertness, M.D.; Bruno, J.F.; Li, B.; Chen, G.; Coverdale, T.; Altieri, A.H.; Bai, J.; Sun, T.; Pennings, S.C.; et al. Economic development and coastal ecosystem change in China. Sci. Rep. 2014, 4, 5995. [Google Scholar] [CrossRef] [PubMed]
- Wolch, J.R.; Byrne, J.; Newell, J.P. Urban green space, public health, and environmental justice: The challenge of making cities ‘just green enough’. Landsc. Urban Plan. 2014, 125, 234–244. [Google Scholar] [CrossRef]
- Kennedy, J.; Blunden, J.; Alvar-Beltrán, J.; Kappelle, M. State of the Global Climate 2020. Available online: https://library.wmo.int/index.php?lvl=notice_display&id=21880 (accessed on 1 May 2021).
- Feng, Q.; Xia, C.; Yuan, W.; Chen, L.; Wang, Y.; Cao, S. Targeted control measures for improving the environment in a semiarid region of China. J. Clean. Prod. 2019, 206, 477–482. [Google Scholar] [CrossRef]
Publisher’s Note: MDPI stays neutral with regard to jurisdictional claims in published maps and institutional affiliations. |
© 2022 by the authors. Licensee MDPI, Basel, Switzerland. This article is an open access article distributed under the terms and conditions of the Creative Commons Attribution (CC BY) license (https://creativecommons.org/licenses/by/4.0/).