Abstract
The impacts of climate change on ecosystem productivity and water resources over a long term in China are not well quantified. Precipitation-use efficiency (PUE) is a key parameter that describes carbon and water exchange in terrestrial ecosystems. Research on the response of regional PUE to climate change and its driving forces is of great significance to climate-change mitigation and the sustainable development of regional ecology. Based on an improved actual evapotranspiration (ETa) model, the responses of ETa, net primary productivity (NPP), and PUE to climate change in different climatic regions of China were analyzed; the contributions of various environmental factors to PUE changes were quantified; and the conversion characteristics and regulatory mechanisms of the PUE regime in different climatic regions were identified. The results indicate that the improved ETa model, after considering the limiting effect of energy on ETa in humid regions, can simulate the ETa distribution in China well. Over the past 58 years (1960–2017), ETa and NPP have increased in the western regions and decreased in the eastern regions, with the boundary at 103° E. PUE presents a “low-high-low” spatial distribution from northwest to southeast in China. It is noteworthy that there was a zonal distribution for a high value area of PUE, which coincided with the summer monsoon transition zone. The soil moisture (SM) increase in arid regions is the main driving force of the PUE increase, whereas the annual net radiation (Rn) change in humid regions is the main driving force of the PUE change. The transition zone is the conversion zone, where the prevailing factor limiting vegetation growth transitions from water to energy.
1. Introduction
Global warming and the increase of extreme weather events are having a serious impact on the structure, function, and processes of global ecosystems [1], and have become a focal issue of common concern to governments, the public, and the scientific community. In IPCC AR6 [2], it is reported that the frequency and intensity of some extreme weather and climate events will continue to increase under medium and high emission scenarios, and the increased extreme events (e.g., droughts, heat waves, and heavy rainfall) will affect 25−40% of global ecosystem structure and function.
The terrestrial ecosystem carbon cycle is a key process driving ecosystem change, and changes in the ecosystem carbon cycle are sensitive to climate change. China is one of the most sensitive and vulnerable regions to climate change. Climate change decreased the capacity of carbon storage [3], and extreme climate events such as drought, extreme heat, and extreme precipitation all have serious impacts on the carbon cycle of terrestrial ecosystems. Droughts have weakened vegetation growth [4], and prolonged and persistent droughts have reduced carbon accumulation, causing grassland ecosystems in Inner Mongolia to change from a carbon sink to a carbon source in a typical year [5]. Heat waves and droughts significantly reduced regional GPPs and crop yields in summer 2013 [6]. The ice storm in early 2008 also resulted in a decrease in annual evapotranspiration and GPP in southeastern China [7].
Precipitation-use efficiency (PUE) describes the response of net primary productivity (NPP) to the temporal and spatial distribution of precipitation. PUE is a comprehensive physiological and ecological index for evaluating the appropriate degree of vegetation growth while reflecting the carbon and water cycles and the carbon–water relationship in the ecosystem [8]. Research on the characteristics of PUE and its control mechanism can help evaluate and predict the impact of global changes on the carbon–water cycle of ecosystems and provide a theoretical basis for regional plant protection and restoration. PUE distribution and changes are affected by several factors, such as topography, soil conditions, climate change, and human activities. Climate change is the most important and active factor [9,10]. Earlier studies addressed the response of the spatiotemporal PUE pattern to climate change but did not reach a consistent conclusion due to different temporal and spatial scales. Some studies concluded that the PUE spatially decreases with increasing drought and potential evapotranspiration and increases with increasing precipitation [11]. However, other studies concluded that the PUE spatially decreases with increasing precipitation [12,13]. It has also been demonstrated that there is no obvious relationship between the spatial PUE distribution and precipitation [14]. In addition, some studies have reported that the PUE exhibits a unimodal distribution that first increases and then decreases with increasing precipitation and reaches its peak at a specific precipitation value [13,15,16]. The feedback mechanisms between the water-carbon cycle of ecosystems and climate are relatively complex, and the response of NPP and PUE to climate change has a large spatial and temporal heterogeneity. China’s vast land area, complex topography, diverse climate and vegetation types, and high spatial and temporal variability in precipitation and ecosystem carbon fluxes hinder the accurate assessment of carbon fluxes [17,18,19,20]. Earlier studies focused mostly on small local areas with precipitation or temperature limits or specific vegetation types [11,16,21,22], and little attention has been paid to variations in PUE along a climatic gradient. At the same time, prior studies mostly focused on the effects of single climate factors on PUE, lacking a comprehensive understanding of the specific contributions of each climate factor and regional differences [16,20,21], which cannot fully reveal the difference and transformation characteristics of PUE with climate and vegetation-gradient distribution, thereby limiting the in-depth understanding of PUE characteristics and driving forces in different regions.
NPP is a key for calculating the PUE. There are several methods for obtaining the NPP. In situ measurements have high data accuracy but are limited by the amount of data and are time-consuming and labor-intensive. Thus, they can only be used during surveys of small areas. Model estimation is an effective means of obtaining NPP on a regional or global scale. NPP estimation models can be roughly divided into three categories: ecophysiological process models, light-use efficiency models, and climate statistical models [23]. Ecophysiological process models simulate NPP based on the ecophysiological characteristics and growth mechanisms of plants [24]. Representative models include the Biome-BGC, CEVSA, and BEPS models. This type of model has strong mechanisms and is systematic. However, they are complex, and the required parameters are many and difficult to obtain. Light-use efficiency models use photosynthesis from vegetation and a resource balance view as the theoretical basis. They apply remote sensing data to drive ecological models for NPP simulation on regional or global scales and have been used worldwide. Representative models are the CASA and Glo-PEM models. Although this type of model has clear mechanisms and complete structures, the assignment and correction of model parameters are complicated, with large uncertainties. There are three main types of parameters based on the input of the light-use efficiency model: solar radiation data, maximum light-use efficiency, and environmental factors. The algorithms and required data for each parameter type are diverse. Different calculation methods have substantial differences in simulating vegetation NPP, especially in simulating environmental factors and maximum light use efficiency, because it is difficult to assign a large number of soil parameters to certain regions or special geomorphic types [25]. Additionally, these models are completely dependent on the availability and quality of remote sensing data [26]; in regions with strong spatial heterogeneity and complex terrain, the accuracy of the model is highly uncertain.
Climate statistical models estimate NPP based on the correlation between plant growth and environmental factors. Representative models include the Miami, Thornthwaite memorial, Chicago, and comprehensive models. Although these models lack a mechanism, they are simple, intuitive, and highly applicable. Hence, they constitute the easiest and most convenient method for estimating NPP. Since their development in the 1970s, they have been applied in vegetation NPP research worldwide [20], particularly in relation to large-scale research. Various land-atmosphere mutual observation experiments also provide the possibility for model calibration, thereby continuously improving the accuracy of these models.
In the context of global climate change, the characteristics and changes of China’s regional PUE are not yet fully understood, as well as the regional differences and driving forces of the PUE response to climate change. What are the spatial distribution characteristics of the carbon flux in mainland China? How do environmental factors relate to PUE? Does PUE spatial conversion occur with climate type? What is the possible mechanism of action? Therefore, our primary objectives were to: (1) improve the ETa calculation model by comprehensively considering the water and energy conditions in different regions; (2) analyze the characteristics of ETa, NPP, and PUE in different climate regions of China; (3) reveal the driving forces, transformation characteristics, and control mechanism of the PUE distribution.
2. Materials and Methods
2.1. Study Area
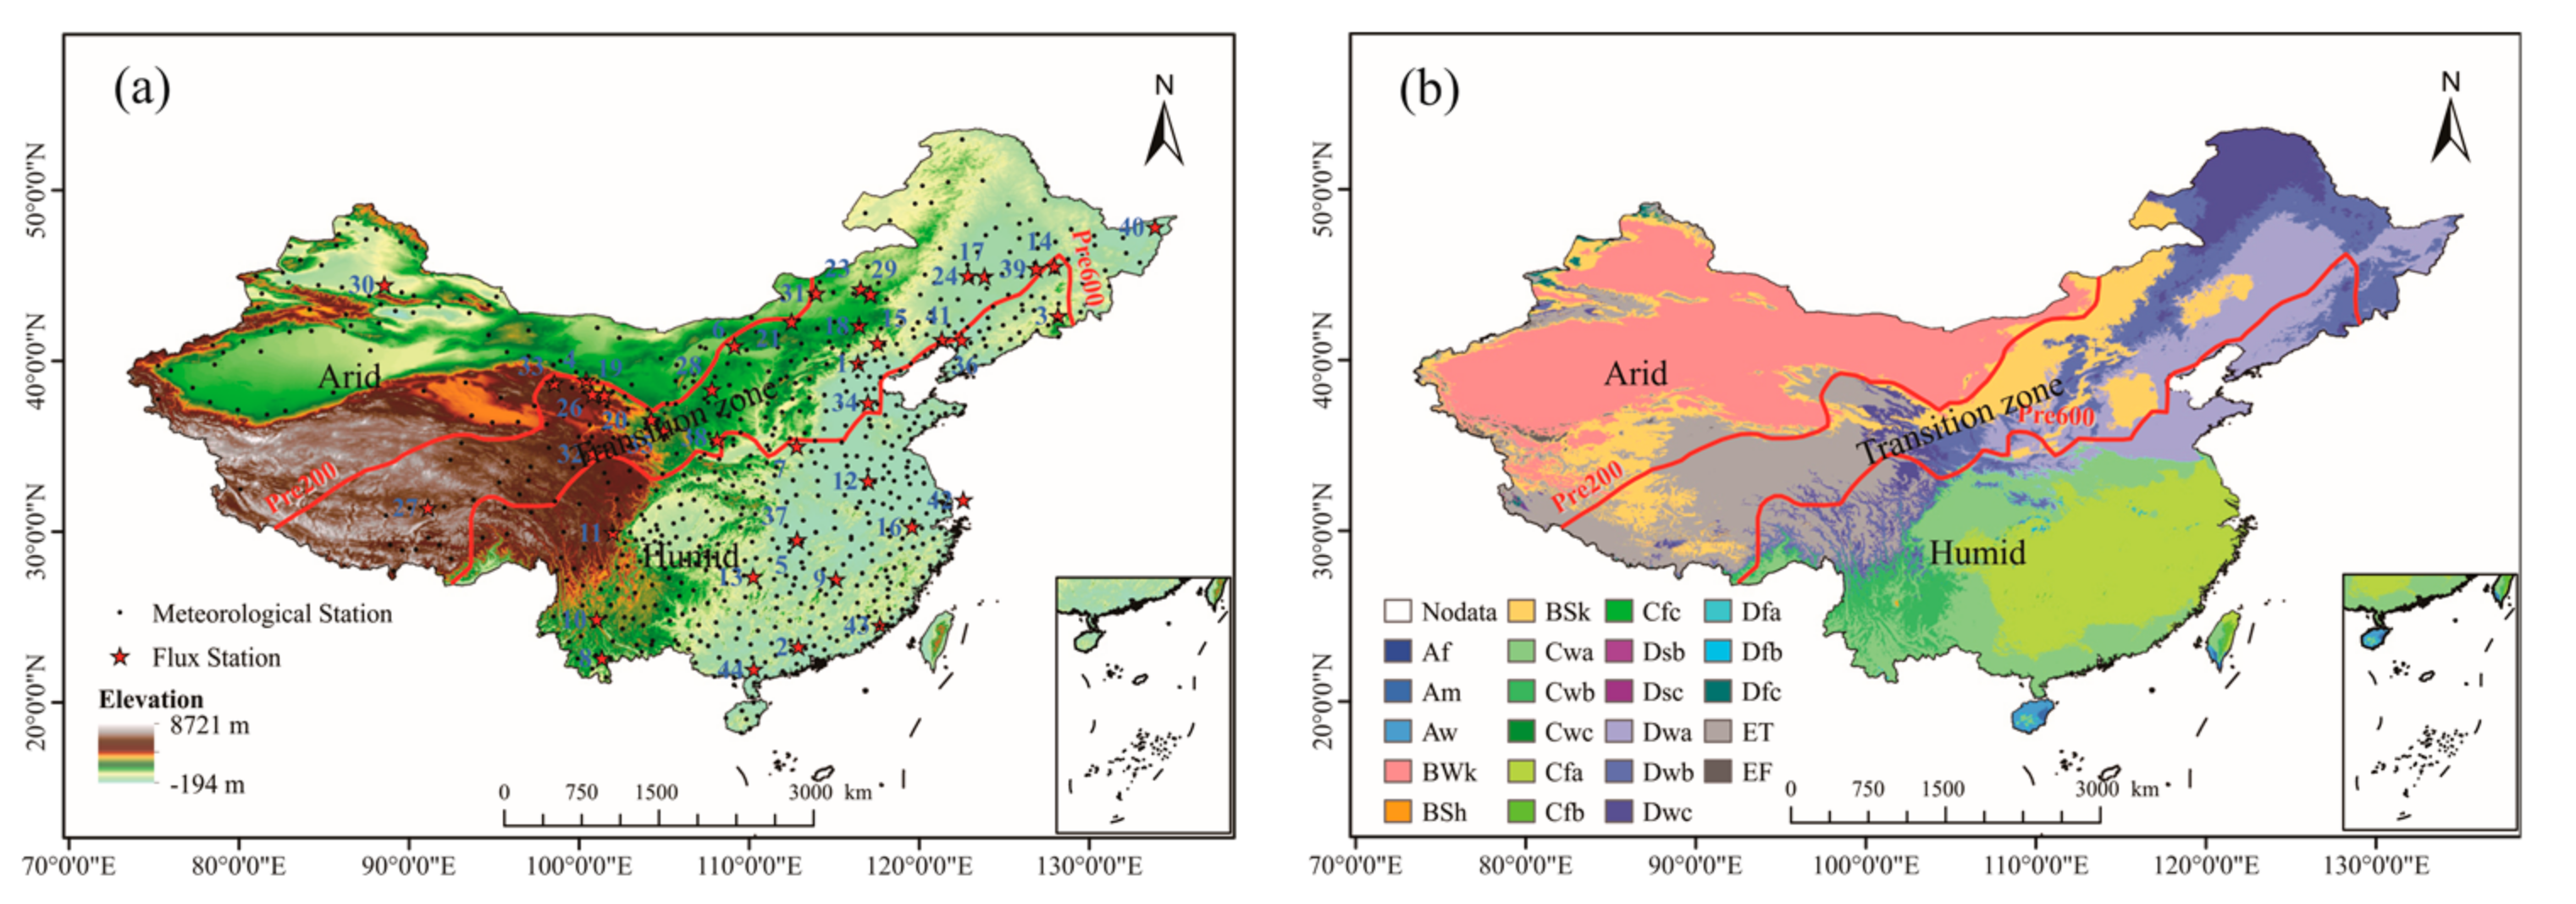
This study focused on mainland China. There are great climatic differences between east and west and south and north of China. Precipitation decreases from southeast to northwest, and climate transitions from humid to arid, presenting a basic pattern of humid in the east and south, but arid in the west and north, and there is a narrow zonal climate transition zone between humid and arid climate regions. We divided the study region into three sub-regions according to the distribution of average annual precipitation (P): the arid region (P < 200 mm), transition zone (600 > P ≥ 200 mm), and humid region (P ≥ 600 mm) [27]. The distribution of meteorological and flux stations and sub-regions is shown in Figure 1.
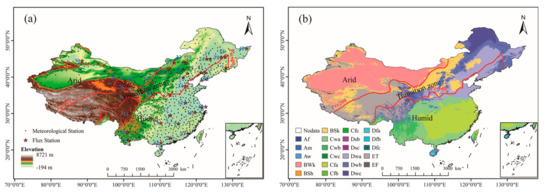
Figure 1.
Locations of 693 meteorological stations (black solid dots), 44 flux stations (red stars), and the three sub-regions (i.e., arid region, transition zone, and humid region) (a), and the Köppen-Geiger climatic zones (b).
2.2. Data
Daily meteorological data from 693 stations in China between 1960 and 2017 were used, including maximum, mean, and minimum temperatures (Tmax, Tmean, and Tmin, respectively); sunshine hours (H); wind velocity (U); relative humidity (Rh); and P. These data were obtained through the meteorological data sharing network of the China Meteorological Administration and were checked for homogenization and quality, including controls for time and space consistency, extreme values, and climate-limit or allowable values [28].
Observations from 44 flux stations were used to validate the ETa model. Nine of these stations are part of China FLUX (The Chinese Terrestrial Ecosystem Flux Research Network). Data from the remaining stations were obtained from published articles. These flux stations are widely distributed in space, including 16 forest, 17 grassland, 6 farmland, and 5 wetland stations, covering the main climatic regions and typical ecosystem types in China. Details on the data are given in Table 1.

Table 1.
Metadata for each flux station including station name, location, altitude, years of available data, and references.
Actual evapotranspiration data (unit: mm) and the 0–10 cm depth, monthly average soil water-content data (unit: kg·m−2) in GLDAS_Noah025_M 2.0 and 2.1 datasets were used, with 0.25 × 0.25° spatial resolution and a time range from January 1960 to December 2017. GLDAS data are global land-surface characteristics and flux data generated by advanced land–surface models and data assimilation technology [63].
The validation NPP data are the MOD17A3 surface vegetation NPP data provided by the EOS/MODIS (TERRA satellite) of NASA. MOD17A3 has been verified and widely applied in research regarding vegetation growth, biomass estimation, environmental monitoring, and global change in different regions of China and the world. In this study, we used NPP data with a 0.5 × 0.5 km resolution from 2000 to 2017. Data corresponding to the 693 meteorological stations were extracted using the neighboring grid method.
2.3. Methods
PUE was identified as the ratio of NPP to P [11]:
where NPP is the annual net primary productivity (unit: g·m−2) and P is the annual precipitation (unit: mm). NPP is obtained through the Thornthwaite memorial model [64]:
where ETa is the actual evapotranspiration. It can be obtained as Zhou and Zhang [65]. Although there are many methods to estimate ETa, such as the water balance method, surface energy balance method, remote sensing analysis method, etc., they all have limitations, such as complicated parameters and difficulty to determine [66,67]. Zhou and Zhang’s method fully reflects the limiting effect of energy and water on evapotranspiration, with its few parameters and clear physical significance making it high practicability. The method is as follows:
Here, P is the annual precipitation, and R is the annual net radiation correction factor, which can be obtained by Equation (4):
where ET0 is the potential evapotranspiration calculated using the FAO Penman-Monteith method. See Allen et al. [68] for details.
The sensitivity coefficient and the relative change were used to measure the contribution of environmental factors to the PUE change:
where ConX is the contribution of a factor to the PUE change, RCX is the relative change rate of the factor, TrendX and aveX are the change rate and average of the factor, respectively, and Sx is the sensitivity coefficient of the PUE with respect to environmental factor X. Sx can be obtained as McCuen [69]:
3. Results
3.1. ETa Estimation and Its Change Characteristics
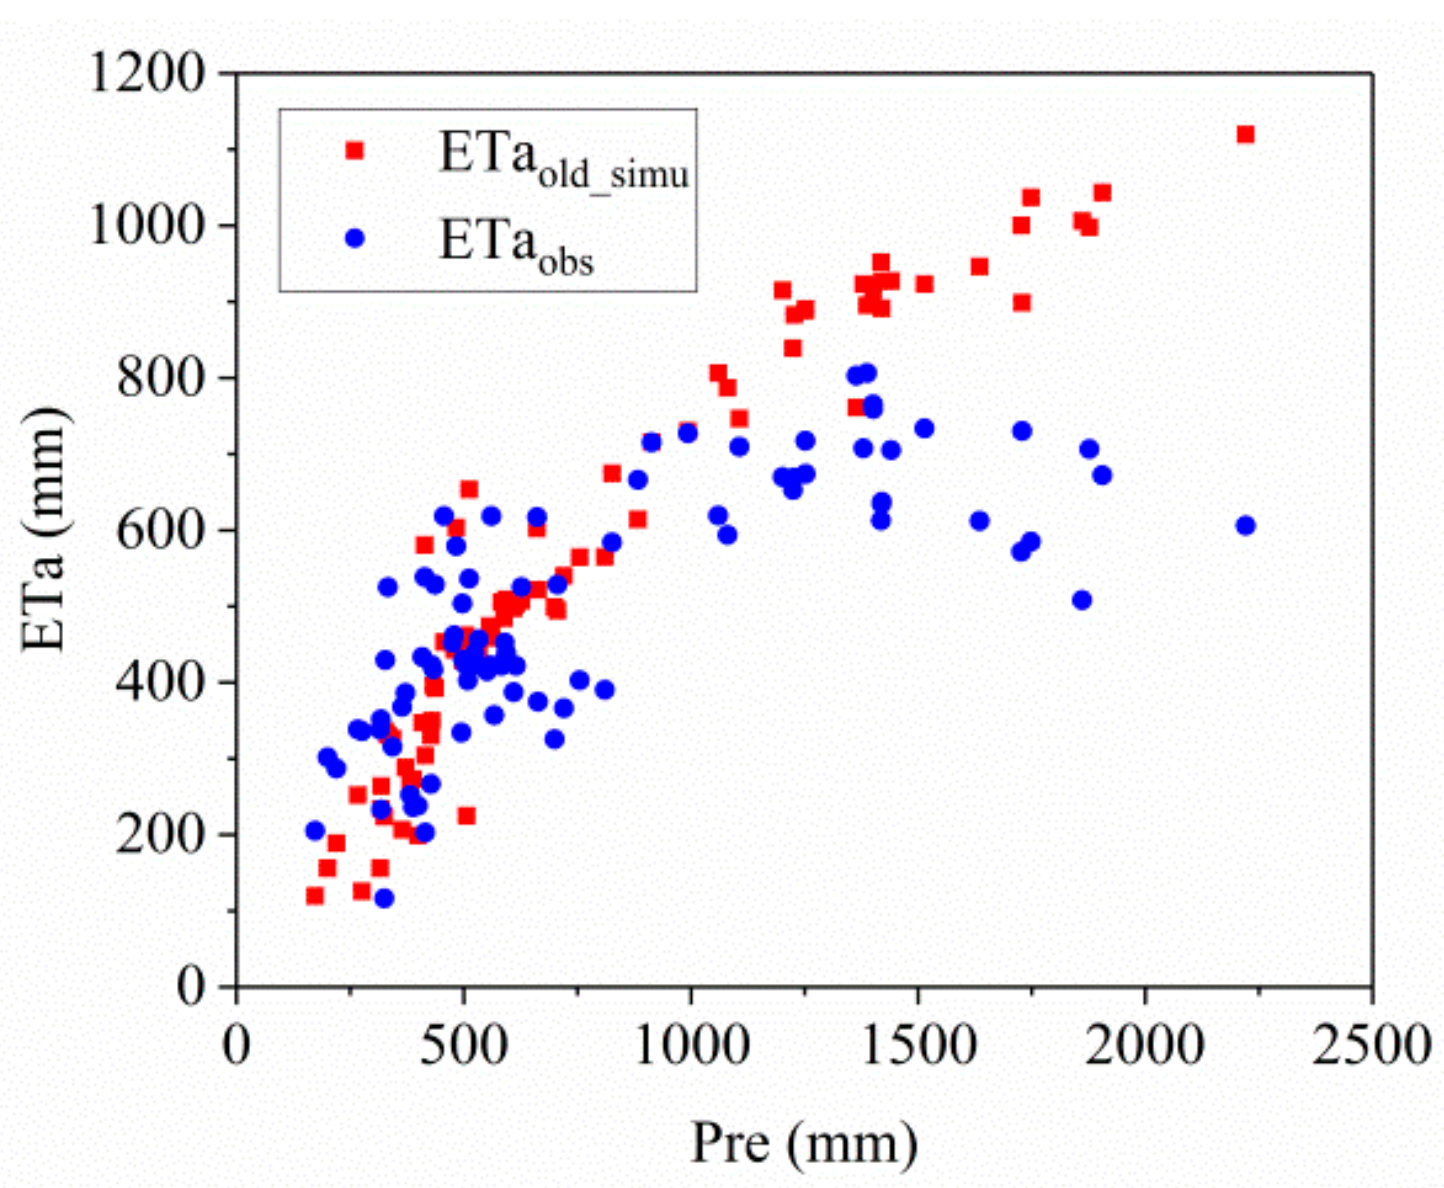
ETa was calculated using Equation (3). Compared with the observations from the flux stations (Figure 2), both the observed and estimated ETa were found to increase significantly with increased precipitation in the region where P < 600 mm. Furthermore, when P ≥ 600 mm, the observed ETa first increased and then decreased with increasing P, although the estimated ETa still increased significantly with increased P. Many factors affect ETa, the most important of which are water and energy conditions. In arid and semiarid regions, the amount of precipitation is relatively small, but the energy is sufficient. The main factor affecting ETa is water, and a change in P largely determines the change in ETa. In the semi humid region, increased P makes energy the controlling factor of ETa instead of water, and the rate at which ETa increases with P slows down. In humid areas with abundant rainfall, ETa no longer increased with increasing P. Due to more precipitation, energy conditions limit ETa, and higher P results in smaller ETa. Earlier studies confirmed the switch of the ETa controlling factor from water to energy with increased precipitation [70]. Equation (3) does not consider this switch when estimating the ETa in the humid region and does not reflect its energy constraint. Estimates are largely dependent on precipitation, which exaggerates the results. We further used P = 600 and P = 1400 mm as the boundaries and conducted regression corrections on the estimated ETa. The specific regression equation is given by Equation (8).
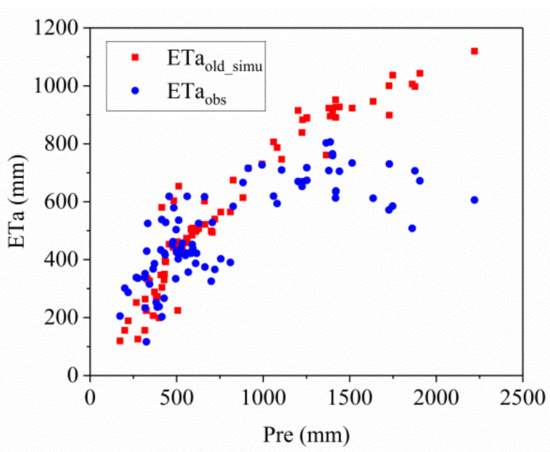
Figure 2.
Distribution of observed and estimated ETa with P.
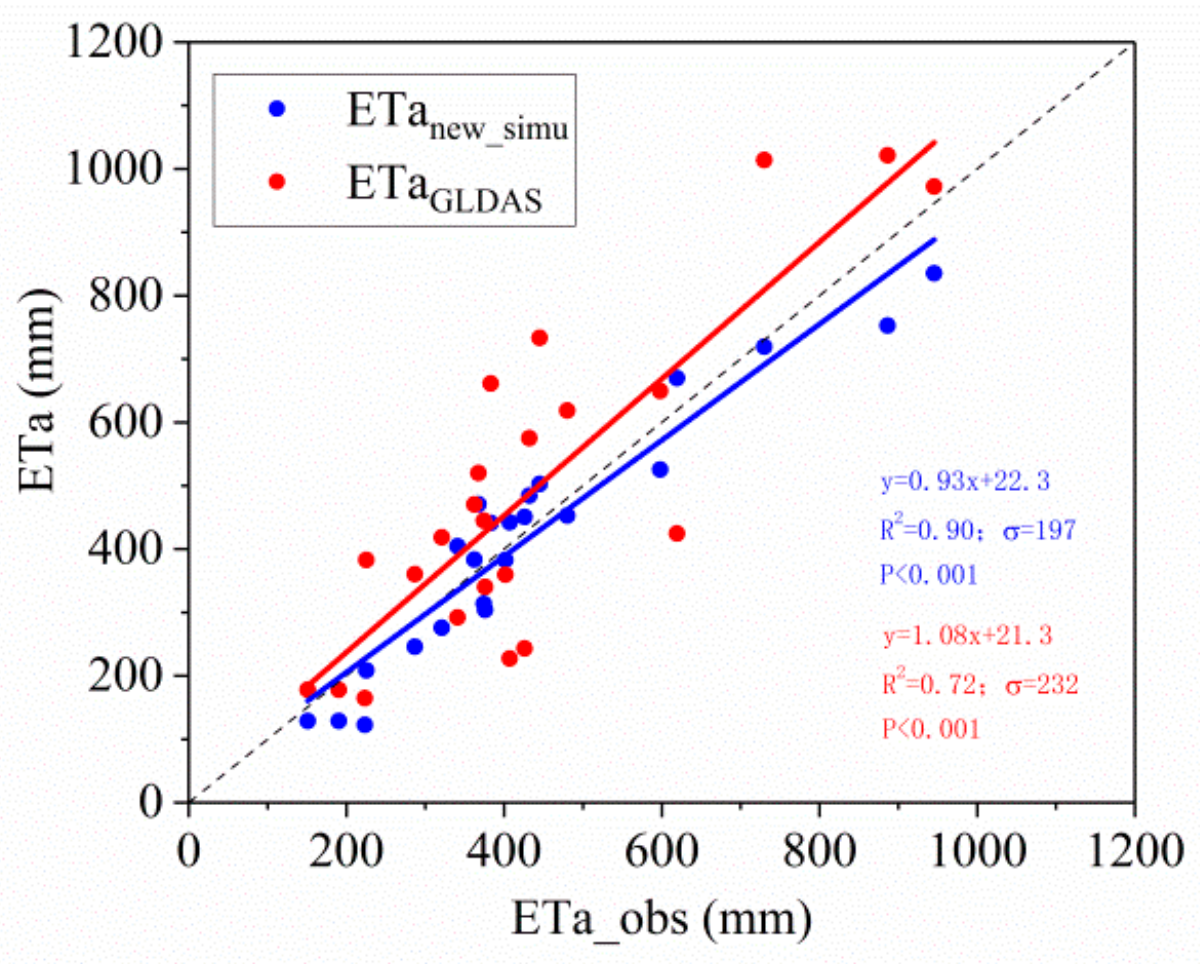
The improved ETa in the southern humid region is significantly smaller than the ETa before improvement (Figure 3). Regions with the highest ETa move north from the southeastern coastal area to the middle and lower reaches of the Yangtze River. To further verify the accuracy of the improved ETa model, we compared the estimated values with the ETa observations from the flux stations during the validation period and the ETa from GLDAS during the same period. This comparison showed that the improved ETa is highly consistent with the observed and GLDAS ETa (Figure 4). The correlation coefficients were 0.95 and 0.85, respectively, and the standard deviation between the estimated and observed values was much smaller than that between the GLDAS assimilation and observed values. GLDAS data are sparser in the high evapotranspiration regions, and the values are too large. Wang et al. [71] also identified an overestimation in the high ETa regions of southern China in the GLDAS data. Hence, our improved ETa model can simulate the ETa in the study region more accurately.

Figure 3.
ETa distribution (1981–2010 average) before (a) and after (b) improvement.
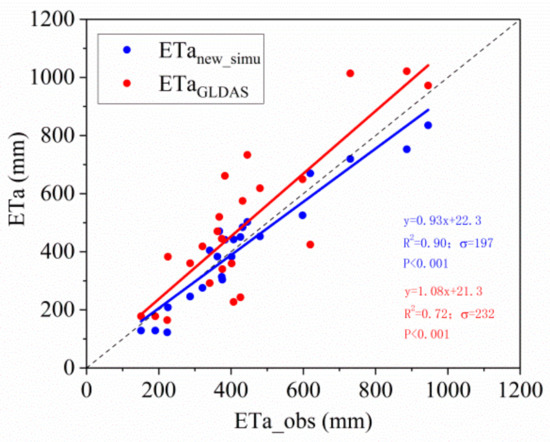
Figure 4.
Comparison of the improved ETa values (ETanew_simu) with the observed and GLDAS ETa values.
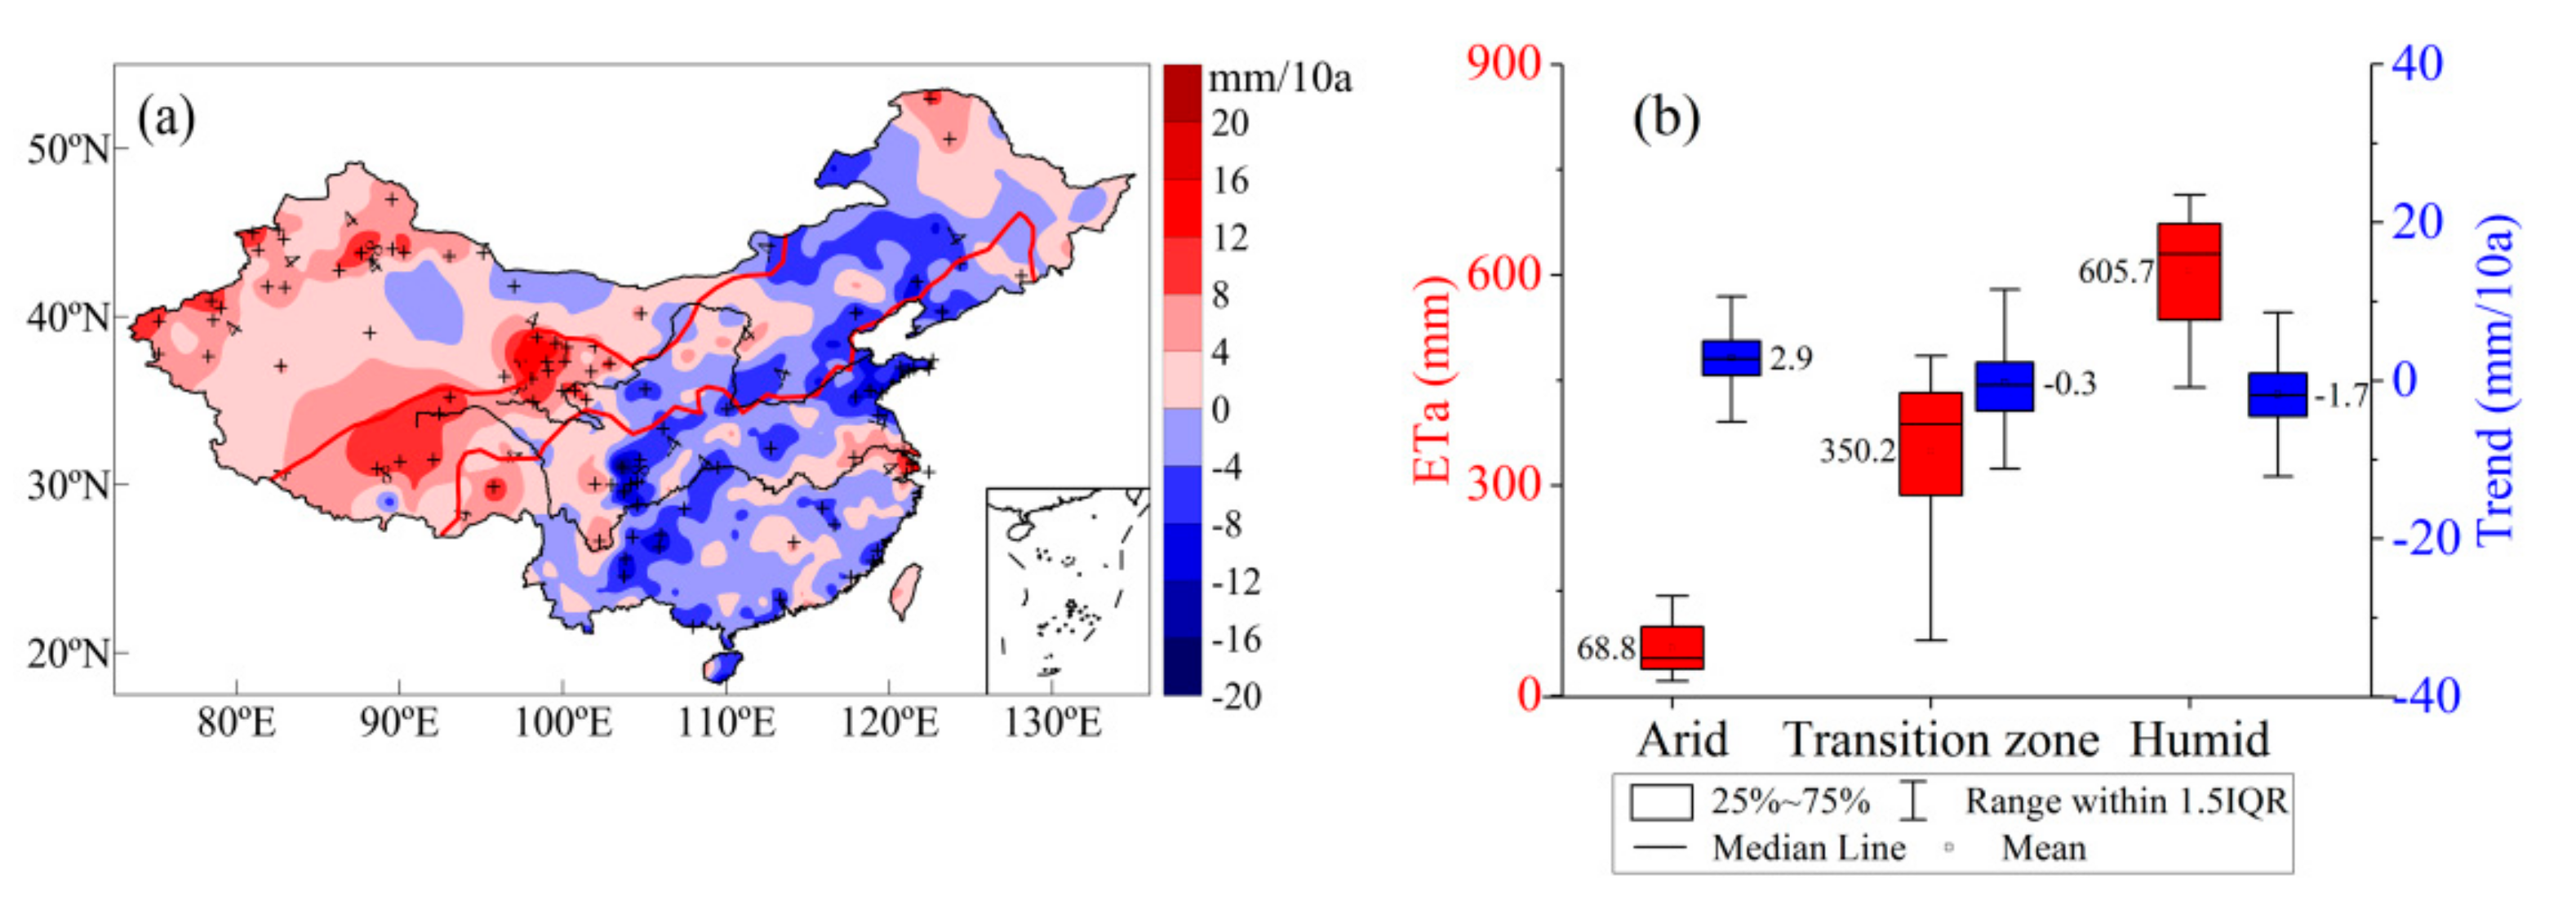
Over the past 58 years (1960–2017), the ETa trend was roughly bounded by 103° E, with ETa increasing to the west and decreasing to the east (Figure 5a). ETa in the arid region is the smallest, with an average of 68.8 mm and a fluctuation range of 21.3–142.7 mm. ETa in the transition zone is 350.2 mm with a 79.2–485.0 mm fluctuation range. The ETa fluctuation range in the humid region is between 439.8 and 745.6 mm, with an average of 602.5 mm. Over the past 58 years, ETa in the arid region increased at an average rate of 2.9 mm·10 a−1. The amount of water expenditure in the region increased, and this increase was significant in some areas. The ETa in the humid area decreased at a rate of −1.7 mm·10 a−1. Moreover, the ETa in the transition zone generally shows a slight overall decrease, and the regional differences are obvious (Figure 5b).
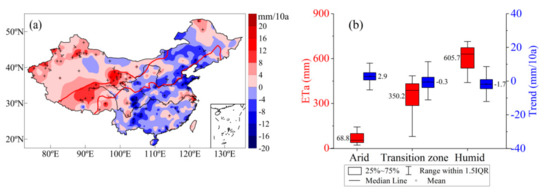
Figure 5.
ETa trend (1960–2017) and (a) distribution of average values and trends in sub regions and (b) +indicates that the trend was significant at the 0.05 level.
3.2. NPP Estimation and Change Characteristics
Figure 6 shows the estimated annual NPP before and after ETa improvement. As depicted, the NPP in China is small in the northwest and large in the southeast, which is consistent with previous study [72]. The NPP of the southern humid region obtained before the improvement of the ETa model was between 1400 and 1700 g·m−2·a−1. Precipitation is proportional to the NPP. In some regions of the southeast coast, the NPP is above 1700 g·m−2·a−1. The improved NPP range was 22–1510 g·m−2·a−1. The region of maximum NPP shifts northward and is located south of the Yangtze River. The annual average NPP was above 1400 g·m−2·a−1. In arid regions, water has a positive effect on vegetation productivity, which means that productivity increases with improved water conditions. However, in humid regions with sufficient water supply, NPP tends to be saturated and is no longer controlled by water [73]. In addition, this region is the cloudiest region in China [74], which is generally proportional to the light stress on vegetation growth. In coastal regions with abundant rainfall, vegetation growth is more likely to be regulated by radiation. Before the improvement, the ETa model did not consider the energy constraint in the south, the estimated NPP was overly dependent on precipitation, and the estimated values were too large. The improved NPP better reflects the response of vegetation growth to the regional climate.

Figure 6.
NPP distribution before (a) and after(b) improvement.
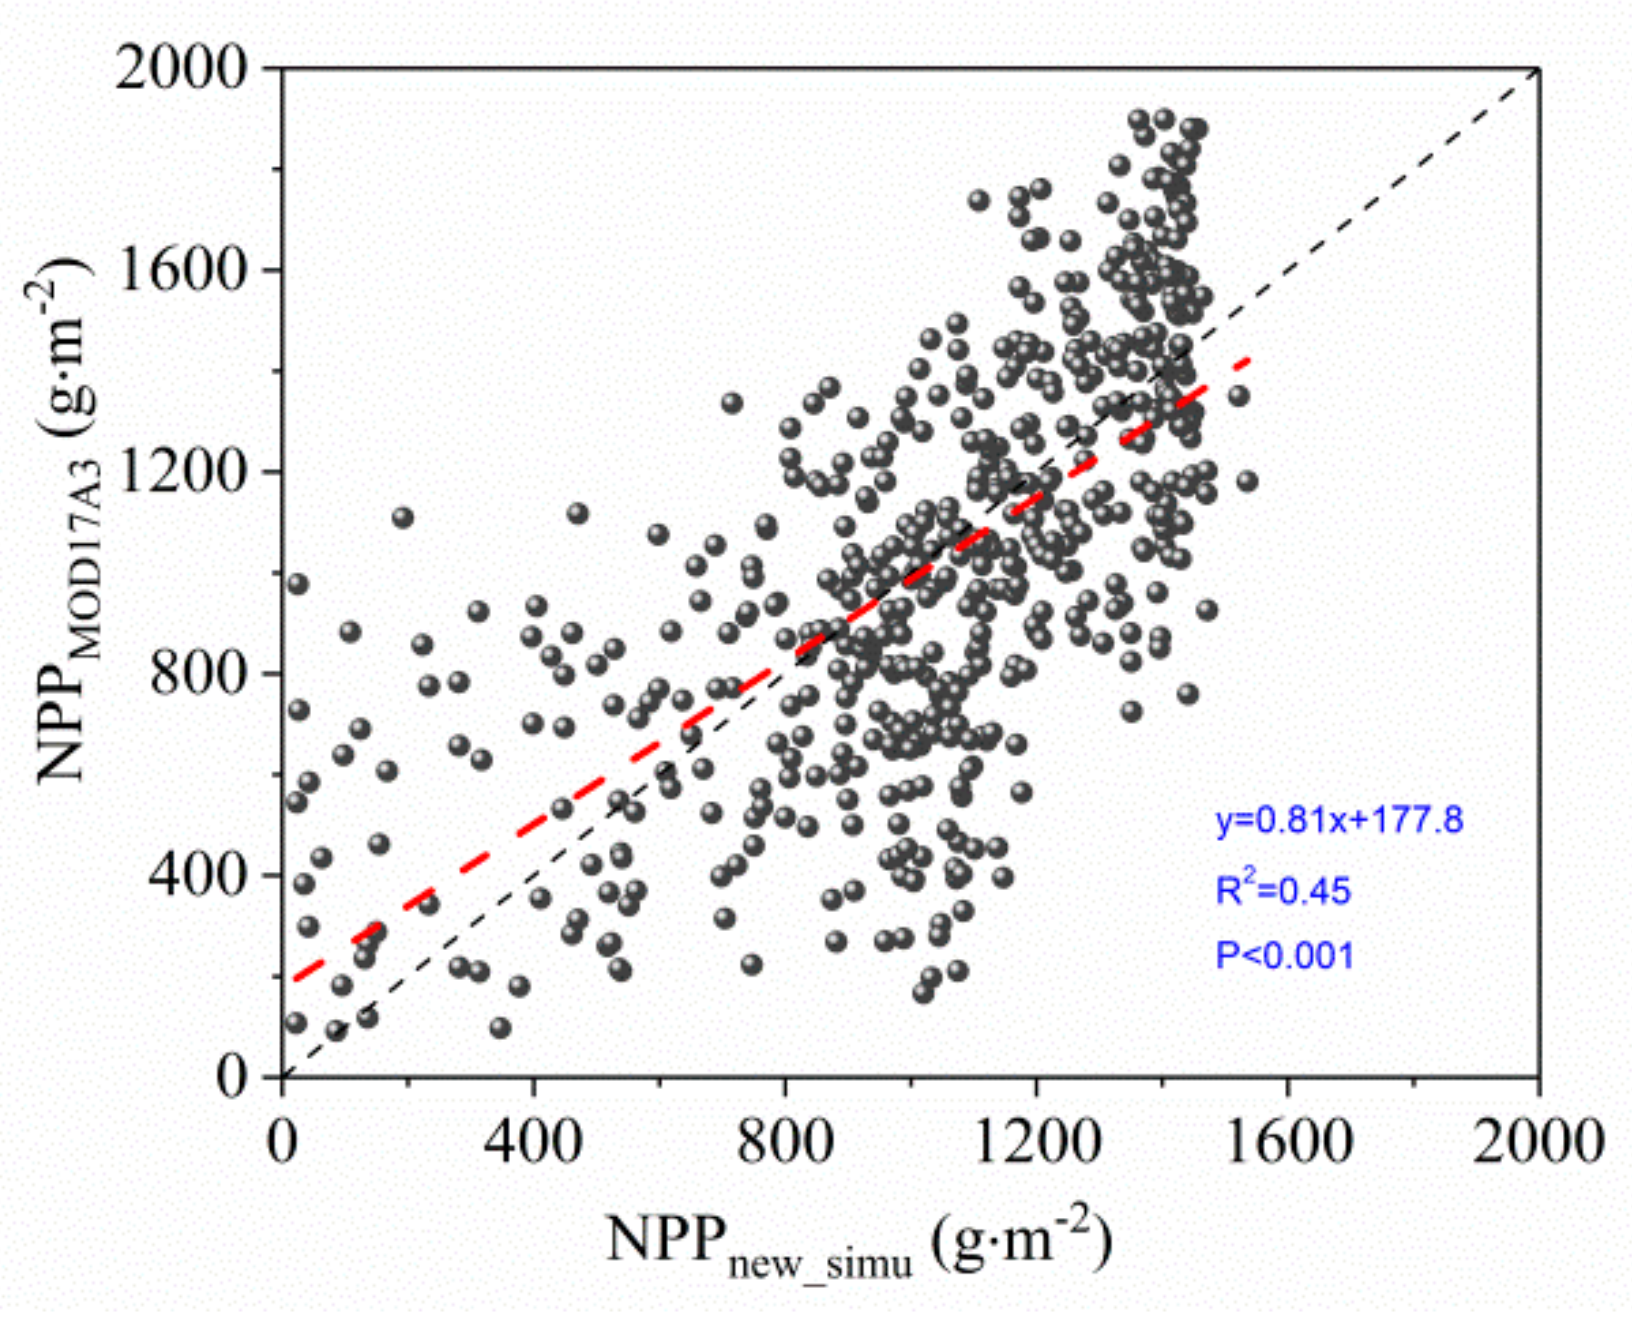
A comparison between the estimated NPP values (average values from 2000 to 2017) and the MOD17A3 multiyear average data shows that the estimated NPP after improvement is significantly correlated with the MOD17A3 NPP (R = 0.67, p < 0.001) (Figure 7). In the arid region, the MOD17A3 NPP was larger than the estimated NPP. However, in the humid region, the MOD17A3 NPP was relatively small. Due to estimation errors regarding reflectance, maximum light-use efficiency, and radiation, MODIS NPP products are overestimated in low-productivity regions and underestimated in high-productivity regions [75]. In addition, different methods and scale conversions can also lead to different comparisons. Therefore, the estimated NPP in this study has a certain rationality and superiority.
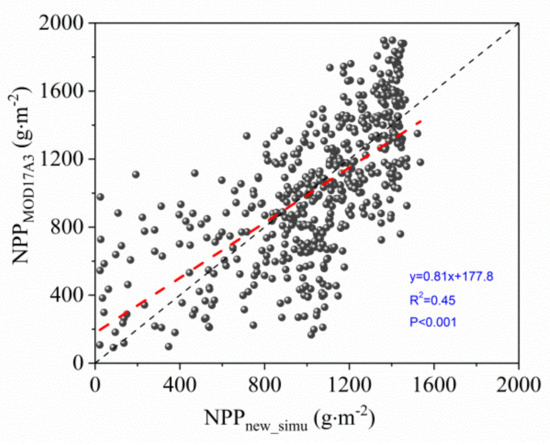
Figure 7.
Comparison of estimated NPP and MOD17A3 NPP (average values from 2000 to 2017).
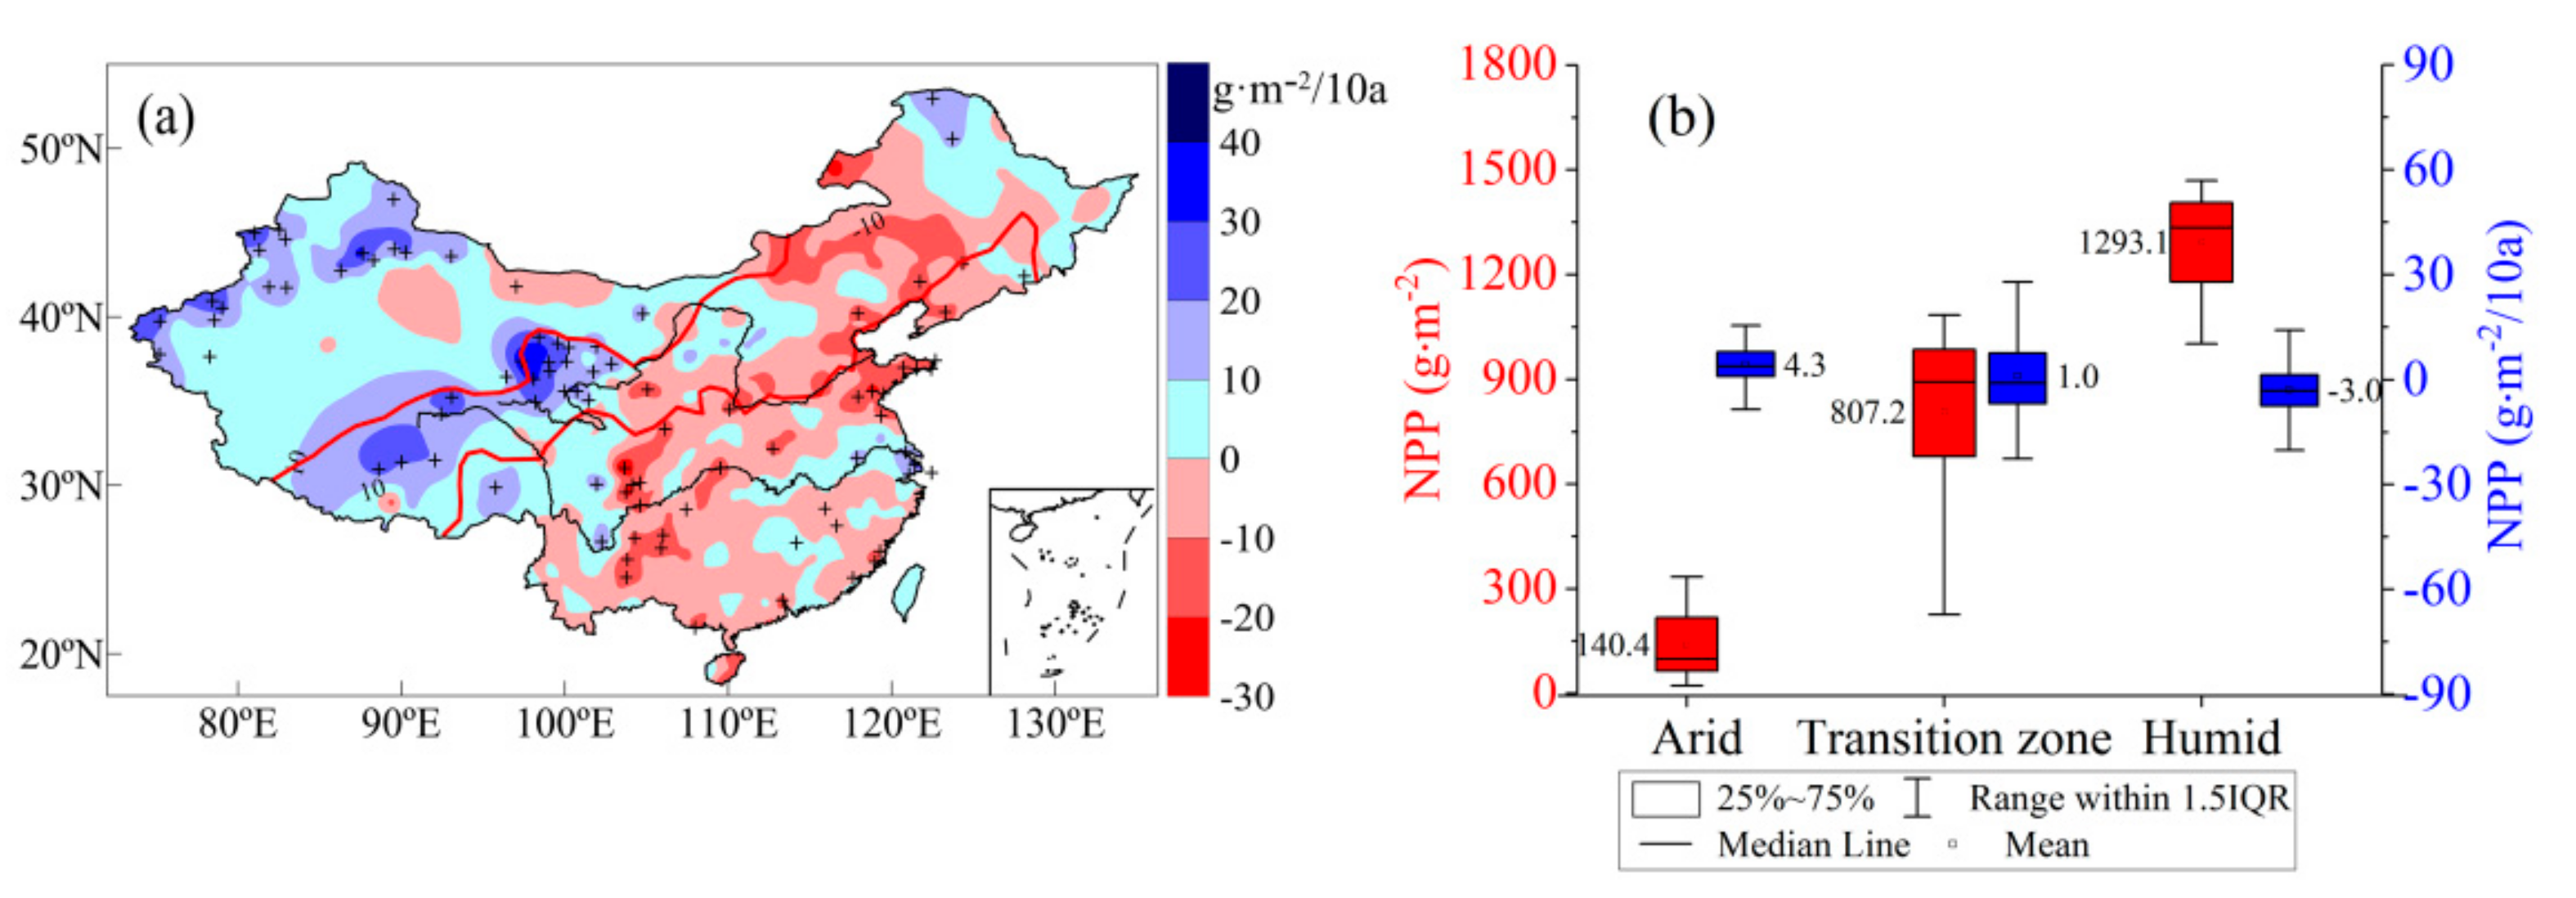
The distribution of the average values and trends of the NPP in the sub regions in China from 1960 to 2017 are shown in Figure 8. Over the past 58 years, the NPP increased to the west of 103° E, while it decreased to the east. NPP in arid regions typically increases, with a rate of 4.3 g·m−2·10 a−1. NPP in the transition zone generally exhibits a slight decrease. However, the regional differences are large. NPP in the humid region typically displays a decreasing trend of −3.3 g·m−2·10 a−1. The distribution of the average NPP in different climatic regions shows that the NPP gradually increases from arid to humid regions. The main vegetation types in arid regions are desert grassland and lowland meadows. The soil is severely desertified and salinized in regions with low vegetation coverage. The annual average NPP is 140.4 g·m−2·a−1. The NPP fluctuation range in the humid region is the smallest, with an average of 1287.9 g·m−2·a−1. The average NPP in the transition zone is 807.2 g·m−2·a−1, ranging from 226.6 to 1084.8 g·m−2·a−1, thereby exhibiting the largest regional difference, which is related to the complex and diverse climate types and vegetation types in the area.
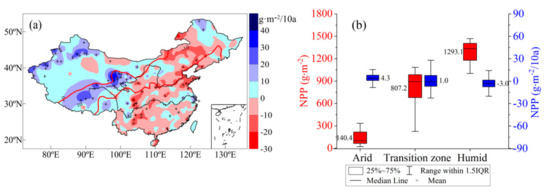
Figure 8.
NPP trend (1960–2017) and (a) distribution of average values and trends in sub regions and (b) +indicates that the trend was significant at the 0.05 level.
3.3. Spatial Distribution and Temporal Variation in PUE
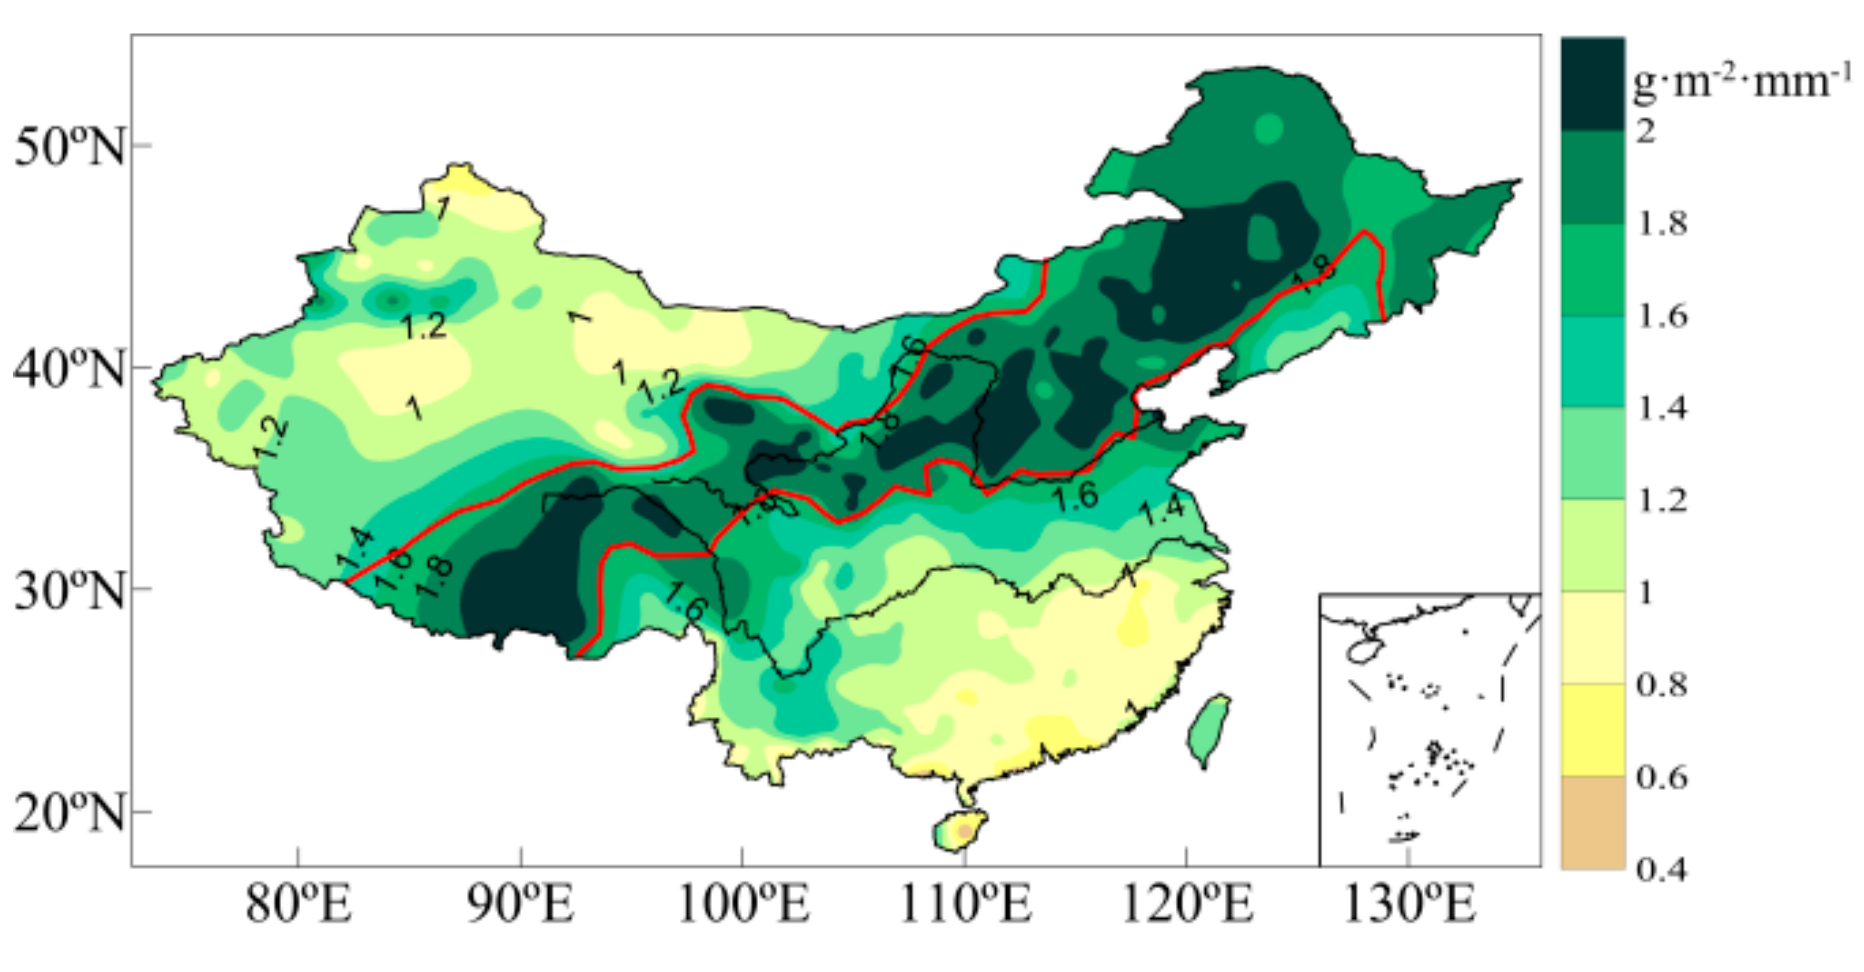
The distribution of the multiyear average PUE presents a “low-high-low” band from northwest to southeast (Figure 9). PUE is relatively low in arid and humid regions and is the lowest in extremely arid and extremely humid regions. The transition zone exhibited the highest PUE. PUE reached its highest value of 2.2 g·m−2·mm−1 in the area where the annual precipitation was 414 mm. The regional differences in PUE distribution are closely related to the regional topography, landform, and water expenditure modes. Arid regions have sparse precipitation, sufficient energy, and low and sparse vegetation, and water is mostly spent in the form of soil evaporation. Therefore, vegetation PUE is low. Humid regions have abundant precipitation, but there are many rainstorms of large intensity [76]. Precipitation is dissipated in the form of runoff, canopy interception, and soil evaporation, which may produce more ineffective water. In addition, in the humid region, there are mostly mountainous and hilly land forms with large surface runoff. Hence, PUE is also low there.
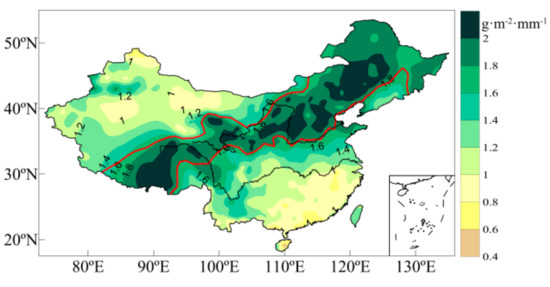
Figure 9.
Spatial distribution of mean precipitation-use efficiency (PUE) in China during 1981–2010.
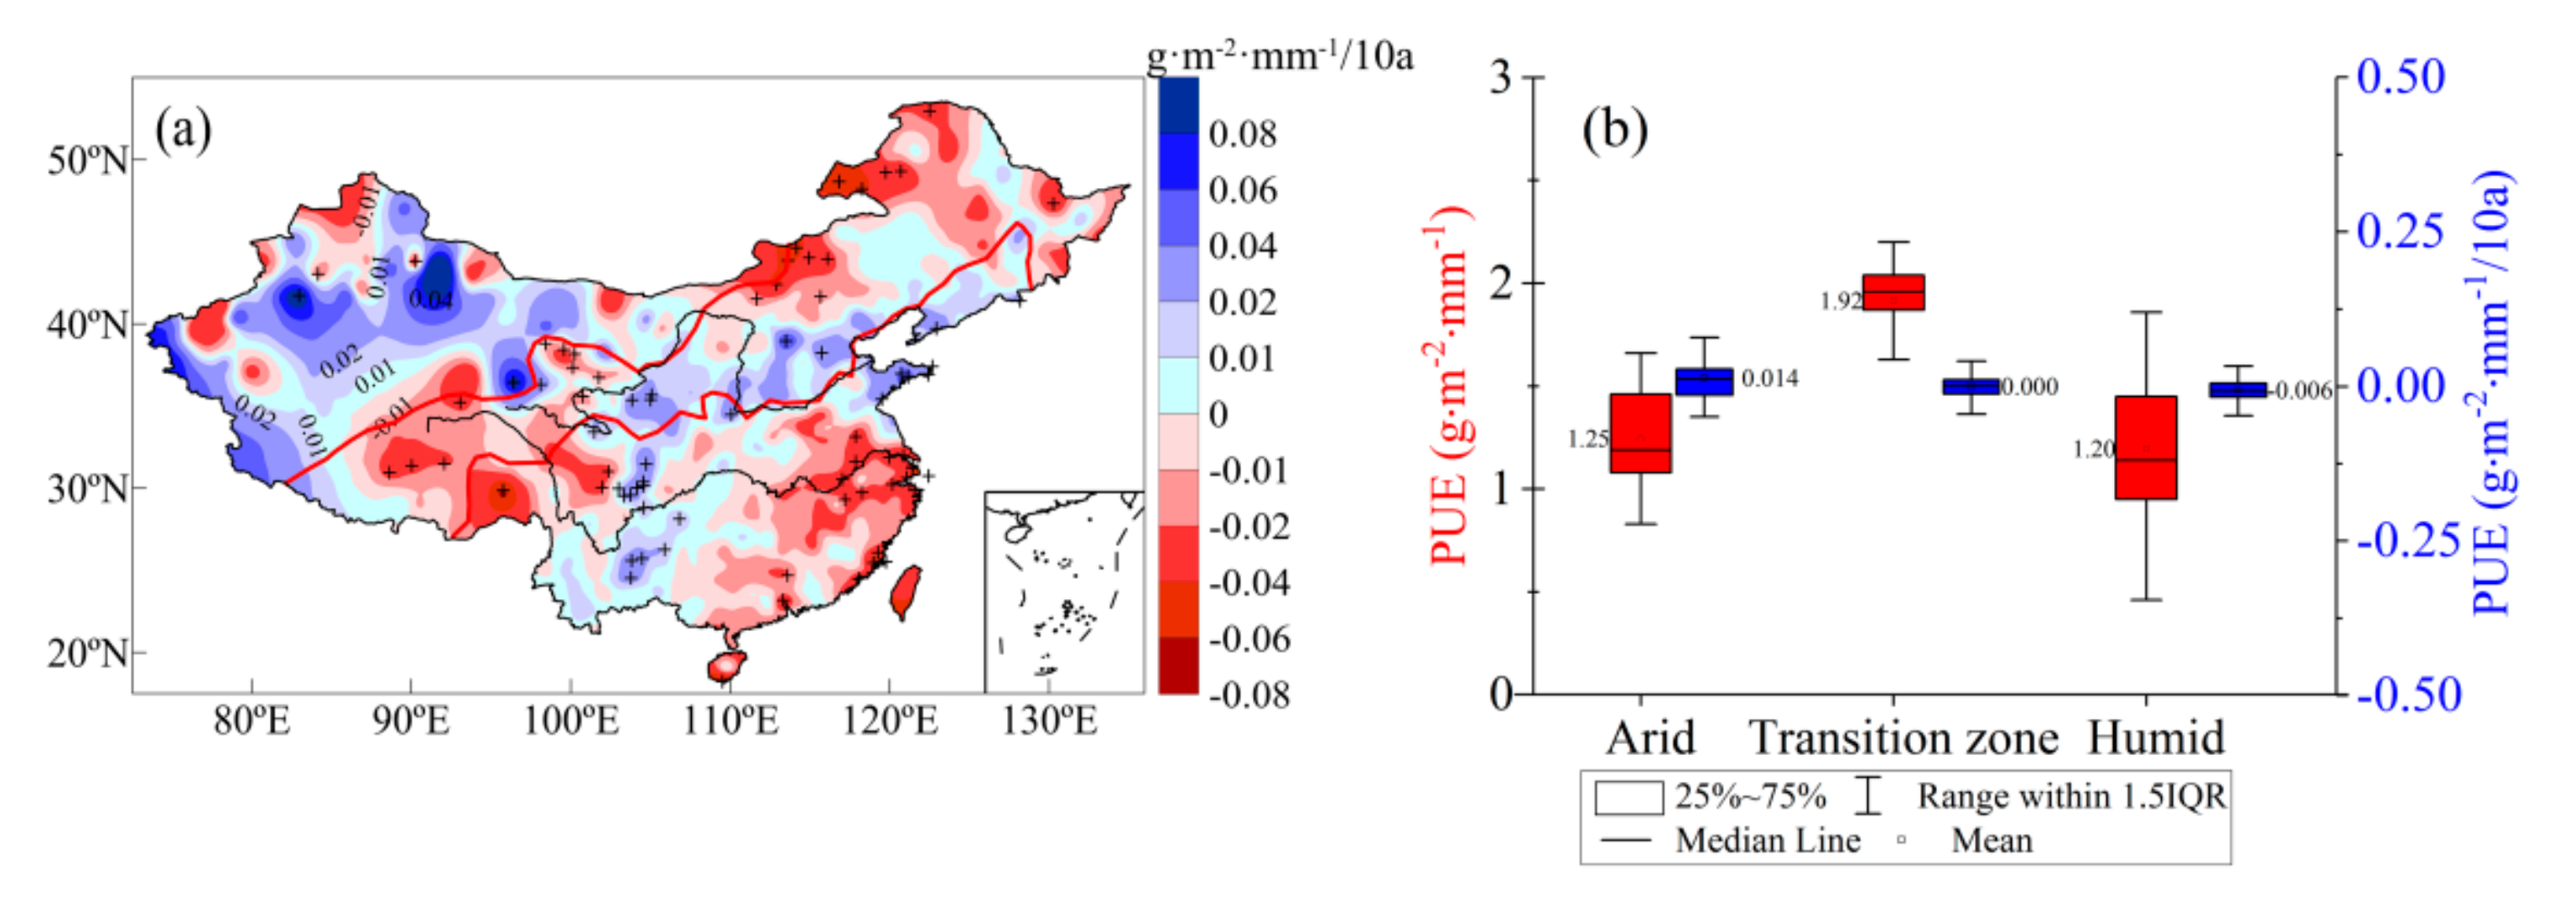
Figure 10 shows the PUE trend in China from 1960 to 2017 and the distribution of average values and trends in the sub regions. Over the past 58 years, PUE in the arid region increased at a rate of 0.014 g·m−2·mm−1·10a−1, indicating that the ability of vegetation in those regions to convert water and nutrients into biomass has increased. PUE in the transition zone was the highest, with an average of 1.92 g·m−2·mm−1, and generally showed a slight decreasing trend. In the western part of the transition zone (i.e., west of 103° E), PUE decreases and ecology deteriorates, which is consistent with current grassland degradation in the upper reaches of the Yellow River [77]. In the middle of the transition zone (i.e., between 103 and 120° E), PUE increases. PUE in the eastern part (i.e., east of 120° E) decreases. Most of the PUE in the humid region exhibits a decreasing trend of −0.003 g·m−2·mm−1·10 a−1. In recent years, rainstorm intensity in humid regions has significantly increased, as has the proportion of rainstorms in annual precipitation [76]. Rainstorms are more likely to form runoff. Hence, this change in precipitation intensity is one of the reasons for the PUE decrease in the region.
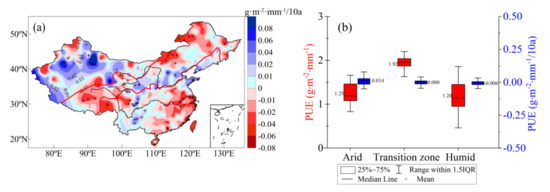
Figure 10.
Precipitation-use efficiency (PUE) trend (1960–2017) and (a) distribution of average values and trends in the sub regions and (b) +indicates that the trend was significant at the 0.05 level.
3.4. Driving Force of PUE Changes and Its Corresponding Conversion Characteristics
Fluctuations in environmental factors have a significant effect on the PUE. Here, we selected Tmean, Rn, U, Rh, and soil moisture (SM) as influencing factors to characterize the energy, dynamic, and water statuses, respectively. Regression models between regional environmental factors and PUE were established (Table S1). Based on the trends and sensitivity analysis, the contribution of each factor to the PUE change was obtained.
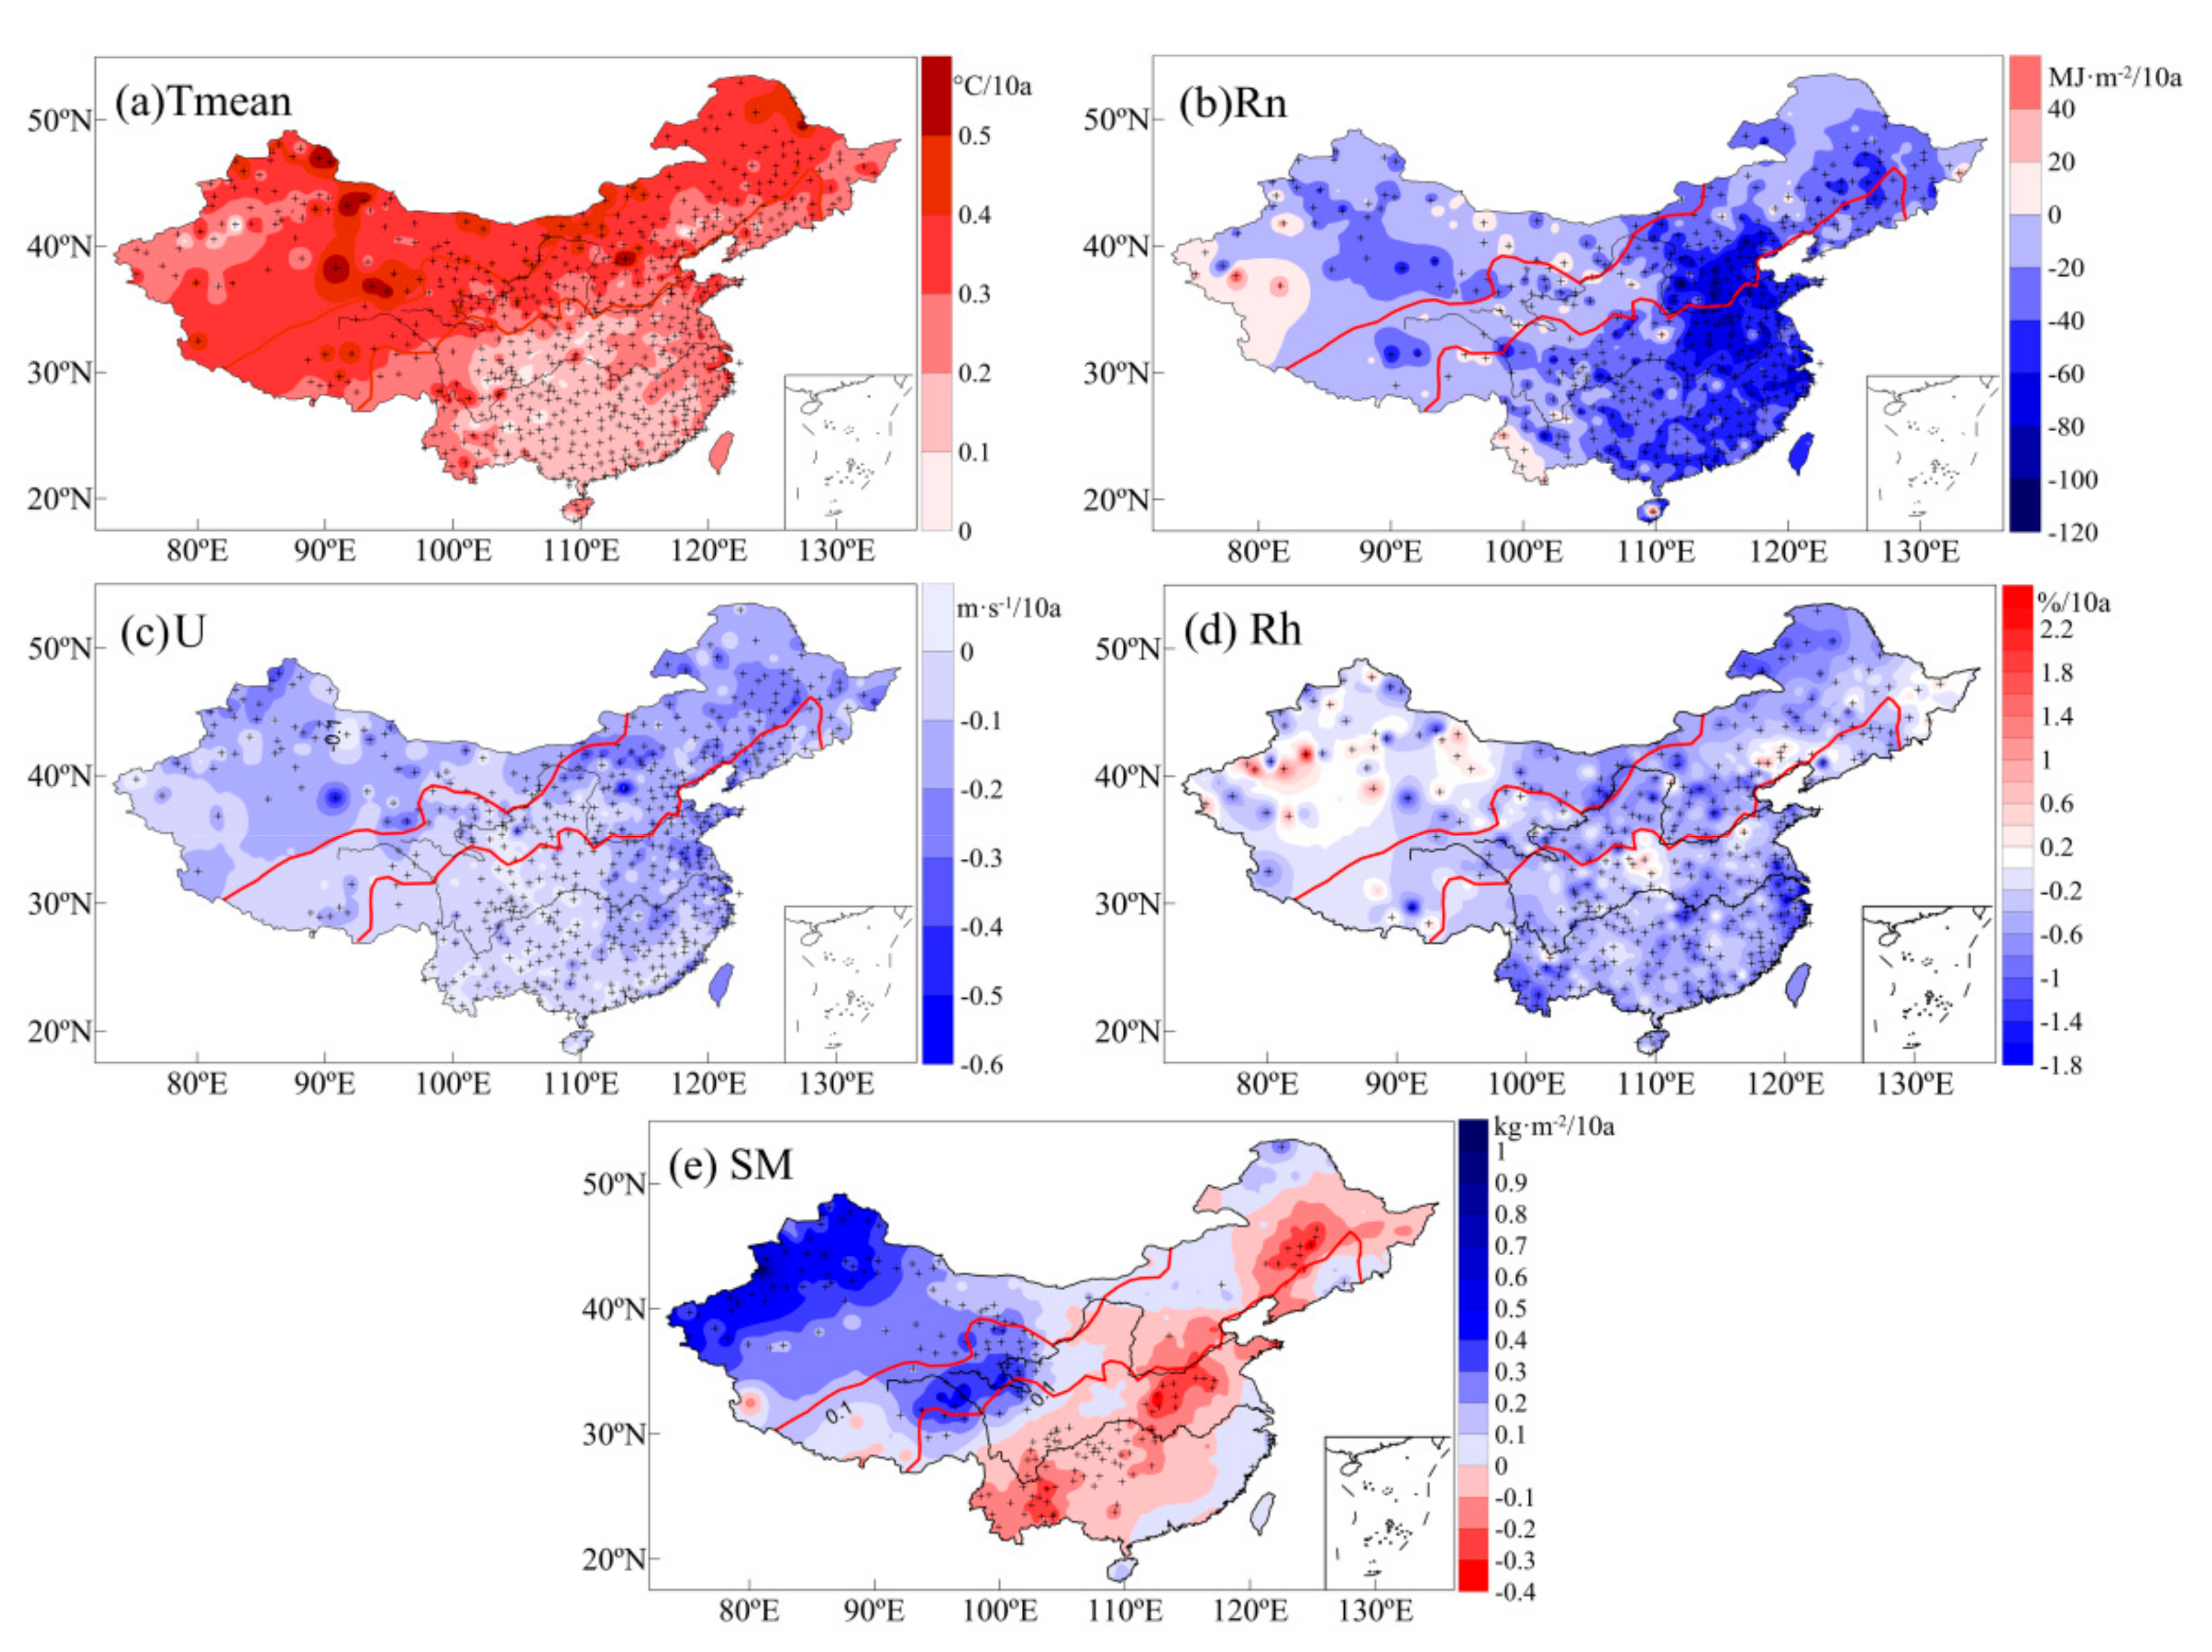
Figure 11 shows the trends of environmental factors from 1960 to 2017. Over the past 58 years, Tmean in China exhibited a significant increasing trend. Air-temperature increases in the arid region and transition zone are particularly evident. Rn, U, and Rh exhibited decreasing trends. Among them, Rn decreased most significantly in the eastern transition zone and the humid region, especially in Beijing-Tianjin-Hebei and the lower reaches of the Yangtze River, which is closely related to increased aerosols in these areas [78]. U also decreased most significantly in the eastern transition zone and east of the humid region. In addition, U exhibited significant decreasing trends in most of the arid regions. Rh change is more complicated. Rh in the western Tianshan Mountains, which are located in an arid region, exhibited an increasing trend because the climate in the region tends to be warm and humid [50]. Rh decreased in most of the rest of the country. SM changes differed from east to west. The arid region and western transition zone exhibited significant SM increases, whereas the Middle Eastern transition zone and humid region exhibited SM decreases. Overall, soil tended to become arid.
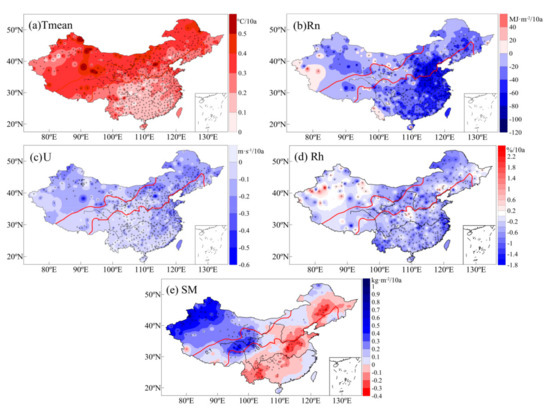
Figure 11.
Trends of each environmental factor from 1960 to 2017, (a) Tmean, (b) Rn, (c) U, (d) Rh, (e) SM, +indicates that the trend was significant at the 0.05 level.
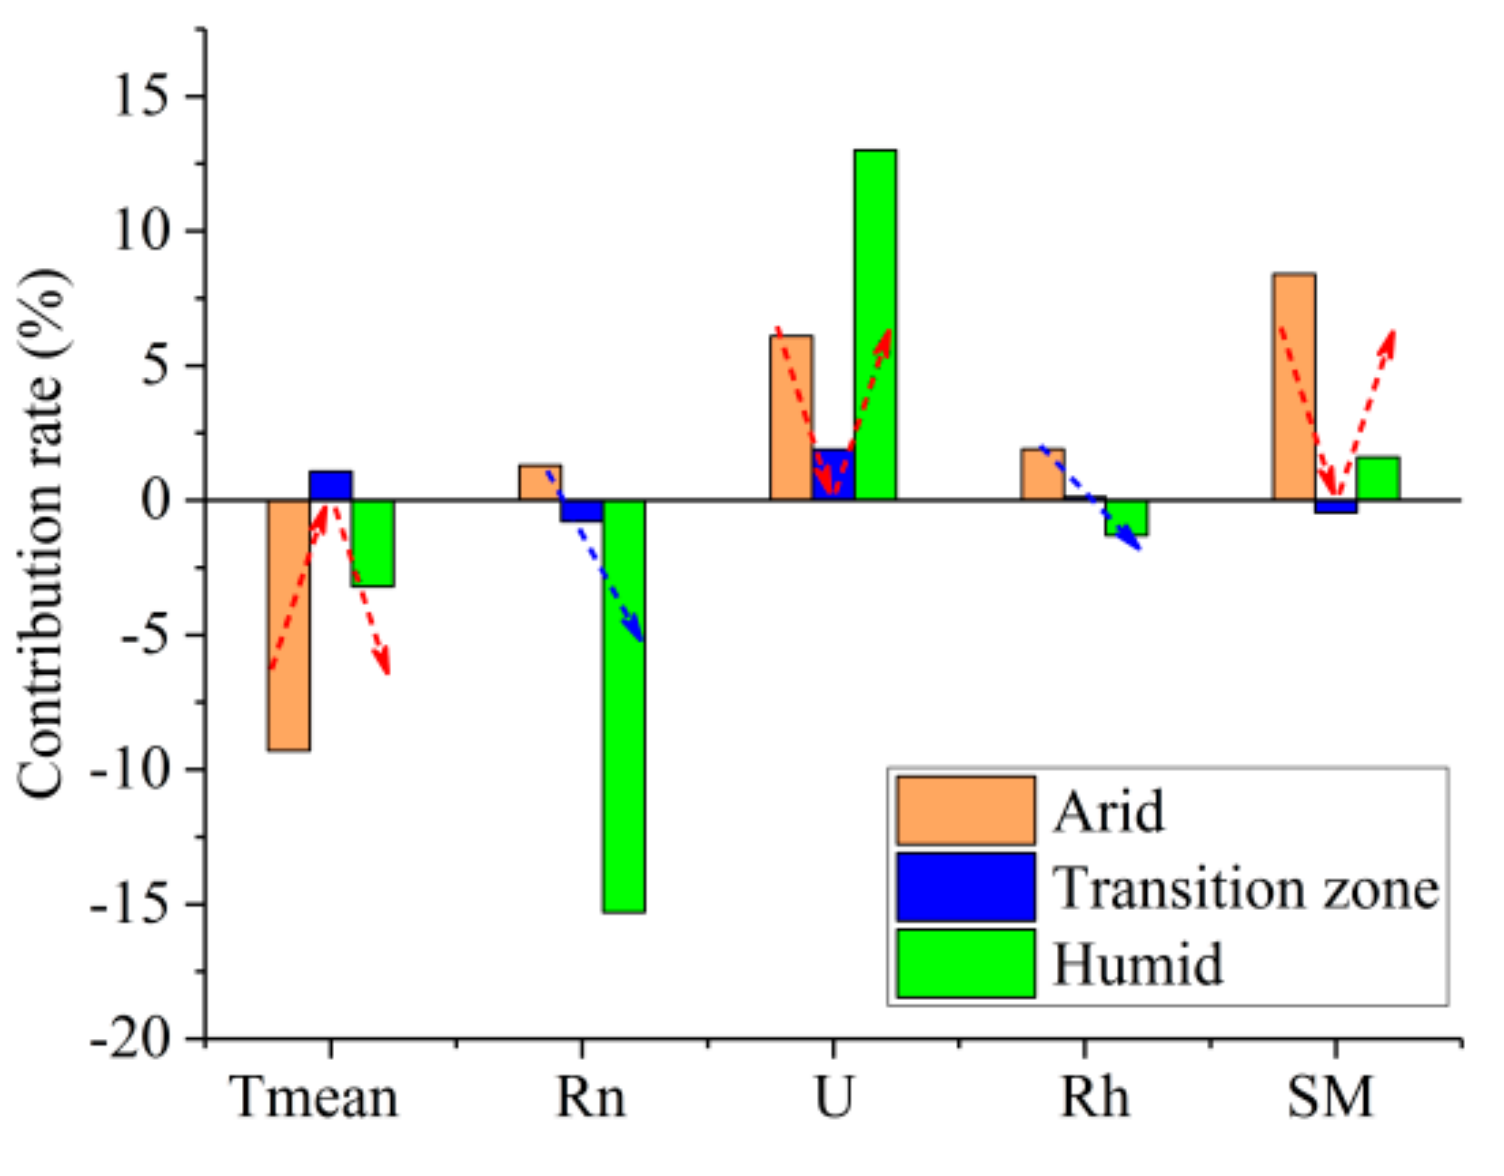
PUE changes in different regions caused by changes in environmental factors are shown in Figure 12. In the arid region, PUE increased by 6.5% over the past 58 years. The Tmean increase reduced the PUE by 9.3%. The SM increase and U decrease increased the PUE by 8.4% and 6.1%, respectively. Rn and Rh increased the PUE by 1.3 and 1.9%, respectively. SM was the main driving force of regional PUE increases. In the humid region, PUE decreased by 3.5% over the past 58 years. The relative change rates of PUE caused by changes in Rn, U, Tmean, Rh, and SM were −15.3, 13.0, −3.2, −1.3, and 1.6%, respectively. Rn changes were the main driving force of regional PUE decreases. Over the past 58 years, atmospheric aerosols in humid regions increased significantly, whereas net radiation decreased significantly [78]. As a result, vegetation photosynthesis is inhibited, vegetation productivity decreases, and PUE decreases accordingly. The impact of climate factors on PUE in the transition zone is more complicated. From the regional average sequence, the positive contribution of the Tmean increase and the U decrease to PUE offset the adverse effects of the Rn and SM decreases, which makes the PUE change insignificant. However, the PUE change in the transition zone exhibited obvious regional differences. The PUE decrease in the western plateau area was dominated by a significant SM increase. The PUE increase in the central regions was mainly due to the positive effect of a U decrease. PUE in the eastern and northeastern regions of the transition zone was dominated by Rn, which means that a significant Rn decrease can reduce the PUE. Overall, the PUE trend was dominated by water in the northern and arid regions and by energy in the southern and humid regions of China.
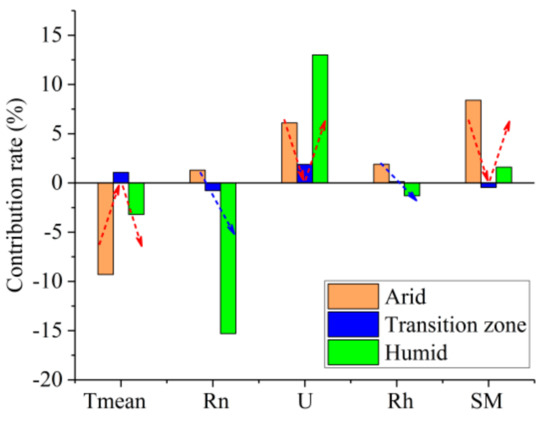
Figure 12.
Contribution of environmental factors to precipitation-use efficiency (PUE). Tmean is air temperature, Rn is the net radiation, U is the wind speed at 10 m, Rh is the relative humidity, and SM is soil moisture.
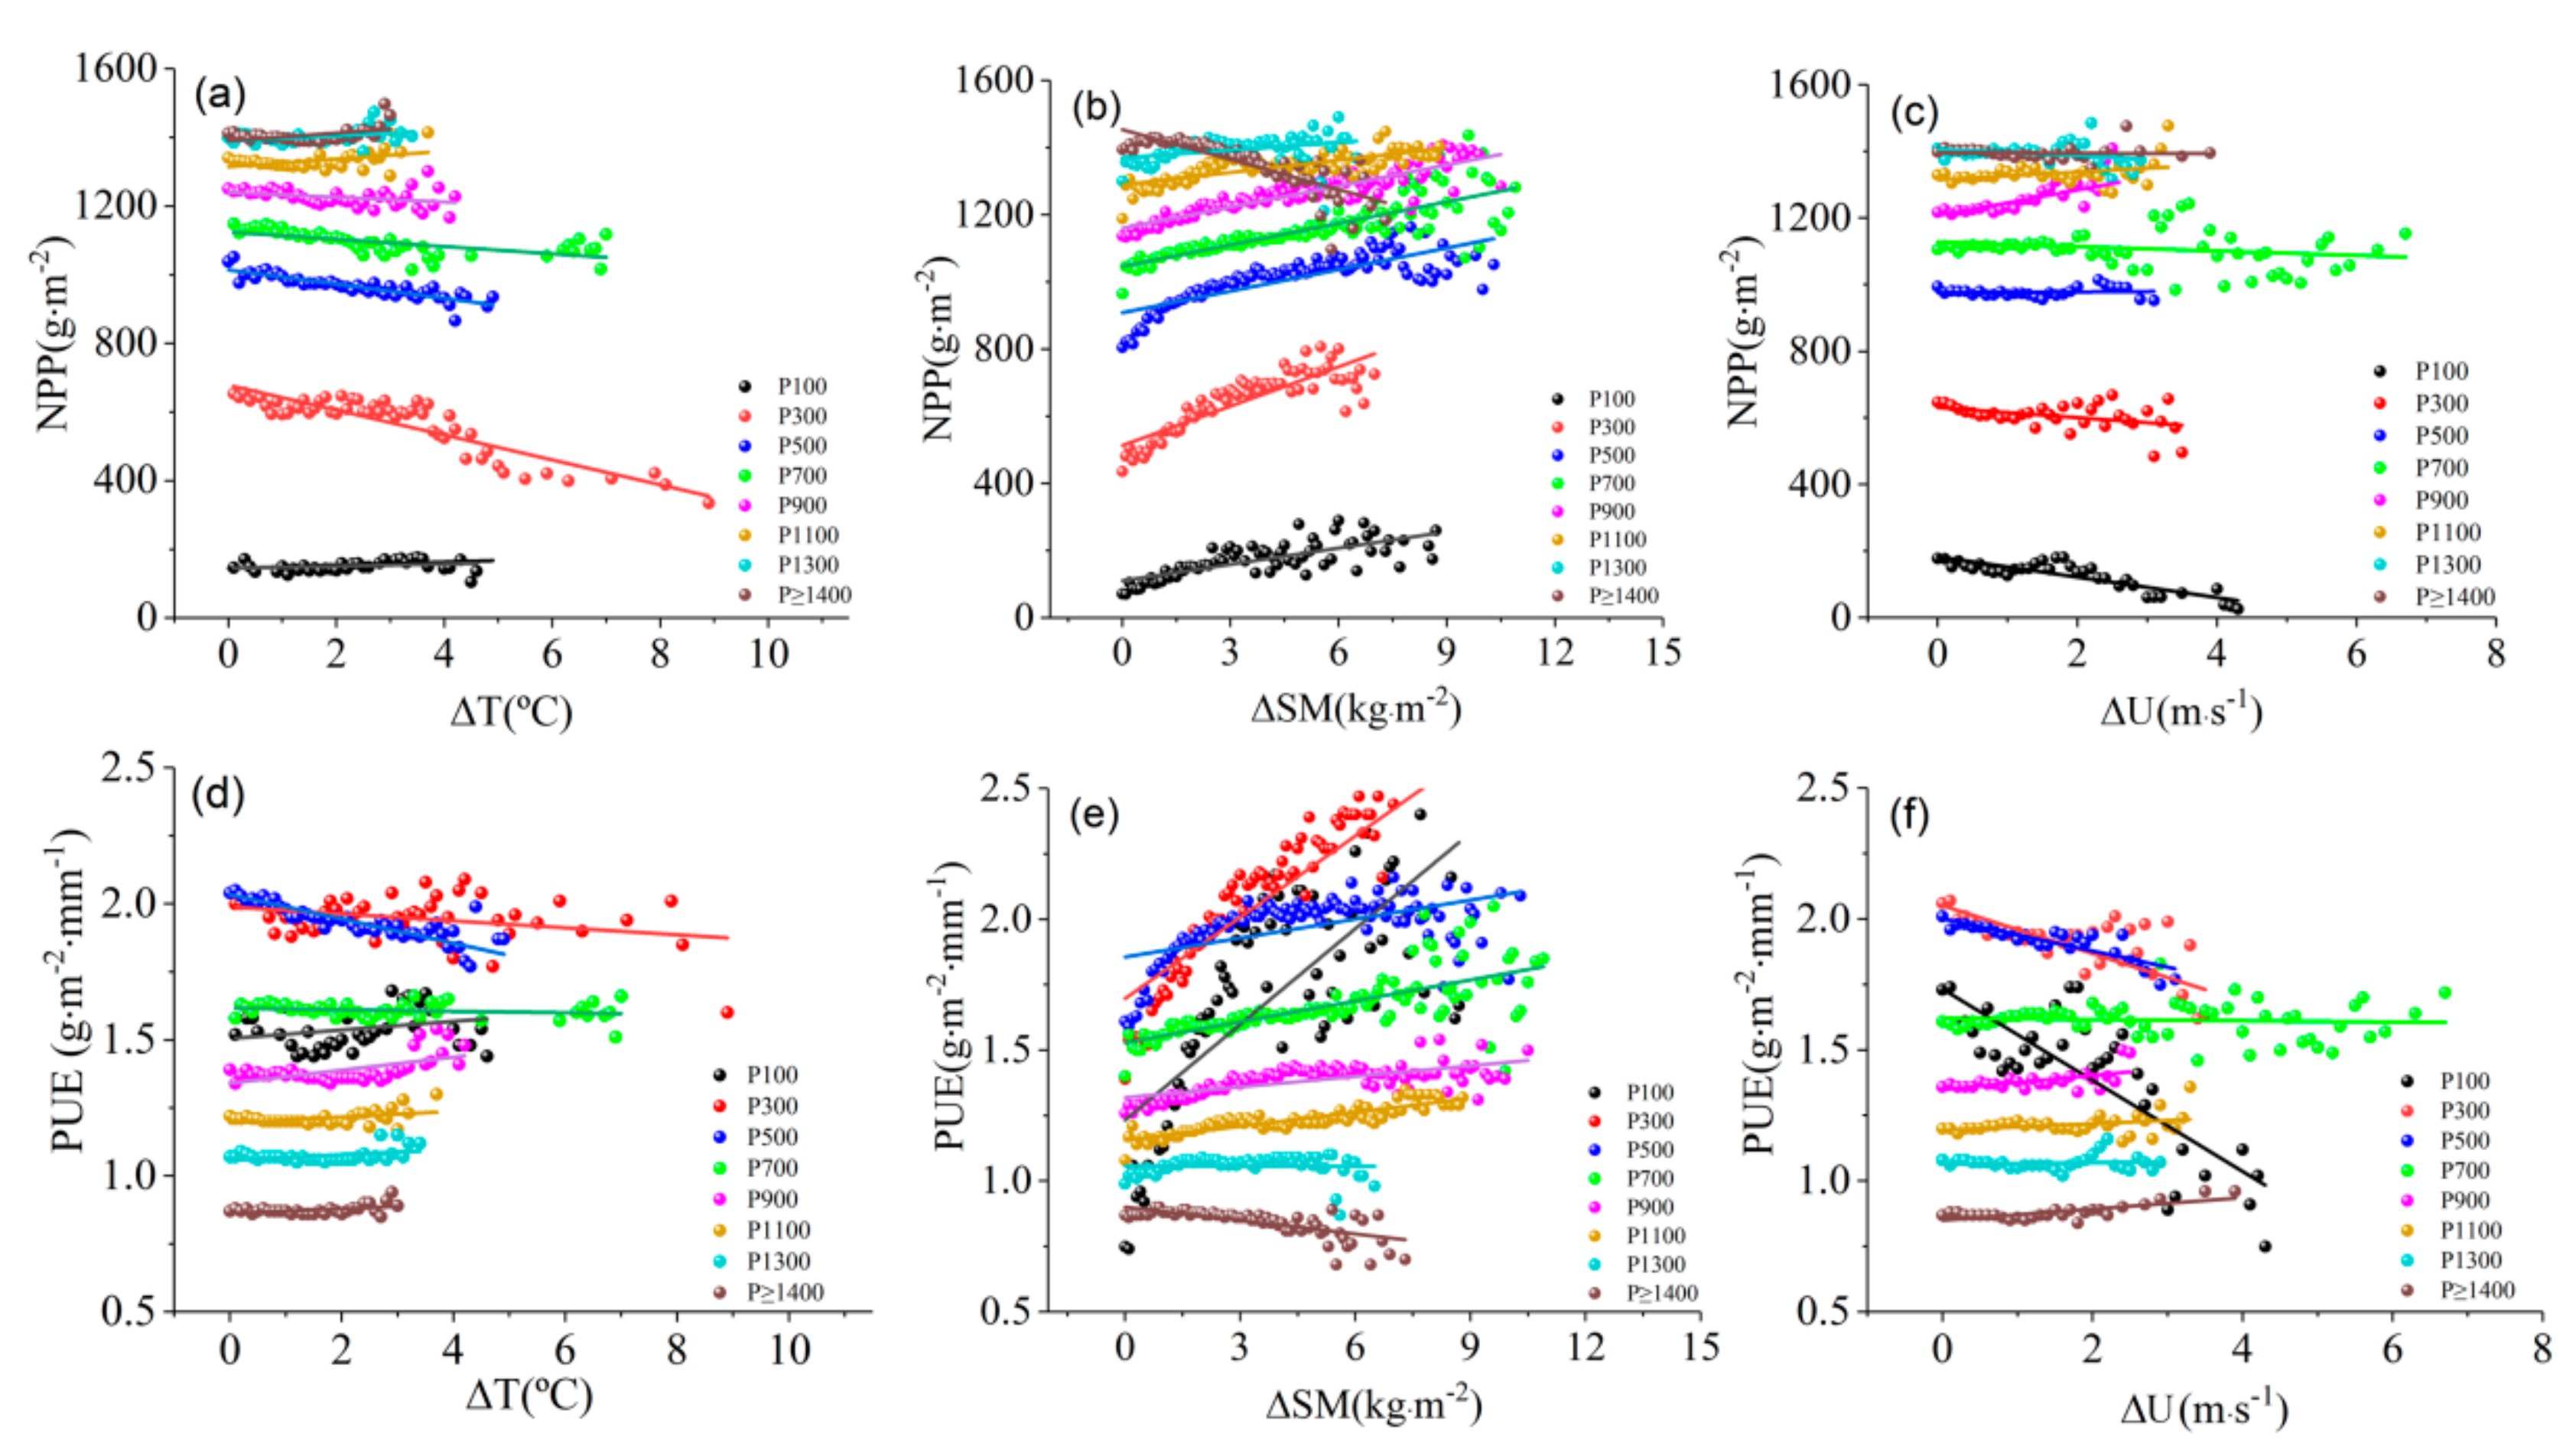
The contribution of the factors is consistent or opposite depending on the factor and region. Rn exhibits a negative effect in southern humid regions and a positive effect in northern arid regions. Rh exhibits a positive effect in northern arid regions and a negative effect in southern humid regions. Furthermore, the effects of Tmean, SM, and U follow apparent “V” shapes, with positive and negative directions or turns from large to small and subsequently to large in the transition zone. To further reveal the turning characteristics of the PUE responses to water, energy, and dynamics and to clarify the precipitation climate zone where turning occurs, the multiyear average precipitation at each station was taken as a spatial climate type at every 200 mm. For example, the P100 climate type represents a spatial climate type with average annual precipitation between 0 and 200 mm. The NPP and PUE responses to changes in Tmean, SM, and U in different precipitation climate types were further analyzed.
Figure 13 shows the distribution patterns of annual NPP and PUE with ΔT, ΔSM, and ΔU changes in different precipitation climate types. Therefore, ΔT, ΔSM, and ΔU are the increments of Tmean, U, and SM, expressed as , where X is T, SM, or U, and Xmin is the minimum value of each factor. In the arid region and transition zone (i.e., P100, P300, and P500), NPP and PUE were the most sensitive to various factors, especially ΔSM (Figure 13b,e). NPP and PUE increased significantly with positive ΔSM. In the humid region, NPP and PUE changed slightly with ΔSM. However, in the extremely humid area (i.e., P ≥ 1400), NPP and PUE decreased with positive ΔSM. Soil moisture in the arid region and transition zone is close to the withering humidity. Vegetation growth is affected mainly by water factors. Soil moisture in the humid region always maintains a relatively high value. However, vegetation is less sensitive to soil moisture. Hence, extremely humid soil can restrict the oxygen supply to vegetation roots and soil microorganisms due to excessive moisture. The NPP and PUE responses to a positive ΔSM range from significantly increased to decreased between the arid and extremely humid regions, respectively. The NPP and PUE responses to ΔT and ΔU also have conversion characteristics (Figure 13a,c,d,f). Water available for evapotranspiration in arid regions is limited. Changes in NPP and PUE with ΔT were not obvious. However, in the transition zone, more obvious air temperature increases resulted in stronger water restriction for vegetation growth and smaller PUE. In the humid region, NPP and PUE were less sensitive to ΔT, but they increased slightly with positive ΔT in the extremely humid region, which reflects the promotion of vegetation growth in extremely humid regions by improved energy conditions. Wind velocity had the greatest impact on vegetation growth in the arid region and transition zone. Increased wind velocity was more conducive to evapotranspiration, thereby causing faster water loss and decreased NPP and PUE. In the humid region, a positive ΔU resulted in more favorable evapotranspiration of super humid water vapor, which indirectly promoted NPP and PUE.
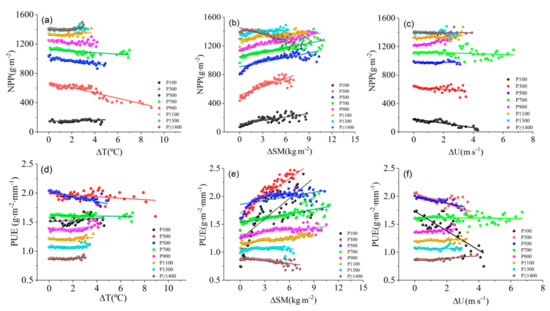
Figure 13.
Trends of annual NPP and PUE with ΔT (a,d), ΔSM (b,e), and ΔU (c,f) in different precipitation climate types.
4. Discussion
4.1. Effect of Energy and Water on ETa in Different Climatic Regions of China
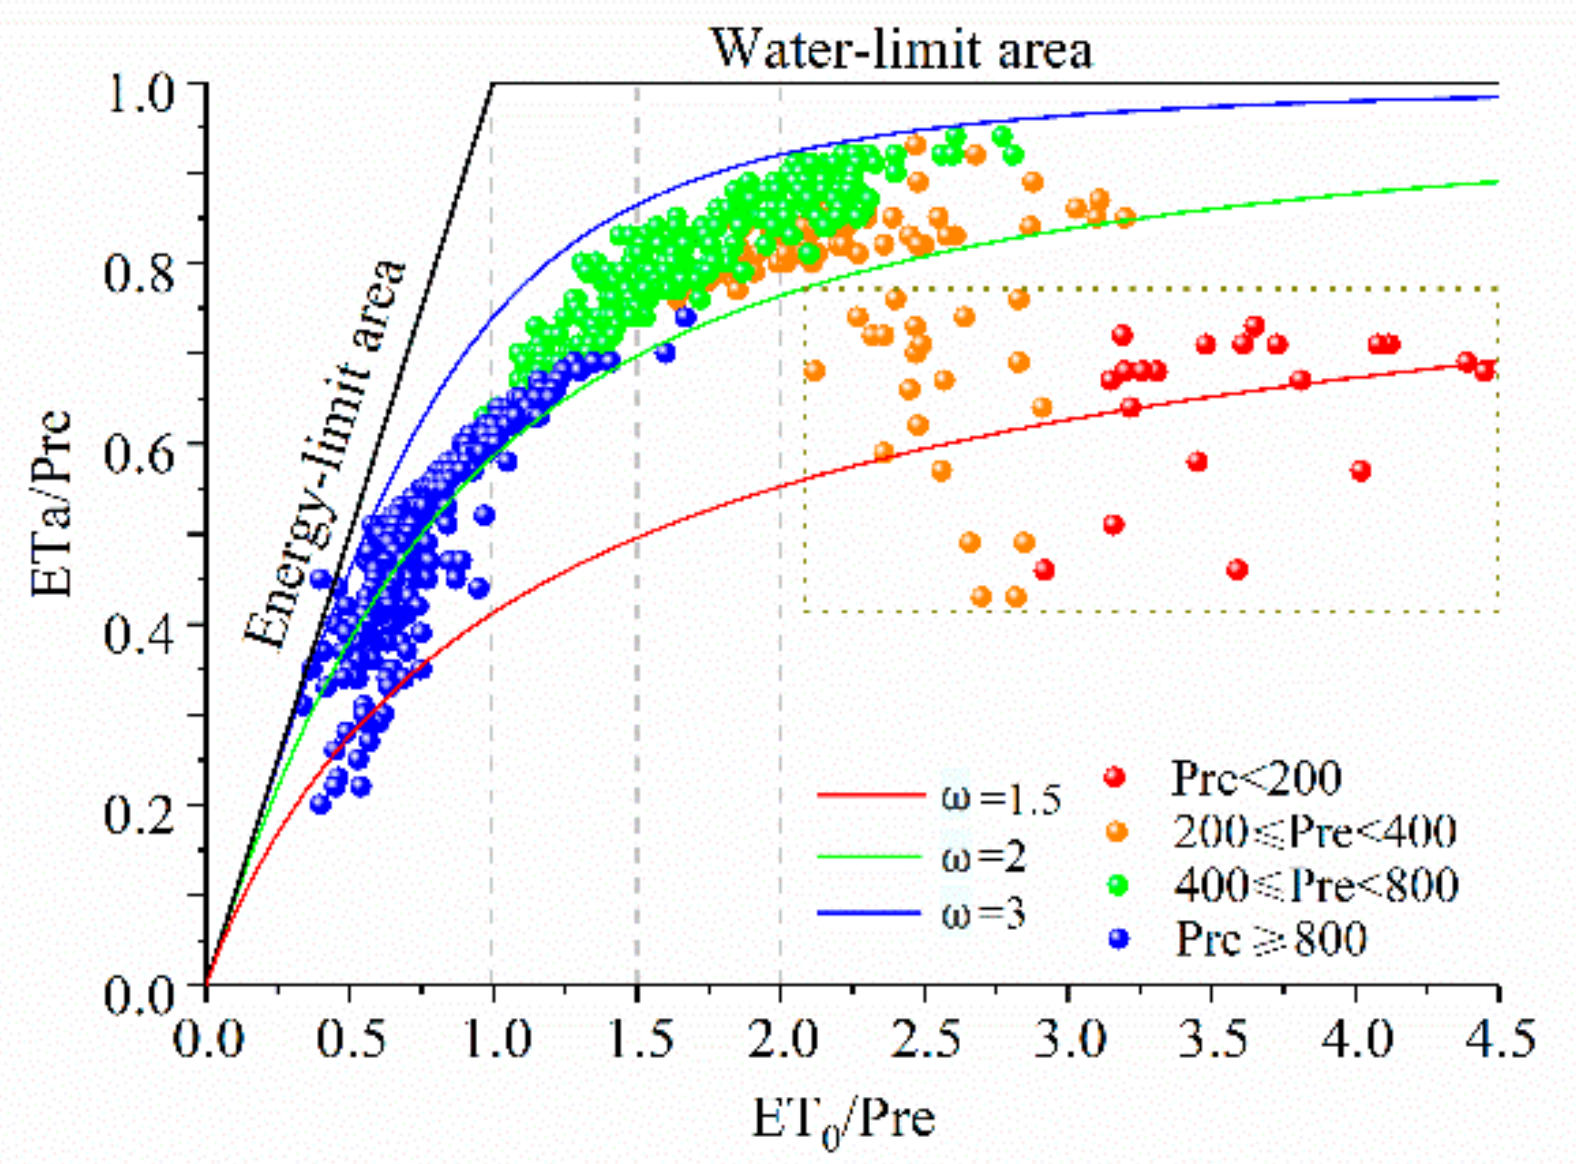
The Budyko curve shows the relationship between ETa-Pre-ET0 and can reveal the limiting relationship between energy and water on ETa [79,80,81]. Figure 14 shows the Long-term mean values of annual ETa, Pre, and ET0 together with Fu’s curves with the regional average values of parameter ω, where ω is the plant-available water coefficient, representing the relative difference in the way plants use soil water for transpiration, and larger values of ω tend to promote evapotranspiration. It can be seen that the relationship in most areas conforms to the Budyko curve, and the data are within the boundary conditions of the hydrothermal coupling assumption, with ω in the humid region greater than in the arid region. In humid regions, ETa is limited by available energy. As it asymptotically approaches ET0, in arid regions, ET0 exceeds P, and where ETa is mainly controlled by water, evapotranspiration ratio (ETa/Pre) tends to 1.
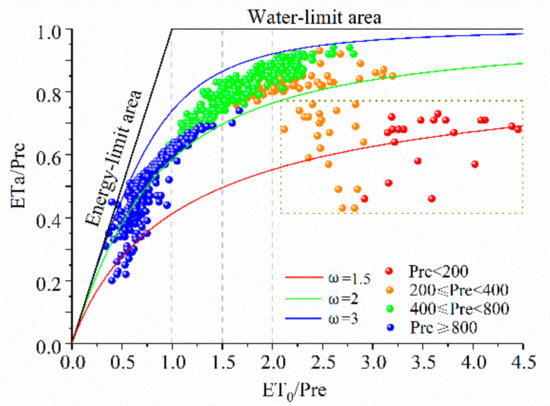
Figure 14.
Relationship among ETa-Pre-ET0 in different climatic regions of China. The ratio of mean annual ETa to Pre as a function of the index of dryness (ET0/Pre) for different values of plant-available water coefficient ω.
Evapotranspiration ratio at some stations in the arid and semi-arid zones (in the lower right dashed box) is less than 1; as such, this may be attributed to the way different kinds of vegetation use soil water and the particularity of precipitation conversion to evaporation in arid areas. In the arid region, small precipitation events are just able to wet the soil surface and are quickly evaporated, whereas large precipitation events increase potential water losses from the ecosystem through runoff or deep soil water percolation [13]. Therefore, evaporation can be lower than precipitation in arid regions, this is consistent with the study of Yang et al. [82] in northern China. In addition, evapotranspiration ratio in arid regions also shows a large fluctuation, which may be related to the large variation in precipitation in arid regions [83,84]. The amount of precipitation in arid and semi-arid regions of China has a large variation [85]; the sparser the precipitation in a region, the greater the variation, and interannual fluctuations in precipitation and regional differences cause large fluctuations in evapotranspiration.
4.2. Complexity of PUE Change in Transition Zone
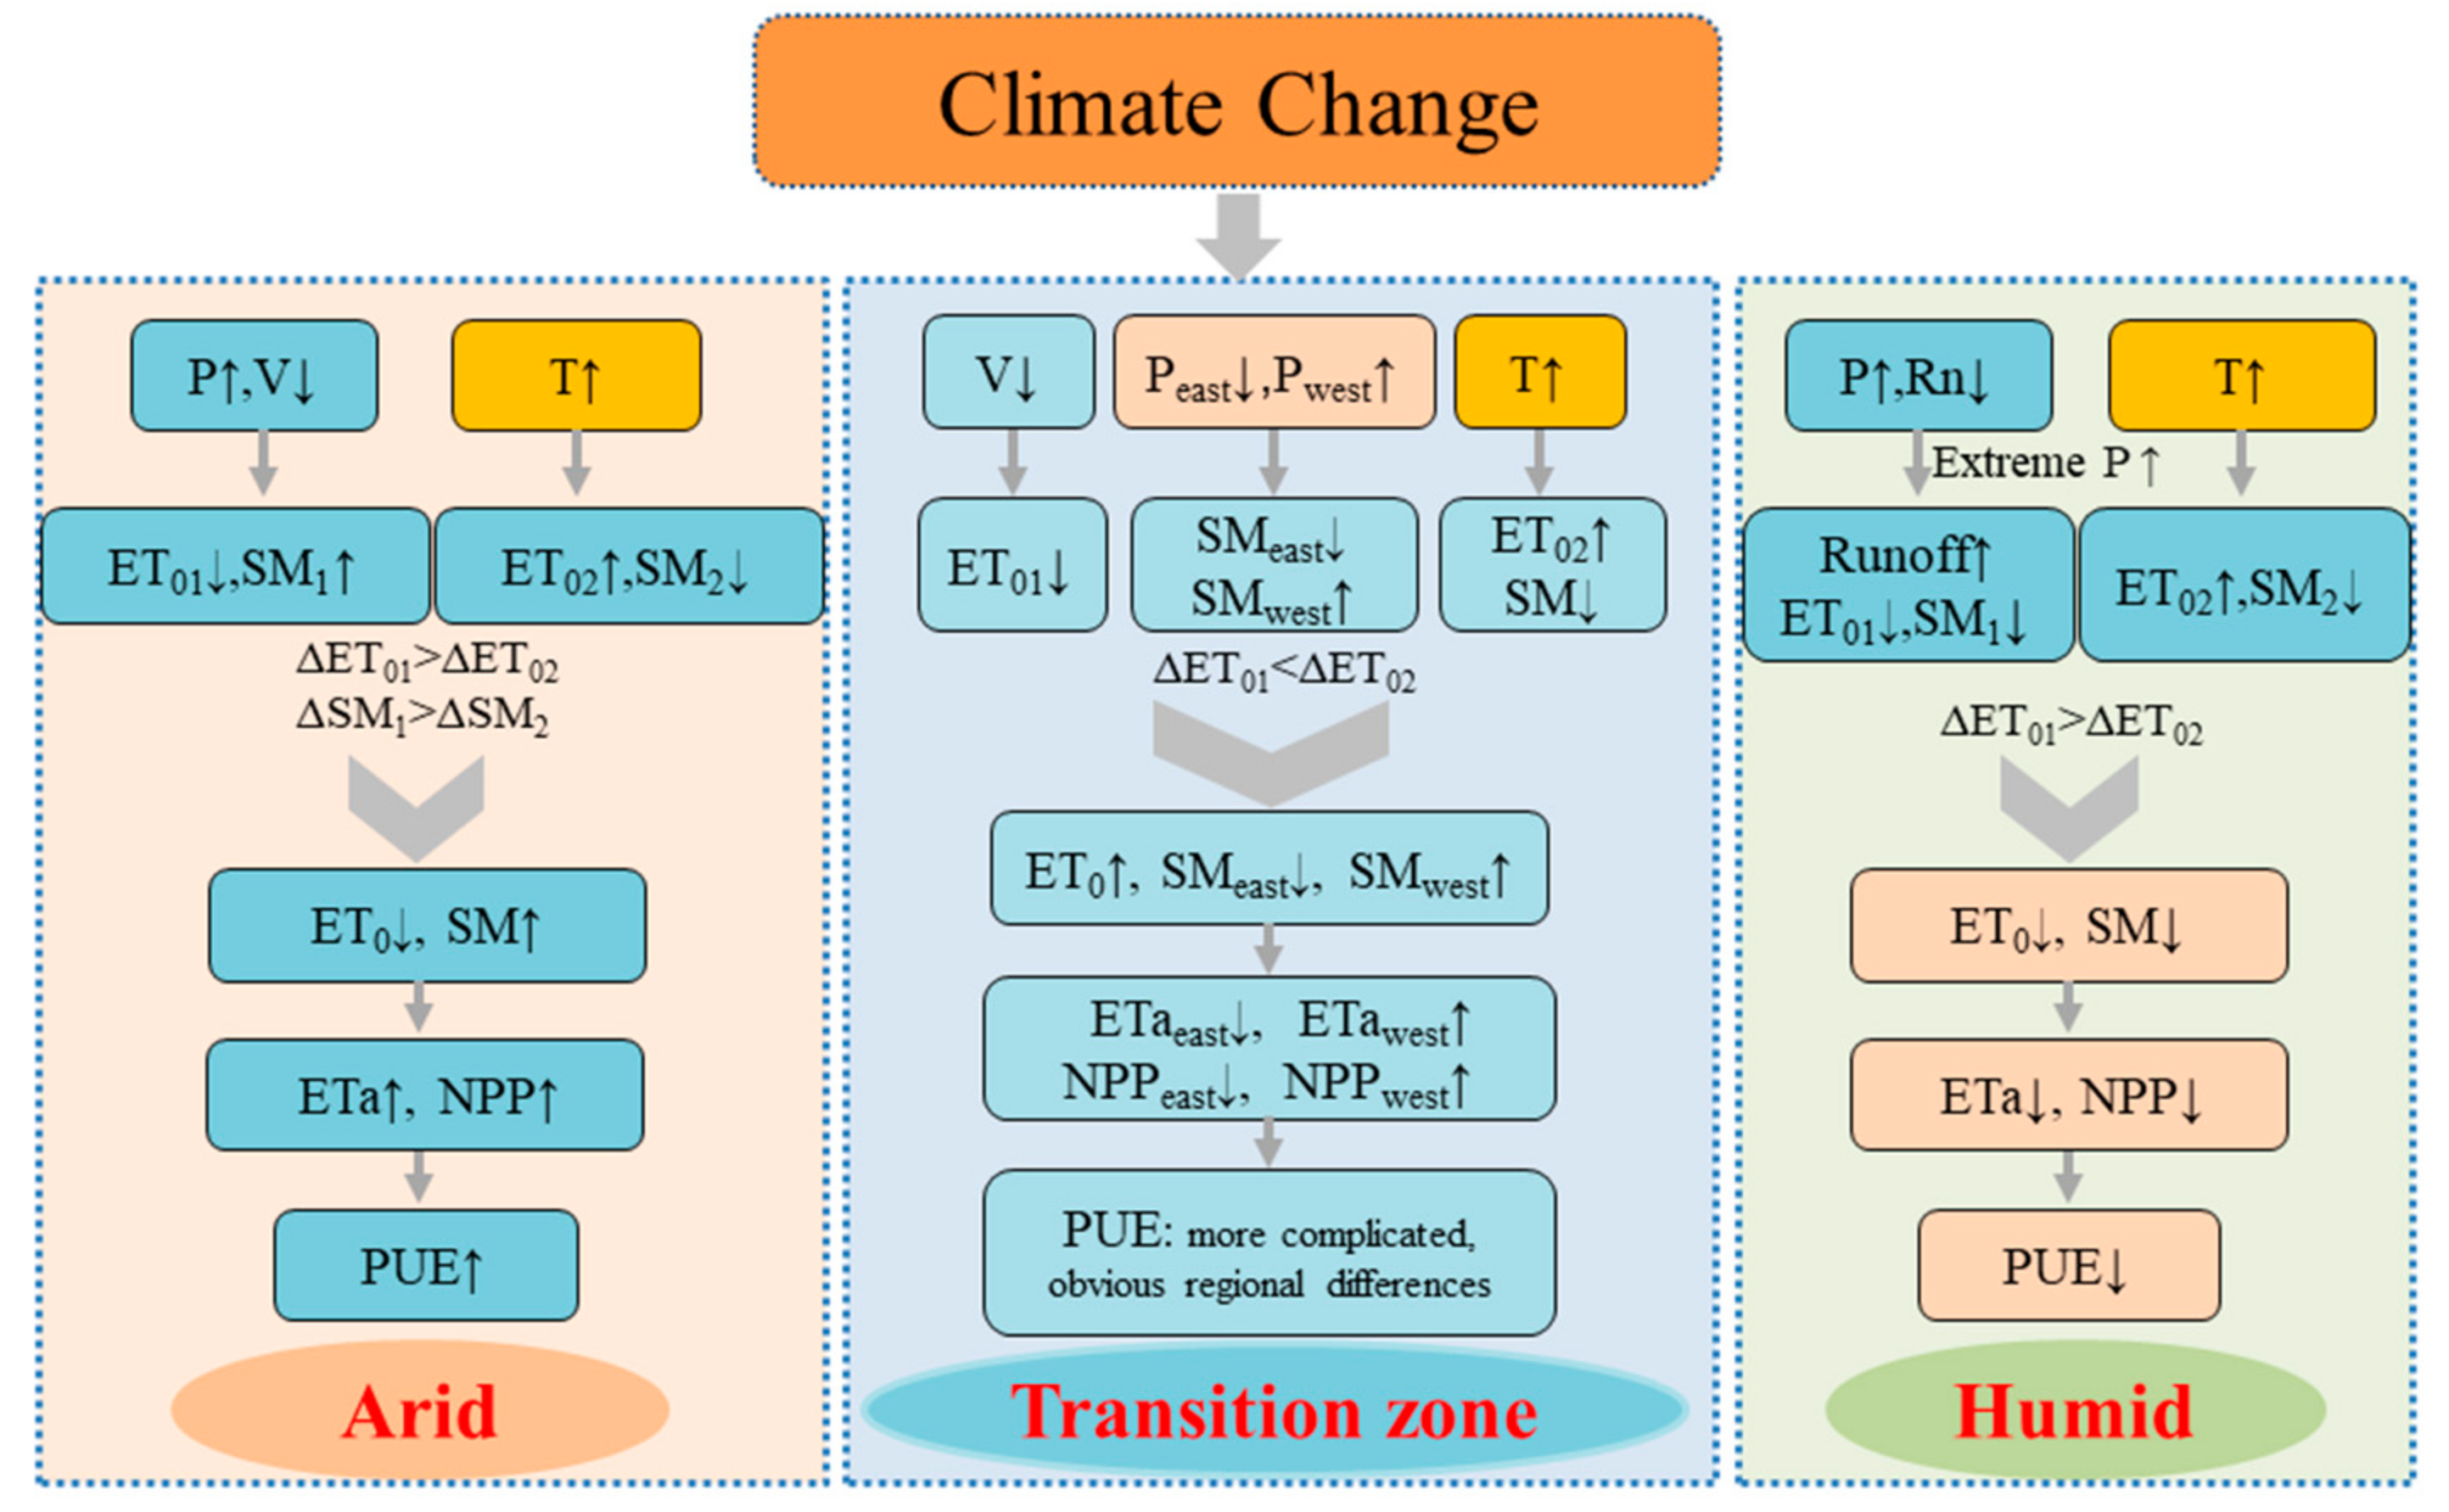
Figure 15 shows a schematic diagram of the controlling factors of PUE in different climatic regions in China, which shows the opposite change of PUE in arid and humid regions and the complexity of PUE change in transition zones.
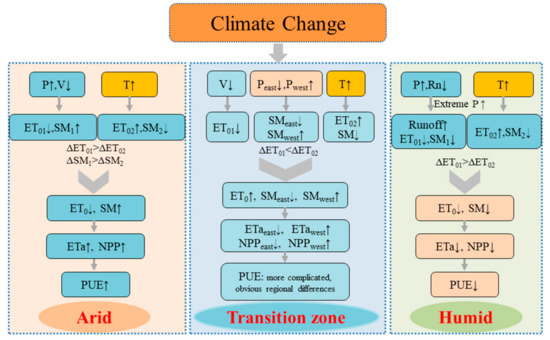
Figure 15.
Schematic diagram that illustrates the control factors of the PUE in different climatic regions of China.
Warming and humidification in Northwest China [86] have a great impact on the increased ETa, NPP, and PUE in arid areas. Warming and humidification increase the amount of water that can evaporate, thereby increasing ETa. Temperature increase results in earlier onset of the greening period while delaying the yellowing period, enhancing vegetation activities, then increasing NPP. Multiple research based on empirical observations and process-based models have also confirmed that aboveground production in arid ecosystems has exhibited an increasing trend [87]. Decreased ETa in the humid region is related to the decrease in ET0, which is consistent with the evaporation paradox [88]. In the southern humid region with sufficient water supply, changes in ETa and ET0 are consistent [89]. Thus, when the ET0 decreases, ETa also decreases. Rainfall is abundant in humid areas. Vegetation productivity is positively correlated with air temperature and negatively correlated with precipitation. In recent decades, the increase in precipitation in humid regions has reduced photosynthetically active radiation. Enhanced radiation restrictions reduce vegetation NPP.
Factors influencing ETa, NPP, and PUE in the transition zone are more complex because this region is a competitive zone for water and energy [90]. In the highland region in the western part of the transition zone, NPP increases along with warming and humidification, and a significant decrease in precipitation in the eastern region of the transition zone and the warming and drying caused by temperature increases are the main reasons for the NPP decrease [91]. At the same time, the region is affected by the interannual fluctuation of the intensity of the East Asian summer monsoon, so the interannual and interdecadal precipitation fluctuations in the region are large [92].
4.3. Transformation Characteristics of PUE
The transition zone exhibited the highest PUE. PUE reached its highest value of 2.2 g·m−2·mm−1 in the area where the annual precipitation was 414 mm. The unimodal PUE distribution, which first increases and then decreases with increasing precipitation, has been confirmed by other studies. Paruelo et al. [8] indicated that in American temperate grasslands with 200–1200 mm precipitation, PUE first increased and then decreased with increasing precipitation, peaking at 475 mm. PUE in extremely arid and extremely humid regions is low. Hu et al. [5] reported that the PUE initially exhibited a rising trend but subsequently decreased as precipitation increased from 200 to 1200 mm. PUE peaked at 400–500 mm. Huxman et al. [6], Lauenroth and Paruelo [7], and Yu et al. [11] also showed that in regions with annual precipitation less than 600 mm, PUE increased with increasing precipitation. In humid regions with annual precipitation above 650 mm, PUE decreased with increasing precipitation, and when the annual precipitation was above 1500 mm, PUE was approximately constant. Zhang et al. [9] reported that the spatiotemporal PUE pattern in alpine grasslands in northern Tibet initially increased in the arid region and subsequently decreased along the precipitation gradient toward the humid region, reaching a peak at approximately 500 mm precipitation.
The PUE distribution pattern with precipitation in this study is consistent with the above studies, and different precipitation thresholds of the maximum PUE conversion point may be partially attributed to the different research methods and study regions. In addition, the distribution patterns of annual PUE with ΔT, ΔSM, and ΔU changes in different precipitation climate types also indicate that the PUE transition interval coincides with the northern edge of the monsoon. Therefore, the results of this paper are reasonable.
Our research shows that transition regions with limited rainfall have the strongest NPP and PUE processes, and the response of the carbon fluxes in these fragile regions deserves more attention.
5. Conclusions
Based on the improvement of the ETa model, this study characterized the responses of ETa, NPP, and PUE to climate change in different climatic regions of China, revealed the PUE conversion characteristics with the precipitation distribution, and clarified the driving force of PUE changes in different climate regions. The main conclusions are as follows:
The improved ETa model fully reflects the energy limitation on ETa in humid regions, and the estimated ETa is more reasonable and reliable. The distribution of ETa and NPP in China shows a gradually increasing trend from northwest to southeast, and the trends of ETa and NPP both change from an increase to a decrease from the arid to the humid region. ETa and NPP fluctuations in arid regions are mainly controlled by water, and the increase in precipitation and soil moisture is the main reason. ETa and NPP in humid regions are mainly controlled by energy. ETa in the transition zone is affected by both water and energy, and regional differences in ETa and NPP changes in the transition zone are large.
There was a conversion zone of PUE in mainland China. Arid and humid regions had the lowest PUE, and the transition zone with annual precipitation of 200–600 mm had the highest PUE. In the past 58 years, PUE in arid regions has exhibited an increasing trend, whereas PUE in the transition zone generally exhibited a slightly decreasing trend. PUE displayed a decreasing trend in most of the humid regions.
PUE changes in arid regions are dominated by water conditions, whereas changes in energy in humid regions largely determine PUE changes. The transition zone is the conversion zone where the prevailing factor transitions from water to energy. PUE changes are caused by the interaction of energy, water, and dynamic factors. Among them, soil moisture plays the most prominent role, followed by temperature and wind velocity.
Supplementary Materials
The following supporting information can be downloaded at: https://www.mdpi.com/article/10.3390/rs14102467/s1, Table S1: Regression equation between environmental factors and PUE in each sub regions (annual averaged air temperature (Tmean), net radiation (Rn), wind velocity (U), relative humidity (RH), and soil moisture (SM), respectively).
Author Contributions
Conceptualization, P.Y. and Q.Z.; methodology, P.Y., S.W., J.Y. and H.Z.; software, S.W., W.W. and J.W.; formal analysis, S.W. and P.Y.; writing—original draft preparation, S.W.; writing—review and editing, S.W., P.Y. and Q.Z.; visualization, S.W., X.R. and J.W.; funding acquisition, P.Y. and S.W. All authors have read and agreed to the published version of the manuscript.
Funding
This research was funded by the National Natural Science Foundation of China (Grant No. U2142208, 41975016), the Basic Research Innovation Group Project of Gansu Province (Grant No. 20JR5RA121), the Natural Science Foundation of Gansu Province (Grant No. 21JR7RA698), and the Foundation of drought Meteorological Science Research (Grant No. IAM202001).
Institutional Review Board Statement
Not applicable.
Informed Consent Statement
Not applicable.
Data Availability Statement
The GLDAS_Noah025_M.2.0 and 2.1 datasets can be accessed online (https://disc.gsfc.nasa.gov/datasets?page=1&project=GLDAS (accessed on 25 February 2021)); The MOD17A3 surface vegetation NPP data provided by the EOS/MODIS (TERRA satellite) of NASA can be accessed at https://earthdata.nasa.gov/ (accessed on 2 November 2020); and China FLUX ETa data are available at http://rs.cern.ac.cn/data/initDRsearch?classcode=SYC_A02 (accessed on 19 December 2019).
Conflicts of Interest
The authors declare no conflict of interest.
References
- Piao, S.L.; Zhang, X.P.; Chen, A.P.; Liu, Q.; Lian, X.; Wang, H.X.; Peng, S.S.; Wu, X.C. The impacts of climate extremes on the terrestrial carbon cycle: A review. Sci. China Earth Sci. 2019, 62, 1551–1563. [Google Scholar] [CrossRef]
- IPCC. Climate Change 2021: The Physical Science Basis. M/OL]. 2021 [2021-08-09]. Available online: https://www.ipcc.ch/report/ar6/wg1/downloads/report/IPCC_AR6_WGI_Full_Report.pdf (accessed on 9 August 2021).
- Mu, Q.Z.; Zhao, M.S.; Running, S.W.; Liu, M.L.; Tian, H.Q. Contribution of increasing CO2 and climate change to the carbon cycle in China’s ecosystems. J. Geophys. Res. Biogeosci. 2015, 113, G01018. [Google Scholar] [CrossRef] [Green Version]
- Xu, X.T.; Piao, S.L.; Wang, X.H.; Chen, A.P.; Ciais, P.; Myneni, R.B. Spatio-temporal patterns of the area experiencing negative vegetation growth anomalies in China over the last three decades. Environ. Res. Lett. 2012, 7, 035701. [Google Scholar] [CrossRef]
- Hao, Y.B.; Wang, Y.F.; Cui, X.Y. Drought stress reduces the carbon accumulation of the Leymus chinensis steppe in Inner Mongolia, China. Chin. J. Plant Ecol. 2010, 34, 898–906. (In Chinese) [Google Scholar]
- Yuan, W.P.; Cai, W.W.; Chen, Y.; Liu, S.G.; Dong, W.J.; Zhang, H.C.; Yu, G.R.; Chen, Z.Q.; He, H.L.; Guo, W.D.; et al. Severe summer heatwave and drought strongly reduced carbon uptake in Southern China. Sci. Rep. 2016, 6, 18813. [Google Scholar] [CrossRef] [PubMed] [Green Version]
- Xu, X.J.; Zhou, G.M.; Liu, S.G.; Du, H.Q.; Mo, L.F.; Shi, Y.J.; Jiang, H.; Zhou, Y.F.; Liu, E.B. Implications of ice storm damages on the water and carbon cycle of bamboo forests in southeastern China. Agric. For. Meteorol. 2013, 177, 35–45. [Google Scholar] [CrossRef]
- Turner, N.C. Agronomic options for improving rainfall-use efficiency of crops in dryland farming systems. J. Exp. Bot. 2004, 55, 2413–2425. [Google Scholar] [CrossRef] [Green Version]
- Keenan, T.F.; Hollinger, D.Y.; Bohrer, G.; Dragoni, D.; Munger, J.W.; Schmid, H.P.; Richardson, A.D. Increase in forest water-use efficiency as atmospheric carbon dioxide concentrations rise. Nature 2013, 499, 324–327. [Google Scholar] [CrossRef]
- Wang, L.M.; Li, M.Y.; Wang, J.X.; Li, X.G.; Wang, L.C. An analytical reductionist framework to separate the effects of climate change and human activities on variation in water use efficiency. Sci. Total Environ. 2020, 727, 138306. [Google Scholar] [CrossRef]
- Bai, Y.F.; Wu, J.G.; Qi, X.; Pan, Q.M.; Huang, J.H.; Yang, D.L.; Han, X.G. Primary production and rain use efficiency across a precipitation gradient on the Mongolia Plateau. Ecology 2008, 89, 2140–2153. [Google Scholar] [CrossRef]
- Hu, Z.M.; Yu, G.R.; Fan, J.W.; Zhong, H.P.; Wang, S.Q.; Li, S.G. Precipitation-use efficiency along a 4500-km grassland transect: Rain-use efficiency in Chinese grasslands. Glob. Ecol. Biogeogr. 2010, 19, 842–851. [Google Scholar]
- Huxman, T.E.; Smith, M.D.; Fay, P.A.; Knapp, A.K.; Shaw, M.R.; Loik, M.E.; Smith, S.D.; Tissue, D.T.; Zak, J.C.; Weltzin, J.F. Convergence across biomes to a common rain-use efficiency. Nature 2004, 429, 651–654. [Google Scholar] [CrossRef] [PubMed]
- Lauenroth, W.K.; Paruelo, B. Patterns of production and precipitation-use efficiency of winter wheat and native grasslands in the central great plains of the United States. Ecosystems 2000, 3, 344–351. [Google Scholar] [CrossRef]
- Paruelo, J.M.; Lauenroth, W.K.; Burke, I.C.; Sala, O.E. Grassland precipitation-use efficiency varies across a resource gradient. Ecosystems 1999, 2, 64–68. [Google Scholar] [CrossRef]
- Zhang, X.K.; Du, X.D.; Zhu, Z.M. Effects of precipitation and temperature on precipitation use efficiency of alpine grassland in northern Tibet, China. Sci. Rep. 2020, 10, 20309. [Google Scholar] [CrossRef]
- Khan, R.S.; Bhuiyan, M.A.E. Artificial Intelligence-Based Techniques for Rainfall Estimation Integrating Multisource Precipitation Datasets. Atmosphere 2021, 12, 1239. [Google Scholar] [CrossRef]
- Derin, Y.; Yilmaz, K.K. Evaluation of multiple satellite-based precipitation products over complex topography. J. Hydrometeorol. 2014, 15, 1498–1516. [Google Scholar] [CrossRef] [Green Version]
- Mei, Y.W.; Nikolopoulos, E.I.; Anagnostou, E.N.; Borga, M. Evaluating satellite precipitation error propagation in runoff simulations of mountainous basins. J. Hydrometeorol. 2016, 17, 1407–1423. [Google Scholar] [CrossRef]
- Chen, T.; Bao, A.M.; Jiapaer, G.; Guo, H.; Zheng, G.; Jiang, L.; Chang, C.; Tuerhanjiang, T. Disentangling the relative impacts of climate change and human activities on arid and semiarid grasslands in Central Asia during 1982–2015. Sci. Total Environ. 2019, 653, 1311–1325. [Google Scholar] [CrossRef]
- Yu, G.R.; Song, X.; Wang, Q.F.; Liu, Y.F.; Guan, D.X.; Yan, J.H.; Sun, X.M.; Zhang, L.M.; Wen, X.F. Water use efficiency of forest ecosystems in eastern China and its relations to climatic variables. New Phytol. 2008, 177, 927–937. [Google Scholar] [CrossRef]
- Li, H.X.; Liu, G.H.; Fu, B.J. Spatial variations of rain-use efficiency along a climate gradient on the Tibetan Plateau: A satellite-based analysis. Int. J. Remote Sens. 2013, 34, 7487–7503. [Google Scholar] [CrossRef]
- Cramer, W.; Kicklighter, D.W.; Bondeau, A.; Iii, B.M.; Churkina, G.; Nemry, B.; Ruimy, A.; Schloss, A.L. The Participants of the Potsdam NPP Model Intercomparison, Comparing global models of terrestrial net primary productivity (NPP): Overview and key results. Glob. Chang. Biol. 1999, 5 (Suppl. S1), 1–15. [Google Scholar] [CrossRef]
- McGuire, A.D.; Melillo, J.M.; Kicklighter, D.W.; Joyce, L.A. Equilibrium Responses of Soil Carbon to Climate Change: Empirical and Process-Based Estimates. J. Biogeogr. 1995, 22, 785–796. [Google Scholar] [CrossRef]
- Piao, S.L.; Fang, J.Y.; Guo, Q.H. Application of casa model to the estimation of Chinese terrestrial net primary productivity. Acta Phytoecol. Sin. 2001, 25, 603–608. (In Chinese) [Google Scholar]
- Turner, D.P.; Ritts, W.D.; Cohen, W.B.; Gower, S.T.; Running, S.W.; Zhao, M.S.; Costa, M.H.; Kirschbaum, A.A.; Ham, J.M. Evaluation of MODIS NPP and GPP products across multiple biomes. Remote Sens. Environ. 2006, 102, 282–292. [Google Scholar] [CrossRef]
- Zhang, Q.; Yang, J.H.; Wang, W.; Ma, P.L.; Lu, G.Y.; Liu, X.Y.; Yu, H.P.; Fang, F. Climatic Warming and Humidification in the Arid Region of Northwest China: Multi-Scale Characteristics and Impacts on Ecological Vegetation. J. Meteor. Res. 2021, 35, 113–127. [Google Scholar] [CrossRef]
- Li, Z.; Yan, Z.W. Homogenized China daily mean/maximum/mini-mum temperature series 1960–2008. Atmos. Ocean. Sci. Lett. 2009, 2, 237–243. [Google Scholar]
- Zhang, Y. Energy and Water Budget of a Poplar Plantation in Suburban Beijing; Beijing Forestry University: Beijing, China, 2010. (In Chinese) [Google Scholar]
- Zhu, G.F.; Lu, L.; Su, Y.H.; Wang, X.F.; Cui, X.; Ma, J.Z.; Zhang, K.; Li, C.B. Energy flux partitioning and evapotranspiration in a sub-alpine spruce forest ecosystem. Hydrol. Process. 2014, 28, 5093–5104. [Google Scholar]
- Wang, Z.Y. Energy Balance and Water Vapor Flux of Snail Control and Schistosomiasis Prevention Forests Ecosystem in Yangtze River Beach Land; Chinese Academy of Forestry: Beijing, China, 2008. (In Chinese) [Google Scholar]
- Wilske, B.; Lu, N.; Wei, L.; Chen, S.P.; Zha, T.G.; Liu, C.F.; Xu, W.T.; Noormets, A.; Huang, J.H.; Wei, Y.F.; et al. Poplar plantation has the potential to alter the water balance in semiarid Inner Mongolia. J. Environ. Manag. 2009, 90, 2762–2770. [Google Scholar] [CrossRef]
- Guo, L. The Variations of Water Use Efficiency and Evapotranspiration over a Plantation in Southern Part of Hilly Areas of North-China Master; Chinese Academy of Forestry: Beijing, China, 2010. (In Chinese) [Google Scholar]
- Lin, Y.; Wang, G.X.; Guo, J.Y.; Sun, X.Y. Quantifying evapotranspiration and its components in a coniferous subalpine forest in Southwest China. Hydrol. Process. 2012, 26, 3032–3040. [Google Scholar] [CrossRef]
- Han, S.; Huang, L.L.; Wang, Z.Y.; Wei, Y.; Zhang, X.D. Ecosystem respiration and its controlling factors in the riparian wetland of Yangtze River. Acta Ecol. Sin. 2009, 29, 3621–3628. (In Chinese) [Google Scholar]
- Wang, W.Z.; Zhao, Z.H.; Kang, W.X.; Tian, D.L.; Xiang, W.H.; Yan, W.D. Characteristics of latent heat flux over Cunninghamia lanceolata plantations in Huitong county. J. Cent. South Univ. Fores. Tech. 2011, 31, 192–197. (In Chinese) [Google Scholar]
- Cui, S. Study on the CO2 Flux of a Larch Plantation in NE China by the Micrometeorological Method; Northeast Forestry University: Harbin, China, 2007. (In Chinese) [Google Scholar]
- Liu, S.M.; Xu, Z.W.; Zhu, Z.L.; Jia, Z.Z.; Zhu, M.J. Measurements of evapotranspiration from eddy-covariance systems and large aperture scintillometers in the Hai River Basin, China. J. Hydrol. 2013, 487, 24–38. [Google Scholar] [CrossRef]
- Lin, E.J.; Jiang, H.; Chen, Y.F. Water vapor flux variation and net radiation for a Phyllostachys violascens stand in Taihuyuan. J. Zhejiang Agric. For. Univ. 2013, 30, 313–318. (In Chinese) [Google Scholar]
- Dong, G.; Guo, J.X.; Chen, J.Q.; Sun, G.; Gao, S.; Hu, L.J.; Wang, Y.L. Effects of spring drought on carbon sequestration, evapotranspiration and water use efficiency in the Songnen meadow steppe in Northeast China. Ecohydrology 2011, 4, 211–224. [Google Scholar] [CrossRef]
- Chen, S.P.; Chen, J.Q.; Lin, G.H.; Zhang, W.L.; Miao, H.X.; Wei, L.; Huang, J.H.; Han, X.G. Energy balance and partition in Inner Mongolia steppe ecosystems with different land use types. Agric. For. Meteorol. 2009, 149, 1800–1809. [Google Scholar] [CrossRef]
- Gu, S.; Tang, Y.H.; Cui, X.Y.; Du, M.Y.; Zhao, L.; Li, Y.Q.; Xu, S.X.; Zhou, H.K.; Kato, T.; Qi, P.T.; et al. Characterizing evapotranspiration over a meadow ecosystem on the Qinghai-Tibetan Plateau. J. Geophys. Res. 2008, 113, D08118. [Google Scholar] [CrossRef]
- Shao, C.L.; Chen, J.Q.; Li, L.H. Grazing alters the biophysical regulation of carbon fluxes in a desert steppe. Environ. Res. Lett. 2013, 8, 025012. [Google Scholar] [CrossRef]
- Wang, Y.L.; Zhou, G.S.; Wang, Y.H. Environmental effects on net ecosystem CO2 exchange at half-hour and month scales over Stipa krylovii steppe in northern China. Agric. For. Meteorol. 2008, 148, 714–722. [Google Scholar] [CrossRef]
- Liu, H.Z.; Feng, J.W. Seasonal and interannual variations of evapotranspiration and energy exchange over different land surfaces in a semi-arid area of China. J. Appl. Meteorol. Climatol. 2012, 51, 1875–1888. [Google Scholar]
- Yue, P.; Zhang, Q.; Zhang, L. Biometeorological effects on carbon dioxide and water-use efficiency within a semiarid grassland in the Chinese Loess Plateau. J. Hydrol. 2020, 590, 125520. [Google Scholar] [CrossRef]
- Wang, W.Z.; Xu, Z.W.; Liu, S.M.; Li, X.M.; Ma, M.G.; Wang, J.M. The characteristics of heat and water vapor fluxes over different surfaces in the Heihe River Basin. Adv. Earth Sci. 2009, 24, 714–723. (In Chinese) [Google Scholar]
- Liu, K. Multi-Time Scale Characteristics of Evapotranspiration of Artificial Caragana Korshinskii Forests in Desert Steppe; Ningxia University: Yinchuan, China, 2018. (In Chinese) [Google Scholar]
- Liu, R.; Li, Y.; Wang, Q.X. Variations in water and CO2 fluxes over a saline desert in western China. Hydrol. Process. 2012, 26, 513–522. [Google Scholar] [CrossRef]
- Zhang, F.; Zhou, G.S.; Wang, Y.; Yang, F.L.; Nilsson, C. Evapotranspiration and crop coefficient for a temperate desert steppe ecosystem using eddy covariance in Inner Mongolia, China. Hydrol. Process. 2012, 26, 379–386. [Google Scholar] [CrossRef]
- Li, J.M.; Cai, H.; Cheng, Q.; Qiao, C.L.; Chu, H.; Chen, D.D.; Xu, S.X.; Zhao, X.Q.; Zhao, L. Characterizing the evapotranspiration of a degraded grassland in the Sanjiangyuan Region of Qinghai province. Acta Pratacult. Sin. 2012, 21, 223–233. (In Chinese) [Google Scholar]
- Wu, J.K.; Chen, J.W.; Wu, H.; Zhang, S.Q.; Gao, M.J.; Qin, H. Comparative study of evapotranspiration in an alpine meadow in the upper reach of Shulehe River Basin. Sci. Geogr. Sin. 2013, 33, 97–103. (In Chinese) [Google Scholar]
- Yang, F.L.; Zhang, Q.; Wang, R.Y.; Wang, S.; Yue, P.; Wang, H.L.; Zhao, H. Characteristics of evapotranspiration and crop coefficient of agroecosystems in semi-arid area of Loess Plateau, Northwest China. Chin. J. Appl. Ecol. 2013, 24, 1209–1214. (In Chinese) [Google Scholar]
- Zhou, G.S.; Wang, Y.; Zhou, L. Dynamics of carbon budgets in typical corn and rice ecosystems in Liaohe delta. In Proceedings of the Low Carbon Agriculture Symposium, Beijng, China, 17 June 2010; pp. 265–271. (In Chinese). [Google Scholar]
- Chen, H.; Huang, J.H. Study on in-situ evapotranspiration measurement and its influential factors in farmland in Southern China. Water Resour. Prot. 2017, 33, 79–86. (In Chinese) [Google Scholar]
- Wu, C.; Wang, G.Q.; Hao, Z.C.; Gu, Y.; Liu, P.Y.; Yang, Q.L. Study on the variation regulation and influencing factors of farmland evapotranspiration in gully region of Changwu tableland. J. Water Res. Water Eng. 2017, 28, 37–42. (In Chinese) [Google Scholar]
- Guo, C.M.; Ren, J.Q.; Zhang, T.L.; Yu, H. Dynamic Change of Evapotranspiration and Influenced Factors in the Spring Maize Field in Northeast China. Chin. J. Agrometeorol. 2016, 37, 400–407. (In Chinese) [Google Scholar]
- Guo, Y.D.; Song, C.C.; Zhang, J.S.; Wang, L.L.; Sun, L. Influence of wetland reclamation on land-surface energy exchange and evapotranspiration in the Sanjiang plain, Northeast China. Agric. For. Meteorol. 2021, 296, 108214. [Google Scholar] [CrossRef]
- Zhou, L.; Zhou, G.S.; Liu, S.S.; Sui, X.H. Seasonal contribution and interannual variation of evapotranspiration over a reed marsh (Phragmites australis) in Northeast China from 3−year eddy covariance data. Hydrol. Process. 2010, 24, 1039–1047. [Google Scholar] [CrossRef]
- Guo, H.Q.; Noormets, A.; Zhao, B.; Chen, J.Q.; Sun, G.; Gu, Y.J.; Bo, L.; Chen, J.K. Tidal effects on net ecosystem exchange of carbon in an estuarine wet-land. Agric. For. Meteorol. 2009, 149, 1820–1828. [Google Scholar] [CrossRef]
- Yan, G.Y. Tidal Influence on Energy Balance and Evapotranspiration of Mangrove Ecosystem in Subtropical Area; Xiamen University: Xiamen, China, 2012. (In Chinese) [Google Scholar]
- Chen, H.; Lu, W.Z.; Yan, G.; Yang, S.; Lin, G.H. Typhoons exert significant but differential impacts on net ecosystem carbon exchange of subtropical mangrove forests in China. Biogeosciences 2014, 11, 5323–5333. [Google Scholar] [CrossRef] [Green Version]
- Rodell, M.; Houser, P.R.; Jambor, U.; Gottschalck, J.; Mitchell, K.; Meng, C.J.; Arsenault, K.; Cosgrove, B.; Radkovich, J.; Bosilovich, M.; et al. The Global Land Data Assimilation System. Bull. Amer. Meteor. Soc. 2004, 85, 381–394. [Google Scholar] [CrossRef] [Green Version]
- Lieth, H.; Box, E. Evapotranspiration and primary production. In Thornthwaite W Memorial Model; Publications in Climatology; C.W. Thornthwaite Associates: Centerton-Elmer, NJ, USA, 1972; Volume 25, pp. 37–46. [Google Scholar]
- Zhou, G.S.; Zhang, X.S. A Natural Vegetation NPP Model. Chin. J. Plan. Ecolo. 1995, 19, 193–200. (In Chinese) [Google Scholar]
- Wang, K.C.; Dickinson, R.E. A review of global terrestrial evapotranspiration: Observation, modeling, climatology, and climatic variability. Rev. Geophys. 2012, 50, RG2005. [Google Scholar] [CrossRef]
- Zhang, K.; Kimball, J.S.; Running, S.W. A review of remote sensing based actual evapotranspiration estimation. WIREs Water 2016, 3, 834–853. [Google Scholar] [CrossRef]
- Allen, R.G.; Pereira, L.S.; Rees, D.; Smith, M. Crop evapotranspiration—Guidelines for computing crop water requirements. In Irrigation and Drainage; FAO: Rome, Italy, 1998; pp. 15–28. [Google Scholar]
- McCuen, R.H. A sensitivity and error analysis of procedures used for estimating evaporation. Water. Res. Bull. 1974, 10, 486–498. [Google Scholar] [CrossRef]
- Zhang, Q.; Yang, Z.S.; Hao, X.C.; Yue, P. Conversion features of evapotranspiration responding to climate warming in transitional climate regions in northern China. Clim. Dyn. 2019, 52, 3891–3903. [Google Scholar] [CrossRef]
- Wang, W.; Cui, W.; Wang, X.J.; Chen, X. Evaluation of GLDAS−1 and GLDAS−2 Forcing Data and Noah Model Simulations over China at the Monthly Scale. J. Hydrometeorol. 2016, 17, 2815–2833. [Google Scholar] [CrossRef]
- Zhang, M.L.; Lai, R.; Zhao, Y.Y.; Jiang, W.L.; Chen, Q.G. Estimating net primary production of natural grassland and its spatio-temporal distribution in China. Sci. Total Environ. 2016, 553, 184–195. [Google Scholar] [CrossRef] [PubMed]
- Churkina, G.; Running, S.W.; Schloss, A.L. The Participants of the Potsdam NPP Model Intercomparison, Comparing global models of terrestrial net primary productivity (NPP): The importance of water availability. Glob. Chang. Biol. 1999, 5 (Suppl. S1), 46–55. [Google Scholar] [CrossRef]
- Fu, C.B.; Dan, L.; Feng, J.M.; Peng, J.; Ying, N. Temporal and spatial variations of total cloud amount and their possible relationships with temperature and water vapor over China during 1960 to 2012. Chin. J. Atmos. Sci. 2019, 43, 87–98. (In Chinese) [Google Scholar]
- Heinsch, F.A.; Zhao, M.S.; Running, S.W.; Kimball, J.S.; Nemani, R.R.; Davis, K.J.; Bolstad, P.V.; Cook, B.D.; Desai, A.R.; Ricciuto, D.M.; et al. Evaluation of remote sensing based terrestrial productivity from MODIS using regional tower eddy flux network observations. IEEE Trans. Geosci. Remote Sens. 2006, 44, 1908–1925. [Google Scholar] [CrossRef] [Green Version]
- Xu, X.C.; Zhang, X.Z.; Dai, E.F.; Song, W. Research of trend variability of precipitation intensity and their contribution to precipitation in China from 1961 to 2010. Geogr. Res. 2014, 33, 1335–1347. (In Chinese) [Google Scholar]
- Du, J.Q.; Shu, J.M.; Zhang, L.B. Analysis of ecosystem degradation and recovery using precipitation use efficiency and NDVI in the headwater catchment of the Yellow River basin. Acta Ecol. Sin. 2012, 32, 3404–3413. (In Chinese) [Google Scholar]
- Liang, F.; Xia, X.A. Long-term trends in solar radiation and the associated climatic factors over China for 1961–2000. Ann. Geophys. 2005, 23, 2425–2432. [Google Scholar] [CrossRef] [Green Version]
- Budyko, M.I. The Heat Balance of the Earth’s Surface; Stepanova, N.A., Translator, Eds.; United States Department of Commerce: Washington, DC, USA, 1958; 259p. (In Russian) [Google Scholar]
- Fu, B.P. On the calculation of the evaporation from land surface. Sci. Atmos. Sin. 1981, 5, 23–31. (In Chinese) [Google Scholar]
- Zhang, L.; Dawes, W.R.; Walker, G.R. Response of mean annual evapotranspiration to vegetation changes at catchment scale. Water Resour. Res. 2001, 37, 701–708. [Google Scholar] [CrossRef]
- Yang, D.F.; Sun, Z.B.; Liu, Z.Y.; Cong, Z.T.; Ni, G.H.; Lei, Z.D. Analyzing spatial and temporal variability of annual water-energy balance in nonhumid regions of China using the Budyko hypothesis. Water Resour. Res. 2007, 43, W04426. [Google Scholar] [CrossRef]
- Gherardi, L.A.; Sala, O.E. Enhanced precipitation variability decreases grass and increases shrub-productivity. Proc. Natl. Acad. Sci. USA 2015, 112, 12735–12740. [Google Scholar] [CrossRef] [PubMed] [Green Version]
- Knapp, A.K.; Fay, P.A.; Blair, J.M.; Collins, S.L.; Smith, M.D.; Carlisle, J.D.; Harper, C.W.; Danner, B.T.; Lett, M.S.; McCarron, J.K. Rainfall variability, carbon cycling, and plant species diversity in a mesic grassland. Science 2002, 298, 2202–2205. [Google Scholar] [CrossRef] [PubMed] [Green Version]
- Huang, J.J.; Zhang, Q.; Zhang, S.; Chen, X.H. Information entropy-based analysis of spatial and temporal variation in precipitation in Xinjiang. Acta Ecol. Sin. 2017, 37, 4444–4455. (In Chinese) [Google Scholar]
- Yang, J.H.; Zhang, Q.; Lu, G.Y.; Liu, X.Y.; Wang, D.W.; Liu, W.P.; Yue, P.; Zhu, B. Climate Transition from Warm-dry to Warm-wet in Eastern Northwest China. Atmosphere 2021, 12, 548. [Google Scholar] [CrossRef]
- Ahlstrom, A.; Raupach, M.R.; Schurgers, G.; Smith, B.; Arneth, A.; Jung, M.; Reichstein, M.; Canadell, J.G.; Friedlingstein, P.; Jain, A.K.; et al. The dominant role of semi-arid ecosystems in the trend and variability of the land CO2 sink. Science 2015, 348, 895–899. [Google Scholar] [CrossRef] [Green Version]
- Cong, Z.T.; Yang, D.W.; Ni, G.H. Does evaporation paradox exist in China? Hydrol. Earth Syst. Sci. 2008, 13, 357–366. [Google Scholar] [CrossRef] [Green Version]
- Brutsaert, W.; Parlange, M.B. Hydrologic cycle explains the evaporation paradox. Nature 1998, 396, 30. [Google Scholar] [CrossRef]
- Zhang, Q.; Yang, Z.S.; Hao, X.C.; Yue, P. Transition features of surface evapotranspiration responding to climate warming with spatial precipitation–based climate type in Northern China. Chin. Sci. Bull. 2018, 63, 1035–1049. (In Chinese) [Google Scholar] [CrossRef] [Green Version]
- Liu, Y.Y.; Yue, Y.; Wang, Q.; Du, X.L.; Li, J.L.; Gang, C.C.; Zhou, W.; Wang, Z.Q. Evaluating the responses of net primary productivity and carbon use efficiency of global grassland to climate variability along an aridity gradient. Sci. Total Environ. 2019, 652, 671–682. [Google Scholar] [CrossRef]
- Sun, L.; Shen, B.Z.; Sui, B.; Huang, B.H. The influences of East Asian Monsoon on summer precipitation in Northeast China. Clim. Dyn. 2017, 48, 1647–1659. [Google Scholar] [CrossRef]
Publisher’s Note: MDPI stays neutral with regard to jurisdictional claims in published maps and institutional affiliations. |
© 2022 by the authors. Licensee MDPI, Basel, Switzerland. This article is an open access article distributed under the terms and conditions of the Creative Commons Attribution (CC BY) license (https://creativecommons.org/licenses/by/4.0/).

