Abstract
Drought is a major natural disaster that causes a reduction in rain-fed maize yield. Agricultural drought risk assessment is conducive to improving regional disaster management ability, thereby reducing food security risks and economic losses. Considering the complexity of risk assessment research, an increasing number of researchers are focusing on the multiple-criteria decision-making (MCDM) method. However, the applicability of the MCDM method to agro-meteorological disaster risk assessments is not clear. Therefore, this study comprehensively evaluated hazard, exposure, vulnerability, and emergency response and recovery capability using the TOPSIS and VIKOR models to generate a maize drought risk map in mid-western Jilin Province and ranked the drought risk of each county. The results showed that: (1) maize drought risk in the middle and west of Jilin province showed an increasing trend. Spatially, the risk diminished from west to east. The drought risks faced by Tongyu, Changchun, and Dehui were more severe; (2) the evaluation results of the two models were verified using the yield reduction rate. The VIKOR model was found to be more suitable for agrometeorological drought risk assessments; (3) according to the damage degree of drought disaster to maize, the cluster analysis method was used to divide the study area into three sub-regions: safe, moderate drought, and severe drought. Combined with the characteristics of different regions, suggestions on disaster prevention and mitigation are proposed. The results of this study can provide a basis for formulating strategies to alleviate drought, reduce losses, and ensure the sustainable development of agriculture.
1. Introduction
The impact of global warming on the ecological environment cannot be ignored [1,2,3]. The increase in temperature leads to an increase in evaporation and an uneven distribution of local precipitation, which further increases the uncertainty of regional drought [4,5,6,7,8,9]. Agriculture is highly susceptible to drought, which leads to crop reduction and threatens food security and economic development [10,11]. Most areas in China belong to the Asian monsoon climatic zone and witness a high frequency of drought due to the land-sea distribution and topographic factors [12,13,14,15]. The occurrence of drought shows significant regional differences, particularly in the north [16,17,18].
Midwestern Jilin Province is the main agricultural and animal husbandry production area in the Jilin Province. It is also an eco-environment-vulnerable area in northern China. According to published statistics, 90 droughts occurred in the Jilin Province from 1720 to 2000. Drought occurred more frequently in midwestern Jilin Province, and the area affected by drought was larger and more severe. From 1950 to 2000, the average multi-year drought-afflicted areas were 5333 km2 in the Jilin Province and 4887 km2 in the midwestern Jilin Province. For this major maize-producing area of China, drought has caused substantial losses to the maize industry and economic life in midwestern Jilin Province. Therefore, it is necessary to strengthen the monitoring and evaluation of droughts and provide scientific and reasonable disaster prevention and mitigation decisions for the government.
Several indicators are used to quantify the intensity, frequency, and duration of drought. The main categories are: (1) precipitation indicators: Palmer Drought Severity Index (PDSI) [19,20], Standardized Precipitation Index (SPI) [21,22,23]. (2) soil moisture indicators: Soil Moisture Drought Index (SSMI) [24], Soil Moisture Anomaly Percentage Index (SMAPI) [25], Soil Moisture Deficit Index (SMDI) [26], Soil Moisture Evapotranspiration Index (SMEI) [27]. (3) crop physiological and ecological indicators: Crop Water Stress Index (CWSI) [28,29], Crop Water Deficit Index (CWDI) [30,31]. (4) composite drought index: Comprehensive Agricultural Drought Index (CADI) [32], Integrated Surface Drought Index (ISDI) [33].
In recent years, with the deepening of our understanding of droughts, several researchers have conducted extensive research on maize drought risk assessment. Zhang et al. built a dynamic drought risk assessment model (DDRA) of maize in different growth stages based on risk assessment theory and used the CERES-Maize model to build a vulnerability curve [34]. Wang et al. used the APSIM crop model to evaluate drought risk during the growing season of spring maize in Liaoning Province and predict yield [35]. Zhu et al. used the AquaCrop model to simulate water stress and yield of maize under different irrigation scenarios and determined four drought risk levels in the main maize-producing areas [36]. Owing to the complexity and comprehensiveness of agro-meteorological disasters, risk assessment has been transformed into a multi-criteria decision analysis (MCDA) problem. Currently, several MCDA methods exist. Such as AHP (Analytic Hierarchy Process), ANP (Analytic Network Process), VIKOR (VIseKriterijumska Optimizacija Kompromisno Resenje), TOPSIS (Technique for Order of Preference by Similarity to Ideal Solution), MOORA (Multiobjective Optimization On the basis of Ratio Analysis), etc. [37,38,39,40,41].
Among them, TOPSIS and VIKOR are less complex, provide more accurate results, and are widely used [42,43,44,45,46]. One of the differences between the two is in the aggregate function. TOPSIS is a set of distances from ideal solutions. VIKOR proposed a scheme with a dominant ratio based on TOPSIS. In TOPSIS, it is necessary to consider not only the shortest distance to the positive ideal solution but also the longest distance to the negative ideal solution to determine the optimal solution [47,48]. However, these distances in TOPSIS are simply summed without considering their relative importance [49,50]. In VIKOR, decision-makers determine their importance according to their own needs [51]. In addition, compared with TOPSIS, VIKOR has an additional decision mechanism coefficient, which enables decision-makers to make radical or conservative decisions [52,53]. The TOPSIS process does not incorporate any subjective factors and is more suitable for a decision-making environment that requires completely objective results [54]. Finally, there are differences in the scheme order. The unique advantage of VIKOR is the availability of trade-offs with options with more than one optimum solution. TOPSIS can only obtain a single optimal solution as its process is objective.
TOPSIS and VIKOR have been used in drought risk assessment [55], flood disaster assessment [56], debris flow loss degree, post-disaster reconstruction and restoration assessment [57], fire susceptibility assessment [58], and water supply vulnerability assessment [59]. However, there are relatively few studies on their application in agrometeorological risk assessments. Thus, our aims were: (1) construct a maize drought risk evaluation indicator system; (2) generate the spatial distribution map of maize drought risk in mid-western Jilin Province through TOPSIS and VIKOR models; and (3) validate the results of the assessment for reasonableness and drought risk zoning. The results of this study were intended to provide guidance for drought management and contribute to drought mitigation. The assessment of maize drought risk in midwestern Jilin Province can provide a methodology for application in other regions of China (and other countries).
2. Study Area and Data Sources
Jilin Province is located in the ‘‘Golden Corn Belt,’’ and has topped the national list in terms of per capita grain holdings and grain commodity rates for many years. Approximately 70% of farmers and more than 65% of cultivated land in the province grew maize, which accounts for more than 70% of the province’s grain output. Midwestern Jilin Province is located southwest of Songnen Plain, the western area of the Inner Mongolia Autonomous Region, the northern part of Heilongjiang Province, and the eastern part of Horqin grassland (43°17′–46°18′N, 121°38′–127°56′E) (Figure 1). The central part of Jilin Province includes Changchun, Jilin, and Liaoyuan provinces. The western part included the cities of Baicheng, Songyuan, and Siping.
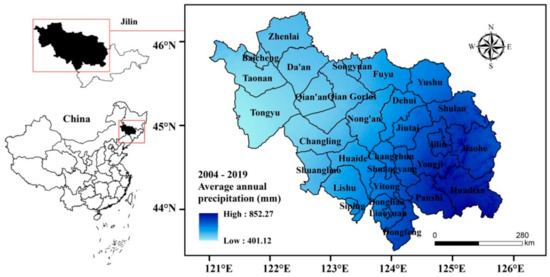
Figure 1.
Location of the study area.
The data used in this study are shown in Table 1.

Table 1.
Data and indicators used in this study.
3. Methodology
Figure 2 illustrates the methodological framework of this study.
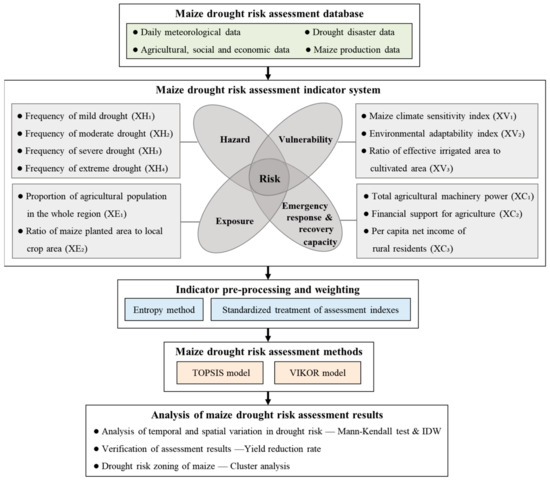
Figure 2.
The methodological framework of this study.
3.1. Establishing a Maize Drought Risk Assessment Index System
3.1.1. Normalization of Assessment Indicators and Calculation of Weights
Entropy Method
Entropy is a measure of the degree of disorder in a system and can be used to measure the amount of valid information contained in known data and to determine weights [60,61,62,63].
Step 1: Normalization. Based on the data of n risk evaluation indicators in the y evaluation series, a matrix can be constructed as .
Step 2: Normalize matrix X according to the following rules to obtain the normalized matrix: .
where and are the most and least appropriate values for the same indicator for different evaluation units, respectively.
Step 3: The entropy of the evaluation indicator can be determined as ().
Step 4: The weight value can be obtained ():
Standardized Treatment of the Evaluation Indices
To eliminate the negative impact of inconsistencies in the calculation of each indicator, it is necessary to standardize each indicator before risk assessment [64].
where R is the normalized index value, is the assessment indicator, is the maximum value in the sequence, and is the minimum value in the sequence. Equation (5) is suitable for positive impact indicators; the higher the value of the indicator, the greater the risk. Conversely, Equation (6) is appropriate for the inverse impact indicator.
3.1.2. Selection and Treatment of Assessment Indicators
Hazard Indicators
Drought is caused when the external water supply is unable to meet the crop’s demand for water. The crop water deficit index (CWDI) has been recognized as an index to characterize agricultural drought [31]:
where, is the stage i drought index, is the stage i crop water deficit index, and is the effective precipitation, which can be calculated by the following formula:
is the total amount of precipitation (mm) for a given precipitation event and is the effective use factor. .
ETc is the water requirement of maize (mm), and is obtained by multiplying the reference evapotranspiration () by the crop coefficient ():
: Sowing-Jointing = 0.378, Jointing-Tasseling = 0.689, Tasseling-Milk-Ripe = 1.185, Milk-Ripe-Maturity = 0.759.
was calculated using the Penman-Monteith equation recommended by the Food and Agriculture Organization of the United Nations (FAO) in 1998 as follows [65,66,67]:
where is the net radiation available at the crop surface (MJ/m2), Δ is the slope of the vapour pressure curve (kPa/°C), is the average temperature (°C), () is the vapour pressure deficit (k Pa), is the psychometric constant (kPa/°C), and is the wind speed at a height of 2 m (m/s).
According to the drought grade classification (Table 2), we calculated the annual average CWDI of maize in each county year by year and determined the frequency of normal, mild, moderate, severe, and extreme drought during the entire growth period, which was used as the hazard index.
Table 2.
Grades of maize drought in different periods based on crop water deficit index (CWDI).
Exposure Indicators
T the larger the proportion of the agricultural population in the whole region (XE1), the more widespread the impact of a drought and the more people who suffer losses. In addition, the income level and economic value created by the agricultural population are low, and less capital is available to invest after a disaster. Therefore, the greater the proportion of the population living in agriculture, the higher the exposure and risk of drought. At the same time, the ratio of the maize planted area to the local crop area (XE2) can be used to characterize the degree of exposure of hazard-bearing bodies. The larger the value, the more hazard-bearing bodies are exposed to drought risk and the greater the potential losses that may be incurred.
Vulnerability Indicators
Vulnerability indicates the degree of loss of disaster-bearing bodies owing to potential risks, and the vulnerability index of disaster-bearing bodies should indicate the degree of loss and regional differences in crop yield affected by meteorological disasters [68,69].
① Maize climate sensitivity index (XV1):
where, is the climate sensitivity index, is the actual evapotranspiration, is the maximum evapotranspiration, is the actual yield of the year (kg/hm2), and is the climate productivity (kg/hm2), which can be calculated using the step-by-step “decay” method:
where is the photosynthetic production potential per unit area (kg/hm2) (Equation (13)). is the temperature stress factor, which was corrected using the subsection temperature correction function formula (Equation (14)). is the water stress factor, which indicates the influence of water factors on potential crop production (Equation (15)).
where is the unit conversion coefficient (10,000), is the total radiation for each month of the growing season (MJ/m2), is the daily average temperature (°C), P is the effective precipitation (mm), and is the maximum evapotranspiration. The meanings and values of other parameters are listed in Table 3.
Table 3.
Meaning and values of the parameters for calculating photosynthetic production potential.
② Environmental adaptability index (XV2):
where is the environmental adaptation index, is the average growth period of maize in a certain area, and is the current year’s maize fertility length. By calculating fluctuations in fertility length, it is possible to determine the degree of adaptation of the crop to the local climatic environment. The greater the fluctuation, the less adaptable it is, and the better the adaptability.
③ Ratio of the effective irrigated area to cultivated area (XV3): Effective irrigated area refers to the area of cultivated land that can be irrigated normally during a normal year. It is necessary to have a certain water source, relatively flat land, irrigation engineering, and equipment. The higher the value, the lower the vulnerability to drought. This shows that the smaller the area of rain-fed agriculture, the more drought could be alleviated by irrigation.
Emergency Response and Recovery Capability Indicators
The ability of emergency response and recovery refers to the extent to which the affected areas can recover from short-and long-term meteorological disasters, including emergency management capabilities, disaster mitigation inputs, and resource preparedness. The better the disaster prevention and mitigation capacity, the higher the level of agricultural modernization, and the less adverse natural conditions that affect agricultural production.
① Total agricultural machinery power (XC1): This is the sum of the power from the entire power machinery system, including all machinery used in agriculture, forestry, animal husbandry, and fishery, combined with other agricultural machinery. With agricultural mechanization production technology, the ineffective evaporation of soil water can be reduced to the maximum extent, and rational utilization of water resources can be promoted. The use of mechanization can not only mitigate drought, but also help conserve soil water and increase crop yield.
② Financial support for agriculture (XC2): This refers to the funds arranged within the budgets of governments at all levels to support various expenditures on agriculture and rural production, agriculture, forestry, water, and other sectoral business development.
③ Per capita net income of rural residents (XC3): This is the total final consumption expenditure and savings available to rural residents.
3.2. Calculation of the Drought Risk Index
3.2.1. TOPSIS
Hwang and Yoon proposed the TOPSIS model in 1981 [47,70]. The model calculates the distance of multiple evaluation objects from positive and negative ideal solutions. Then, according to the distance from the positive and negative ideal solutions, it obtains the relative closeness of each scheme, compares the closeness, and determines the best scheme [71,72,73]. The calculation steps are presented elsewhere [58]. Analytical diagrams of the positive and negative ideal solutions of the TOPSIS model are presented in Figure 3.
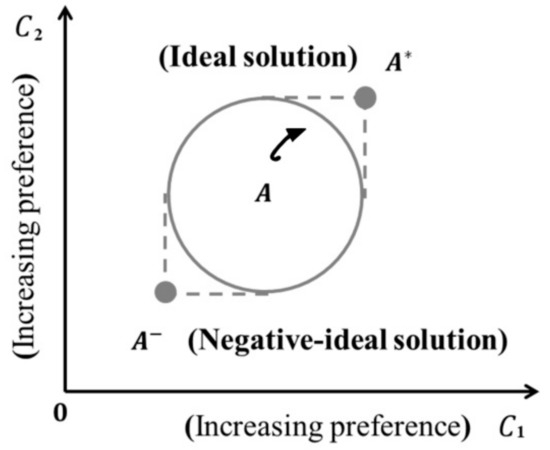
Figure 3.
The compromise solution of the TOPSIS method.
3.2.2. VIKOR
The VIKOR method is a multi-attribute decision-making method based on ideal point solutions and was proposed by Opricovic in 1998 [51,52]. The basic principle of this method is to first define positive and negative ideal solutions. Then, according to the distance between each evaluation scheme, the positive ideal scheme, and the negative ideal scheme, the VIKOR value is obtained by trade-off [74,75]. The compromise solution for the VIKOR method is shown in Figure 4.
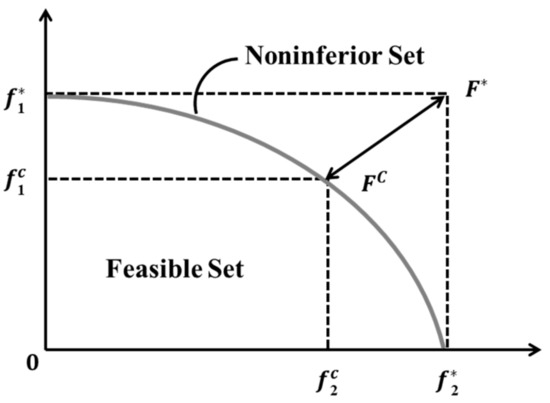
Figure 4.
The compromise solution of the VIKOR method.
In Figure 3, the compromise solutions and of VIKOR denote the ideal solutions of the first term criterion and the second term quasigroup, respectively. The feasible solution is the closest of all solutions to , and it is the result of the mutual trade-off between the two criteria, with the corresponding quantities and respectively.
3.3. Mann-Kendall Mutation Test
In this study, the M-K test was used to analyze the trend and mutation of the regional drought risk index [76,77]. The M-K test is a non-parametric statistical test, which has been recommended by the WMO for long-term meteorological trend analysis and mutation change analysis [78,79].
With n sample sizes for time series x, order sequence can be constructed as follows:
The statistics can be defined as:
where denotes the standard normal distribution. The standard normal distribution table was obtained using a significance level . If , the time sequence exhibits a significant upward or downward trend.
The time sequence was sorted in reverse order and the above process was repeated such that . The and curves were plotted. When the curve exceeds the critical line of a confidence interval, it indicates that the time sequence has a significant trend of change. When the two curves intersect and are located between the critical lines, the corresponding moment of intersection is the start time of the mutation.
3.4. Drought Risk Zoning of Maize—Cluster Analysis
In this study, systematic cluster analysis was used to divide drought risk. The Ward systematic clustering method, also known as the sum of squares method, is currently a more mature clustering method [80,81,82]. The method is based on the idea of ANOVA, using Euclidean distance as a criterion [83].
Dividing the regional samples into classes: , using to denote the j-th sample, to denote the number of samples, and as the sample mean, the sample sum of squares of deviations is:
Then the sum of squared deviations is:
3.5. Verification of Assessment Results—Yield Reduction Rate
Maize in midwestern Jilin Province is mainly cultivated by rain. The yield reduction rate reflects the extent to which regional agriculture has been affected by meteorological disasters. Therefore, the yield reduction rate was used to verify the rationality of the TOPSIS and VIKOR model assessment results.
where is the yield reduction rate, is the potential yield (kg/hm2), the yield of a given variety in a certain area without water and fertilizer restriction during the entire growth period [84,85], and is the yield under rain-fed conditions at full fertility (kg/hm2).
4. Result
4.1. Analysis of the Drought Risk Change
Figure 5 shows the trend and M-K test results of the drought risk index in midwestern Jilin Province from 2004 to 2019. Overall, the drought risk showed an increasing trend each year. For the TOPSIS model, the lowest risk value appeared in 2004, both in central and western Jilin Province. The central region had the highest risk in 2016 (0.53), and the western region had the highest risk in 2014 (0.56). The UF and UB curves crossed in 2008, indicating a sudden change in the drought risk index in 2008. According to the TOPSIS model, the average drought risk index of maize in central and western Jilin Province was 0.49 and 0.51, respectively. In contrast, the values obtained by the VIKOR model were 0.71 and 0.61, respectively, and the VIKOR result value is on the high side. For the central region, the UF and UB curves intersected in 2004, 2016, and 2017. In the western region, the intersection occurred in 2014. In this study, the years in which the drought risk index changed significantly (2004, 2008, 2012, 2016, and 2019) were further evaluated to explore the spatial distribution of drought risk in different years.
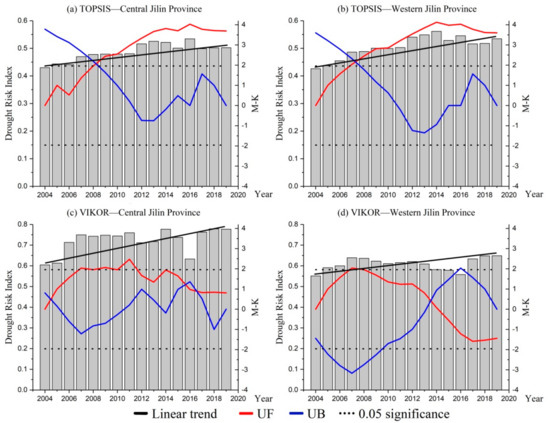
Figure 5.
Change in drought risk index and M−K test for maize in midwestern Jilin Province.
4.2. Spatial Distribution of Maize Drought Risk Based on Two Models
This study used inverse distance weight (IDW) interpolation in ArcGIS 10.2 to obtain spatial distribution maps of maize drought risk.
Figure 6 shows the spatial distribution of maize drought risk obtained by the TOPSIS model. Overall, the drought was more severe in the western and central parts of the study area. The spatial distribution of the drought risk index was broadly similar over the five-year period. High-value areas were located in Tongyu, Songyuan, Changchun, Dehui, and Siping. Except for 2004 and 2012, the risk in Baicheng was high. The eastern part of the study area is at lower risk, particularly in Jiaohe, Shulan, and Jilin. In 2016, the risk of maize drought in the study area was more severe, with the affected area covering most of Tongyu, Baicheng, and Taonan.
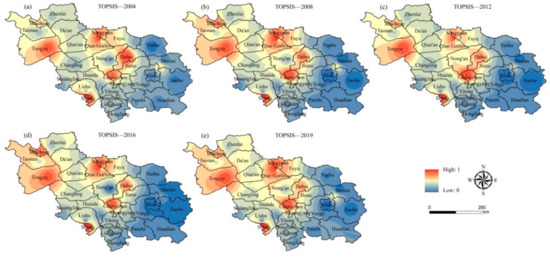
Figure 6.
Spatial distribution of drought risk based on the TOPSIS model.
The spatial distribution of drought risk in the VIKOR model was more serious than that in the TOPSIS model (Figure 7). Not only is the drought risk index value higher, but the area affected by the disaster is also wider. In 2012, most of the study areas suffered from severe drought, especially in Panshi and Dehui, with drought risk values of 0.85 and 0.89 respectively. In 2019, the drought risk was higher in the central and western regions of the study area, with the drought risk value of Tongyu reaching 0.91, followed by Baicheng (0.86) and Dehui (0.72). The risk of the drought was low in 2004, with most areas being at low risk.
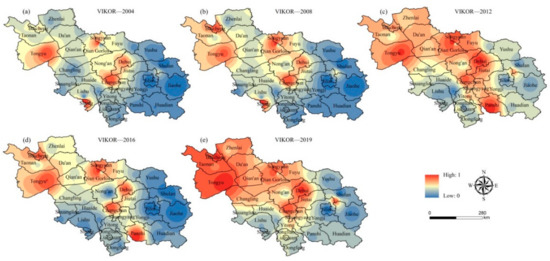
Figure 7.
Spatial distribution of drought risk based on the VIKOR model.
4.3. Comparative Analysis of Drought Risk Based on Two Models
Figure 8 shows the distribution of drought risk index density for 2004, 2008, 2012, 2016, and 2019 for each county in the study area. The VIKOR model had a more concentrated drought index distribution with a mean value of 0.67. The mean value of the TOPSIS model was 0.59. The results of the two models were relatively similar, with the high-value areas being in the order of Tongue, Changchun, and Dehui. The low-value areas were Yushu, Shulan, and Yongji. The annual average drought risk indices of the two models were substantially different between Panshi and Shuangliao.
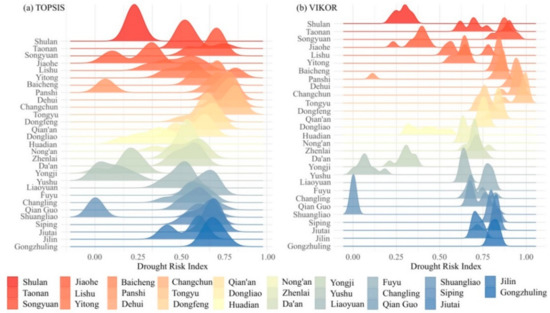
Figure 8.
Ridge plot of the drought risk index.
Figure 9 shows the top eight counties in the drought risk index. For the TOPSIS model, Tongyu had the highest drought risk, except for 2012. Siping, Changchun, Dehui, and Baicheng are also at high-risk levels. These areas have a large maize planting area, and when adverse meteorological disasters occur, the threat and loss increase. For the VIKOR model, the rankings for 2004 and 2008 were roughly the same as those for the TOPSIS model. The rankings varied considerably in 2012, with the model showing that Panshi had the highest risk of drought that year, with a risk index of 0.87. Similarly, in 2016, Panshi continued to have the highest risk of drought, followed by Qian Gorlos and Changchun. By comparing the two models, the calculation results of the two models are consistent from the ranking point of view.
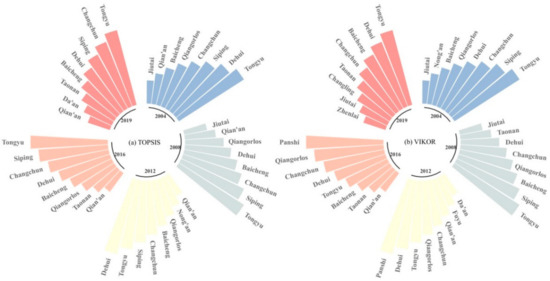
Figure 9.
Ranking of drought risk index based on TOPSIS and VIKOR model.
4.4. Validation of Risk Evaluation Results
Currently, TOPSIS and VIKOR models are rarely used in agricultural drought risk assessments. Therefore, the applicability of the two models was verified. We used the five-year maize yield reduction rate in the study area as the basis for verification. Drought alone may not be a factor in reducing maize yield in the region. There may be other factors such as poor land management practices, population changes, and changes in income levels. Rainfall is the major contributor to maize yield. By comparing Figure 6, Figure 7 and Figure 10, it was found that the spatial distribution of drought risk obtained by the VIKOR model was closer to that of the yield reduction, particularly in 2019 and 2012. In 2012, there was a wide range of maize yield reductions, with severe areas mainly in the western part of the study area, particularly in Baicheng and Zhenlai. In 2019, a large area across the central and eastern parts of the study area was in a zone of high yield reduction, particularly in Tongyu, Da’an, Qian’an, Qian Gorlos, and Shuangyang. This is consistent with the spatial distribution of drought risk obtained by the VIKOR model. Interestingly, in 2008, the maize yield reduction rate was generally low. According to historical data, there was plenty of rain and light during the growth period of maize, and the yield reached 2.1 × 10⁷ t, which was a bumper harvest of maize. However, the drought risk assessment results of the two models in 2008 were similar, and there were no disasters in most areas. After a comprehensive analysis, we believe that the VIKOR model has better applicability in maize drought risk research in midwestern Jilin Province.
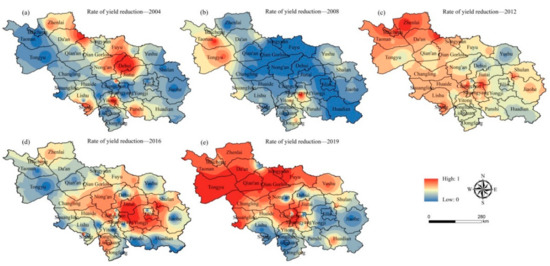
Figure 10.
Spatial distribution of maize yield reduction rates.
We further verified the applicability of the TOPSIS and VIKOR models. According to the data on maize yield reduction in midwestern Jilin Province, the drought risk index was analyzed using regression analysis. The results show that there is a linear correlation between the equations, and the results pass the F test of α = 0.05 (TOPSIS: r = 0.59, p < 0.05, VIKOR: r = 0.72, p < 0.05). The assessment results of the two models reached a significant level, which proved that the assessment of maize drought risk using the TOPSIS and VIKOR models was reasonable. Meanwhile, VIKOR was found to be more robust than TOPSIS.
Correlation analysis of TOPSIS and VIKOR was performed using the drought risk index to detect the actual interrelationships between the models. The results showed that the TOPSIS and VIKOR models have a high negative correlation (r = −0.781). It reflects the similarity of the normalization and aggregation processes between the two methods, and also improves model reliability.
5. Discussion
5.1. Analysis of Influencing Factors of Maize Drought Risk
In the study of agricultural drought risk, there is a need to obtain the temporal and spatial distribution of risk. Furthermore, it is necessary to determine the degree of influence of the different factors on drought risk. This has led to targeted recommendations for disaster prevention and mitigation. This study uses 2019 as an example and plots the chord diagram, as shown in Figure 11. The diagram is divided into upper and lower parts. The upper part indicates the drought risk assessment index, and the lower part indicates counties in the study area. Each strip points to two correlated variables, with thicker bars indicating a stronger correlation between the two variables.
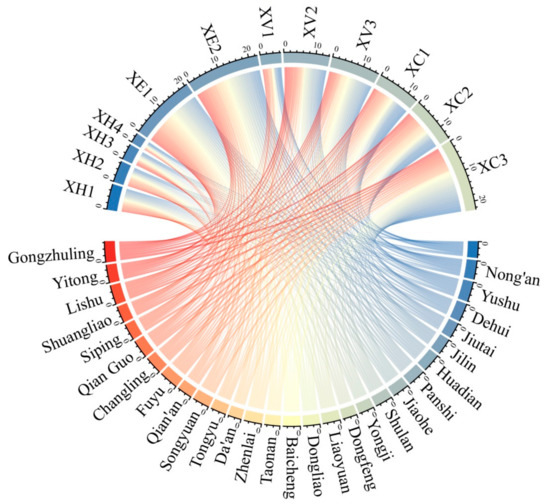
Figure 11.
Chord diagram of the relationship between the counties and the evaluation indicators.
The frequency of mild drought events had a significant impact on each county. Compared with other factors, exposure has a greater impact on drought risk, particularly on the proportion of the maize-planted area. The larger the area under maize cultivation, the more vulnerable it is to meteorological disasters. Therefore, drought monitoring and prevention should be strengthened in areas with large planting areas (such as Shulan, Zhenlai, and Yongji). Among the vulnerability indicators, the ratio of the effective irrigated area to the cultivated area is the most important. In the western part of the study area, there is less precipitation, and the ratio of effective irrigated area to cultivated area is low. Therefore, the drought risk is higher. The per capita net income of rural residents has a greater impact on disaster prevention and mitigation capacity, followed by financial support for agriculture and total agricultural machinery power. However, the economic foundation of the western region with severe drought is poor, which undoubtedly aggravates the losses caused by drought.
5.2. Recommendations for Drought Risk Management in Maize
To make recommendations on maize drought risk regulation in the study area, this study took 2019 as an example and used cluster analysis to divide the study area into three grades: maize drought risk safety, moderate drought, and severe drought. Although there are some differences between the zoning results of the two models (Figure 12), we can still propose suggestions on drought risk regulation according to the characteristics of the different zones.
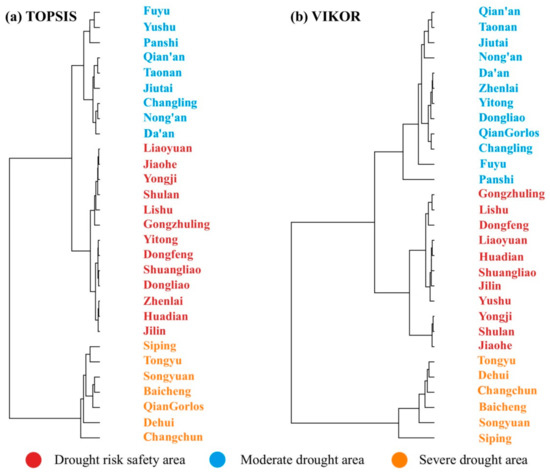
Figure 12.
Classification and zoning of maize drought risk in midwestern Jilin Province.
First, the maize drought risk safety area is mainly concentrated in the eastern part of the study area. These areas of maize planting are small, and regional economic development is better. These regions should make steady progress in reducing the risk of drought in the future and continuously strengthen the production input in all aspects by maintaining the current level. In order to maintain a balance in regional balanced, regional economic development and food security need to be promoted.
Second, the maize arid moderate drought area was concentrated in the central and western parts of the study area. These regions have large areas under maize cultivation and a high degree of maize specialization. The spatio-temporal distribution of precipitation is uneven, and droughts occur periodically. It is suggested that these areas should make full use of natural precipitation, take measures to intercept rain during the precipitation period, and increase investment in drought resistance and disaster reduction. Rational planning of maize planting areas and strengthening investments in agricultural science and technology would help achieve the same.
Most importantly, the severe maize drought area was concentrated mainly in the western part of the study area. Rainfall in summer is relatively concentrated and influenced by prevailing westerly winds and the Greater Khingan Mountains. The air sinks and warms, and evaporation intensifies. Moreover, the soil texture in the western Songliao Plain is mainly sandy loam and sandy soil, which are loose, sandy, and poor in water and fertilizer conservation. For disaster prevention and mitigation, water-saving agriculture should be strengthened, and water use efficiency should be improved. Increasing the application of agricultural fertilizers improves the physical and chemical properties and structure of the soil and increases the yield of agricultural products per unit area.
6. Conclusions
In this study, we used TOPSIS and VIKOR to evaluate the drought risk of maize in midwestern Jilin province. We employed the IPCC-based concept of risk, defining risk as a function of hazard, exposure, vulnerability, and prevention and mitigation capabilities. We selected 12 key indicators to describe the risk of drought in maize. The research results may be helpful for decision-makers to take appropriate action on maize production. The drought in the western part of the study area was severe and the foundation for disaster prevention was poor. It is suggested to improve the agricultural ecological environment and increase the water storage and irrigation capacity. Compared to the yield reduction rate, VIKOR provides more realistic and reasonable results than the TOPSIS model. Furthermore, we provide an idea for drought risk evaluation for maize that could potentially be applied to other regions as well as other crops to create drought risk assessment maps. However, when applying this approach to other regions, the selection of indicators and the evaluation and validation of models need to be reconsidered in light of the actual situation.
Author Contributions
Y.M.: Conceptualization, Writing—original draft. X.L.: Conceptualization, Methodology, Resources. Z.T.: Writing—review & editing. S.G.: Visualization, Supervision. J.X.: Conceptualization. J.Z.: Conceptualization, Writing—review & editing. All authors have read and agreed to the published version of the manuscript.
Funding
This study is supported by the National Key Research and Development Program of China (2019YFD1002201); The National Natural Science Foundation of China (41877520, 42077443); The Science and Technology Development Planning of Jilin Province (20190303018SF); Key Research and Projects Development Planning of Jilin Province (20200403065SF); Industrial technology research and development project supported by Development and Reform Commission of Jilin Province (2021C044-5); The Science and Technology Planning of Changchun (19SS007).
Conflicts of Interest
The authors declare no conflict of interest.
References
- Raupach, M.R.; Marland, G.; Ciais, P.; Le Quéré, C.; Canadell, J.G.; Klepper, G.; Field, C.B. Global and regional drivers of accelerating CO2 emissions. Proc. Natl. Acad. Sci. USA 2007, 104, 10288–10293. [Google Scholar] [CrossRef] [PubMed] [Green Version]
- Fischer, G.; Shah, M.; Tubiello, F.N.; Van Velhuizen, H. Socio-economic and climate change impacts on agriculture: An integrated assessment, 1990–2080. Philos. Trans. R. Soc. B Biol. Sci. 2005, 360, 2067–2083. [Google Scholar] [CrossRef] [PubMed]
- Schmidhuber, J.; Tubiello, F.N. Global food security under climate change. Proc. Natl. Acad. Sci. USA 2007, 104, 19703–19708. [Google Scholar] [CrossRef] [PubMed] [Green Version]
- Ji, F.; Wu, Z.; Huang, J.; Chassignet, E.P. Evolution of land surface air temperature trend. Nat. Clim. Chang. 2014, 4, 462–466. [Google Scholar] [CrossRef]
- Paparrizos, S.; Matzarakis, A. Assessment of future climate change impacts on the hydrological regime of selected Greek areas with different climate conditions. Water Policy 2017, 48, 1327–1342. [Google Scholar] [CrossRef]
- Gao, X.; Shi, Y.; Giorgi, F. A high resolution simulation of climate change over China. Sci. China Earth Sci. 2011, 54, 462–472. [Google Scholar] [CrossRef]
- Thomas, A. Agricultural irrigation demand under present and future climate scenarios in China. Glob. Planet. Chang. 2008, 60, 306–326. [Google Scholar] [CrossRef]
- Bodner, G.; Nakhforoosh, A.; Kaul, H.-P. Management of crop water under drought: A review. Agron. Sustain. Dev. 2015, 35, 401–442. [Google Scholar] [CrossRef]
- Wang, Y.; Zhou, B.; Qin, D.; Wu, J.; Gao, R.; Song, L. Changes in mean and extreme temperature and precipitation over the arid region of northwestern China: Observation and projection. Adv. Atmos. Sci. 2017, 34, 289–305. [Google Scholar] [CrossRef]
- Mishra, A.K.; Singh, V.P. A review of drought concepts. J. Hydrol. 2010, 391, 202–216. [Google Scholar] [CrossRef]
- Tigkas, D.; Vangelis, H.; Tsakiris, G. Drought characterisation based on an agriculture-oriented standardised precipitation index. Theor. Appl. Climatol. 2019, 135, 1435–1447. [Google Scholar] [CrossRef]
- Han, L.; Zhang, Q.; Zhang, Z.; Jia, J.; Wang, Y.; Huang, T.; Cheng, Y. Drought area, intensity and frequency changes in China under climate warming, 1961–2014. J. Arid Environ. 2021, 193, 104596. [Google Scholar] [CrossRef]
- Deng, S.; Liu, S.; Mo, X. Assessment and attribution of China’s droughts using an integrated drought index derived from GRACE and GRACE-FO data. J. Hydrol. 2021, 603, 127170. [Google Scholar] [CrossRef]
- Wang, F.; Lai, H.; Li, Y.; Feng, K.; Zhang, Z.; Tian, Q.; Zhu, X.; Yang, H. Dynamic variation of meteorological drought and its relationships with agricultural drought across China. Agric. Water Manag. 2022, 261, 107301. [Google Scholar] [CrossRef]
- Wang, Z.; Xi, L.; Li, Y.; Dong, A. Characteristics of droughts in eastern Northwest China over the past 546 years. Acta Meteorol. Sin. 2020, 78, 72–85. [Google Scholar]
- Wan, W.; Liu, Z.; Li, J.; Xu, J.; Wu, H.; Xu, Z. Spatiotemporal patterns of maize drought stress and their effects on biomass in the Northeast and North China Plain from 2000 to 2019. Agric. For. Meteorol. 2022, 315, 108821. [Google Scholar] [CrossRef]
- Zhang, Y.; Hao, Z.; Feng, S.; Zhang, X.; Hao, F. Changes and driving factors of compound agricultural droughts and hot events in eastern China. Agric. Water Manag. 2022, 263, 107485. [Google Scholar] [CrossRef]
- Shi, Z.; Jia, G.; Zhou, Y.; Xu, X.; Jiang, Y. Amplified intensity and duration of heatwaves by concurrent droughts in China. Atmos. Res. 2021, 261, 105743. [Google Scholar] [CrossRef]
- Palmer, W.C. Meteorological Drought; Research Paper No. 45; U.S. Department of Commerce, Weather Bureau: Washington, DC, USA, 1965.
- Zhang, J.; Sun, F.; Lai, W.; Lim, W.H.; Liu, W.; Wang, T.; Wang, P. Attributing changes in future extreme droughts based on PDSI in China. J. Hydrol. 2019, 573, 607–615. [Google Scholar] [CrossRef]
- Yerdelen, C.; Abdelkader, M.; Eris, E. Assessment of drought in SPI series using continuous wavelet analysis for Gediz Basin, Turkey. Atmos. Res. 2021, 260, 105687. [Google Scholar] [CrossRef]
- Mckee, T.B.; Doesken, N.J.; Kleist, J. The relationship of drought frequency and duration to time scales. In Proceedings of the 8th Conference on Applied Climatology, American Meteorological Society, Boston, MA, USA, 17–22 January 1993. [Google Scholar]
- Zarch, M.A.A.; Sivakumar, B.; Sharma, A. Droughts in a warming climate: A global assessment of Standardized precipitation index (SPI) and Reconnaissance drought index (RDI). J. Hydrol. 2015, 526, 183–1955. [Google Scholar] [CrossRef]
- Afshar, M.; Bulut, B.; Duzenli, E.; Amjad, M.; Yilmaz, M. Global spatiotemporal consistency between meteorological and soil moisture drought indices. Agric. For. Meteorol. 2022, 316, 108848. [Google Scholar] [CrossRef]
- Xu, Z.-G.; Wu, Z.-Y.; He, H.; Guo, X.; Zhang, Y.-L. Comparison of soil moisture at different depths for drought monitoring based on improved soil moisture anomaly percentage index. Water Sci. Eng. 2021, 14, 171–183. [Google Scholar] [CrossRef]
- Watson, A.; Miller, J.; Künne, A.; Kralisch, S. Using soil-moisture drought indices to evaluate key indicators of agricultural drought in semi-arid Mediterranean Southern Africa. Sci. Total Environ. 2022, 812, 152464. [Google Scholar] [CrossRef]
- Ajaz, A.; Taghvaeian, S.; Khand, K.; Gowda, P.H.; Moorhead, J.E. Development and Evaluation of an Agricultural Drought Index by Harnessing Soil Moisture and Weather Data. Water 2019, 11, 1375. [Google Scholar] [CrossRef] [Green Version]
- Bai, J.-J.; Yu, Y.; Di, L. Comparison between TVDI and CWSI for drought monitoring in the Guanzhong Plain, China. J. Integr. Agric. 2017, 16, 389–397. [Google Scholar] [CrossRef] [Green Version]
- Yang, C.; Menz, C.; Fraga, H.; Aumedes, S.C.; Leolini, L.; Ramos, M.C.; Molitor, D.; Leeuwen, C.; Santos, J. Assessing the grapevine crop water stress indicator over the flowering-veraison phase and the potential yield lose rate in important European wine regions. Agric. Water Manag. 2022, 261, 107349. [Google Scholar] [CrossRef]
- Gao, C.; Chen, C.; He, Y.; Ruan, T.; Luo, G.; Sun, Y. Response of Agricultural Drought to Meteorological Drought: A Case Study of the Winter Wheat above the Bengbu Sluice in the Huaihe River Basin, China. Water 2020, 12, 2805. [Google Scholar] [CrossRef]
- Ma, Y.; Zhang, J.; Zhao, C.; Li, K.; Dong, S.; Liu, X.; Tong, Z. Spatiotemporal Variation of Water Supply and Demand Balance under Drought Risk and Its Relationship with Maize Yield: A Case Study in Midwestern Jilin Province, China. Water 2021, 13, 2490. [Google Scholar] [CrossRef]
- Tian, Q.; Lu, J.; Chen, X. A novel comprehensive agricultural drought index reflecting time lag of soil moisture to meteorology: A case study in the Yangtze River basin, China. CATENA 2022, 209, 105804. [Google Scholar] [CrossRef]
- Wu, J.; Zhou, L.; Liu, M.; Zhang, J.; Leng, S.; Diao, C. Establishing and assessing the Integrated Surface Drought Index (ISDI) for agricultural drought monitoring in mid-eastern China. Int. J. Appl. Earth Obs. 2013, 23, 397–410. [Google Scholar] [CrossRef]
- Zhang, F.; Chen, Y.; Zhang, J. Dynamic drought risk assessment for maize based on crop simulation model and multi-source drought indices. J. Clean. Prod. 2019, 233, 100–114. [Google Scholar] [CrossRef]
- Wang, Y.; Lv, J.; Wang, Y.; Sun, H.; Hannaford, J.; Su, Z.; Barker, L.J.; Qu, Y. Drought risk assessment of spring maize based on APSIM crop model in Liaoning province, China. Int. J. Disaster Risk Reduct. 2020, 45, 101483. [Google Scholar] [CrossRef]
- Zhu, X.; Xu, K.; Liu, Y.; Guo, R.; Chen, L. Assessing the vulnerability and risk of maize to drought in China based on the AquaCrop model. Agric. Syst. 2021, 189, 103040. [Google Scholar] [CrossRef]
- Chang, H.-K.; Liou, J.-C.; Chen, W.-W. Protection priority in the coastal environment using a hybrid AHP-TOPSIS method on the Miaoli coast. Taiwan. J. Coast. Res. 2012, 280, 369–374. [Google Scholar] [CrossRef]
- Mosadeghi, R.; Warnken, J.; Tomlinson, R.; Mirfenderesk, H. Comparison of Fuzzy-AHP and AHP in a spatial multi-criteria decision making model for urban land-use planning. Comput. Environ. Urban Syst. 2015, 49, 54–65. [Google Scholar] [CrossRef] [Green Version]
- Janssen, J.A.E.B.; Krol, M.S.; Schielen, R.M.J.; Hoekstra, A.Y. The effect of modelling expert knowledge and uncertainty on multicriteria decision making: A river management case study. Environ. Sci. Policy 2010, 13, 229–238. [Google Scholar] [CrossRef]
- Liang, X.; Chen, T.; Ye, M.; Lin, H.; Li, Z. A hybrid fuzzy BWM-VIKOR MCDM to evaluate the service level of bike-sharing companies: A case study from Chengdu, China. J. Clean. Prod. 2021, 298, 126759. [Google Scholar] [CrossRef]
- Brodny, J.; Tutak, M. Assessing sustainable energy development in the central and eastern European countries and analyzing its diversity. Sci. Total Environ. 2021, 801, 149745. [Google Scholar] [CrossRef]
- Mete, S.; Serin, F.; Ece, N.; Gul, M. A decision-support system based on Pythagorean fuzzy VIKOR for occupational risk assessment of a natural gas pipeline construction. J. Nat. Gas Sci. Eng. 2019, 71, 102979. [Google Scholar] [CrossRef]
- Ou Yang, Y.; Shieh, H.; Tzeng, G.H. A VIKOR technique based on DEMATEL and ANP for information security risk control assessment. Inf. Sci. 2013, 232, 482–500. [Google Scholar] [CrossRef]
- Hezer, S.; Gelmez, E.; Özceylan, E. Comparative analysis of TOPSIS, VIKOR and COPRAS methods for the COVID-19 Regional Safety Assessment. J. Infect. Public Health 2021, 14, 775–786. [Google Scholar] [CrossRef] [PubMed]
- Gul, M.; Fatih, M.; Guneri, A.F. Pythagorean fuzzy VIKOR-based approach for safety risk assessment in mine industry. J. Saf. Res. 2019, 69, 135–153. [Google Scholar] [CrossRef] [PubMed]
- Yu, J.; Wu, S.; Chen, H.; Yu, Y.; Fan, H.; Liu, J. Risk assessment of submarine pipelines using modified FMEA approach based on cloud model and extended VIKOR method. Process Saf. Environ. 2021, 155, 555–574. [Google Scholar] [CrossRef]
- Hwang, C.L.; Yoon, K. Multiple Attribute Decision Making Methods and Applications; Springer: Berlin/Heidelberg, Germany, 1981. [Google Scholar]
- Chen, W.; Shen, Y.; Wang, Y. Evaluation of economic transformation and upgrading of resource-based cities in Shaanxi province based on an improved TOPSIS method. Sustain. Cities Soc. 2018, 37, 232–240. [Google Scholar] [CrossRef]
- Behzadian, M.; Otaghsara, S.K.; Yazdani, M.; Ignatius, J. A state-of the-art survey of TOPSIS applications. Expert Syst. Appl. 2012, 39, 13051–13069. [Google Scholar] [CrossRef]
- Dymova, L.; Sevastjanov, P.; Tikhonenko, A. A direct interval extension of TOPSIS method. Expert Syst. Appl. 2013, 40, 4841–4847. [Google Scholar] [CrossRef]
- Opricovic, S. Multicriteria Optimization of Civil Engineering Systems. Ph.D. Thesis, Faculty of Civil Engineering, Belgrade, Serbia, 1998. Volume 2. pp. 5–21. [Google Scholar]
- Opricovic, S.; Tzeng, G. Compromise solution by MCDM methods: A comparative analysis of VIKOR and TOPSIS. Eur. J. Oper. Res. 2004, 156, 445–455. [Google Scholar] [CrossRef]
- Lin, M.; Chen, Z.; Xu, Z.; Gou, X.; Herrera, F. Score function based on concentration degree for probabilistic linguistic term sets: An application to TOPSIS and VIKOR. Inf. Sci. 2021, 551, 270–290. [Google Scholar] [CrossRef]
- Azadeh, A.; Kor, H.; Hatefi, S.-M. A hybrid genetic algorithm-TOPSIS-computer simulation approach for optimum operator assignment in cellular manufacturing systems. J. Chin. Inst. Eng. 2011, 34, 57–74. [Google Scholar] [CrossRef]
- Sahana, V.; Mondal, A.; Sreekumar, P. Drought vulnerability and risk assessment in India: Sensitivity analysis and comparison of aggregation techniques. J. Environ. Manag. 2021, 299, 113689. [Google Scholar] [CrossRef] [PubMed]
- Sun, R.; Gong, Z.; Gao, G.; Shah, A.A. Comparative analysis of Multi-Criteria Decision-Making methods for flood disaster risk in the Yangtze River Delta. Int. J. Disaster Risk Reduct. 2020, 51, 101768. [Google Scholar] [CrossRef]
- Gan, L.; Wang, Y.; Lin, Z.; Lev, B. A loss-recovery evaluation tool for debris flow. Int. J. Disaster Risk Reduct. 2019, 37, 101165. [Google Scholar] [CrossRef]
- Sari, F. Forest fire susceptibility mapping via multi-criteria decision analysis techniques for Mugla, Turkey: A comparative analysis of VIKOR and TOPSIS. For. Ecol. Manag. 2021, 480, 118644. [Google Scholar] [CrossRef]
- Kim, Y.; Chung, E.-S. Fuzzy VIKOR approach for assessing the vulnerability of the water supply to climate change and variability in South Korea. Appl. Math. Model. 2013, 37, 9419–9430. [Google Scholar] [CrossRef]
- Dai, H.; Wang, J.; Li, G.; Chen, W.; Qiu, B.; Yan, J. A multi-criteria comprehensive evaluation method for distributed energy system. Energy Procedia 2019, 158, 3748–3753. [Google Scholar] [CrossRef]
- Delgado, A.; Romero, I. Environmental conflict analysis using an integrated grey clustering and entropy-weight method: A case study of a mining project in Peru. Environ. Model. Softw. 2016, 77, 108–121. [Google Scholar] [CrossRef]
- Du, Y.; Zheng, Y.; Wu, G.; Tang, Y. Decision-making method of heavy-duty machine tool remanufacturing based on AHP-entropy weight and extension theory. J. Clean. Prod. 2020, 252, 119607. [Google Scholar] [CrossRef]
- Mon, D.L.; Cheng, C.H.; Lin, J.C. Evaluating weapon system using fuzzy analytic hierarchy process based on entropy weight. Fuzzy. Sets. Syst. 1994, 62, 127–134. [Google Scholar] [CrossRef]
- Liu, J.; Zhang, K. Comparative study on data standardization methods in comprehensive evaluation. Digit. Technol. Appl. 2018, 36, 84–85. [Google Scholar]
- Allen, R.G.; Pereira, L.S.; Raes, D.; Smith, M. Crop Evapotranspiration: Guidelines for Computing Crop Water Requirements; FAO: Rome, Italy, 1998. [Google Scholar]
- Chu, R.; Li, M.; Shen, S.; Islam, A.R.M.T.; Cao, W.; Tao, S.; Gao, P. Changes in Reference Evapotranspiration and Its Contributing Factors in Jiangsu, a Major Economic and Agricultural Province of Eastern China. Water 2017, 9, 486. [Google Scholar] [CrossRef] [Green Version]
- Jhajharia, D.; Dinpashoh, Y.; Kahya, E.; Singh, V.P.; Fard, A.F. Trends in reference evapotranspiration in the humid region of northeast India. J. Hydrol. 2012, 26, 421–435. [Google Scholar] [CrossRef]
- Zhang, Y.; Qu, H.; Yang, X.; Wang, M.; Qin, N.; Zou, Y. Cropping system optimization for drought prevention and disaster reduction with a risk assessment model in Sichuan Province. Glob. Ecol. Conserv. 2020, 23, e01095. [Google Scholar] [CrossRef]
- Jia, J.; Han, L.; Liu, Y.; He, N.; Zhang, Q.; Wan, X.; Zhang, Y.; Hu, J. Drought risk analysis of maize under climate change based on natural disaster system theory in Southwest China. Acta Ecol. Sinica. 2016, 36, 340–349. [Google Scholar] [CrossRef]
- Yoon, K.P.; Hwang, C.L. Multiple Attribute Decision Making: An Introduction; Sage Publications: Newbury Park, CA, USA, 1995; Volume 104. [Google Scholar]
- Chakraborty, S.; Yeh, C.H. Comparison based group ranking outcome for multiattribute group decisions. In Proceedings of the 14th International Conference on Computer Modelling and Simulation (UKSim), Cambridge, UK, 28–30 March 2012. [Google Scholar]
- Chakraborty, S.; Mandal, A. A novel TOPSIS based consensus technique for multiattribute group decision making. In Proceedings of the 2018 18th International Symposium on Communications and Information Technologies, ISCIT, Bangkok, Thailand, 26–29 September 2018. [Google Scholar]
- Belton, V.; Stewart, T. Multiple Criteria Decision Analysis: An Integrated Approach; Springer Science & Business Media: Berlin/Heidelberg, Germany, 2002. [Google Scholar]
- Prasad, K.G.D.; Prasad, M.; Rao, S.V.V.B.; Patro, C. Supplier selection through AHP-VIKOR integrated methodology. Int. J. Ind. Eng. 2016, 3, 1–6. [Google Scholar] [CrossRef]
- Abdul, D.; Jiang, W.; Tanveer, A. Prioritization of renewable energy source for electricity generation through AHP-VIKOR integrated methodology. Renew. Energy 2022, 184, 1018–1032. [Google Scholar] [CrossRef]
- Nyikadzino, B.; Chitakira, M.; Muchuru, S. Rainfall and runoff trend analysis in the Limpopo river basin using the Mann Kendall statistic. Phys. Chem. Earth 2020, 117, 102870. [Google Scholar] [CrossRef]
- Guna, A.; Zhang, J.; Tong, S.; Bao, Y.; Han, A.; Li, K. Effect of Climate Change on Maize Yield in the Growing Season: A Case Study of the Songliao Plain Maize Belt. Water 2019, 11, 2108. [Google Scholar] [CrossRef] [Green Version]
- Mann, H.B. Nonparametric tests against trend. Econometrica 1945, 13, 245–259. [Google Scholar] [CrossRef]
- Kendall, M.G. Rank Correlation Methods; Hafner: New York, NY, USA, 1962. [Google Scholar]
- Egbueri, J.C. Water quality appraisal of selected farm provinces using integrated hydrogeochemical, multivariate statistical, and microbiological technique. Model. Earth Syst. Environ. 2019, 5, 997–1013. [Google Scholar] [CrossRef]
- Rao, N.S.; Chaudhary, M. Hydrogeochemical processes regulating the spatial distribution of groundwater contamination, using pollution index of groundwater (PIG) and hierarchical cluster analysis (HCA): A case study. Groundw. Sustain. Dev. 2019, 9, 100238. [Google Scholar] [CrossRef]
- Yang, M.-S.; Shih, H.-M. Cluster analysis based on fuzzy relations. Fuzzy Sets Syst. 2001, 120, 197–212. [Google Scholar] [CrossRef]
- Egbueri, J.C. Groundwater quality assessment using pollution index of groundwater (PIG), ecological risk index (ERI) and hierarchical cluster analysis (HCA): A case study. Groundw. Sustain. Dev. 2020, 10, 100292. [Google Scholar] [CrossRef]
- Zhang, Y.; Wang, Y.; Niu, H. Effects of temperature, precipitation and carbon dioxide concentrations on the requirements for crop irrigation water in China under future climate scenarios. Sci. Total. Environ. 2019, 656, 373–387. [Google Scholar] [CrossRef]
- Li, R.; Zheng, J.; Xie, R.; Ming, B.; Peng, X.; Luo, Y. Potential mechanisms of maize yield reduction under short-term no-tillage combined with residue coverage in the semi-humid region of Northeast China. Soil Tillage Res. 2022, 217, 105289. [Google Scholar] [CrossRef]
Publisher’s Note: MDPI stays neutral with regard to jurisdictional claims in published maps and institutional affiliations. |
© 2022 by the authors. Licensee MDPI, Basel, Switzerland. This article is an open access article distributed under the terms and conditions of the Creative Commons Attribution (CC BY) license (https://creativecommons.org/licenses/by/4.0/).