Abstract
Optically thin layers of tiny ice particles near the summer mesopause, known as noctilucent clouds, are of significant interest within the aeronomy and climate science communities. Ground-based optical cameras mounted at various locations in the arctic regions collect the dataset during favorable summer times. In this paper, first, we compare the performances of various deep learning-based image classifiers against a baseline machine learning model trained with support vector machine (SVM) algorithm to identify an effective and lightweight model for the classification of noctilucent clouds. The SVM classifier is trained with histogram of oriented gradient (HOG) features, and deep learning models such as SqueezeNet, ShuffleNet, MobileNet, and Resnet are fine-tuned based on the dataset. The dataset includes images observed from different locations in northern Europe with varied weather conditions. Second, we investigate the most informative pixels for the classification decision on test images. The pixel-level attributions calculated using the guide back-propagation algorithm are visualized as saliency maps. Our results indicate that the SqueezeNet model achieves an F1 score of 0.95. In addition, SqueezeNet is the lightest model used in our experiments, and the saliency maps obtained for a set of test images correspond better with relevant regions associated with noctilucent clouds.
1. Introduction
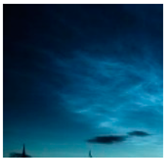
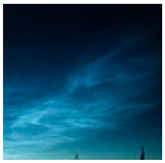
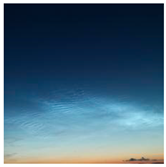
Noctilucent clouds (NLC) are the highest clouds in the earth’s atmosphere in the vicinity of the mesopause, with an altitude range of 80–85 km. The extremely cold temperature during the summer in this region permits the formation of tiny ice particles of sizes in the range of 20–150 nm. NLCs are observed with the naked eye from the ground surface, typically from latitudes between 50–65 degrees and facing north [1]. The mesosphere is highly dynamic because it displays various types of waves and turbulence, which are influenced by the lower atmosphere as well as variations that are influenced by solar–terrestrial physics. Observations of the mesosphere are challenging because it lies above the heights that can be reached with balloons and aircraft, and it lies below the heights of most satellites. Satellites are, however, used for remote observations on large scales of the ice particles that form the NLC [2]. Observations from the ground with optical cameras and lidars provide more localized images, including spatial patterns. Investigating these clouds helps us to better understand the upper atmosphere and its dynamics caused by several effects in this region [3].
The NLC structures reveal, for instance, the influence of planetary waves [4]. The NLC observations are also discussed as an indicator of climate change [5], and some studies show an increased frequency of the NLC occurrence and NLC brightness suggested throughout 1964–1994 that can arise from increasing water vapor concentration at these altitudes [6,7]. Although the origins of NLCs and the conditions leading to their formation are still actively being investigated, there are various studies on the understanding of NLC in terms of their size, shape, and formation [6]. The local observations, for instance, above Northern Scandinavia, allow us to compare the NLC observations with radar studies. The radar observation of these clouds is made in polar mesospheric summer echoes (PMSE), which are observed at similar altitudes as the NLC and higher. They form as a result of several processes and require the presence of ice particles that are electrically charged turbulence in the neutral components of the atmosphere and free electrons. NLC, in contrast, merely depends on the size of the ice particles. Despite these differences, it is helpful to have a combined view of PMSE and NLC to investigate the local structures of these clouds. The PMSE and NLC display similar wavy structures, as shown in Figure 1. The PMSE was captured with an EISCAT radar at Tromsø, and an optical image from Kiruna, Sweden (67.84N, 20.41E). The wavy pattern displayed in these NLCs possibly indicates the influence of wave propagation on a scale, from a few kilometers to several kilometers [8].
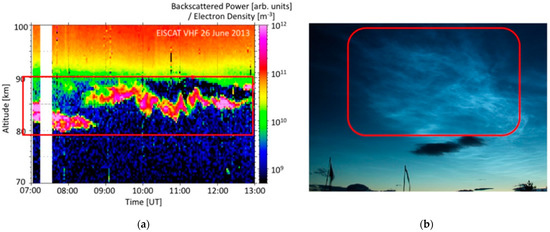
Figure 1.
(a) The PMSE radar echoes associated with polar ice clouds [11]; and (b) optical image consisting of NLC [8].
The optical cameras preprogrammed for taking images every few minutes during favorable summer times collect the noctilucent cloud images from various locations in the arctic north. The identification of the NLC occurrence in images demands an expert’s evaluation and hence is a resource-intensive task. In the literature, there are several studies on the analysis of NLC [9,10,11,12,13,14]; however, studies on its classification using deep-learning techniques are lacking. In a recent study by [8], different feature-extraction strategies on image patches of the size 50 by 50 pixels are implemented to classify these image patches into different categories, such as NLC, tropospheric cloud, clear sky, etc. The study compares the performance of LDA with different combinations of image features (mean, standard deviation, HLAC, and HOG) with that of a convolution neural network model. Although CNN achieves good classification accuracy and outperforms the rest of the methods used in the paper, the experimental pipeline implemented using patches is not common in practical applications.
In this paper, we investigate the possibility of using state-of-the-art deep learning models to classify NLC based on whole images rather than image patches, as performed in the study of [8]. The state-of-the-art CNN architectures trained with transfer learning are compared to the baseline SVM classifier trained with the histogram of oriented gradient (HOG) features. In addition to the evaluation of their performance, we also visualize the pixel-level attributes for the test image to identify the pixels that contribute more to making the classification decision. The main advantages of using whole images instead of patches are: (1) it allows the use of existing state-of-the-art deep learning architectures and their pre-trained weights with transfer learning, and (2) the selected classifier model offers a real-world application.
The rest of the article is divided as follows: First, in Section 2, we outline the dataset associated with experiments, methods, and procedures followed in this paper. In Section 3, we explain the results obtained from our proposed method. In Section 4, we discuss the results and, finally, we highlight the conclusions in Section 5.
2. Materials and Methods
2.1. Dataset
The dataset consists of images captured from three different locations: Kiruna, Sweden (67.84N, 20.41E), Nikkaluokta, Sweden (67.85N, 19.01E), and Moscow, Russia (56.02N, 37.48E). The available dataset consists of images of various weather conditions and contrast levels of NLC activity. A total of 1177 images constitute the original dataset, with 362 belonging to the NLC category and 815 to the other category. The other category includes images with tropospheric clouds, twilight, clear sky, buildings, rain, and various other environmental conditions, as shown in Appendix A, Figure A1. After preprocessing and cropping, a total of 1540 and 4075 images are available as noctilucent and non-noctilucent images, respectively. The few additional images from Novosibirsk, Russia, and Scotland are used for testing but not for training.
2.2. Methods
2.2.1. Convolutional Neural Network
A convolutional neural network (CNN) is a class of deep neural networks widely used for grid-like data, such as images and videos. A convolutional network combines three architectural ideas to ensure some degree of shift and distortion invariance: local receptive fields, shared weights (or weight replication), and, sometimes, spatial or temporal subsampling (through pooling) [15]. A typical convolution neural network consists of repeating convolutional blocks after the input layer and acts as a features extractor. Mostly, each convolution block consists of three layers: convolution, non-linear activation, and pooling.
Since their introduction in 1989, convolutional networks have evolved from hand-written digit classification [16] to object detection [17,18,19], image recognition [20,21,22], and beyond. The continuous innovation in the architectural design of neural networks has achieved state-of-art performances in many applications and has provided smaller but equally powerful CNN models such as SqueezeNet [23], ShuffleNet [24], MobileNet [25], Efficientnet [26], and Efficientdet [27].
SqueezeNet: SqueezeNet is a family of CNN architectures that has alexnet-level accuracy with 50 times fewer parameters and a significantly smaller model size. The new building block of SqueezeNet, called the fire module, replaces 3 × 3 filters with 1 × 1, decreases the number of input channels to 3 × 3 filters, and downsamples late in the network so that the convolution layers have large activation maps [23]. With model compression applied, the SqueezeNet model can be as small as 0.5 MB [23].
ShuffleNet: This is an extremely computation-efficient CNN architecture specially designed for very mobile devices with limited computing power. The new architecture maintains the accuracy with reduced computation costs by employing pointwise group convolution and channel shuffling [24].
MobileNet: A class of CNN architectures for mobile and embedded vision applications that use depthwise separable convolutions. Two simple global hyperparameters introduced in the architecture efficiently trade-off between latency and accuracy [25].
Resnet: Resnet is an effective CNN architecture to train substantially deeper neural networks. The architecture reformulates the layers as learning residual functions with reference to the layer inputs, instead of learning unreferenced functions [22].
2.2.2. Support Vector Machine
Support vector machine is a supervised machine learning algorithm. In classification, the algorithm puts all the input feature vectors on an imaginary plot and draws the imaginary high-dimensional line (hyperplane) that separates the examples with different categorical labels [28,29]. The equation of the hyperplane is given by two parameters: a real-valued vector of the same dimensionality as our input feature vector, and a real number b as:
where the expression means and is the number of dimensions of the feature vector .
The goal of the SVM learning algorithm during the training phase is to find the optimal values for the weight and the bias terms of the separating hyperplane: and , respectively. After solving the optimization functions, the predicted label for any input feature vector x is given by [29]:
where the sign is a mathematical operator that takes any value as a real number and returns +1 if the input is a positive number and −1 if the input is a negative number.
2.2.3. Metrics Used for the Evaluation
In classification, the F1 score is the accuracy of the test samples calculated with the precision and recall. The precision of the model is the number of true positive test samples divided by the number of all positive results. The recall value of the model, which is also known as the sensitivity, is the number of true positive results divided by the number of all the samples that should have been identified as positive (true positive + false negative). The numerical calculation of precision, recall, and F1 score can be obtained using the Equations (3)–(5), respectively [30].
2.3. Procedure
First, a high-resolution image (typically of size 2303 × 1690 and 3088 × 2056 pixels) is converted to a lower resolution of 265 × 240 pixels. Next, a total of five cropped images—four corner-crops, and a single center-crop—of the size 224 × 224 pixels are obtained from each of these lower-resolution images. A non-noctilucent category, namely the other category, is created by randomly selecting images with no NLC activity from the dataset. The final dataset comprises 1540 NLC and 4075 other category images, respectively. Approximately 23 percent of the images from each category are used for testing. Out of the remaining 77 percent, 80 percent are used for training and 20 percent are used for the validation of the classifier models.
To train an SVM classifier, HOG features are extracted from the resized training sample of the size 224 by 224 pixels. For a given image, a 6272-dimensional HOG features vector is obtained by selecting 8 by 8 pixeled cells with eight orientations per cell. The SVM algorithm is trained on a batch of 100 samples (see Figure 2 for flow diagram).

Figure 2.
Process of training of SVM model with HOG (histogram of oriented gradient) features.
Next, four different deep learning-based image classification models with their pre-trained weights are fine-tuned with the image dataset available in two categories: NLC and Others (non-NLC). The mean of [0.1938, 0.2742, 0.3568] and standard deviation of [0.1456, 0.1660, 0.1646] computed over the training dataset are used to normalize each image before passing it to the classifier model. All deep learning classifiers are trained with binary cross-entropy loss and an Adam optimizer with the learning rate of 0.001 for twenty epochs.
Finally, we obtain pixel attribution maps (saliency maps) associated with the different deep learning models used in the paper for a few selected test images containing noctilucent clouds. The attribution map signifies the contribution of image pixels in classification decisions and is computed with a guided backpropagation algorithm [31].
3. Results
The comparison of the SVM classifier with various deep learning architectures is shown in Table 1. The F1 score is used as the main metric to compare the performances of various image classifier models. The SVM algorithm trained with the histogram of oriented gradient (HOG) features achieved an f1 score of 0.55 with a precision of 0.25 and a recall of 0.38. The lightweight deep-learning models used for the experiment, SqueezeNet, ShuffleNet, and MobileNet, all achieved the same F1 score of 0.95. Among the deep learning models used in our experiments, SqueezeNet has the smallest size of 21.81 MB. The widely used and state-of-art image classification architecture ResNet has a larger model size of 81.11 MB. The comparison of various models according to their estimated model size, precision, recall, and F1 score (for NLC category) is shown in Table 1.

Table 1.
Comparison of SVM classifier with various deep learning architectures for NLC classification.
Table 2 shows the class predicted by different models on a few of the selected test images. Our results show that SVM misclassifies the NLC images in rows 3–5 among the selected test images. On the other hand, deep learning models show significantly better class predictions. The predicted labels for the test images in rows 3–5 indicate that NLC activity is not detected by all the deep learning models equally well. We also note that for the test images in row 8, the MobileNet and Resnet models misclassify a non-NLC image as NLC.

Table 2.
Test images with true labels and their predictions: label 0 represents NLC and label 1 represents other category.
Figure 3, Figure 4 and Figure 5 shows the attribution map or saliency map for selected test images representing the NLC classes that are correctly predicted by the deep learning models. From the figure, it is seen that SqueezeNet, ShuffleNet, and ResNet align most with the sensitive pixels forming NLC in test images. However, MobileNet architecture provided attribution maps that are visually off with NLC features in test images.
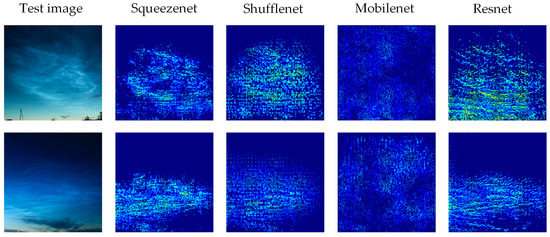
Figure 3.
Test images and their saliency map for NLC class.
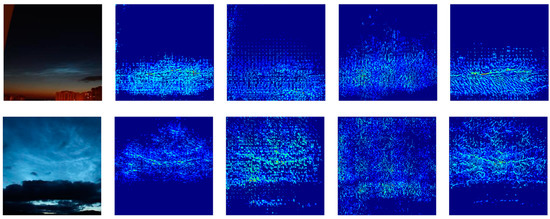
Figure 4.
Test images and their saliency map for NLC class.
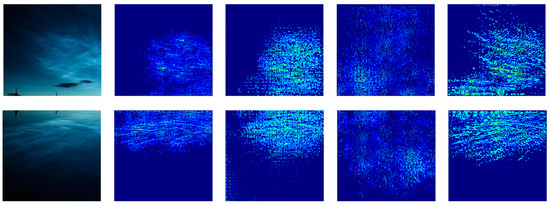
Figure 5.
Test image and their saliency map for NLC class.
The trained SqueezeNet model is also tested with a few images from two different locations: Novosibirsk, Russia, and Scotland. These test images constitute different backgrounds, orientations, and camera settings that are not considered in the training phase.
For the SqueezeNet model, when tested with images from a known location (same as the training dataset), nearly 10 percent (35 out of 343) of the noctilucent cloud images are misclassified; for details please see the confusion matrix in Figure 6a. The same model, when tested with images from two new locations (not included in the training dataset) missed nearly 38 percent (18 out of 48) of noctilucent cloud images; for details please see the confusion matrix in Figure 6b. The sample images from the new locations can be seen in Appendix A, Figure A2.
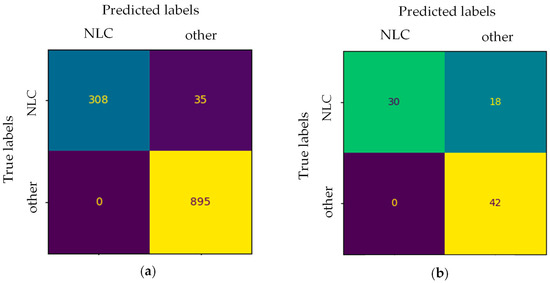
Figure 6.
Confusion matrix for the SqueezeNet model (a), confusion matrix for test dataset from the same location as training dataset (Kiruna, Nikkaluokta, Sweden and Moscow, Russia); and (b) confusion matrix for small test set from different location (Novosibirsk, Russia, and Scotland).
4. Discussion
We employ different state-of-art deep learning architectures to detect noctilucent clouds and compare the performances of these models with the baseline machine learning model (SVM classifier). We find that the baseline machine learning model trained with a histogram of oriented gradient (HOG) features obtained the lowest F1 score of 0.55 for the NLC class. We infer that, although HOG features can be effective for objects with rigid boundaries and sharp contrast, they seem to be less effective in the case of fuzzy images, such as noctilucent clouds. All convolutional neural network models that are considered in the experiment have a significantly higher F1 score of 0.95. The sensitivity (recall value) of the deep learning models is also significantly higher (0.90–0.92). Furthermore, the saliency maps obtained with the guided-backpropagation algorithm for the test images (Figure 3, Figure 4 and Figure 5) show the robust features selection capability of the deep learning models. Although all the deep learning models achieved a significantly high F1 score of 0.95, the sensitivity maps produced by SqueezeNet, ShuffleNet, and Resnet show enough relevance with the visual features of noctilucent cloud. The saliency maps in Figure 3, Figure 4 and Figure 5 are plotted for the top 15% of the contributing pixels for the classification decision (NLC class).
MobileNet obtained the highest recall value of 0.92, but provided sensitivity maps that differ from the visual understanding of NLC features (please refer to the column for MobileNet in Figure 3, Figure 4 and Figure 5). The test results in Figure 6 show that the SqueezeNet model performs well for the seen data and performs relatively poorly in the case of unseen data. The model missed a good number of NLC-containing images from a new geographical location (see Figure 6b for more details). To improve the classification decision associated with NLC on unseen images from new locations, we should try obtaining datasets from as diverse locations as possible for training. Additionally, domain adaptation techniques as mentioned in [32] can also be explored to develop a model that can generalize well for unseen data.
5. Conclusions
In this paper, we employ different deep learning-based image classifiers to identify images containing noctilucent clouds. The deep learning models are compared against a machine learning model trained with support vector machine (SVM) algorithm. The dataset includes optical images captured from different locations in northern Europe with varied weather conditions. The SVM classifier is trained with a histogram of oriented gradient (HOG) features, and deep learning models such as SqueezeNet, ShuffleNet, MobileNet, and Resnet are fine-tuned based on the dataset. In addition, for a few test images, we investigate the most informative pixels for the classification decision and visualize them as saliency maps. These so-called attribution maps are obtained by employing the guided-backpropagation method. Our results show that the SqueezeNet model achieves an F1 score of 0.95 and is the lightest among the various deep learning models used in this paper. Additionally, the saliency maps obtained with SqueezeNet model are better-associated with noctilucent cloud features. With our experiment and results, we identify SqueezeNet model as a powerful and light model that can be implemented to identify noctilucent clouds.
Author Contributions
Conceptualization, R.S. and P.S.; methodology, R.S.; software, R.S.; validation, R.S., formal analysis, R.S.; investigation, R.S.; resources, P.S.; data curation, R.S.; writing—original draft preparation, R.S.; writing—review and editing, P.S. and I.M.; visualization, R.S.; supervision, P.S.; project administration, P.S.; funding acquisition, P.S. All authors have read and agreed to the published version of the manuscript.
Funding
The publication charges for this article are funded by a grant from the publication fund of UiT The Arctic University of Norway. IM is supported by a project funded by the Research Council of Norway, NFR 275503.
Data Availability Statement
Not applicable.
Acknowledgments
The authors thank Peter Dalin from the Swedish Institute of Space Physics for the theoretical/technical support of the NLC images/camera as well as the administration of the Luleå University of Technology for their technical support of the NLC camera located in Kiruna (Sweden).
Conflicts of Interest
The authors declare no conflict of interest.
Appendix A
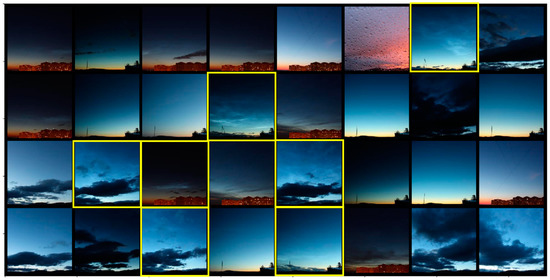
Figure A1.
Randomly selected training dataset: images within yellow square contains small to large concentration of noctilucent cloud and are considered as NLC images and the rest with other category.

Figure A2.
Randomly selected images of NLC category from new locations that are used only for testing, but not used for training/fine-tuning the classifier models.
References
- Dubietis, A.; Dalin, P.; Balčiūnas, R.; Černis, K.; Pertsev, N.; Sukhodoev, V.; Perminov, V.; Zalcik, M.; Zadorozhny, A.; Connors, M.; et al. Noctilucent Clouds: Modern Ground-Based Photographic Observations by a Digital Camera Network. Appl. Opt. 2011, 50, F72. [Google Scholar] [CrossRef] [PubMed]
- Hervig, M.E.; Gerding, M.; Stevens, M.H.; Stockwell, R.; Bailey, S.M.; Russell, J.M.; Stober, G. Mid-Latitude Mesospheric Clouds and Their Environment from SOFIE Observations. J. Atmos. Solar-Terr. Phys. 2016, 149, 1–14. [Google Scholar] [CrossRef]
- Vincent, R.A. The Dynamics of the Mesosphere and Lower Thermosphere: A Brief Review. Vincent Prog. Earth Planet. Sci. 2011, 2, 4. [Google Scholar] [CrossRef]
- Kirkwood, S.; Stebel, K. Influence of Planetary Waves on Noctilucent Cloud Occurrence over NW Europe. J. Geophys. Res 2003, 108, 8440. [Google Scholar] [CrossRef]
- Thomas, G.E.; Oliverot, J.J.; Jensen, E.J.; Schroeder, W.; Toon, O.B. Relation between Increasing Methane and the Presence of Ice Clouds at the Mesopause. Nature 1989, 338, 490–492. [Google Scholar] [CrossRef]
- Lübken, F.-J.; Berger, U.; Baumgarten, G. On the Anthropogenic Impact on Long-Term Evolution of Noctilucent Clouds. Geophys. Res. Lett. 2018, 45, 6681–6689. [Google Scholar] [CrossRef]
- Klostermeyer, J. Noctilucent Clouds Getting Brighter. J. Geophys. Res. Atmos. 2002, 107, AAC 1-1–AAC 1-7. [Google Scholar] [CrossRef][Green Version]
- Sharma, P.; Dalin, P.; Mann, I. Towards a Framework for Noctilucent Cloud Analysis. Remote Sens. 2019, 11, 2743. [Google Scholar] [CrossRef]
- Pautet, P.-D.; Stegman, J.; Wrasse, C.M.; Nielsen, K.; Takahashi, H.; Taylor, M.J.; Hoppel, K.W.; Eckermann, S.D. Analysis of Gravity Waves Structures Visible in Noctilucent Cloud Images. J. Atmos. Sol. Terr. Phys. 2011, 73, 2082–2090. [Google Scholar] [CrossRef]
- Dalin, P.; Pertsev, N.; Zadorozhny, A.; Connors, M.; Schofield, I.; Shelton, I.; Zalcik, M.; McEwan, T.; McEachran, I.; Frandsen, S.; et al. Ground-Based Observations of Noctilucent Clouds with a Northern Hemisphere Network of Automatic Digital Cameras. J. Atmos. Solar-Terr. Phys. 2008, 70, 1460–1472. [Google Scholar] [CrossRef]
- Mann, I.; Häggström, I.; Tjulin, A.; Rostami, S.; Anyairo, C.C.; Dalin, P. First Wind Shear Observation in PMSE with the Tristatic EISCAT VHF Radar. J. Geophys. Res. Space Phys. 2016, 121, 11271–11281. [Google Scholar] [CrossRef]
- Dalin, P.; Kirkwood, S.; Andersen, H.; Hansen, O.; Pertsev, N.; Romejko, V. Comparison of Long-Term Moscow and Danish NLC Observations: Statistical Results. Ann. Geophys. 2006, 24, 2841–2849. [Google Scholar] [CrossRef][Green Version]
- Dalin, P.; Pertsev, N.; Perminov, V.; Dubietis, A.; Zadorozhny, A.; Zalcik, M.; McEachran, I.; McEwan, T.; Černis, K.; Grønne, J.; et al. Response of Noctilucent Cloud Brightness to Daily Solar Variations. J. Atmos. Solar-Terr. Phys. 2018, 169, 83–90. [Google Scholar] [CrossRef]
- Ludlam, F.H. Noctilucent Clouds. Tellus 1957, 9, 341–364. [Google Scholar] [CrossRef]
- Bengio, Y. Convolutional Networks for Images, Speech, and Time-Series. Oracle Performance for Visual Captioning View Project MoDeep View Project. Handbook of Brain Theory Neural Networks. 1997. Available online: http://www.iro.umontreal.ca/~lisa/pointeurs/handbook-convo.pdf (accessed on 27 March 2022).
- LeCun, Y.; Boser, B.; Denker, J.S.; Henderson, D.; Howard, R.E.; Hubbard, W.; Jackel, L.D. Backpropagation Applied to Handwritten Zip Code Recognition. Neural Comput. 1989, 1, 541–551. [Google Scholar] [CrossRef]
- He, K.; Gkioxari, G.; Dollár, P.; Girshick, R. Mask R-CNN. In Proceedings of the IEEE International Conference on Computer Vision (ICCV), Venice, Italy, 22–29 October 2017; pp. 2961–2969. [Google Scholar]
- Redmon, J.; Divvala, S.; Girshick, R.; Farhadi, A. You Only Look Once: Unified, Real-Time Object Detection. In Proceedings of the IEEE Conference on Computer Vision and Pattern Recognition (CVPR), Las Vegas, NV, USA, 27–30 June 2016; pp. 779–788. [Google Scholar]
- Girshick, R. Fast R-CNN. In Proceedings of the IEEE International Conference on Computer Vision (ICCV), Santiago, Chile, 7–13 December 2015; pp. 1440–1448. [Google Scholar]
- Krizhevsky, A.; Sutskever, I.; Hinton, G.E. ImageNet Classification with Deep Convolutional Neural Networks. In Advances in Neural Information Processing Systems 25: 26th Annual Conference on Neural Information Processing Systems 2012, Lake Tahoe, NV, USA, 3–6 December 2012; Curran Associates, Inc.: Red Hook, NY, USA, 2012. [Google Scholar]
- Simonyan, K.; Zisserman, A. Very Deep Convolutional Networks for Large-Scale Image Recognition. In Proceedings of the 3rd International Conference on Learning Representations, ICLR 2015—Conference Track Proceedings, San Diego, CA, USA, 7–9 May 2015. [Google Scholar]
- He, K.; Zhang, X.; Ren, S.; Sun, J. Deep Residual Learning for Image Recognition. In Proceedings of the IEEE Conference on Computer Vision and Pattern Recognition (CVPR), Las Vegas, NV, USA, 27–30 June 2016; pp. 770–778. [Google Scholar]
- Iandola, F.N.; Han, S.; Moskewicz, M.W.; Ashraf, K.; Dally, W.J.; Keutzer, K. SqueezeNet: AlexNet-level accuracy with 50× fewer parameters and <0.5 MB model size. arXiv 2016, arXiv:1602.07360v4. [Google Scholar]
- Zhang, X.; Zhou, X.; Lin, M. ShuffleNet: An Extremely Efficient Convolutional Neural Network for Mobile Devices. In Proceedings of the IEEE Conference on Computer Vision and Pattern Recognition (CVPR), Salt Lake City UT, USA, 18–23 June 2018; pp. 6848–6856. [Google Scholar]
- Howard, A.G.; Zhu, M.; Chen, B.; Kalenichenko, D.; Wang, W.; Weyand, T.; Andreetto, M.; Adam, H. Mobilenets: Efficient convolutional neural networks for mobile vision applications. arXiv 2017, arXiv:1704.04861. [Google Scholar]
- Tan, M.; Le, Q. Efficientnet: Rethinking Model Scaling for Convolutional Neural Networks. In Proceedings of the International Conference on Machine Learning, Long Beach, CA, USA, 9–15 June 2019; pp. 6105–6114. [Google Scholar]
- Tan, M.; Pang, R.; Le, Q.V. EfficientDet: Scalable and Efficient Object Detection. In Proceedings of the IEEE/CVF Conference on Computer Vision and Pattern Recognition (CVPR), Seattle, WA, USA, 13–19 June 2020; pp. 10781–10790. [Google Scholar] [CrossRef]
- Burkov, A. The Hundred-Page Machine Learning Book; Andriy Burkov: Quebec City, QC, Canada, 2019; Volume 1, pp. 5–7. [Google Scholar]
- Theodoridis, S.; Koutroumbas, K. Support Vector Machines. In Pattern Recognition; Academic Press: Cambridge, MA, USA, 2009; pp. 119–129. [Google Scholar]
- Powers, D.M.W. Evaluation: From Precision, Recall and F-Score to ROC, Informedness, Markedness & Correlation. J. Mach. Learn. Technol. 2011, 2, 37–63. [Google Scholar]
- Springenberg, J.T.; Dosovitskiy, A.; Brox, T.; Riedmiller, M. Striving for Simplicity: The All Convolutional Net. In Proceedings of the 3rd International Conference on Learning Representations, ICLR 2015—Workshop Track Proceedings, San Diego, CA, USA, 7–9 May 2015. [Google Scholar]
- Wang, M.; Deng, W. Deep Visual Domain Adaptation: A Survey. Neurocomputing 2018, 312, 135–153. [Google Scholar] [CrossRef]
Publisher’s Note: MDPI stays neutral with regard to jurisdictional claims in published maps and institutional affiliations. |
© 2022 by the authors. Licensee MDPI, Basel, Switzerland. This article is an open access article distributed under the terms and conditions of the Creative Commons Attribution (CC BY) license (https://creativecommons.org/licenses/by/4.0/).
