Article

Enhanced Turbulent Mixing in the Upper Ocean Induced by Super Typhoon Goni (2015)

1
Ocean College, Zhejiang University, Zhoushan 316021, China
2
State Key Laboratory of Satellite Ocean Environment Dynamics, Second Institute of Oceanography, Ministry of Natural Resources, Hangzhou 310012, China
*
Author to whom correspondence should be addressed.
Remote Sens. 2022, 14(10), 2300; https://doi.org/10.3390/rs14102300
Submission received: 28 March 2022 / Revised: 27 April 2022 / Accepted: 8 May 2022 / Published: 10 May 2022
(This article belongs to the Special Issue Remote Sensing Applications in Ocean Observation)

Abstract

:
Based on the satellite-observed sea surface temperature (SST) data, high-resolution Argo observations and hybrid coordinate model (HYCOM) reanalysis results, this study examined the upper ocean response to Super Typhoon Goni in 2015 in the western north Pacific and revealed the significant diapycnal diffusivity enhancement in the upper ocean induced by Goni. Results indicate that the maximum SST cooling caused by Goni was 7.7 °C, which is greater than the SST cooling caused by most typhoons. The severe SST cooling was related to the enhancement of turbulent mixing induced by Goni. To the right of the typhoon track, the diapycnal diffusivity enhancement in the upper ocean caused by Goni could reach three orders of magnitude, from O (10−5 m2/s) to O (10−2 m2/s) and could last at least 9 days after the passage of Goni. In contrast, the diapycnal diffusivity to the left of the typhoon track did not show significant variations. The enhancement of turbulent mixing was found to be consistent with Goni-induced near-inertial kinetic energy calculated from the HYCOM reanalysis results, which suggests that the enhanced turbulent mixing was caused by Goni-induced near-inertial waves.

1. Introduction

Tropical cyclones (TCs), commonly known as typhoons in the western Pacific, are disastrous weather systems generated and developed in the tropical ocean. According to the tropical cyclone classification issued by the China Meteorological Administrationtropical cyclone database (https://tcdata.typhoon.org.cn/, accessed on 20 April 2021), TCs can be classified into different categories based on the maximum wind speed near the center, i.e., tropical depression (10.8–17.1 m/s), tropical storm (17.2–24.4 m/s), several tropical storm (24.5–32.6 m/s), typhoon (32.7–41.4 m/s), severe typhoon (41.5–50.9 m/s) and super typhoon (≥51.0 m/s). In recent years, a lot of studies have focused on the interaction between the upper ocean and TCs. When a TC passes over the ocean, the bottom atmosphere draws energy and moisture from the warm upper ocean to maintain or increase its intensity [1,2]. At the same time, the intense wind stress of a TC can penetrate 100–200 m depths of the upper ocean and generate strong near-inertial internal currents. The strong near-inertial currents [O (1 m/s)] cause enhanced turbulent mixing through shear instability, which brings the cold water below the mixed layer to the sea surface and decreases the sea surface temperature (SST), ranging from 1 to 6 °C; in turn, the SST cooling inhibits the heat exchange between the air-sea interface and hence, limits the intensity of the development of a TC [3,4,5,6,7,8,9,10,11,12,13,14]. The oceanic response to a TC is affected by the intensity, size and translation speed of the TC [5,15,16,17,18,19,20]. On the global scale, TCs are responsible for 1.87 PW (11.05 W/m2) of heat transfer annually from the ocean to the atmosphere [21]. Thus, more knowledge and a better understanding of the dynamic and thermal response of the upper ocean to a TC is urgently required to improve TC forecasting [2,22,23,24].
There are three major processes that control the SST cooling, i.e., oceanic diapycnal mixing, advection (mostly upwelling) and air-sea heat exchange [4]. It is demonstrated that nearly 75–90% of the TC-induced SST cooling is caused by diapycnal mixing, while the upwelling and air-sea heat exchange contribute less in the open ocean [4,8,25,26,27]. It is reported that approximately 15% of the peak ocean heat transport may be associated with the vertical mixing induced by TCs [28]. In addition, SST cooling is also associated with the ocean background conditions [29], such as mesoscale eddies and barrier layers [30]. The TC-induced SST cooling has significant asymmetry, which is greater to the right of the TC track than to the left in the northern hemisphere, owing to the asymmetry of TC-induced near-inertial currents and vertical mixing [4,31]. With the development of observation technology and research approaches, satellite remote sensing, in situ observations and numerical simulations have been widely used in the studies of oceanic response to TCs. For example, Zhang et al. [14] studied the upper ocean response to typhoon Kalmaegi in 2014, based on an array of buoys and moorings and a numerical model. Guan et al. [32] used satellite remote sensing observations to investigate SST cooling, which was induced by four typhoons in the Yellow Sea and the Bohai Sea in 2019, and explored the possible mechanisms. Combining the hybrid coordinate model (HYCOM) reanalysis results and moored observations, Cao et al. [33] and Yang et al. [34] explored the dynamical response of the upper South China Sea to Megi in 2014 and Noul in 2020, respectively.
Although the turbulent mixing is known to play a leading role in SST cooling caused by TCs, it is difficult to quantify the diapycnal diffusivity by conventional ship-based observations because of the extremely dangerous conditions under TCs, which limits our understanding to some extent. Fortunately, the temperature and salinity profiles measured by Argo floats provide us an opportunity to estimate the diapycnal diffusivity and understand the turbulent mixing induced by TCs [35]. In this study, based on 42 high-resolution temperature and salinity profiles measured by 6 Argo floats andsimultaneoussatellite-observed SST data and HYCOM reanalysis results, we investigated the dynamical and thermal response of the upper ocean to Super Typhoon Goni in 2015. The enhancement of turbulent mixing induced by Goni was quantified by estimating the diapycnal diffusivity based on the fine-scale parameterization method. The remainder of the paper is organized as follows. The data and analysis methodology are introduced in Section 2. In Section 3, the dynamical and thermal response of the upper ocean to Goni is shown. Finally, a discussion and conclusions complete the paper in Section 4 and Section 5, respectively.

2. Data and Methodology

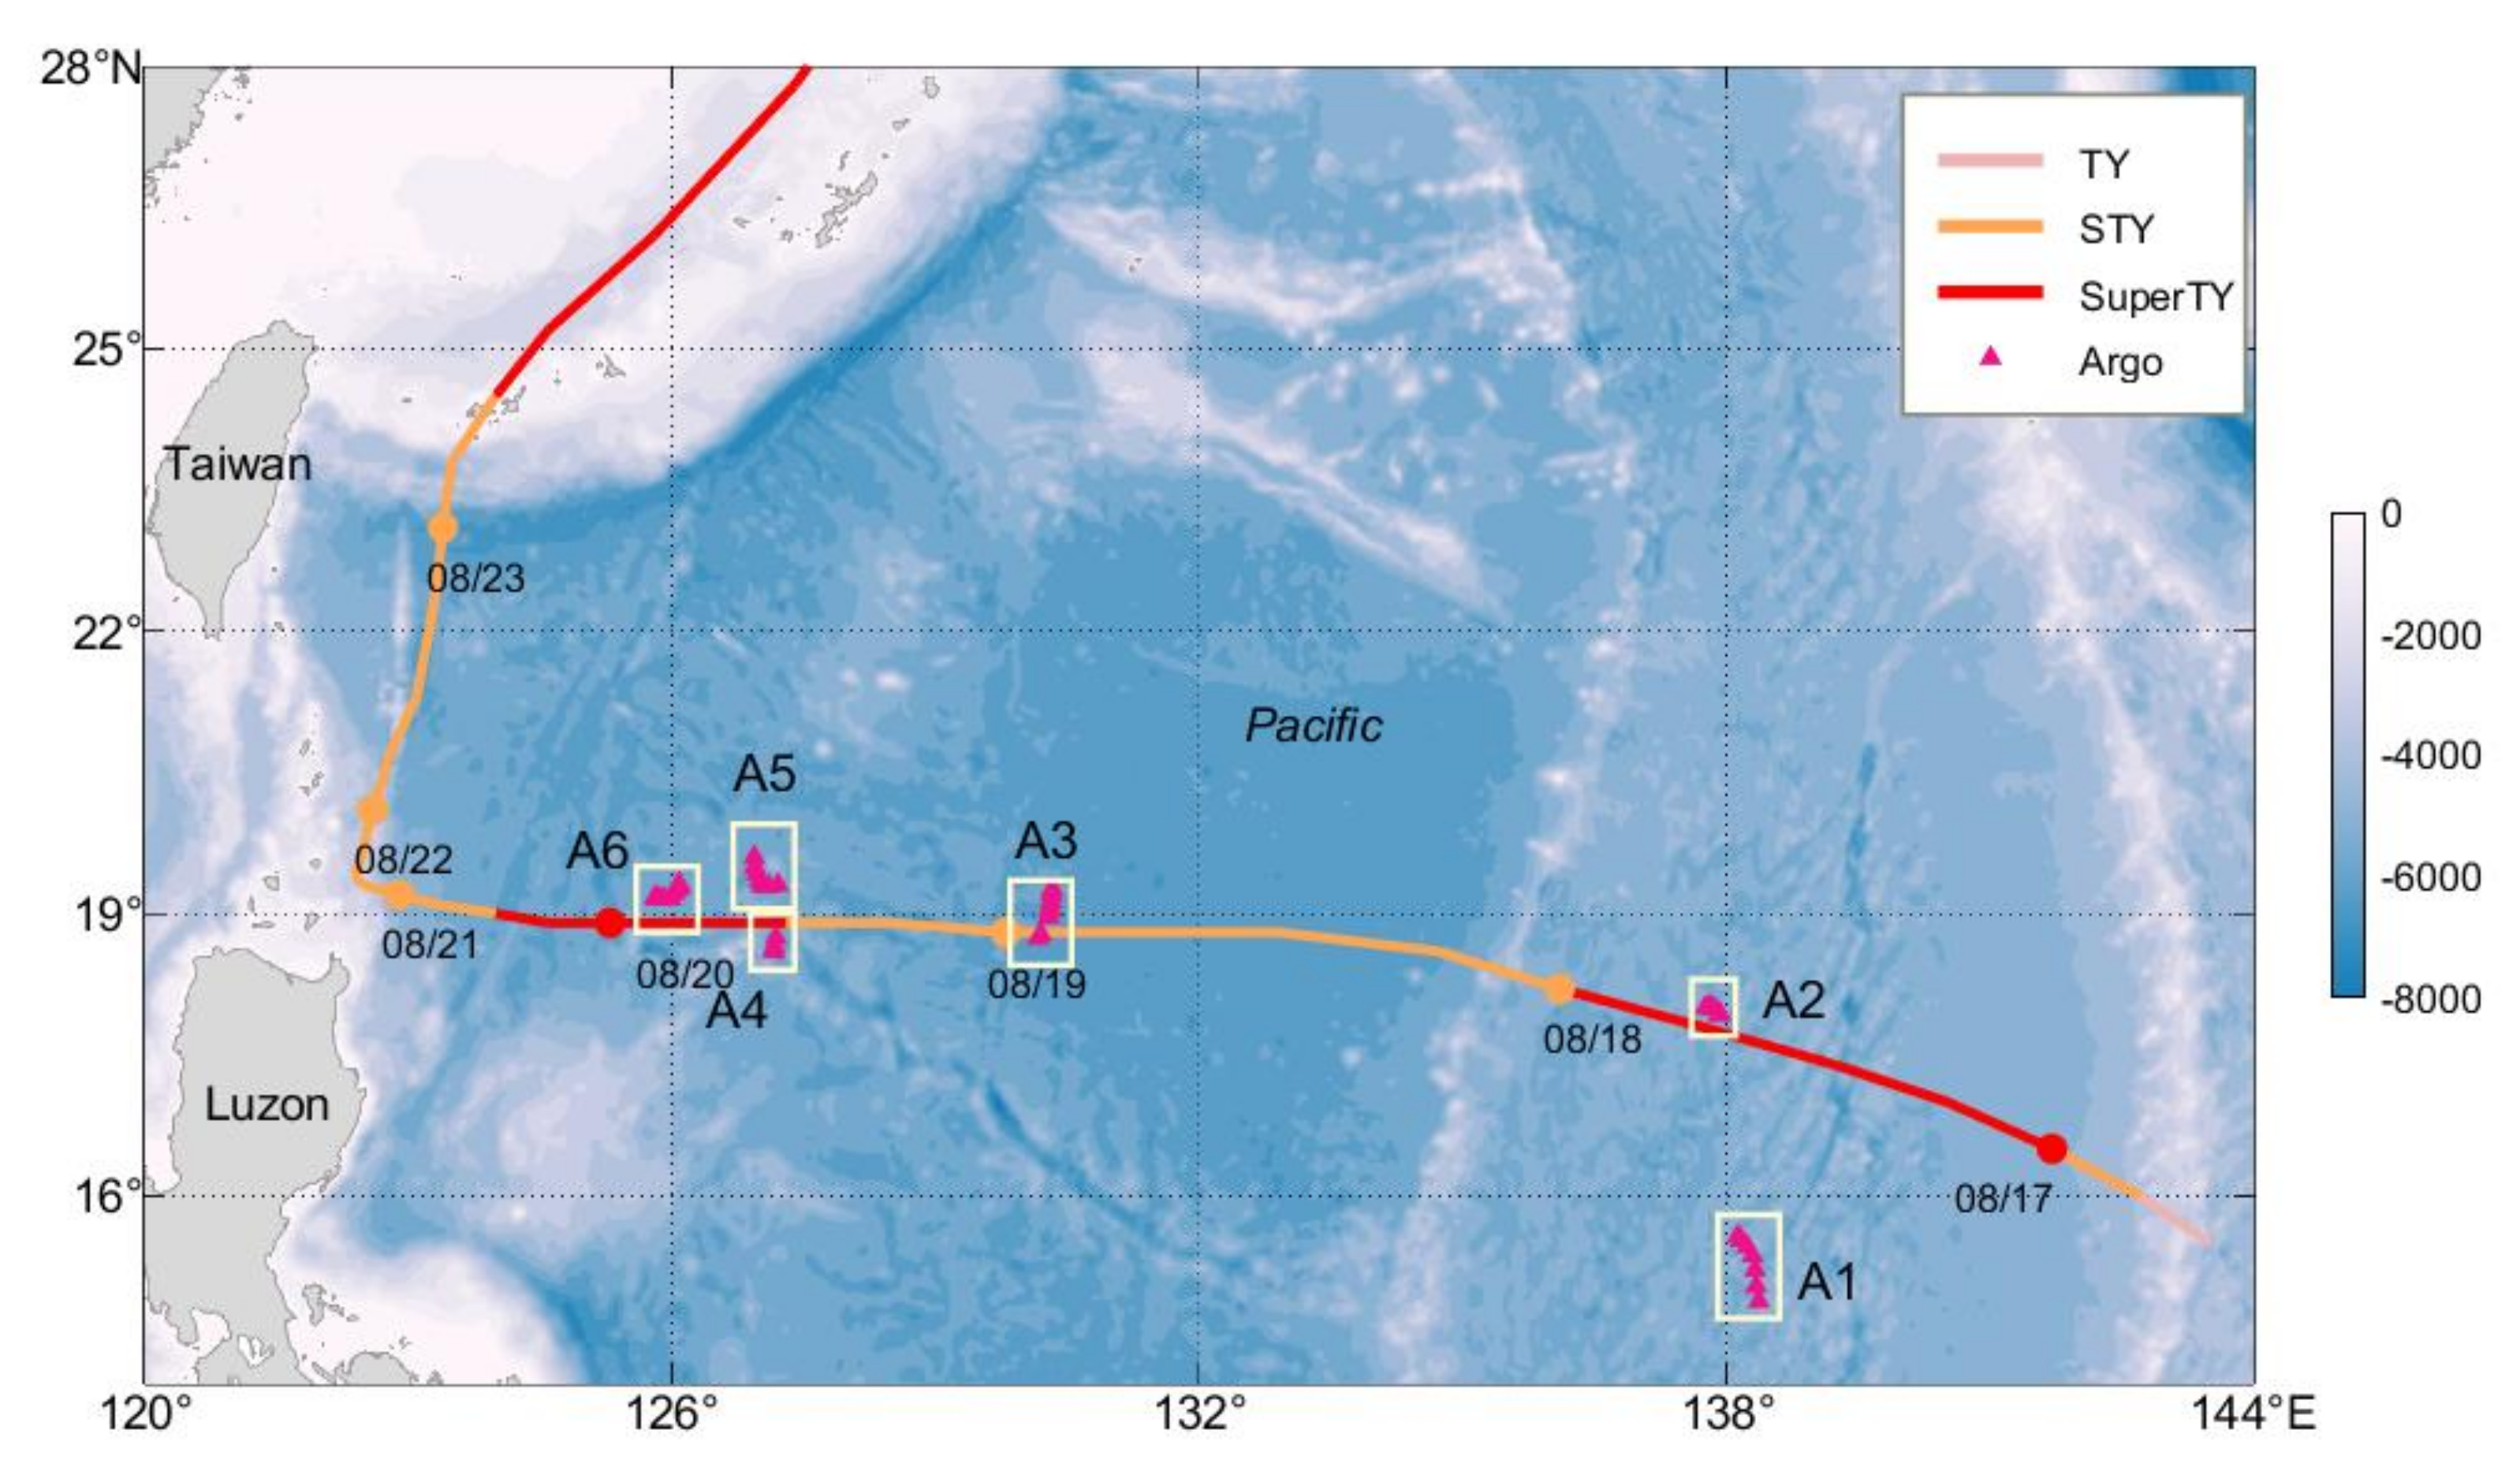
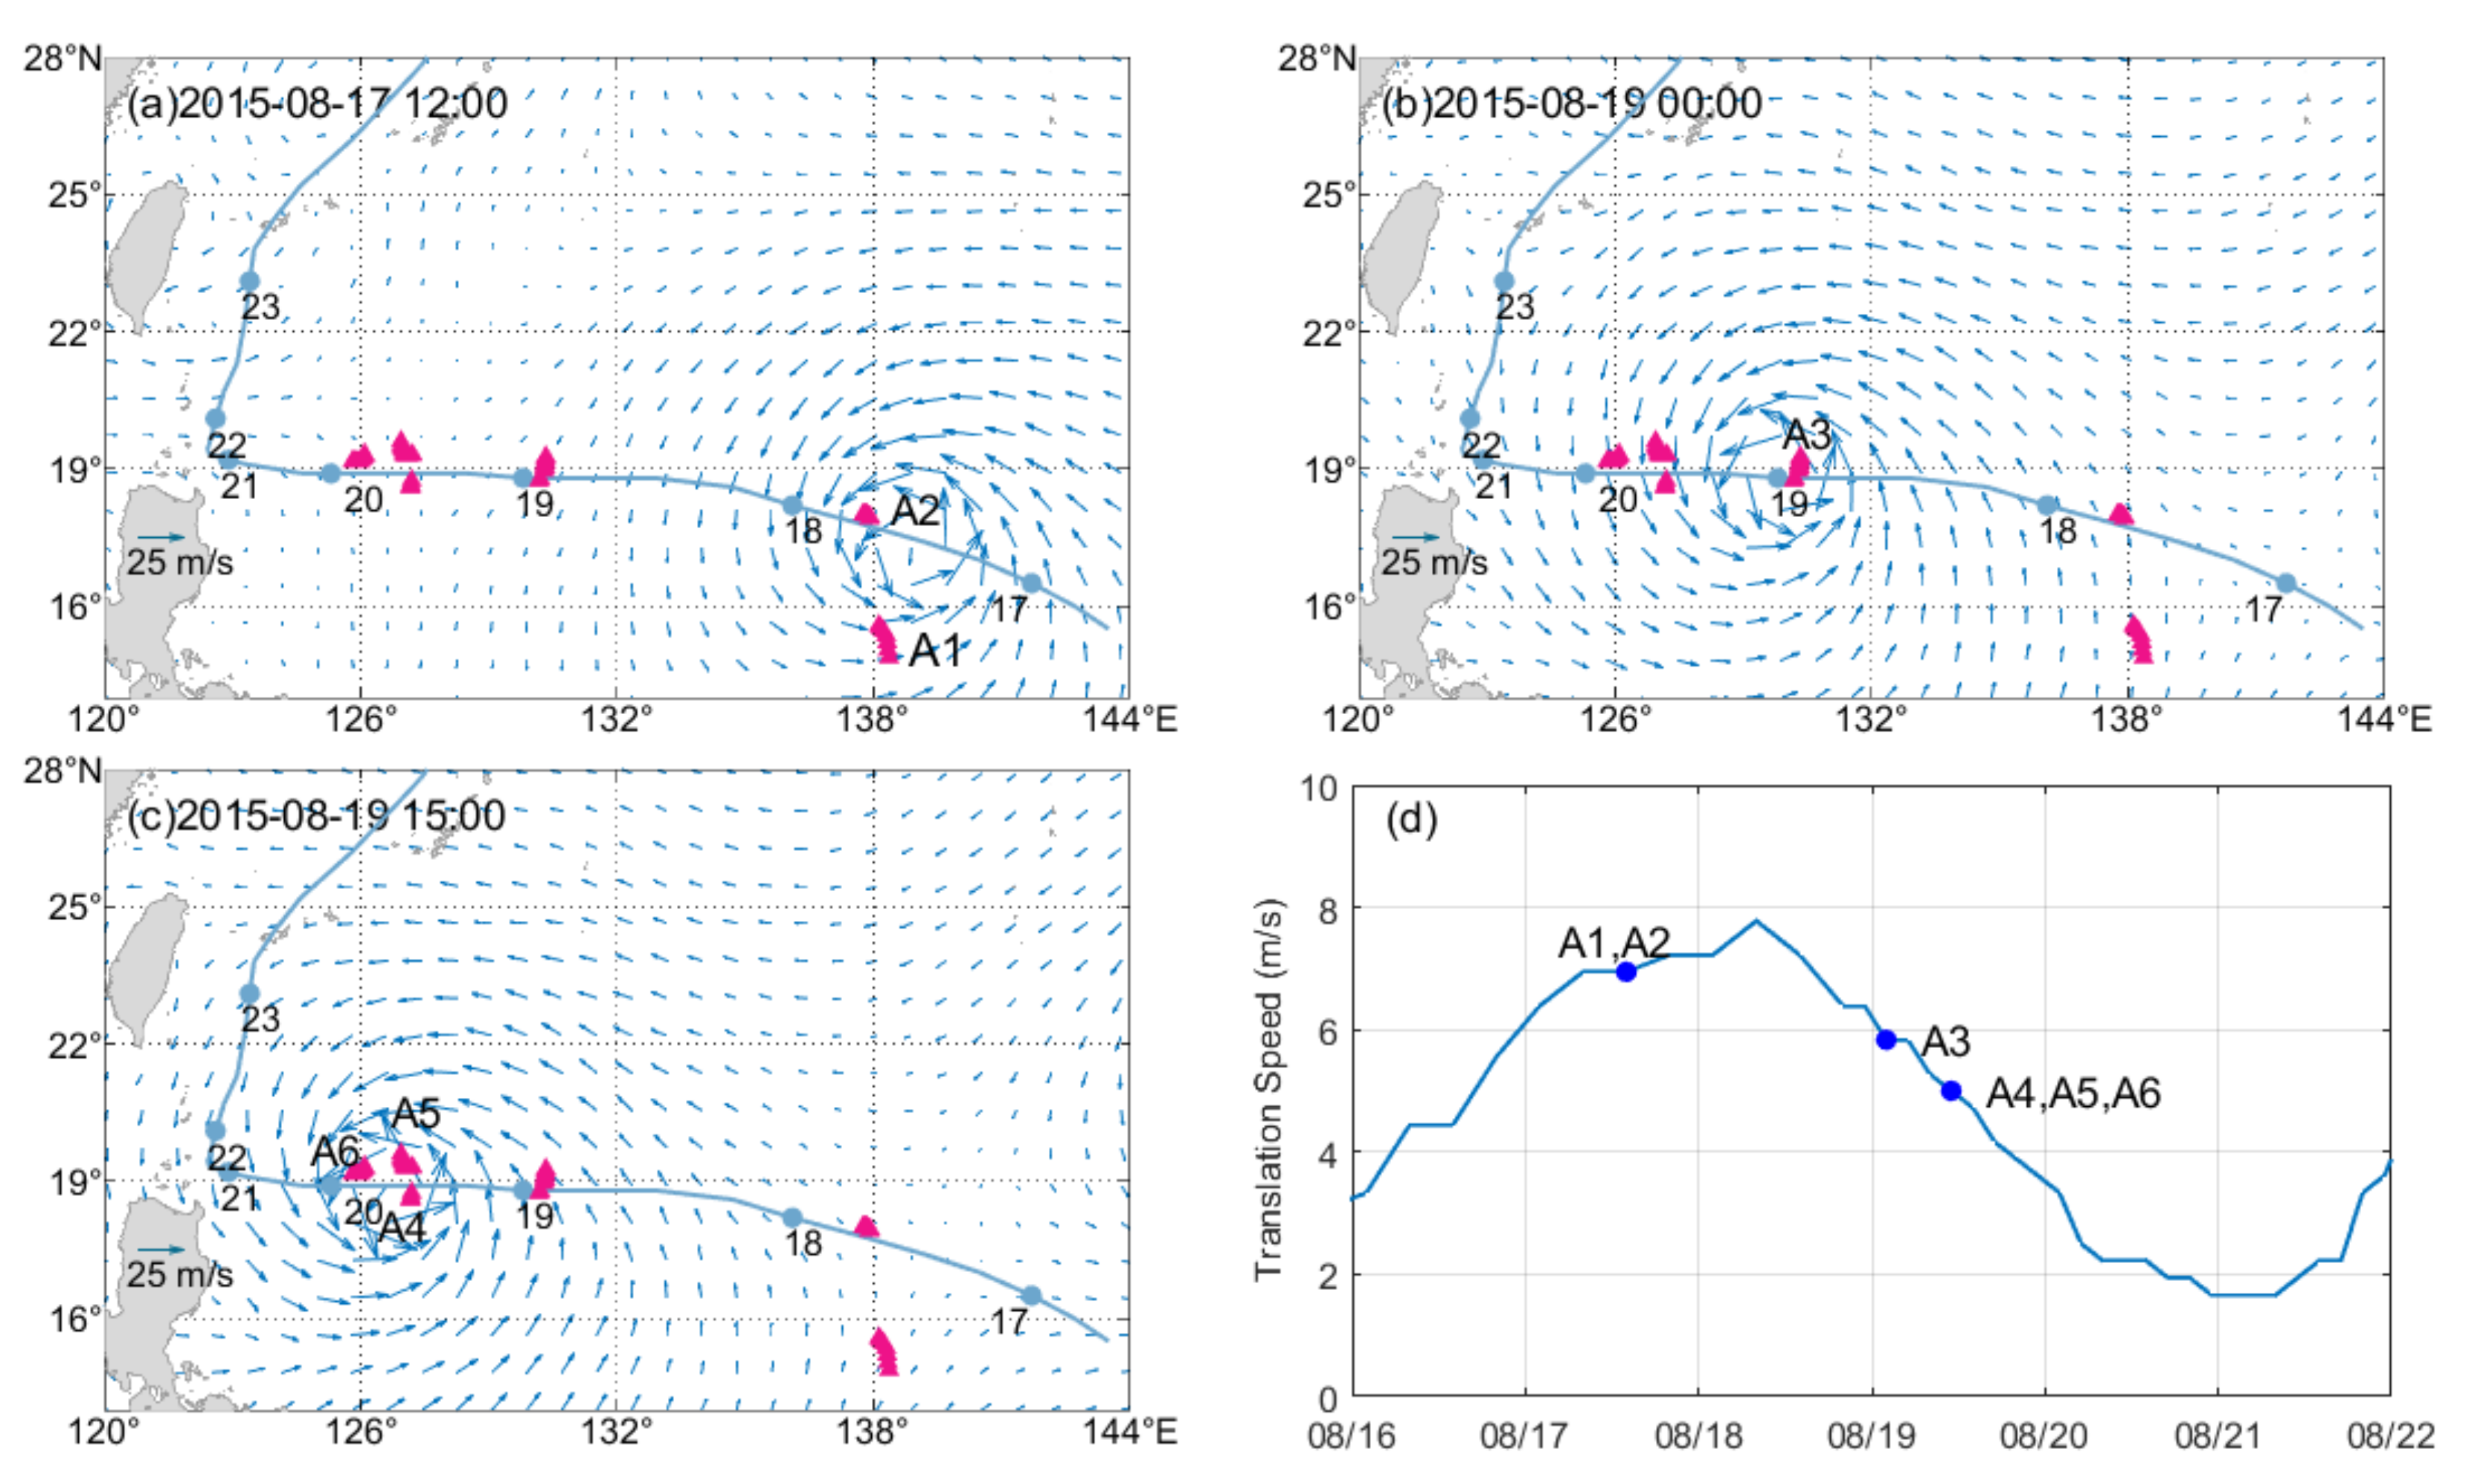
2.1. Super Typhoon Goni

Goni was a super typhoon that occurred in 2015 in the western Pacific. According to the best track data from the China Meteorological Administration tropical cyclone database (https://tcdata.typhoon.org.cn/, accessed on 20 April 2021, [36,37]). Goni first developed as a tropical storm east of the Mariana Islands (13°00′ N, 148°20′ E) at 1700 UTC on 15 August 2015. Thereafter, it quickly intensifiedinto a super typhoon with amaximum sustained wind speed of 52 m/s on 17 August. It weakened to a severe typhoon on 18 August but upgraded to a super typhoon on 19 August again. It soon weakened and continuedas a severe typhoon for three days, at about 150 km east of the Luzon Strait. Then, it moved to the northeast after 23 August through the Okinawa Trough. Figure 1 shows the track and intensity of Goni.

2.2. Data

The temperature and salinity profile data observed by the Argo floats were obtained from the China Argo Real-time Data Centre (https://www.argo.org.cn/, accessed on 24 April 2021). To explore the turbulent mixing of the upper ocean caused by Goni, we searched Argo floats from 7 to 28 August 2015, which meet the following requirements: (1) The Argo float had observation profiles both before and after the passage of Goni; (2) The position of the Argo float was within 300 km from Goni’s track; (3) Temperature and salinity profile data hada high vertical resolution (about 2 m). As shown in Figure 1, a total of 42 profiles measured by 6 Argo floats (A1–A6) were selected. Table 1 lists the detailed information of these Argo floats and profiles.
We downloaded the wind speed and direction data from the high-resolution Climate Forecast System, version 2 (CFSv2, https://rda.ucar.edu/, accessed on 9 May 2021) from the National Centers for Environmental Prediction (NCEP), which hasa spatial resolution of 38 km and a temporal interval of 6 h. As shown in Figure 2a–c, A2–A6 are nearly inside the typhoon center, but A1 is at the edge of the typhoon center. The translation speed of Goni is shown in Figure 2d.
We also used the microwave and infrared merged optimally interpolated SST data, which are provided by the remote sensing systems (https://www.remss.com/, accessed on 9 May 2021). The SST data have a spatial resolution of 1/4° and a temporal interval of one day. Moreover, the horizontal velocities derived from the HYCOM reanalysis results (GLBb0.08-53.X, https://www.hycom.org/, accessed on 21 May 2021) from 14 to 28 August with a spatial resolution of 1/12.5° and a temporal interval of 3 h were also used in this study. Appendix A showsthe comparison between the satellite-observed and HYCOM-simulated SST cooling, which validates thereasonability of the HYCOM reanalysis results.

2.3. Methodology

2.3.1. Gregg–Henyey–PolzinParameterization

Based on the internal wave–wave interaction theory [38], the Gregg–Henyey–Polzin (GHP) parameterization was used to estimate the diffusivity K:
K = K 0 ξ z 2 2 ξ z 2 G M 2 h 2 R ω j ( f / N )
where K0 = 5 × 10⁻⁶ m2s−1, <ξz2> and GM<ξz2> are the strain variance derived from the observations and the Garrett–Munk model spectrum [39], respectively, and h2(Rω) and j(f/N) are the correction items of internal wave structure and latitude:
h R ω 2 = 1 6 2 R ω R ω + 1 R ω 1
j ( f / N ) = f arccosh ( N / f ) f 30 arccosh N 0 / f 30
where Rω represents the shear/strain variance ratio, which was suggested to be a constant of 7 in the western north Pacific [15], f and N are the Coriolis and buoyancy frequencies, f30 = f (30°), and N0 = 5.2 × 10⁻³ rads−1.
All the temperature and salinity profiles measured by the Argo floats were broken into 300-m segments to evaluate the strain spectra and then the segment-averaged diffusivity. According to [38,40,41], the GHP parameterization is not applicable in the upper ocean, because the strain spectrum may be contaminated due to great depth variability in the background stratification. Therefore, the temperature and salinity data in the upper 100 m were not used. The strain was calculated by:
ξ z = N 2 N 2 ¯ N 2 ¯
where N 2 ( z ) = g ρ 0 d σ d z , obtained by the vertical difference of the potential density, and σ is the potential density. N 2 ¯ is the mean value of stratification squared obtained by quadratic fitting of the potential density for each segment. Based on the multi-taper technique, Fourier transform gives the spectral representation φ(k) for each segment [40,42,43]. Strain variance is determined by integrating φ(k) from the lowest resolved wavenumber kmin = 2π/150 rads−1 to the maximum wavenumber kmax which satisfies
ξ z 2 = k min k max φ ( k ) d k = 0.1
The strain corresponding to Garrett–Munk model spectrum is calculated as
ξ z 2 G M = π E 0 b j * 2 k min k max k 2 k + k * 2 d k
where E0 = 6.3 × 10⁻⁵, b = 1300 m is the scale depth of the thermocline, j* = 3 is the reference mode number, k * = π j * N / b N 0 is the reference wave number [44].

2.3.2. Near-Inertial Kinetic Energy (NIKE)

In this study, the power spectral analysis was performed on the HYCOM horizontal velocities at 19.5° N, 132° E in August 2015. Based on the result of the power spectral analysis, the fourth-order Butterworth filter was adopted to extract the near-inertial velocities [33] with a cutoff frequency of [0.53, 0.87] cpd, corresponding to 0.80–1.30 times the local Coriolis frequency. Thereafter, the NIKE was calculated as
NIKE = 1 2 ρ 0 u f 2 + v f 2
where ρ0 = 1024 kgm−3 is the seawater density, uf and vf are the zonal and meridional near-inertial velocities, respectively.

3. Ocean Response to Super TyphonGoni

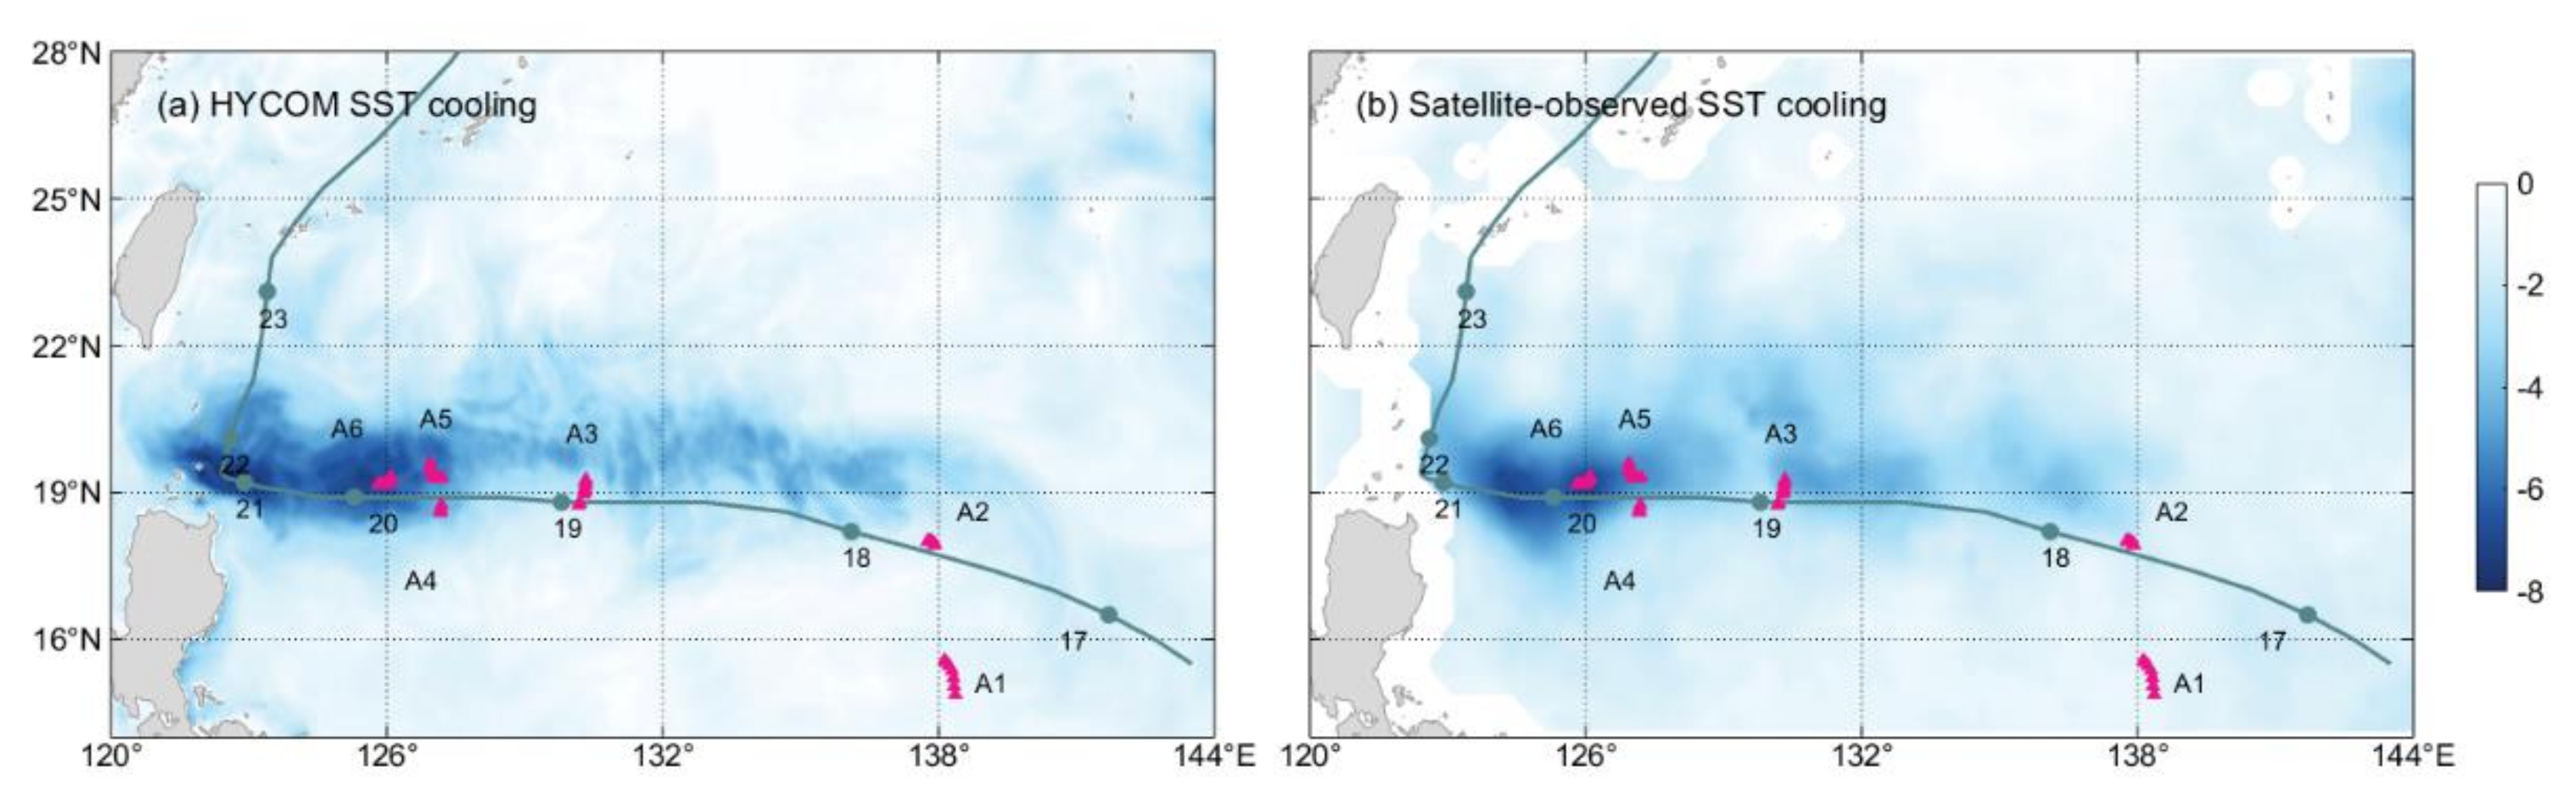
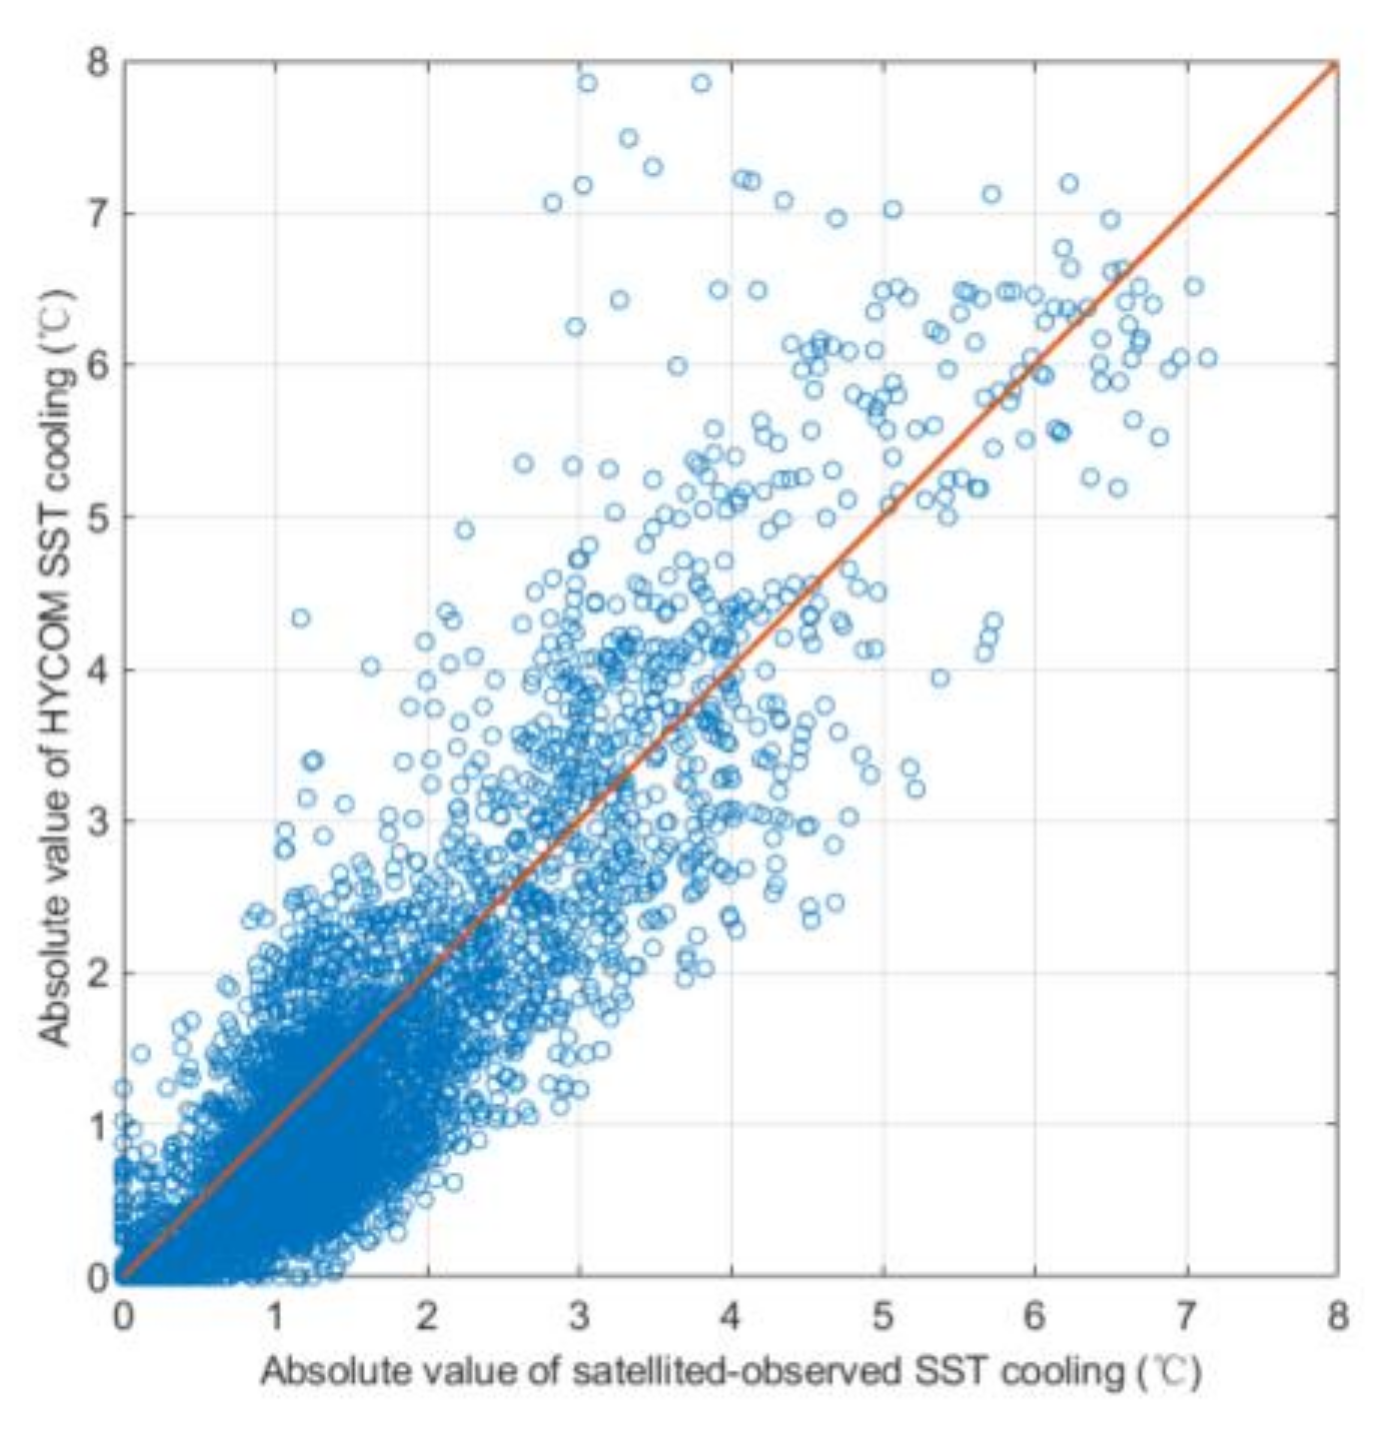
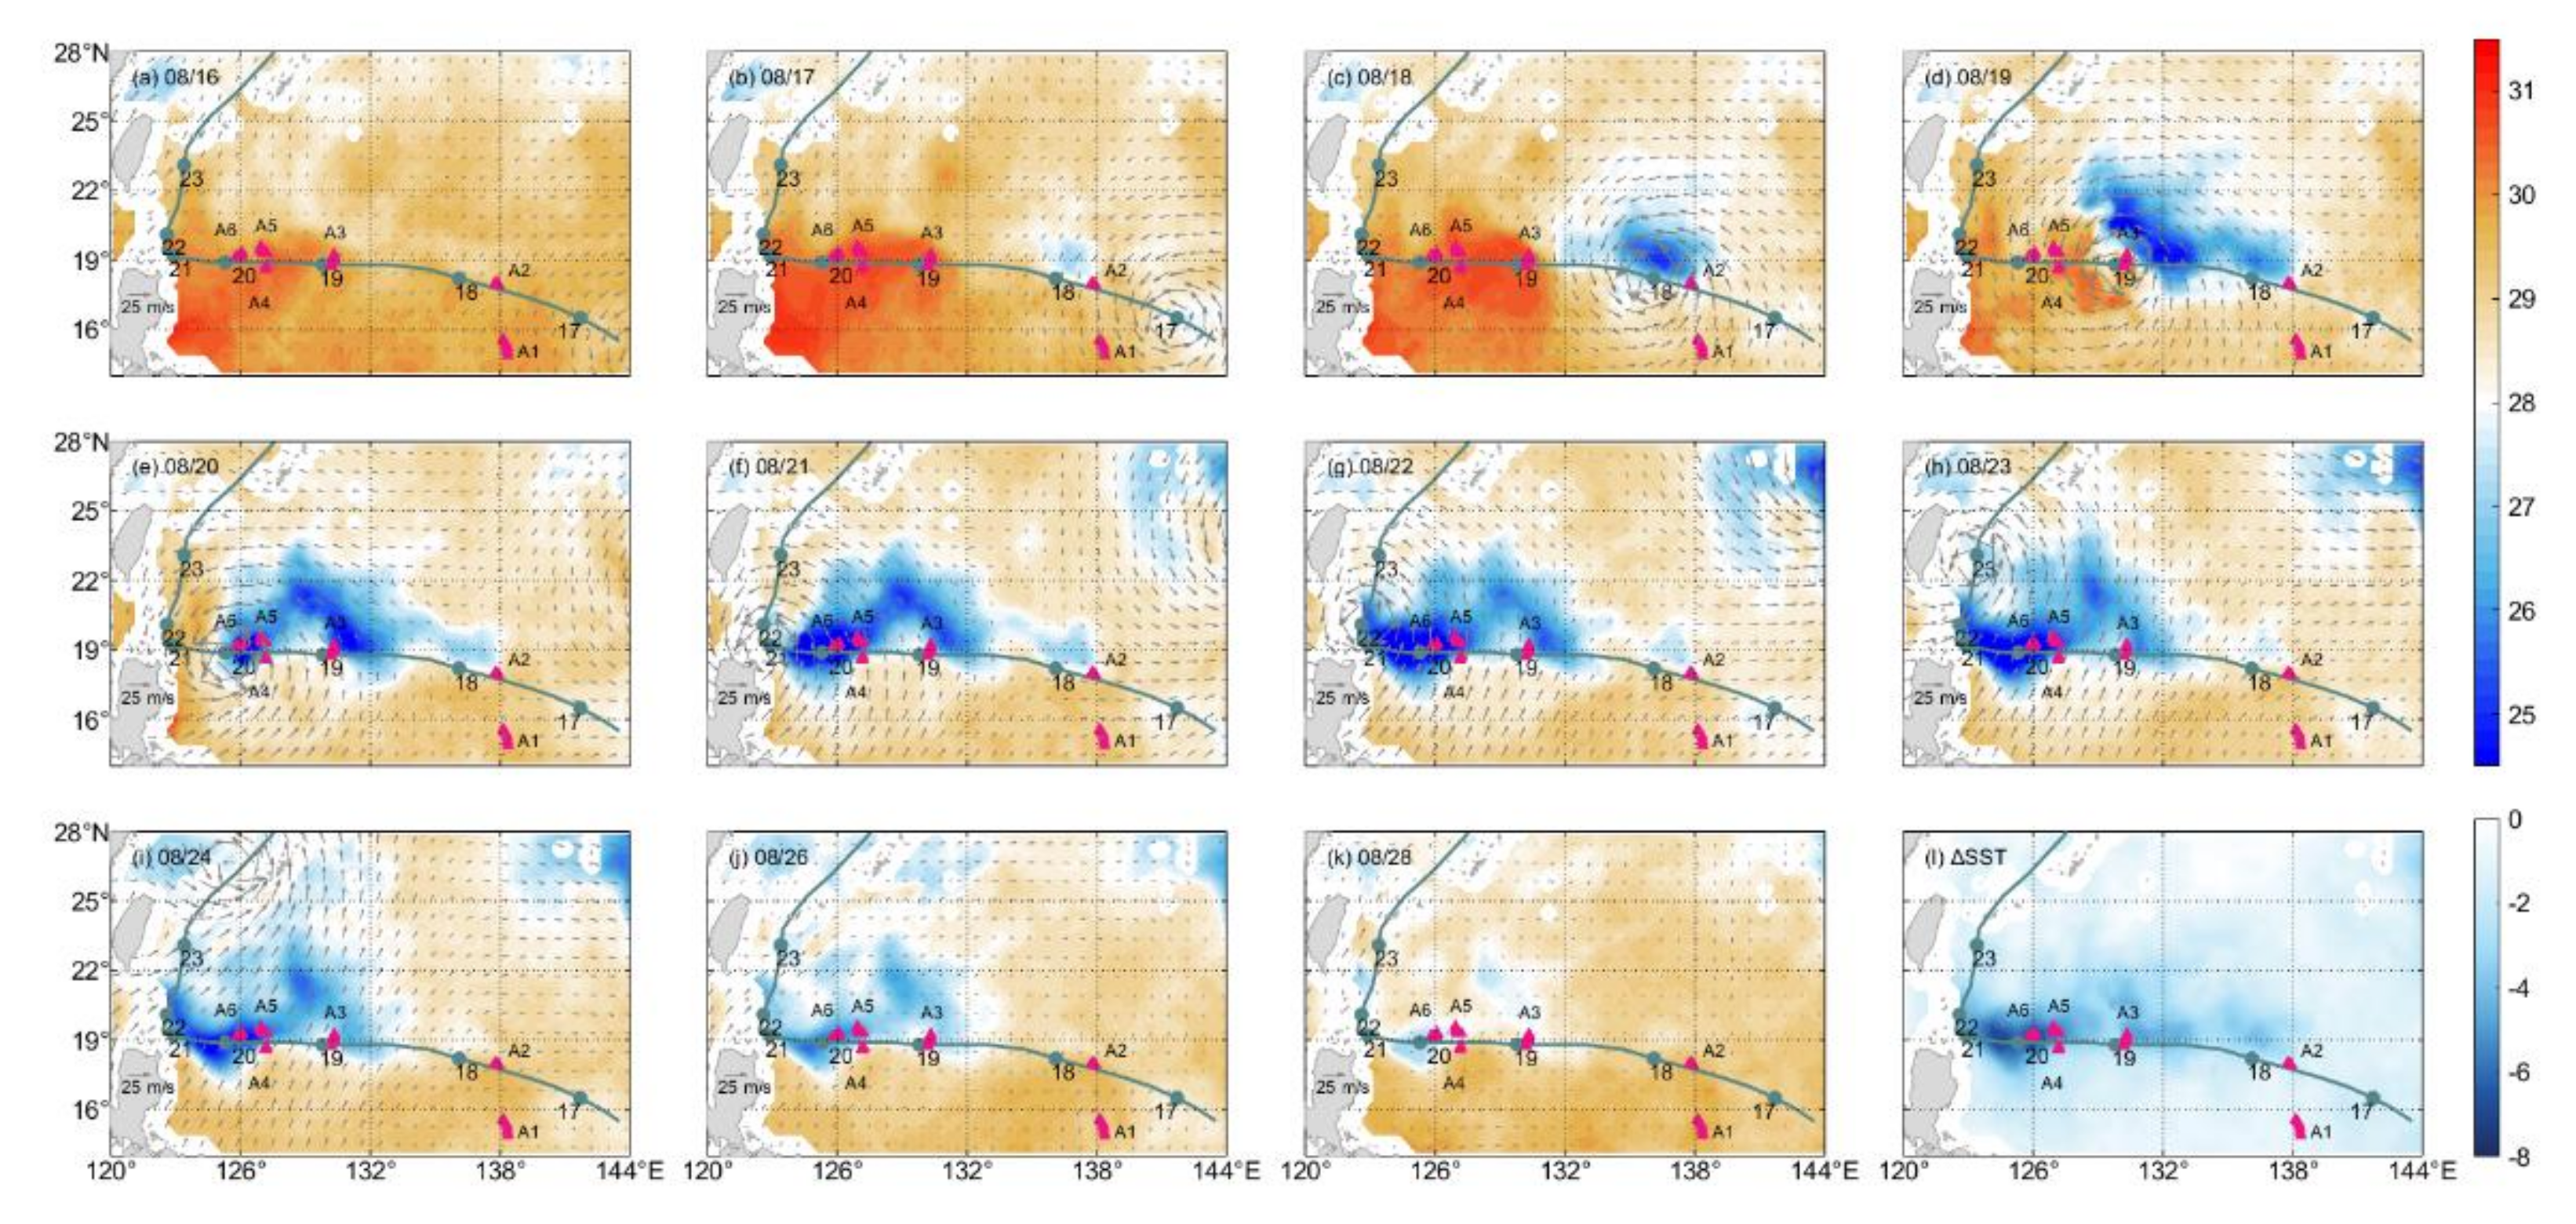
3.1. Satellite-Observed SST Cooling

Based on the satellite-observed data, the SST evolution during the passage of Goni from 16 to 28 August is shown in Figure 3a–k. On 16 August, when Goni did not enter the domain (Figure 3a), the SST was generally higher than 29 °C and the highest SST exceeding 31 °C appeared to the east of Luzon Island. On 17 August (Figure 3b), Goni entered the Philippine Sea, and the SST to the right of the typhoon track was cooled slightly. From 18 to 21 August (Figure 3c–f), as Goni moved westward, the range of SST cooling also moved westward and expanded. The SST cooling was enhanced on 22 and 23 August (Figure 3g,h) when Goni was about to leave this region. The lowest SST (smaller than 25 °C) appeared at 150 km east of the Luzon Strait, which was the location Goni turned northward. After 24 August when Goni left the domain, the SST was gradually heating (Figure 3i–k). On 28 August, the SST almost shared the same pattern as that of before the passage of Goni, except for the region to the east of the Luzon Strait and Luzon Island. Figure 3l displays the maximum SST cooling caused by Goni, which was calculated as the difference between the minimum SST from 17 to 24 August and the SST on 16 August. As shown, Goni caused significant SST cooling in the domain. The maximum SST cooling was 7.7 °C, appearing at about 150 km east ofthe Luzon Strait.

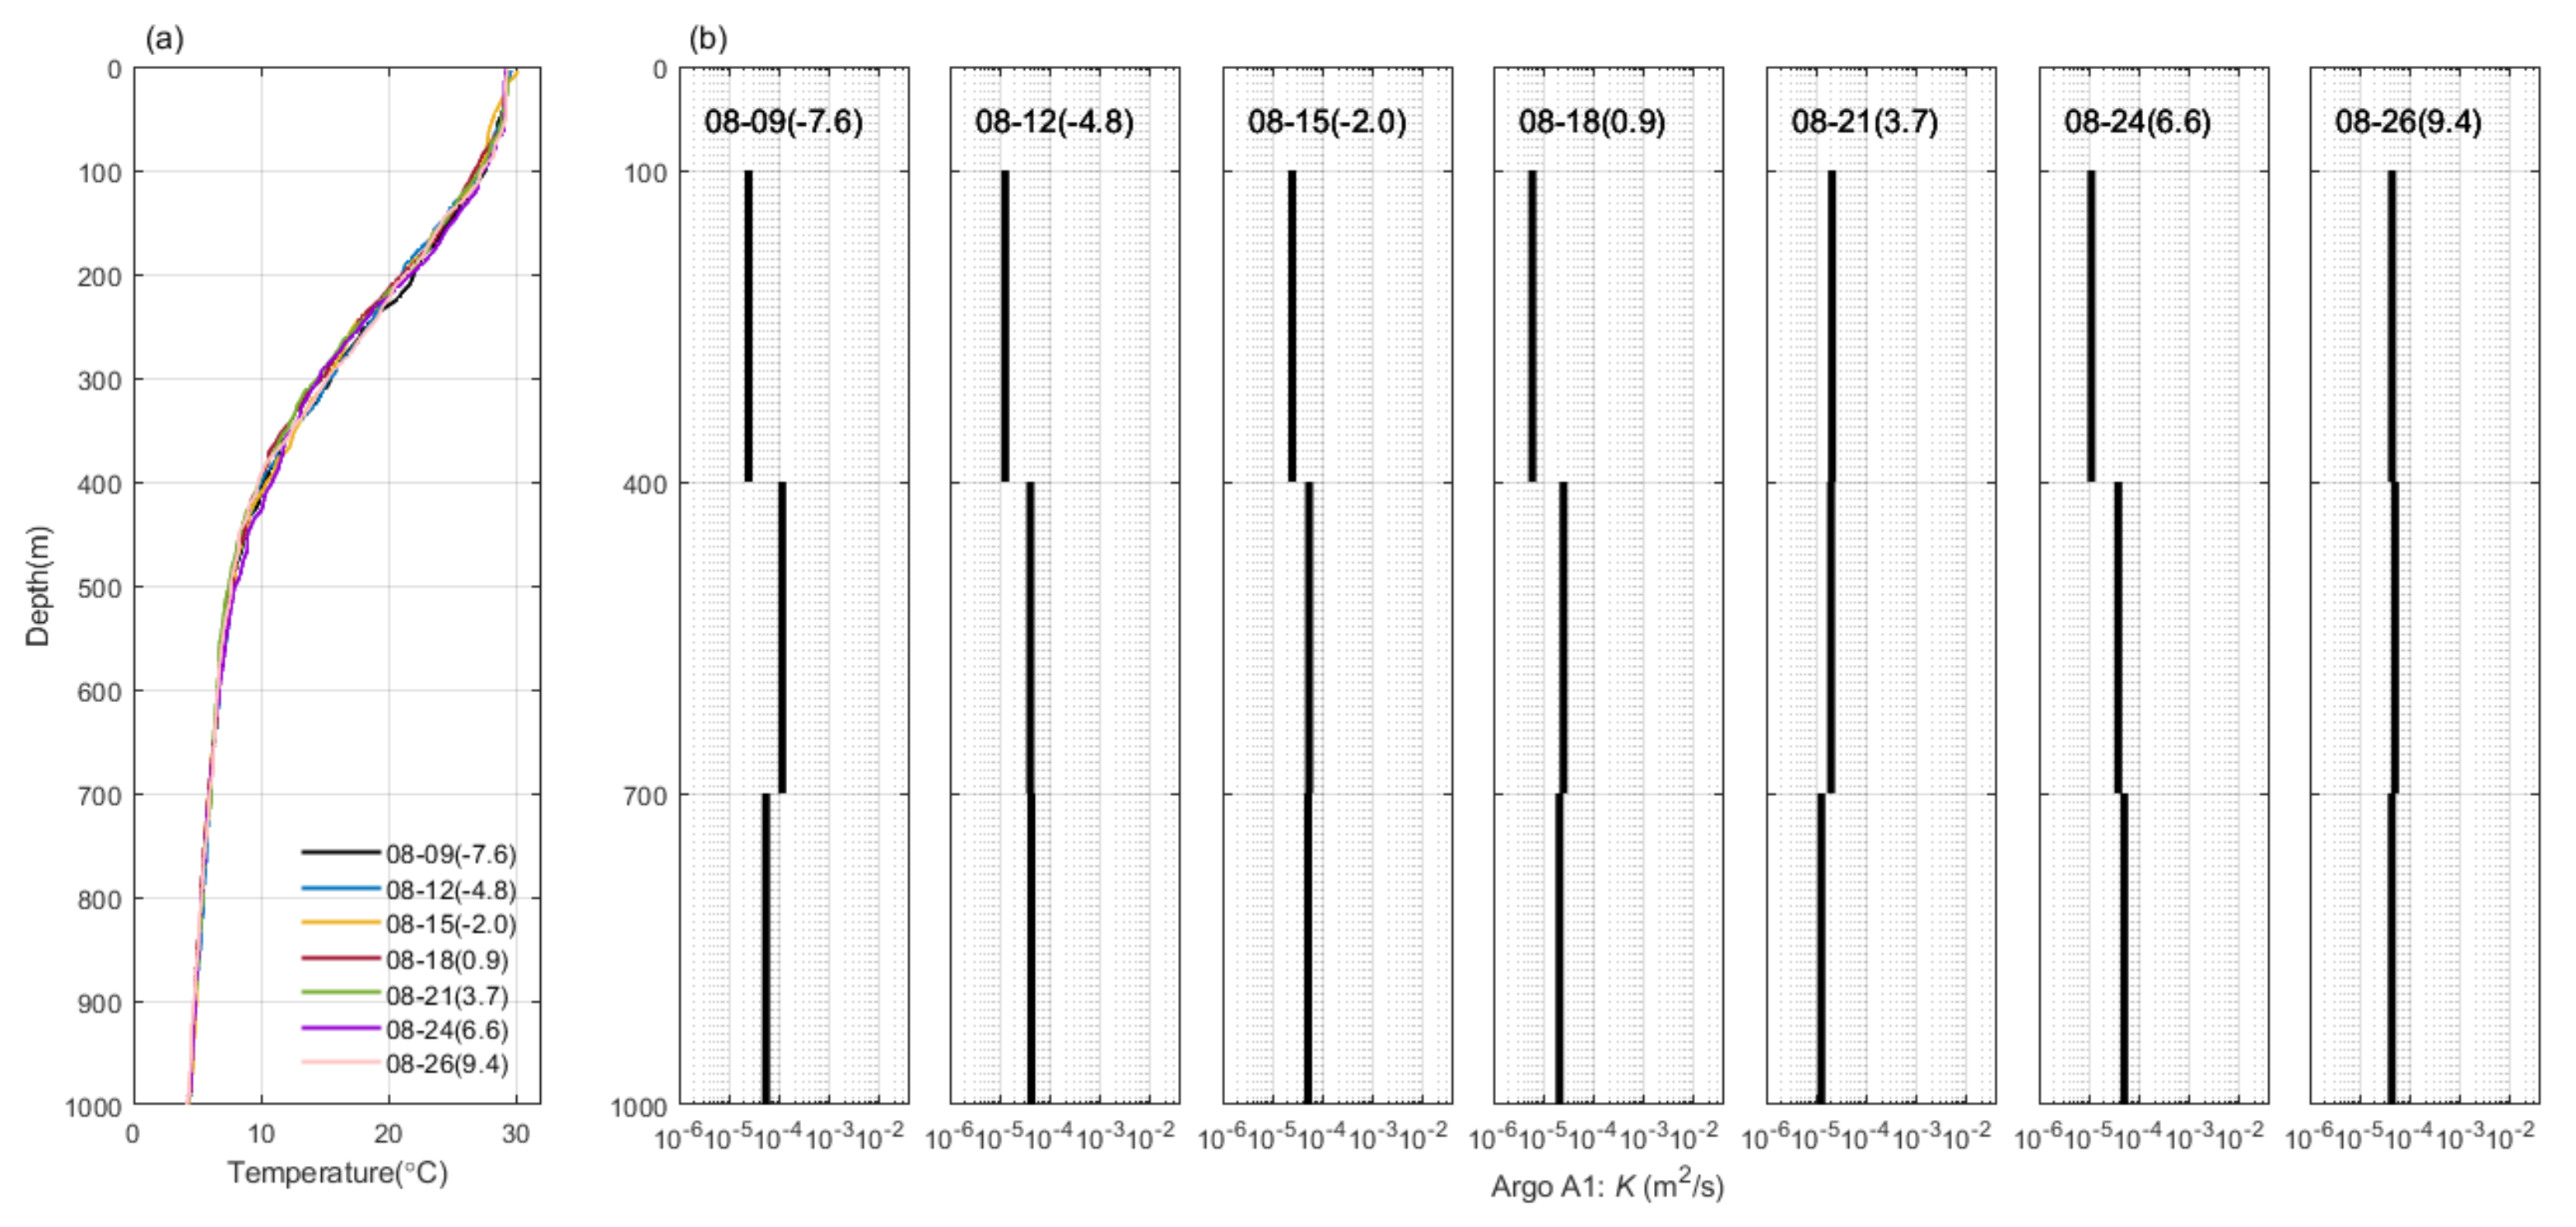
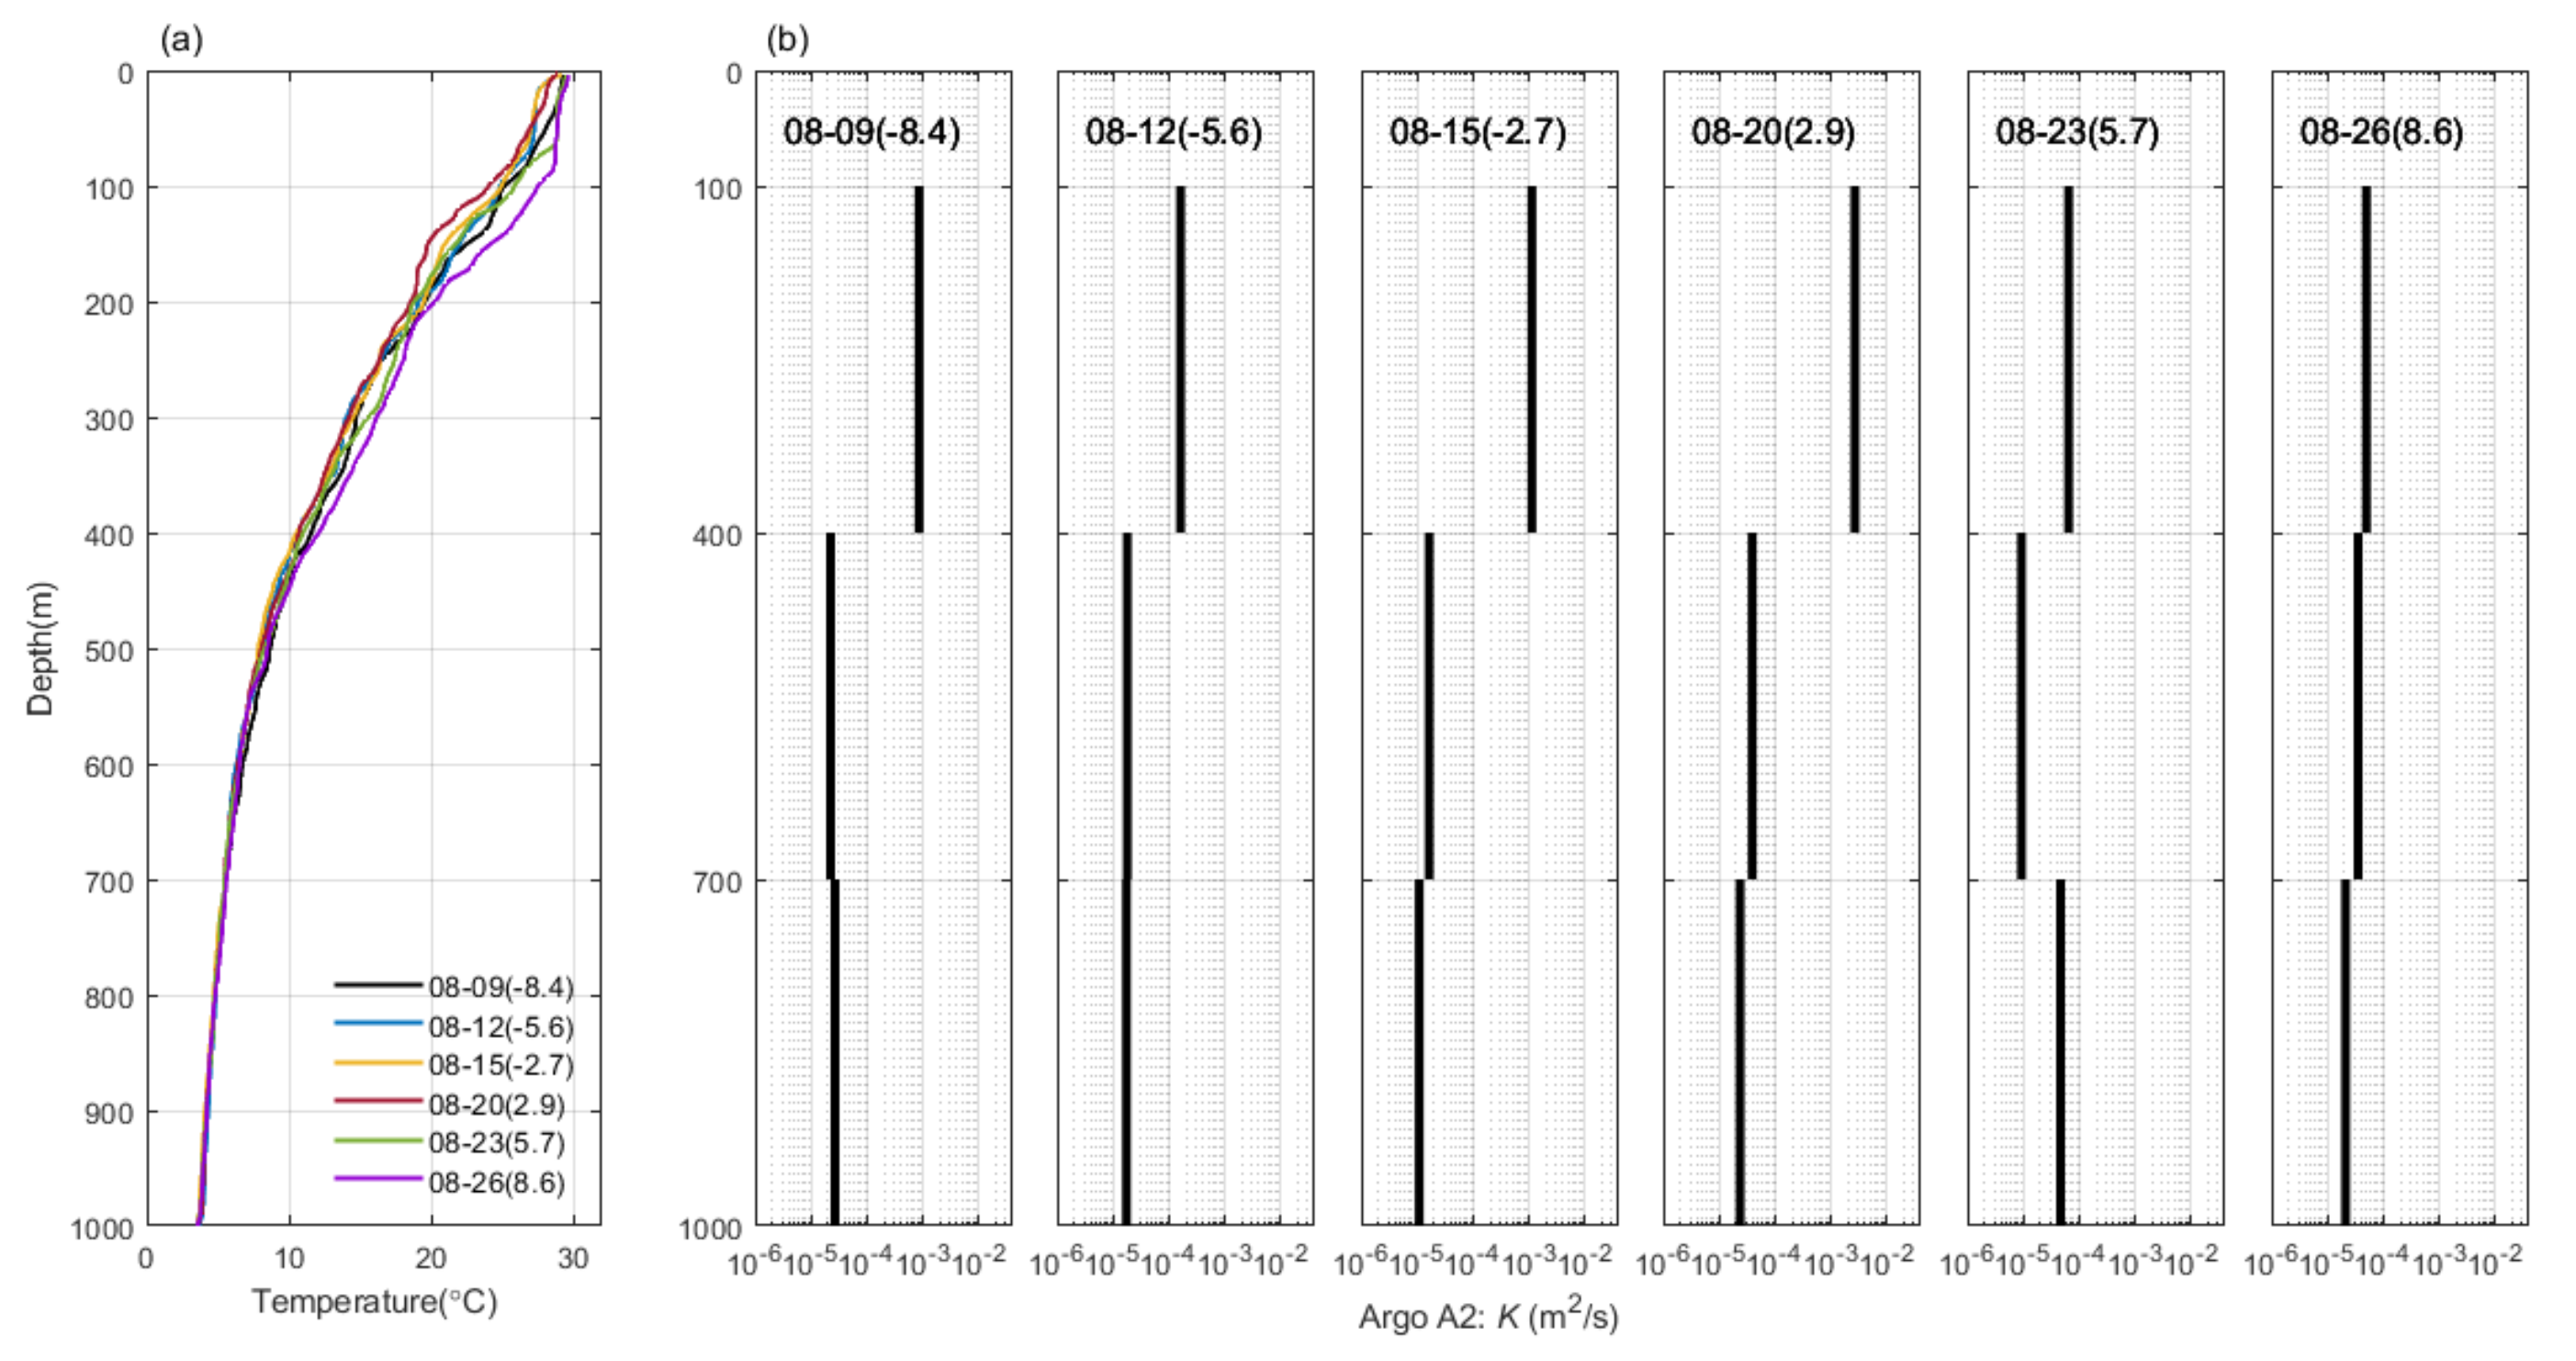
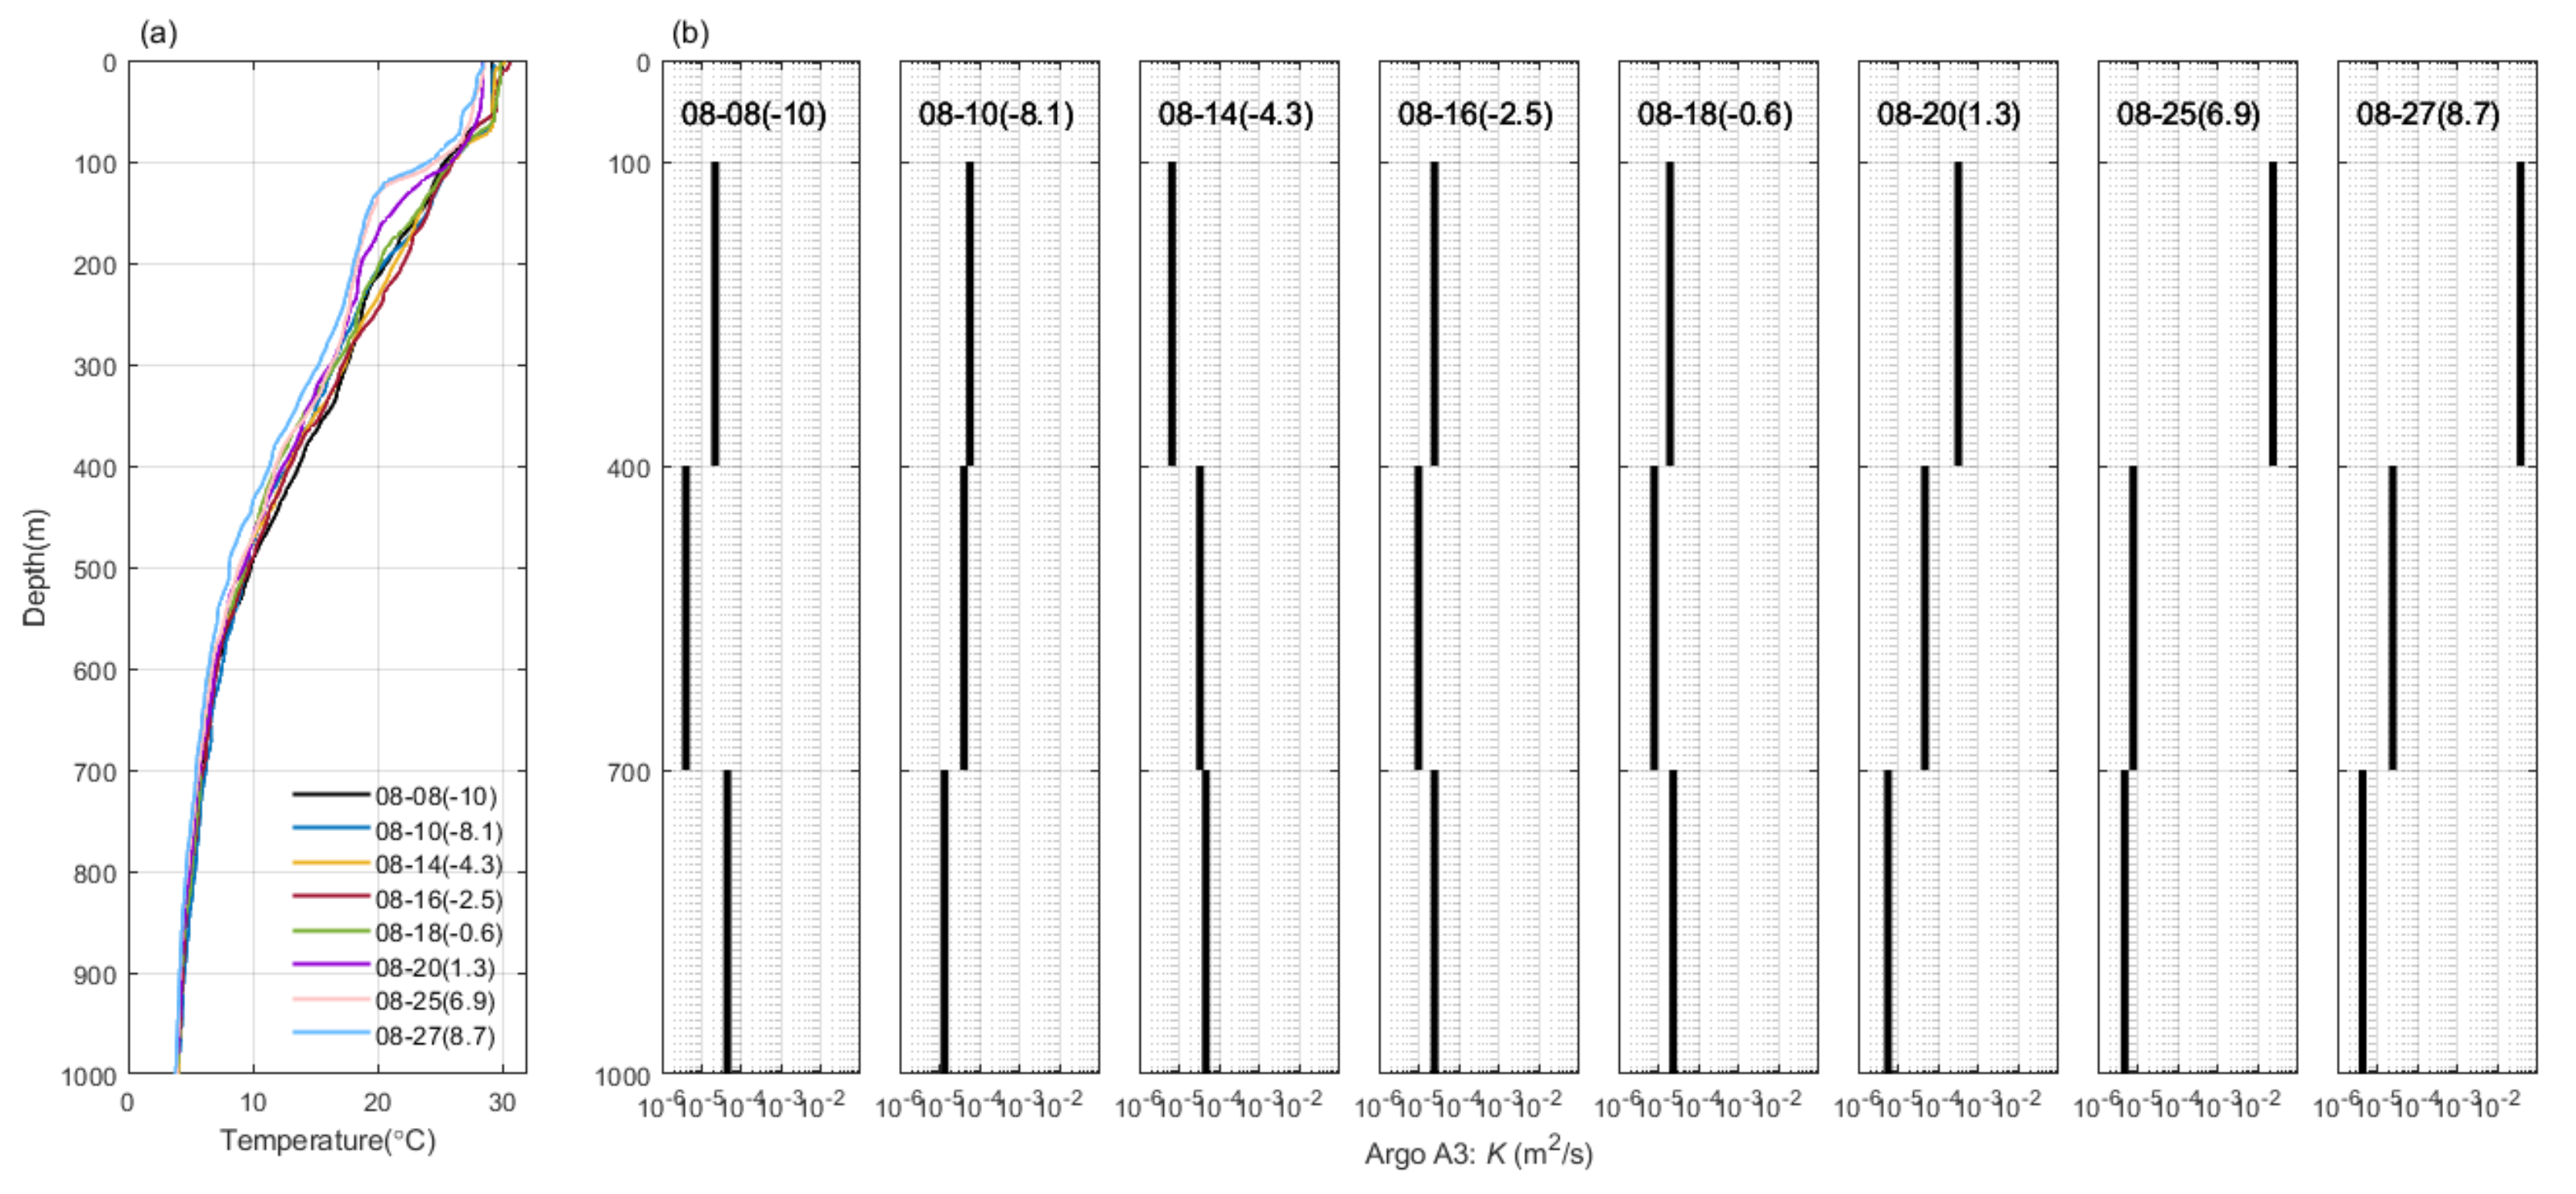
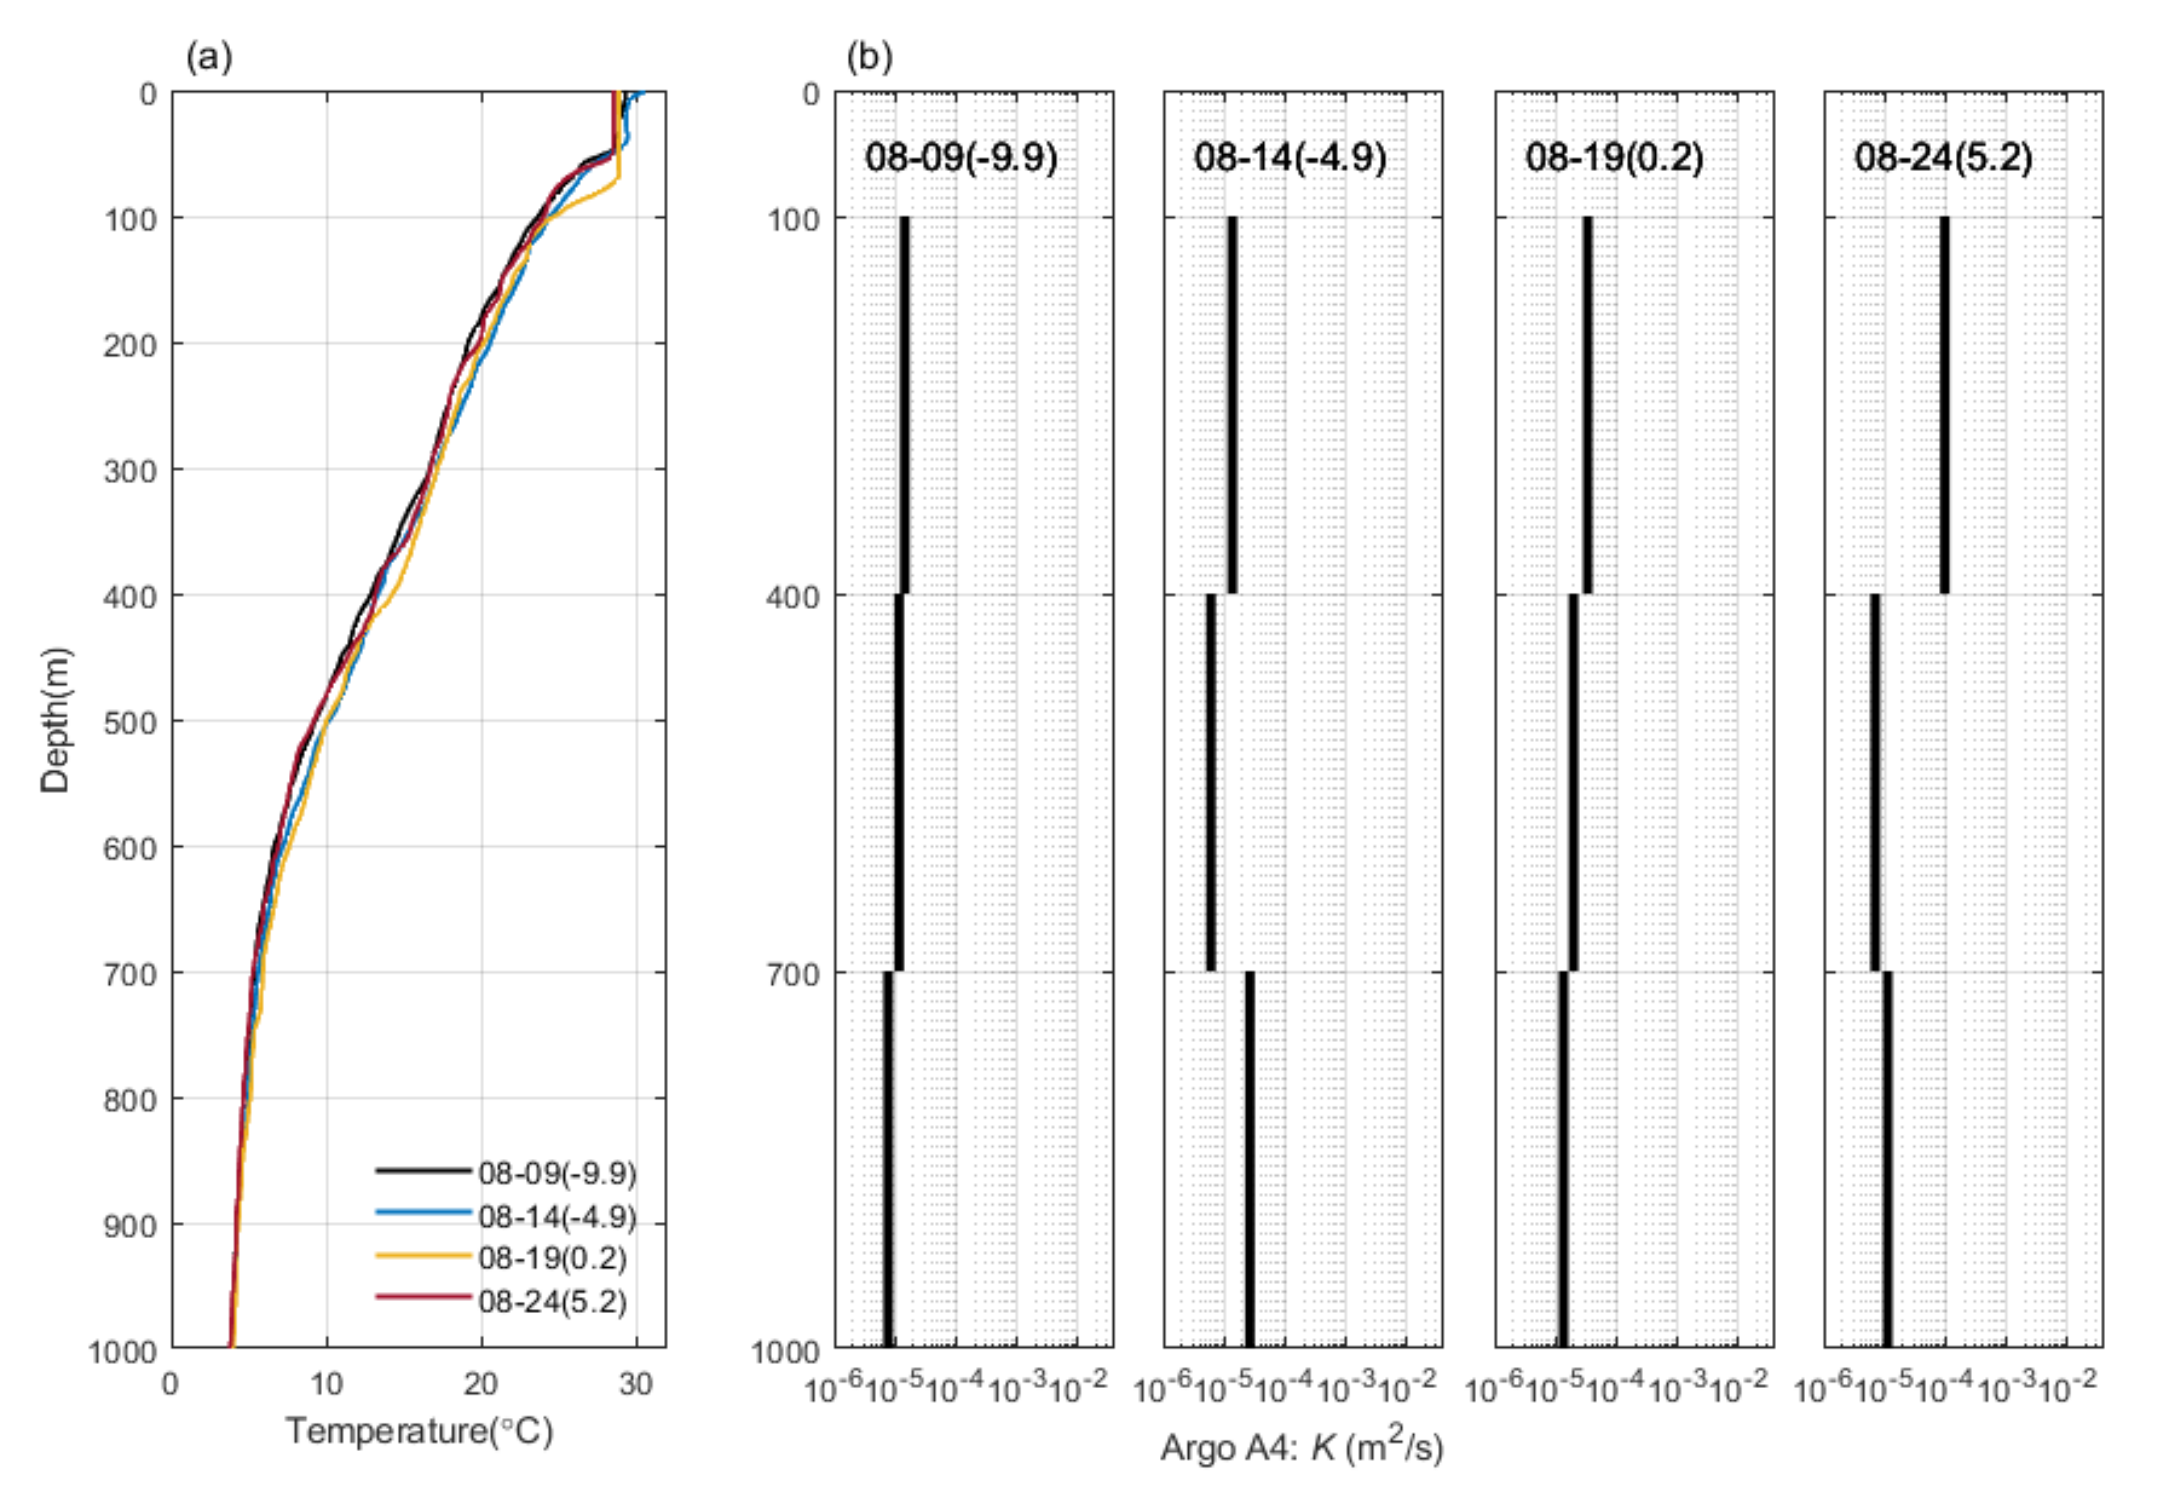
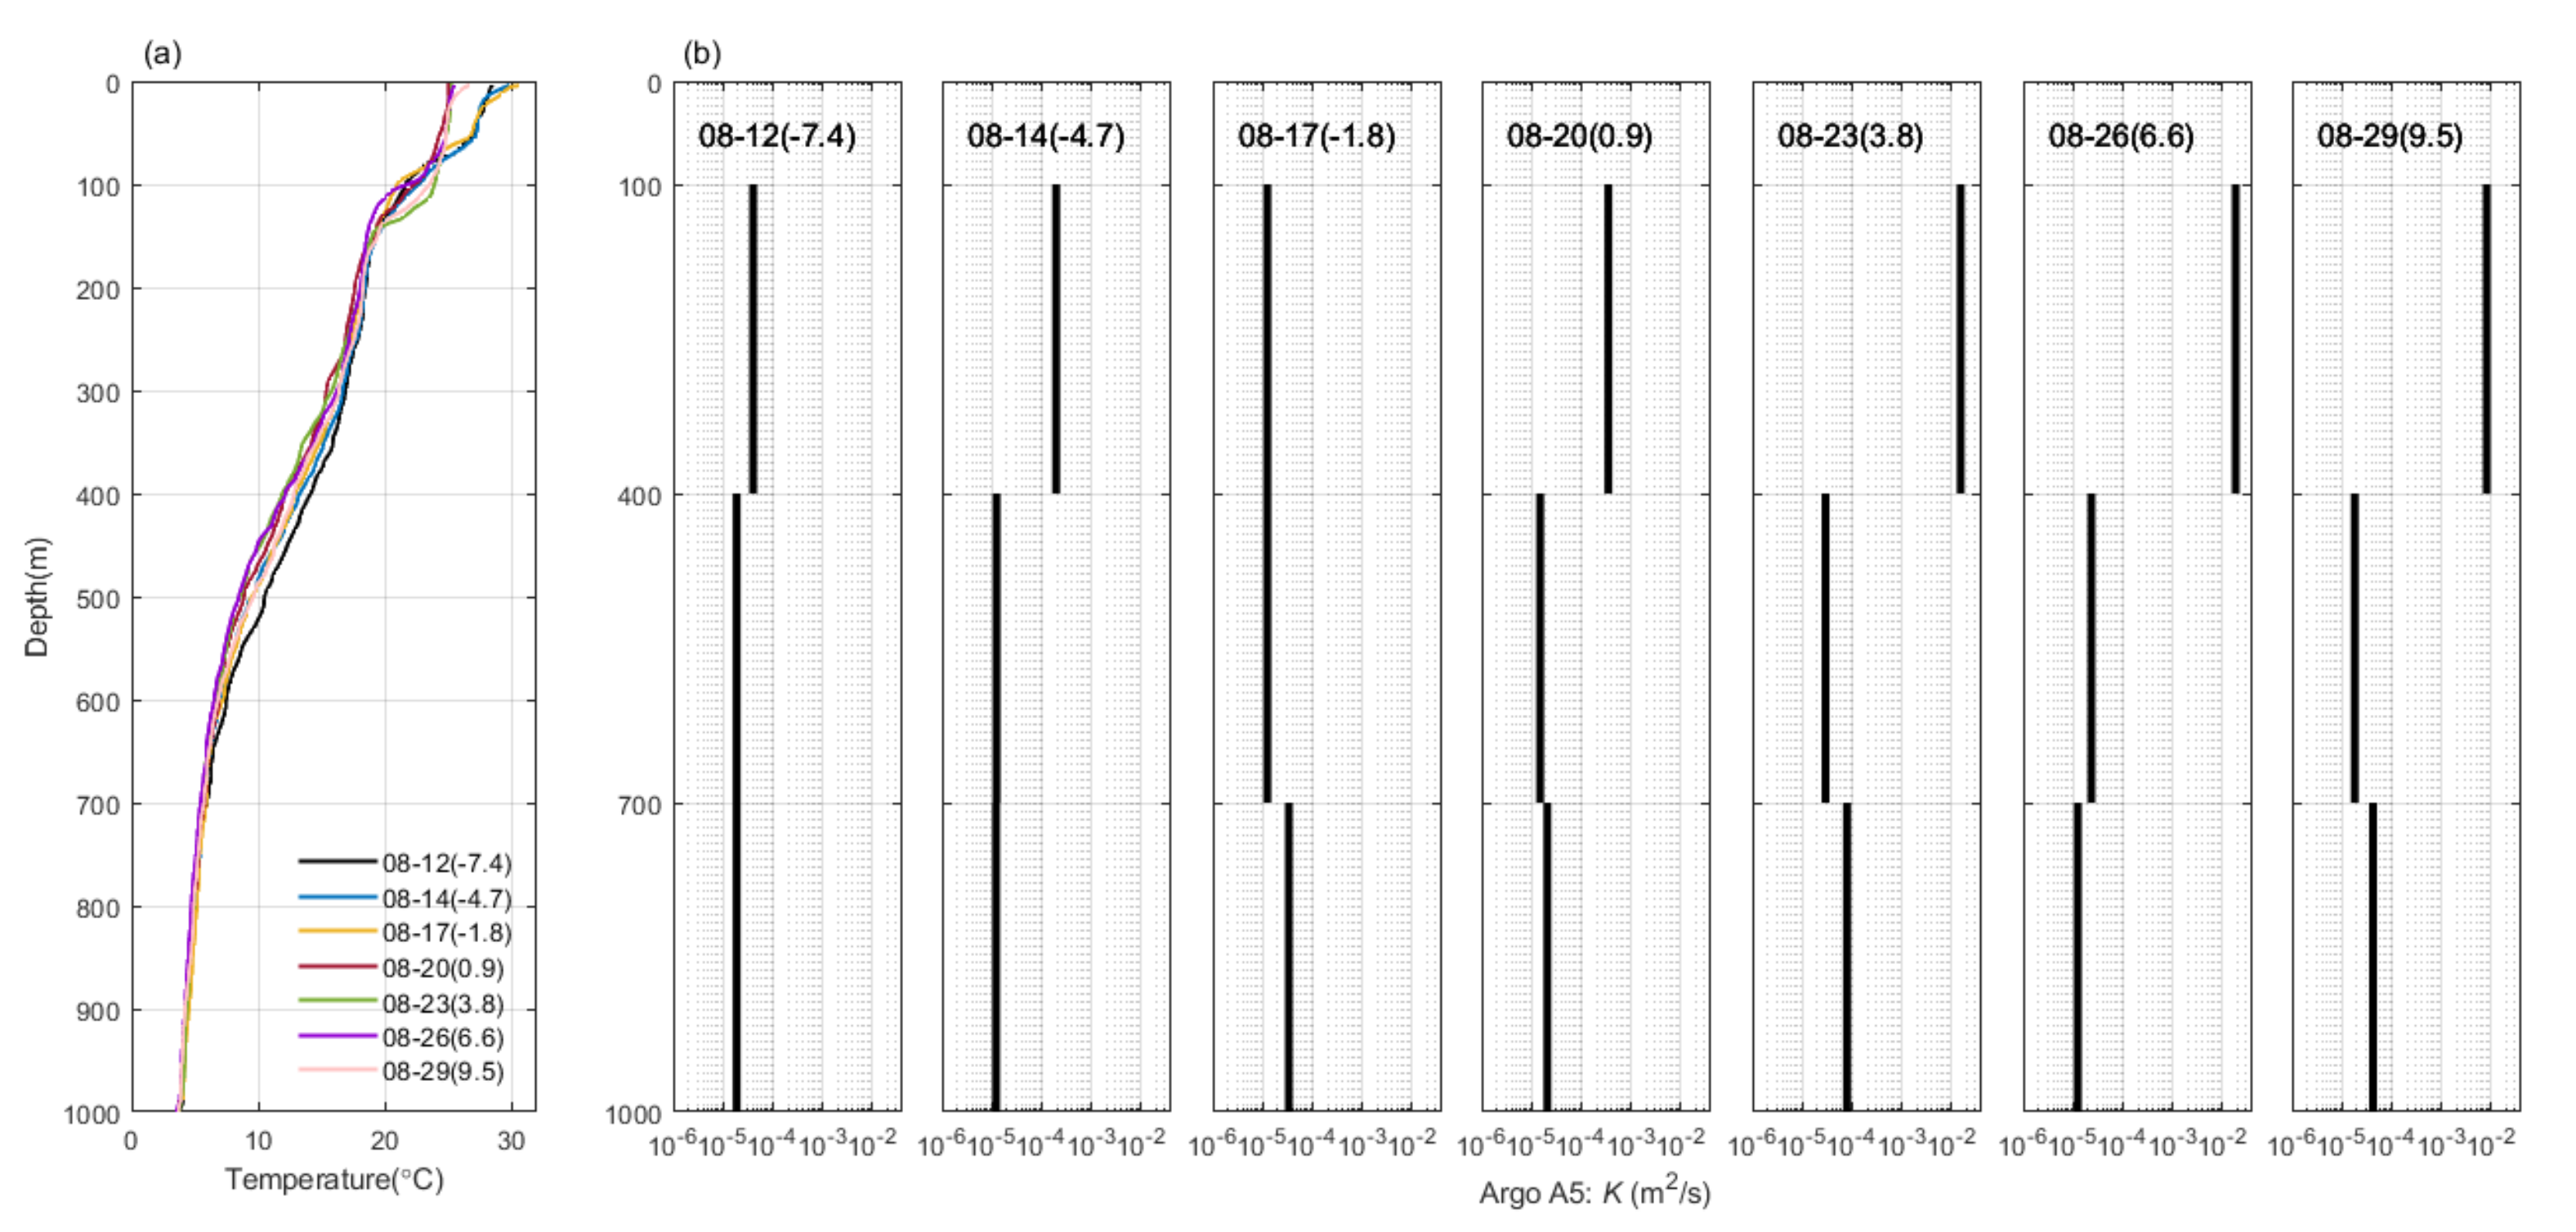
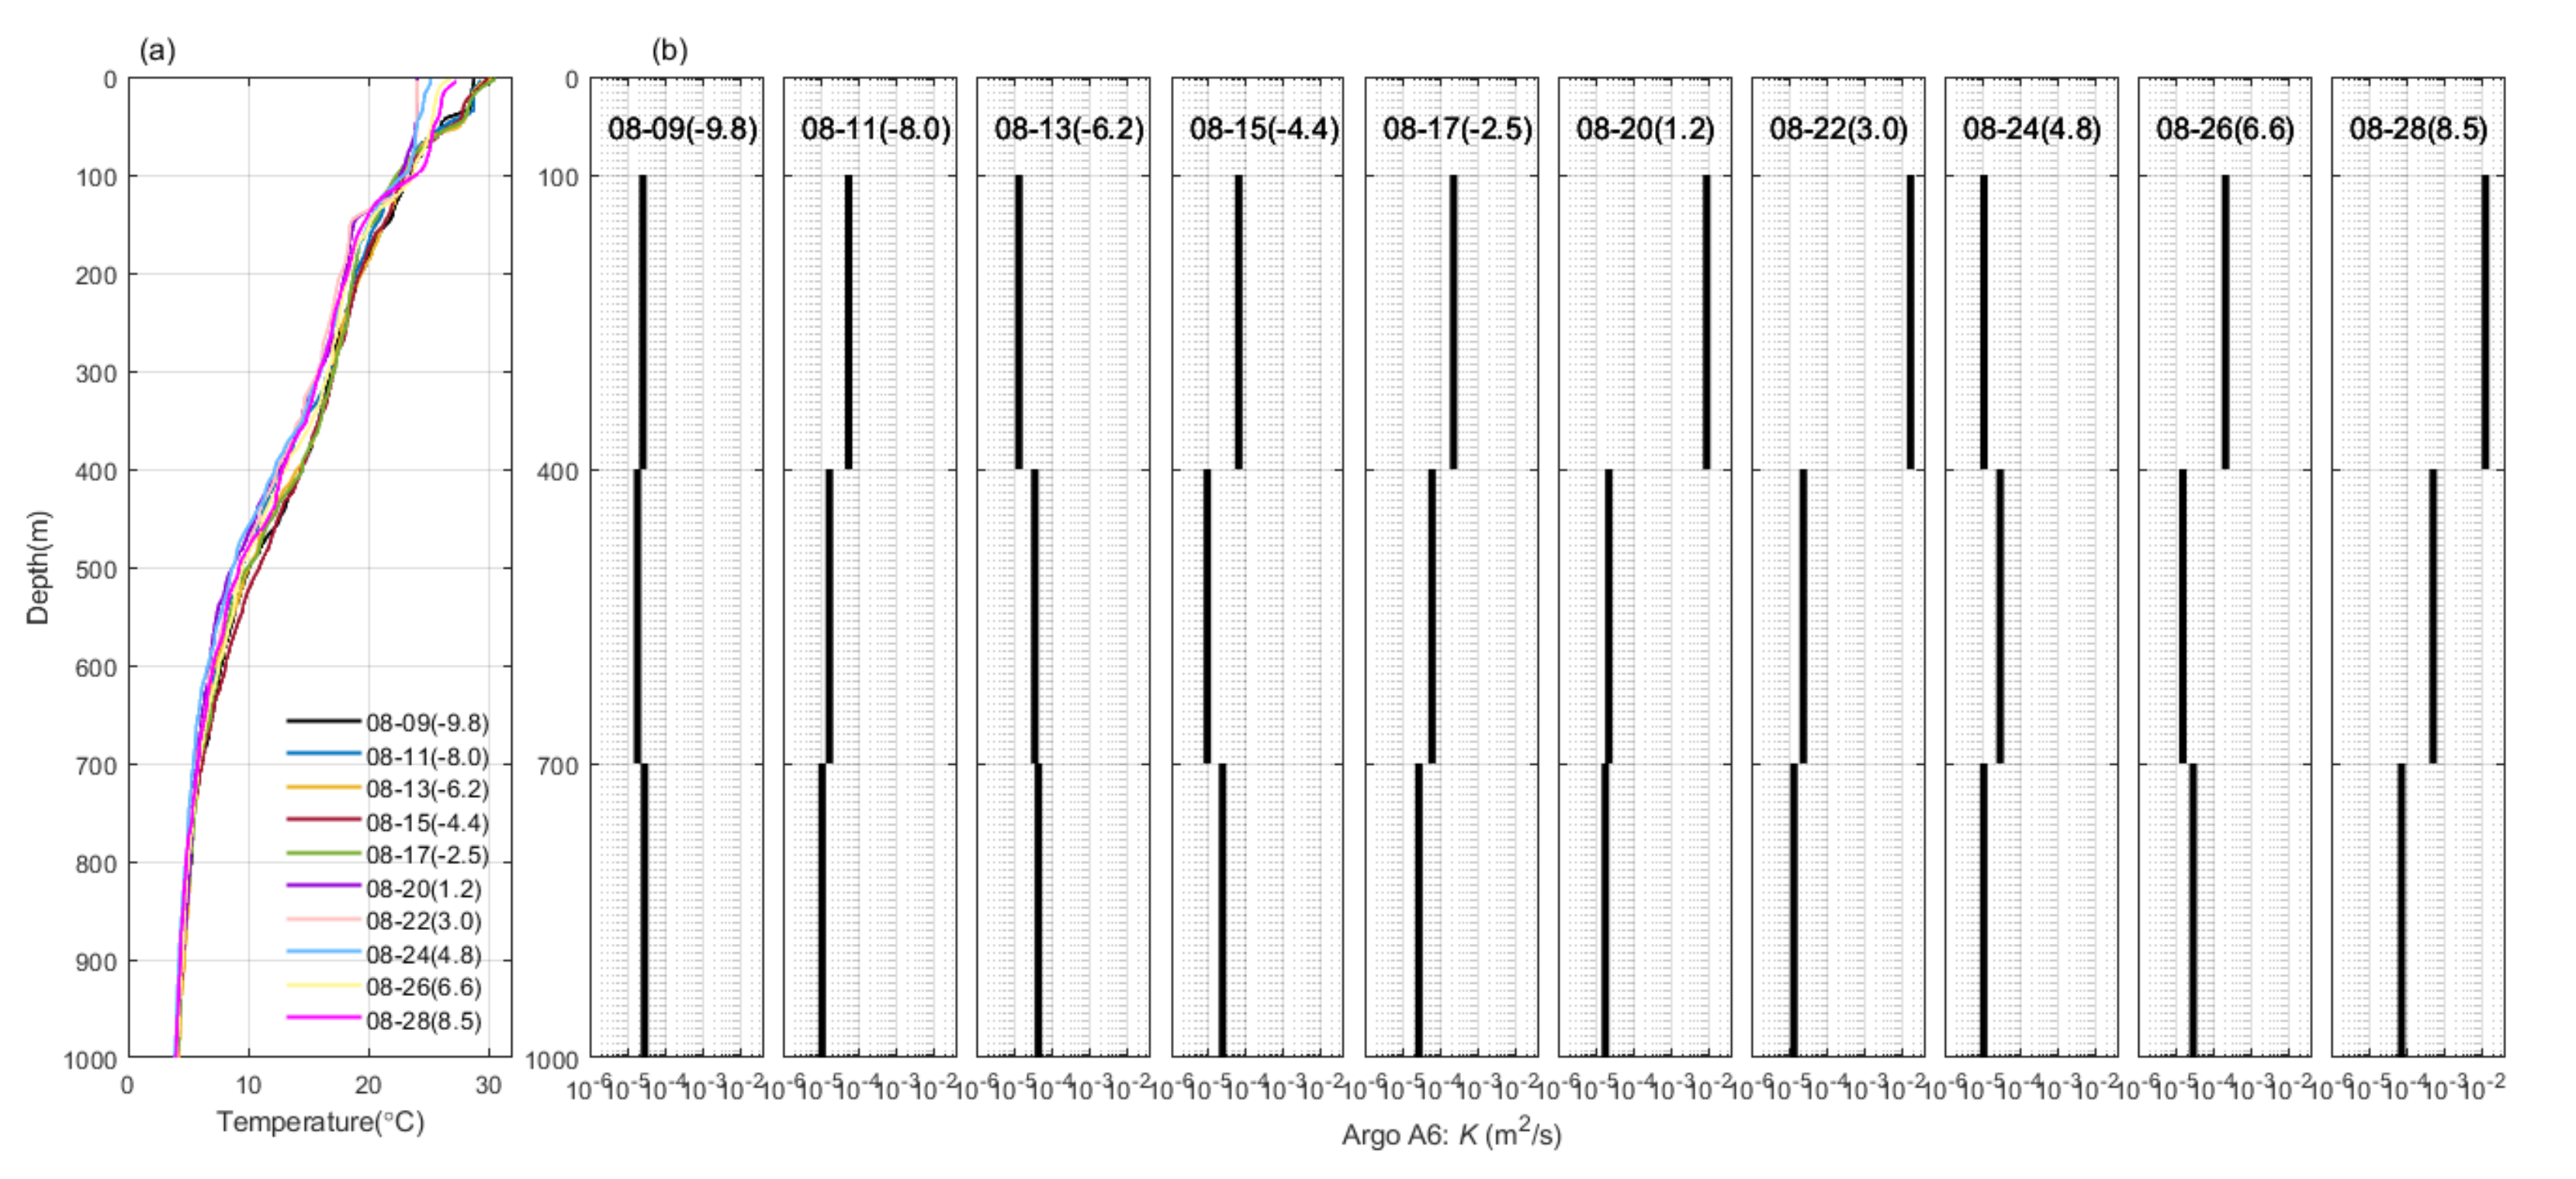
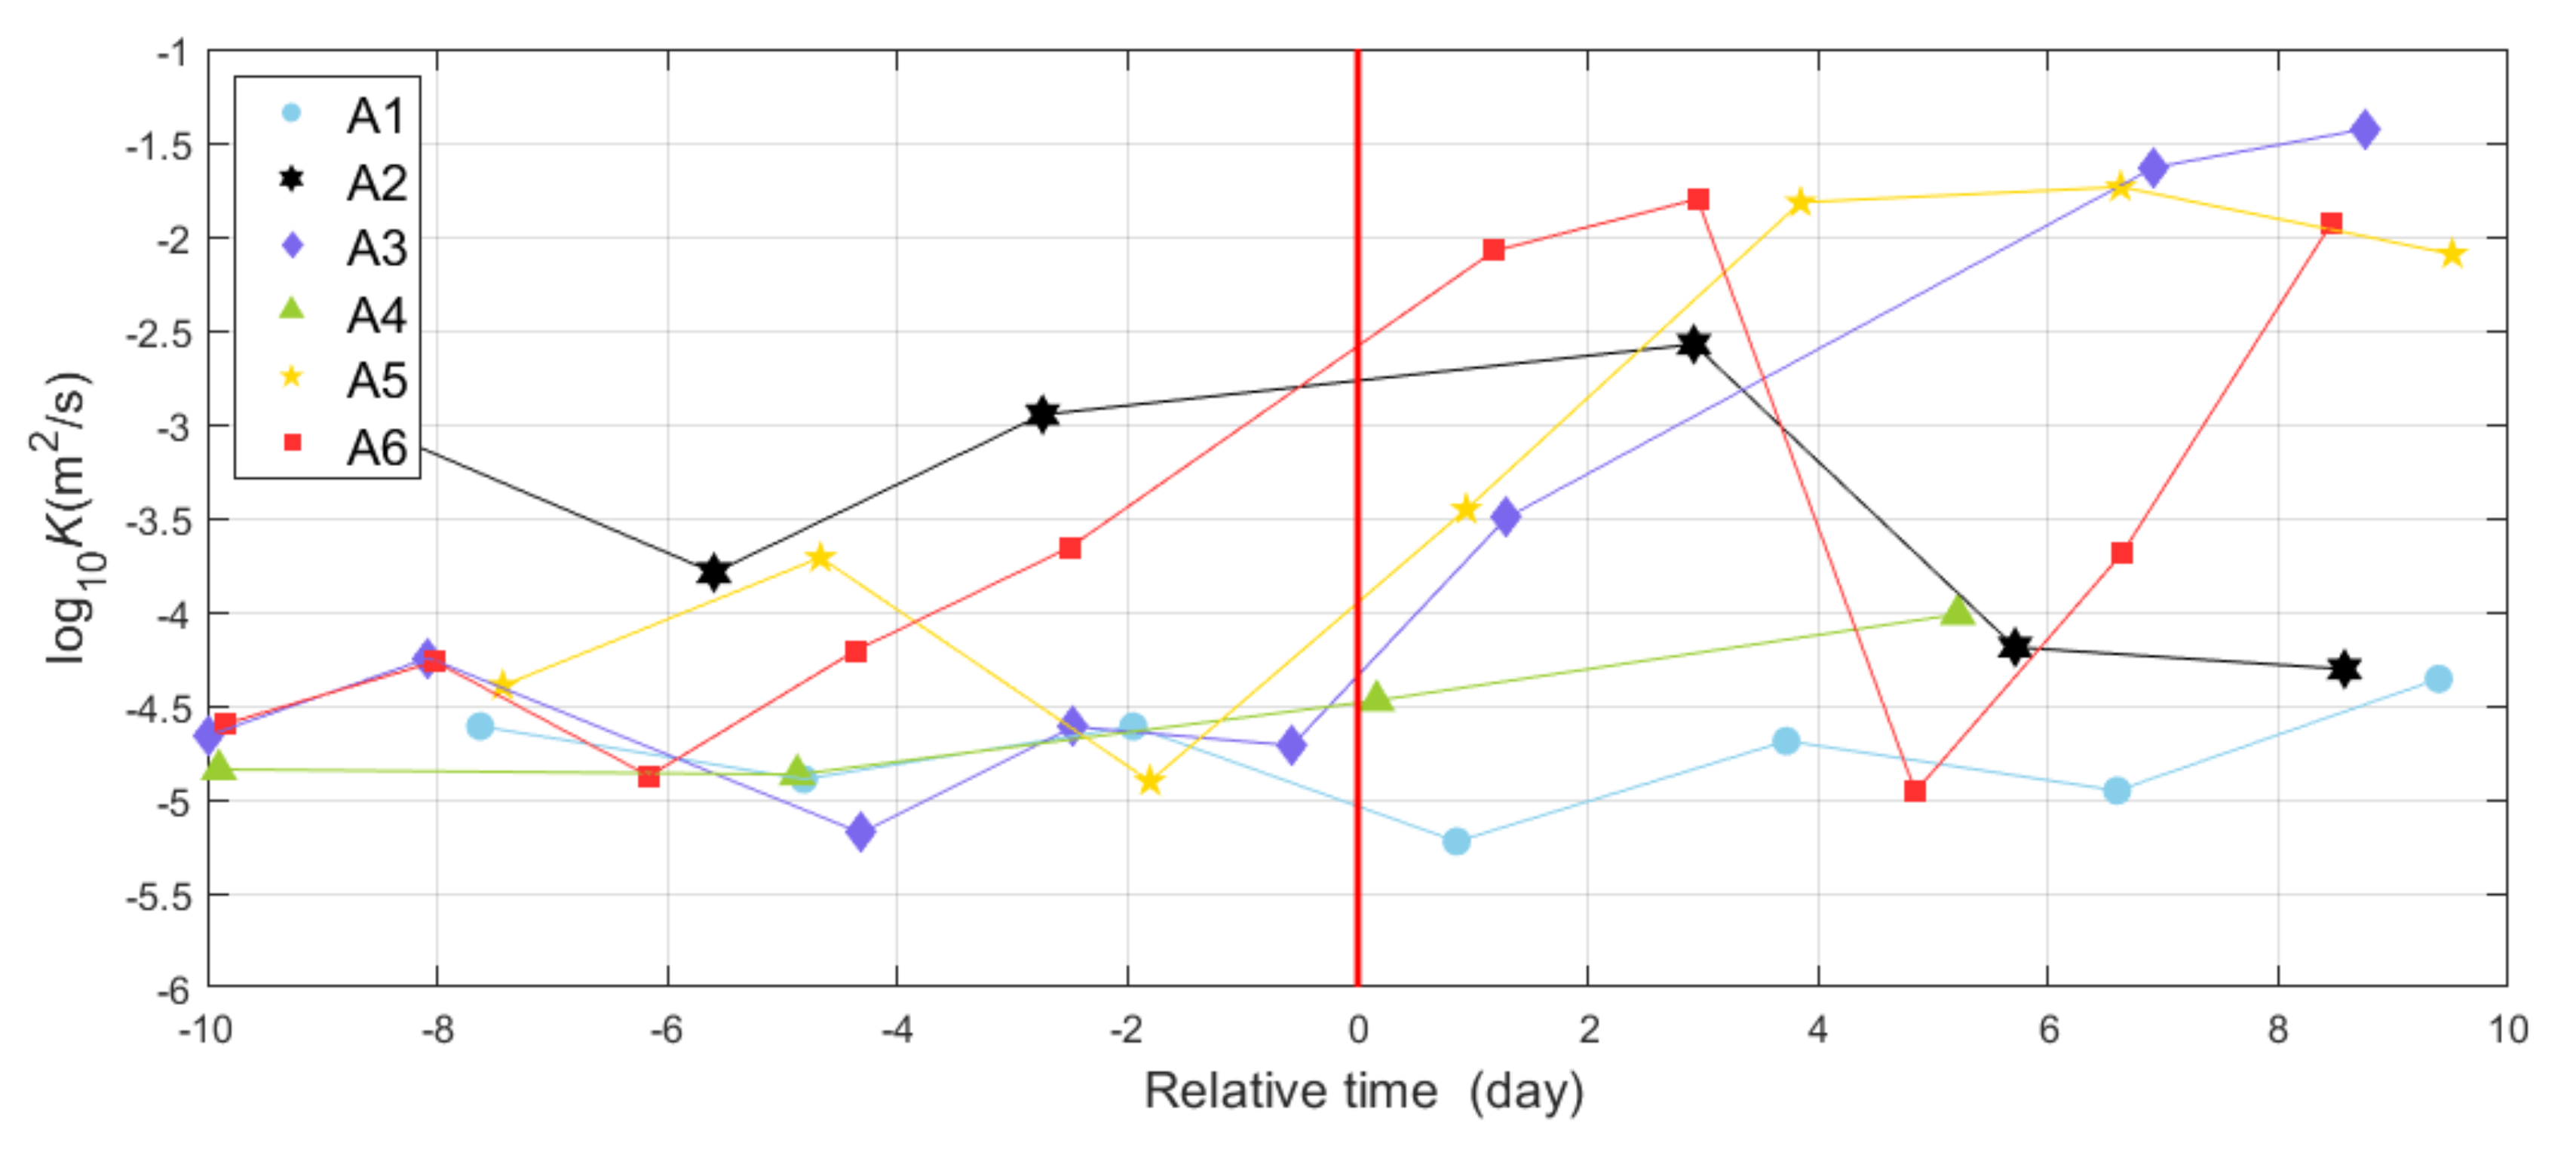
3.2. Goni-Induced Mixing

The diapycnal diffusivity was calculated by GHP parameterization to estimate Goni-induced mixing. As shown in Figure 2a, at 1200 UTC on 17 August, Goni passed over Argo floats A1 and A2. At the same time, it developed into a super typhoon with amaximum wind speed exceeding 51 m/s. Argo float A1 was located to the left of the typhoon track, about 200–300 km away from the typhoon center. Argo float A2 was about 20 km away to the right of the typhoon track. Figure 4a shows the temperature profiles observed by Argo float A1 and Figure 4b displays the corresponding diapycnal diffusivity from 100 m to 1000 m. The values in the brackets represent the observation time relative to the time Goni passed. Hence, negative and positive values correspond to the time before and after the passage of Goni, respectively. As shown, the temperature was nearly unchanged at Argo float A1 during the passage of Goni. This is consistent with SST cooling at Argo float A1, which was very small and close to zero (Figure 3l). At the same time, the diapycnal diffusivity was generally on the level of 10−5 m2/s, the same order of background value of the abyssal ocean [38,45], and did not show significant variations during the passage of Goni (Figure 4b). All these results suggest that Goni did not enhance the turbulent mixing at Argo float A1.
Figure 5 displays the temperature profiles and diapycnal diffusivity at Argo float A2. Compared with Argo float A1, we can find a slight cooling of water temperature and a slight enhancement of diapycnal diffusivity at Argo float A2, especially in the upper 400 m. On 12 August, about 5.6 days before the passage of Goni, the diapycnal diffusivity was O (10−4 m2/s). It increased to O (10−3 m2/s) on 15 August and lasted to 20 August. After 23 August, the diapycnal diffusivity dropped to below 10−4 m2/s.
At 0000 UTC on 19 August, Goni passed over Argo float A3 when it was a severe typhoon with the maximum wind speed exceeding 41 m/s. Argo float A3 was located about 4–50 km away to the right of the typhoon track (Figure 2b). Figure 6a shows the temperature profiles at Argo float A3, from which a continuous temperature cooling lastingfor more than 8 days in the upper 600 m can be detected. The maximum temperature cooling appeared around 150 m in depth, which exceeded 5 °C. Moreover, it is found that Goni caused significantly enhanced turbulent mixing at Argo float A3 (Figure 6b). Before the passage of Goni, the diapycnal diffusivity was generally below 10−4 m2/s. Only one day after the passage of Goni, the diapycnal diffusivity at 100–400 m was increased to 5 × 10⁻⁴ m2/s, which was nearly amplified by one order of magnitude. With time going on, the diapycnal diffusivity at 100–400 m was continuously increased. On 27 August, which was about 9 days after the passage of Goni, the diapycnal diffusivity was as high as 5 × 10⁻² m2/s. In contrast, the diapycnal diffusivity below a 400 m depth did not show significant enhancement and was generally atthe levels of 10−6 and 10−5 m2/s.
As is shown in Figure 2c, at 1500 UTC on 19 August, Goni passed over Argo floats A4, A5 and A6 when it intensified again to a super typhoon with the maximum wind speed exceeding 51 m/s. Argo float A4 was about 30 km away to the left of the typhoon track, whereas Argo floats A5 and A6 were located 55 km and 35 km to the right of the typhoon track, respectively.
Figure 7a shows the temperature profiles at Argo float A4. It is easy to find that Goni caused temperature cooling in the upper 40 m but warming at 40–100 m five hours after its passage. However, the turbulent mixing was not significantly enhanced at the same time (Figure 7b). On 24 August (five days after the passage of Goni), the temperature nearly became the same as that before the passage of Goni.
Figure 8 shows the temperature profiles and diapycnal diffusivity at Argo float A5. It is clearly shown that after the passage of Goni, the temperature near the surface had a significant cooling of approximately 5 °C, which is consistent with the satellite observations shown in Figure 3l. At the same time, the turbulent mixing was remarkably enhanced: Before the typhoon, the diapycnal diffusivity was below 10−4 m2/s; however, the diapycnal diffusivity at 100–400 m was rapidly increased to 3.5 × 10⁻⁴ m2/s about one day after the typhoon (20 August); with time going on, the diapycnal diffusivity was gradually increased; about 4 days after the passage of Goni (23 August), the diapycnal diffusivity at 100–400 m was higher than 10−2 m2/s and this phenomenon lasted to 29 August, approximately 10 days after the passage of Goni. Moreover, it is also found that the enhanced turbulent mixing was concentrated in the upper 400 m, whereas the diapycnal diffusivity below 400 m depth did not have a significant change.
As for Argo float A6, the maximum temperature cooling was greater than 7 °C (Figure 9a), which was even larger than the satellite-observed SST cooling (Figure 3l). The temperature cooling in the upper 80 m almost lasted approximately 9 days after the passage of Goni. However, the turbulent mixing at 100–400 m at Argo float A6 showed an interesting variation (Figure 9b). Before 15 August, the diapycnal diffusivity was generally below 10−4 m2/s. On 17 August (approximately 3 days before the passage of Goni), the diapycnal diffusivity was slightly increased to be a little larger than 10−4 m2/s. In the three days after the passage of Goni, the diapycnal diffusivity was rapidly increased to 1.5 × 10⁻² m2/s. Then, it rapidly decreased to 10−5 m2/s on 24 August. After 26 August, the diapycnal diffusivity was increased again. On 28 August (approximately 9 days after the passage of Goni), the diapycnal diffusivity at 100–400 m became 10−2 m2/s.
To further understand Goni’s influence on the turbulent mixing in the upper ocean, Figure 10 shows the diapycnal diffusivity at 100–400 m as a function of the observation time relative to the time when Goni passed. It is found that the diapycnal diffusivity at Argo float A1 nearly showed no enhancement after the passage of Goni. A similar result is found at Argo float A4, although Argo float A4 was much closer to Goni’s track than A1. All the estimated diapycnal diffusivity at Argo floats A1 and A4 werebelow 10−4 m2/s. We speculate that the cause is related to the locations of Argo floats A1 and A4, both of which were to the left of the typhoon track (Figure 1). In contrast, the diapycnal diffusivity showed enhancement in various degrees at the four Argo floats (A2, A3, A5 and A6) to the right of the typhoon track (Figure 1). At Argo float A2, the diapycnal diffusivity caused by Goni was increased from 10−4 m2/s to 5 × 10⁻³ m2/s; whereas at Argo floats A3, A5 and A6, the diapycnal diffusivity caused by Goni was enhanced by at least three orders of magnitude, from 10−5 m2/s to more than 10−2 m2/s. Moreover, at Argo floats A3 and A5, the diapycnal diffusivity was nearly increased continuously until approximately 9 days after the passage of Goni; while the diapycnal diffusivity at Argo floats A2 and A6 showed a rapid decrease 4 days after the passage of Goni. The diapycnal diffusivity at Argo float A6 was increased again 6 days after the passage of Goni, while it almost kept invariant at Argo float A2.

3.3. Goni-Induced NIKE

To further study Goni’s effect on the turbulent mixing in the upper ocean, Figure 11 illustrates the depth-integrated NIKE from the sea surface to the sea bottom of the HYCOM reanalysis results at 1200 UTC from 16 to 28 August. From 16 to 17 August, before Goni passed, the NIKE was at a low level. On 18 August when Goni’s center reached 136.1° E, 18.2° N, only slight NIKE appeared to the northeast of Goni’s center and the maximum NIKE was approximately 33 kJ/m2. From 19 to 21 August, the NIKE was increased, and at the same time, the range of strong NIKE was gradually expanded (strong NIKE, exceeding 30 kJ/m2, could reach about 330 km to the right of the typhoon track). On 21 August, the NIKE reached the maximum, which was greater than 80 kJ/m2. Thereafter, both the NIKE and the area with strong NIKE were decreased. We also note, however, that the NIKE at 127–131° E and 18–22° N was still significant (≥30 kJ/m2) on 28 August, whereas the NIKE outside the region was quickly damped to below 20 kJ/m2. Moreover, strong NIKE was found to be concentrated to the right of the track typhoon. To the left of the typhoon track, the depth-integrated NIKE was generally below 20 kJ/m2 during the passage of Goni. Combining these results with the estimated diapycnal diffusivity at the 6 Argo floats, we can conclude that the strong (weak) turbulent mixing at Argo floats A2, A3, A5 and A6 (A1 and A4) was related to the strong (weak) NIKE to the right (left) of the typhoon track.
Since Argo floats A3, A5 and A6 were close to the typhoon track which was nearly along 19° N, Figure 12 illustrates the NIKE along 19.12° N from 16 to 28 August. Before 17 August, the NIKE at 0–800 m was generally below 50 J/m3. On 18 August, strong NIKE exceeding 100 J/m3 appeared in the upper 100 m between 132° E and 133° E. As Goni moved westward, the region with strong NIKE gradually expanded westward. From 19 to 23 August, strong NIKE exceeding 300 J/m3 was concentrated in the upper 100 m. With the increase indepth, the NIKE decreased significantly, which is consistent with [33]. At 100–400 m depth, the NIKE was generally on the level of 50 J/m3, whereas below 400 m depth, the NIKE could be one order of magnitude smaller than that at 100–400 m depth. This result can account for the enhanced turbulent mixing at 100–400 m and nearly invariant diapycnal diffusivity below 400 m depth at the Argo floats (Figure 5, Figure 6, Figure 8 and Figure 9). Furthermore, although Goni had left the domain on 24 August, it can be detected from Figure 12 that the strong NIKE at 100–400 m depth could last to 28 August, which can account for the enhanced turbulent mixing at Argo floats A3, A5 and A6 on 27–29 August (Figure 6, Figure 8, Figure 9 and Figure 10).

4. Discussion

Satellite observations indicate that Super Typhoon Goni caused significant SST cooling in the western Pacific, which was mainly concentrated to the right of the typhoon track. This is consistent with the rightward biased feature of the ocean’s response to a typhoon in the northern hemisphere [46]. The SST cooling induced by Goni could reach 660 km away from the typhoon track and the maximum SST cooling was 7.7 °C, which exceeded the SST cooling (1–6 °C) caused by most typhoons [4,8] and that (4.2 °C) caused by another Super Typhoon, Megi, in 2010 [27]. Moreover, it is found that the maximum SST cooling generally occurred about one day after the passage of Goni, and Goni-induced SST cooling could last for more than one week. This result is consistent with [47] that stronger SST cooling corresponds to a longer recovery time.
Previous studies have demonstrated that SST cooling is mainly related to the enhanced turbulent mixing caused by the typhoon [4,8,22,25,27]. In this study, six Argo floats with a high vertical resolution fortunately captured the temperature cooling and turbulent mixing enhancement induced by Goni in the upper ocean. At the four Argo floats (A2, A3, A5 and A6) to the right of the typhoon track, the temperature in the mixed layer was cooled to different degrees, and the diapycnal diffusivity was significantly enhanced. The consistency between the temperature cooling and diapycnal diffusivity enhancement indicates their correlation. It is interesting to find that at Argo floats A3, A5 and A6, the diapycnal diffusivity enhancement could reach three orders of magnitude, from O (10−5 m2/s) to O (10−2 m2/s), which, to the best of our knowledge, has not been reported. This diapycnal diffusivity enhancement, caused by Goni, is much greater than that caused by Super Typhoon Tembin in 2012 [35]. It is also found that the diapycnal diffusivity enhancement at Argo floats A3, A5 and A6 was mainly concentrated in the upper ocean, to be specific, at 100–400 m depth. Meanwhile, the diapycnal diffusivity below 400 m depth was generally atthe level of 10−5 m2/s and did not exhibit significant variations before and after the passage of Goni. Moreover, the enhanced turbulent mixing in the upper ocean at Argo floats A3, A5 and A6 could last 9 days after the passage of Goni (Figure 10). In contrast, at the two Argo floats (A1 and A4) to the left of the typhoon track, either the observed temperature profiles or the estimated diapycnal diffusivity did not show significant variations (Figure 4 and Figure 7) during the passage of Goni. Especially, the diapycnal diffusivity before and after the passage of Goni at Argo floats A1 and A4 was always on the level of 10−5 m2/s, the same order of background value in the abyssal ocean [38,45].
The HYCOM reanalysis results further reveal that the enhanced turbulent mixing in the upper ocean was related to Goni-induced NIKE. Results show that the depth-integrated NIKE to the right of the typhoon could reach 80 kJ/m2, whereas it was very small to the left (generally below 20 kJ/m2). This result can explain the strong turbulent mixing at Argo floats A2, A3, A5 and A6 to the right of the typhoon track, and the weak turbulent mixing at Argo floatsA1 and A4 to the left. Moreover, the profiles of NIKE along 19.12° N indicate that the strongest NIKE exceeding 300 J/m3 was concentrated in the upper 100 m. With the increase indepth, the NIKE was rapidly decreased: At 100–400 m depth, the NIKE was generally atthe level of 50 J/m3, whereas below 400 m depth, the NIKE was nearly one order of magnitude smaller than that at 100–400 m depth. This result is generally consistent with [33] and could account for the enhanced turbulent mixing at 100–400 m and the nearly invariant diapycnal diffusivity below 400 m depth. Moreover, strong NIKE was found to last to 28 August, which is consistent with the duration of enhanced turbulent mixing in the upper ocean at Argo floats A3, A5 and A6. In a word, Goni-induced near-inertial waves caused a significant enhancement of turbulent mixing in the upper ocean, which finally led to severe SST cooling. Because Goni-induced near-inertial waves existed for more than one week after the passage of Goni (Figure 11 and Figure 12), both an enhanced turbulent mixing and SST cooling lasted for more than one week (Figure 3 and Figure 10).

5. Conclusions

Based on the satellite remote sensing, Argo measurements and HYCOM reanalysis results, this study investigates the oceanic dynamical and thermal response to Super Typhoon Goni in 2015 and highlights the enhanced turbulent mixing in the upper ocean caused by Goni. Results indicate that the super typhoon caused significant near-inertial waves in the upper ocean, which further enhanced the turbulent mixing. To the right of the typhoon track, the diapycnal diffusivity enhancement in the upper ocean, caused by Goni, could reach three orders of magnitude, from O (10−5 m2/s) to O (10−2 m2/s) and last at least 9 days after the passage of Goni. In contrast, the diapycnal diffusivity to the left of the typhoon track did not show significant variations. As a result, the maximum SST cooling caused by Goni was 7.7 °C, which is greater than the SST cooling caused by most typhoons, and the SST cooling exhibitedan apparent rightward biased feature. Because Goni-induced near-inertial waves existed for more than one week after the passage of Goni, both enhanced turbulent mixing and SST cooling lasted for more than one week.
This study reveals the significant SST cooling and diapycnal diffusivity enhancement in the upper ocean induced by Super Typhoon Goni; however, there still exists a problem thatis not solved, i.e., what causes the rapid decrease and reinforcement of diapycnal diffusivity at Argo float A6 from 22 to 26 August? This process is worthy to be investigated in the future.

Author Contributions

Conceptualization, A.C.; methodology, M.Q. and Y.P.; formal analysis, M.Q. and Y.P.; writing—original draft preparation, M.Q.; writing—review and editing, M.Q., A.C., J.S., Y.P. and H.H.; supervision, A.C. and J.S.; funding acquisition, A.C. and J.S. All authors have readand agreed to the published version of the manuscript.

Funding

This research was funded by the National Natural Science Foundation of China (Grant numbers: 42176002 and 41830533) and the open fund of the State Key Laboratory of Satellite Ocean Environment Dynamics, Second Institute of Oceanography, Ministry of Natural Resources (Grant number: QNHX2218).

Data Availability Statement

The best track data of Super Typhoon Goni were obtained from the China Meteorological Administration tropical cyclone database (https://tcdata.typhoon.org.cn/, accessed on 20 April 2021). The wind data were downloaded from the high-resolution Climate Forecast System, version 2 (https://rda.ucar.edu/, accessed on 9 May 2021). The Argo float data were obtained from the China Argo Real-time Data Centre (https://www.argo.org.cn/, accessed on 24 April 2021). The SST data were downloaded from the Remote Sensing Systems (http://www.remss.com/, accessed on 9 May 2021). The HYCOM reanalysis results (GLBb0.08-53.X) were obtained from https://www.hycom.org/ (accessed on 21 May 2021).

Conflicts of Interest

The authors declare no conflict of interest.

Appendix A

Figure A1 shows the Goni-induced SST cooling maps from HYCOM reanalysis data and satellite observations. On the whole, the HYCOM-simulated SST cooling is generally consistent with that from the satellite observations: the maximum SST cooling caused by Goniwas approximately −8 °C, which appeared to the right of Goni’s track. In addition, the scatters of HYCOM-simulated and satellite-observed SST cooling are almost distributed along the line y = x (Figure A2), which indicates the consistency between them again. The slight difference between them may be attributed to the different temporal intervals of HYCOM reanalysis results (3 h) and satellite observations (1 day). Based on the aforementioned results, we can conclude that the HYCOM reanalysis data reasonably and reliably reproduces the oceanic thermal response to Super Typhoon Goni.
Figure A1. SST cooling caused by Goni corresponds to the (a) HYCOM reanalysis results and (b) satellite observations, respectively.
Remotesensing 14 02300 g0a1
Figure A2. Comparison between the HYCOM-simulated and satellite-observed SST cooling caused by Goni.
Remotesensing 14 02300 g0a2

References

  1. Emanuel, K.A. Thermodynamic control of hurricane intensity. Nature 1999, 401, 665–669. [Google Scholar] [CrossRef]
  2. Emanuel, K.A. Tropical cyclones. Annu. Rev. Earth Planet. Sci. 2003, 31, 75–104. [Google Scholar] [CrossRef]
  3. Sanford, T.B.; Price, J.F.; Girton, J.B.; Webb, D.C. Highly resolved observations and simulations of the ocean response to a hurricane. Geophys. Res. Lett. 2007, 34. [Google Scholar] [CrossRef] [Green Version]
  4. Price, J.F. Upper Ocean Response to a Hurricane. J. Phys. Oceanogr. 1981, 11, 153–175. [Google Scholar] [CrossRef] [Green Version]
  5. Chang, S.; Anthes, R. Numerical simulations of the ocean’s nonlinear baroclinic response to translating hurricanes. J. Phys. Oceanogr. 1978, 8, 468–480. [Google Scholar] [CrossRef] [Green Version]
  6. Lin, I.I.; Black, P.; Price, J.F.; Yang, C.Y.; Chen, S.S.; Lien, C.C.; Harr, P.; Chi, N.H.; Wu, C.C.; D’Asaro, E.A. An ocean coupling potential intensity index for tropical cyclones. Geophys. Res. Lett. 2013, 40, 1878–1882. [Google Scholar] [CrossRef]
  7. Black, W.J.; Dickey, T.D. Observations and analyses of upper ocean responses to tropical storms and hurricanes in the vicinity of Bermuda. J. Geophys. Res. 2008, 113, C08009. [Google Scholar] [CrossRef] [Green Version]
  8. D’Asaro, E.A.; Sanford, T.B.; Niiler, P.P.; Terrill, E.J. Cold wake of hurricane Frances. Geophys. Res. Lett. 2007, 34, L15609. [Google Scholar] [CrossRef]
  9. Hsu, H.H.; Hung, C.H.; Lo, A.K.; Wu, C.C.; Hung, C.W. Influence of tropical cyclones on the estimation of climate variability in the tropical western North Pacific. J. Clim. 2008, 21, 2960–2975. [Google Scholar] [CrossRef]
  10. Lin, I.I.; Wu, C.; Chiang, J.C.H.; Sui, C.; Lin, I.; Liu, W.T. Satellite observations of modulation of surfacewinds by typhoon-induced upper ocean cooling. Geophys. Res. Lett. 2003, 30, 1131. [Google Scholar] [CrossRef]
  11. Meyers, P.C.; Shay, L.K.; Brewster, J.K.; Jaimes, B. Observed ocean thermal response to Hurricanes Gustav and Ike. J. Geophys. Res. Ocean. 2016, 121, 162–179. [Google Scholar] [CrossRef]
  12. Wu, R.; Li, C. Upper ocean response to the passage of two sequential typhoons. Deep. Sea Res. Part I Oceanogr. Res. Pap. 2018, 132, 68–79. [Google Scholar] [CrossRef]
  13. Yue, X.X.; Zhang, B.; Liu, G.Q.; Li, X.F.; Zhang, H.; He, Y.J. Upper Ocean Response to Typhoon Kalmaegi and Sarikain the South China Sea from Multiple-Satellite Observations and Numerical Simulations. Remote Sens. 2018, 10, 348. [Google Scholar] [CrossRef] [Green Version]
  14. Zhang, H.; Chen, D.; Zhou, L.; Liu, X.; Ding, T.; Zhou, B. Upper ocean response to Typhoon Kalmaegi (2014). J. Geophys. Res. Ocean. 2016, 121, 6520–6535. [Google Scholar] [CrossRef]
  15. Emanuel, K.; Desautels, C.; Holloway, C.; Korty, R. Environmental Control of Tropical Cyclone Intensity. J. Atmos. Sci. 2004, 61, 843–858. [Google Scholar] [CrossRef]
  16. Zhu, T.; Zhang, D.L. The impact of the storm-induced SST cooling on hurricane intensity. Adv. Atmos. Sci. 2006, 23, 14–22. [Google Scholar] [CrossRef] [Green Version]
  17. Samson, G.; Giordani, H.; Caniaux, G.; Roux, F. Numerical investigation of an oceanic resonant regime induced by hurricane winds. Ocean Dyn. 2009, 59, 565–586. [Google Scholar] [CrossRef]
  18. Wang, G.; Wu, L.; Johnson, N.C.; Ling, Z. Observed three-dimensional structure of ocean cooling induced by Pacific tropical cyclones. Geophys. Res. Lett. 2016, 43, 7632–7638. [Google Scholar] [CrossRef]
  19. Lin, S.; Zhang, W.Z.; Shang, S.P.; Hong, H.S. Ocean response to typhoons in the western north pacific: Composite results from argo data. Deep. Sea Res. Part I Oceanogr. Res. Pap. 2017, 123, 62–74. [Google Scholar] [CrossRef]
  20. Zhang, H.; He, H.; Zhang, W.Z.; Tian, D. Upper ocean response to tropical cyclones: A review. Geosci. Lett. 2021, 8, 1. [Google Scholar] [CrossRef]
  21. Cheng, L.; Zhu, J.; Sriver, R.L. Global representation of tropical cyclone-induced short-term ocean thermal changes using Argo data. Ocean Sci. 2015, 11, 2831–2878. [Google Scholar] [CrossRef] [Green Version]
  22. Huang, P.; Lin, I.I.; Chou, C.; Huang, R.H. Change in ocean subsurface environment to suppress tropical cyclone intensification under global warming. Nat. Commun. 2015, 6, 7188. [Google Scholar] [CrossRef] [PubMed] [Green Version]
  23. Jaimes, B.; Shay, L.K.; Uhlhorn, E.W. Enthalpy and momentum fluxes during Hurricane Earl relative to underlying ocean features. Mon. Weather Rev. 2015, 143, 111–131. [Google Scholar] [CrossRef]
  24. Schade, L.R.; Emanuel, K.A. The ocean’s effect on the intensity of tropical cyclones: Results from a simple coupled atmosphere-ocean model. J. Atmos. Sci. 1997, 56, 642–651. [Google Scholar] [CrossRef] [Green Version]
  25. Jacob, S.D.; Shay, L.K.; Mariano, A.J.; Black, P.G. The 3D oceanic mixed layer response to hurricane Gilbert. J. Phys. Oceanogr. 2000, 30, 1407–1429. [Google Scholar] [CrossRef]
  26. Huang, P.; Sanford, T.B.; Imberger, J. Heat and Turbulent Kinetic Energy Budgets for Surface Layer Cooling Induced by the Passage of Hurricane Frances (2004). J. Geophys. Res. Ocean. 2009, 114. [Google Scholar] [CrossRef]
  27. Guan, S.D.; Zhao, W.; Huthnance, J.; Tian, J.W.; Wang, J.H. Observed upper ocean response to typhoon Megi (2010) in the Northern South China Sea. J. Geophys. Res. Ocean. 2014, 119, 3134–3157. [Google Scholar] [CrossRef] [Green Version]
  28. Sriver, R.L.; Huber, M. Observational evidence for an ocean heat pump induced by tropical cyclones. Nature 2007, 447, 577–580. [Google Scholar] [CrossRef]
  29. Jaimes, B.; Shay, L.K. Mixed layer cooling in mesoscale oceanic eddies during hurricanes Katrina and Rita. Mon. Weather Rev. 2009, 137, 4188–4207. [Google Scholar] [CrossRef] [Green Version]
  30. Balaguru, K.; Chang, P.; Saravanan, R.; Leung, L.R.; Xu, Z.; Li, M.; Hsieh, J.S. Ocean barrier layers’ effect on tropical cyclone intensification. Proc. Natl. Acad. Sci. USA 2012, 109, 14343–14347. [Google Scholar] [CrossRef] [Green Version]
  31. Sun, J.; Oey, L.Y.; Chang, R.; Xu, F.; Huang, S.M. Ocean response to typhoonNuri (2008) in western Pacific and South China Sea. Ocean Dyn. 2015, 65, 735–749. [Google Scholar] [CrossRef]
  32. Guan, S.D.; Zhao, W.; Sun, L.; Zhou, C.; Liu, Z.; Hong, X.; Zhang, Y.H.; Tian, J.W.; Hou, Y.J. Tropical cyclone-induced sea surface cooling over the yellow sea and bohai sea in the 2019 pacific typhoon season. J. Mar. Syst. 2021, 217, 103509. [Google Scholar] [CrossRef]
  33. Cao, A.Z.; Guo, Z.; Pan, Y.H.; Song, J.B.; He, H.L.; Li, P.L. Near-Inertial Waves Induced by Typhoon Megi(2010) in the South China Sea. J. Mar. Sci. Eng. 2021, 9, 440. [Google Scholar] [CrossRef]
  34. Yang, B.; Hu, P.; Hou, Y.J. Observed Near-Inertial Waves in the Northern South China Sea. Remote Sens. 2021, 13, 3223. [Google Scholar] [CrossRef]
  35. Guan, S.D.; Liu, Z.; Song, J.B.; Hou, Y.J.; Feng, L.Q. Upper ocean response to Super Typhoon Tembin (2012) explored using multiplatform satellites and Argo float observations. Int. J. Remote Sens. 2017, 38, 5150–5167. [Google Scholar] [CrossRef]
  36. Ying, M.; Zhang, W.; Yu, H.; Lu, X.Q.; Feng, J.X.; Fan, Y.X.; Zhu, Y.T.; Chen, D.Q. An Overview of the China Meteorological Administration Tropical Cyclone Database. J. Atmos. Ocean. Technol. 2014, 31, 287–301. [Google Scholar] [CrossRef] [Green Version]
  37. Lu, X.Q.; Yu, H.; Ying, M.; Zhao, B.K.; Zhang, S.; Lin, L.M.; Bai, L.N.; Wan, R.J. Western North Pacific tropical cyclone database created by the China Meteorological Administration. Adv. Atmos. Sci. 2021, 38, 690–699. [Google Scholar] [CrossRef]
  38. Kunze, E.; Firing, E.; Hummon, J.M.; Chereskin, T.K.; Thurnherr, A.M. Global abyssal mixing inferred from lowered ADCP shear and CTD strain profiles. J. Phys. Oceanogr. 2006, 36, 1553–1576. [Google Scholar] [CrossRef] [Green Version]
  39. Garrett, C.; Munk, W. Space-time scales of internal waves: A progress report. J. Geophys. Res. 1975, 80, 291–297. [Google Scholar] [CrossRef]
  40. Jing, Z.; Wu, L.X.; Li, L.; Liu, C.Y.; Liang, X.; Chen, Z.H.; Hu, D.X.; Liu, Q.Y. Turbulent diapycnal mixing in the subtropical northwestern Pacific: Spatial-seasonal variations and role of eddies. J. Geophys. Res. 2011, 116, C10028. [Google Scholar] [CrossRef]
  41. Whalen, C.B.; MacKinnon, J.A.; Talley, L.D. Large-scale impacts of the mesoscale environment on mixing from wind-driven internal waves. Nat. Geosci. 2018, 11, 842–847. [Google Scholar] [CrossRef]
  42. Jing, Z.; Wu, L.X. Seasonal variation of turbulent diapycnal mixing in the northwestern Pacific stirred by wind stress. Geophys. Res. Lett. 2010, 37, L23604. [Google Scholar] [CrossRef]
  43. Wu, L.; Jing, Z.; Riser, S.; Visbeck, M. Seasonal and spatial variations of Southern Ocean diapycnal mixing from Argo profiling floats. Nat. Geosci. 2011, 4, 363–366. [Google Scholar] [CrossRef]
  44. Gregg, M.C.; Kunze, E. Shear and strain in Santa Monica Basin. J. Geophys. Res. 1991, 96, 16709–16719. [Google Scholar] [CrossRef]
  45. Munk, W.; Wunsch, C. Abyssal Recipes II: Energetics of Tidal and Wind Mixing. Deep. Sea Res. Part IOceanogr. Res. Pap. 1998, 45, 1977–2010. [Google Scholar] [CrossRef]
  46. Price, J.F.; Sanford, T.B.; Forristall, G.Z. Forced stage response to a moving hurricane. J. Phys. Oceanogr. 1994, 24, 233–260. [Google Scholar] [CrossRef]
  47. Ling, Z.; Chen, Z.; Wang, G.; He, H.; Chen, C. Recovery ofTropical Cyclone Induced SSTCooling Observed by Satellite in theNorthwestern Pacific Ocean. Remote Sens. 2021, 13, 3781. [Google Scholar] [CrossRef]
Figure 1. Bathymetry (shading, unit: m) of the study area, track and intensity of Goni in August 2015 (colored lines) and positions of Argo profiles (rose triangle, A1–A6). The time at 0000 UTC from 17 to 23 August is labeled. In the legend, TY, STY and SuperTY are abbreviations fortyphoon, severe typhoon and super typhoon, respectively.
Remotesensing 14 02300 g001
Figure 2. The wind speed and direction at (a) 1200 UTC on 17 August, (b) 0000 UTC on 19 August and (c) 1500 UTC on 19 August, respectively. (d) The translation speed of Goni from 16 to 22 August.The six Argo floats (A1–A6) are labeled.
Remotesensing 14 02300 g002
Figure 3. (ak) SST evolution during the passage of Goni from 16 to 28 August. The gray quivers denote the CFSv2 winds at 0000 UTC. (l) The maximum SST cooling caused by Goni.
Remotesensing 14 02300 g003
Figure 4. (a) Temperature profiles observed by Argo float A1 and (b) estimated diapycnal diffusivity based on the GHP parameterization. In each subfigure, the values in the brackets represent the observation time relative to the time Goni passed (unit: day).
Remotesensing 14 02300 g004
Figure 5. Same as Figure 4 but for Argo float A2.
Remotesensing 14 02300 g005
Figure 6. Same as Figure 4 but for Argo float A3.
Remotesensing 14 02300 g006
Figure 7. Same as Figure 4 but for Argo float A4.
Remotesensing 14 02300 g007
Figure 8. Same as Figure 4 but for Argo float A5.
Remotesensing 14 02300 g008
Figure 9. Same as Figure 4 but for Argo float A6.
Remotesensing 14 02300 g009
Figure 10. Diapycnal diffusivityversus the observation time relative to the time Goni passed.
Remotesensing 14 02300 g010
Figure 11. Depth-integrated NIKE (shading, unit: kJ/m2) during the passage of Goni (al) from 16 to 28 August.
Remotesensing 14 02300 g011
Figure 12. Profiles of NIKE (shading, unit: J/m3) along 19.12° N (al) from 16 to 28 August.
Remotesensing 14 02300 g012
Table 1. Information onArgo floats and profiles.
Argo FloatWMO
Number
Number of ProfilesDistance to Goni’s Center (km)Time of Typhoon Passed (mm/dd)Observation Time of Profiles (mm/dd)
A129011997227–29508/1708/09, 08/12, 08/15, 08/18, 08/21, 08/24, 08/26
A22901543621–2708/1708/09, 08/12, 08/15, 08/20, 08/23, 08/26
A3290157984–5308/1908/08, 08/10, 08/14, 08/16, 08/18, 08/20, 08/25, 08/27
A45904317418–3508/1908/09, 08/14, 08/19, 08/24
A52901494742–7808/1908/12, 08/14, 08/17, 08/20, 08/23, 08/26, 08/29
A629015781030–4708/1908/09, 08/11, 08/13, 08/15, 08/17, 08/20, 08/22, 08/24, 08/26, 08/28
Publisher’s Note: MDPI stays neutral with regard to jurisdictional claims in published maps and institutional affiliations.

