Article

A Multi-Perspective Assessment Method with a Dynamic Benchmark for Human Activity Impacts on Alpine Ecosystem under Climate Change

College of Earth and Environmental Sciences, Lanzhou University, Lanzhou 730000, China
*
Author to whom correspondence should be addressed.
Remote Sens. 2022, 14(1), 208; https://doi.org/10.3390/rs14010208
Submission received: 2 December 2021 / Revised: 22 December 2021 / Accepted: 30 December 2021 / Published: 3 January 2022

Abstract

:
Intense human activities and rapid climate changes both have obvious impacts on alpine ecosystems. However, the magnitudes and directions of the impacts by these two drivers remain uncertain due to a lack of a reasonable assessment method to distinguish between them. The impact of natural resilience is also generally included in the dynamics of a disturbed ecosystem and is liable to be mixed into the impact of human activity. It is urgent that we quantitatively discriminate human activity impacts on the ecosystem under climate change, especially for fast-developing alpine regions. Here, we propose an assessment method to determine human activity impacts under a dynamic climate, taking the potential net primary production (NPP) of an ecosystem as a benchmark. The potential NPP (NPPP) series under the changing climate was retrieved by an improved integrated biosphere simulator based on the initial disturbed ecosystem status of the assessment period. The actual NPP (NPPA) series monitored by remote sensing was considered as the results derived from the joint impacts of climate change, natural resilience and human activity. Then, the impact of human activity was quantified as the difference between the NPPP and NPPA. The contributions of human activity and natural forces to ecosystem NPP dynamics were then calculated separately and employed to explore the dominant driver(s). This assessment method was demonstrated in a typical alpine ecosystem in Northwest China. The results indicate that this method capably revealed the positive impacts of local afforestation and land-use optimization and the negative impacts caused by grazing during the assessment period of 2001–2017. This assessment method provides a quantitative reference for assessing the performances of ecological protections or human damage to alpine ecosystems at the regional scale.

Graphical Abstract

1. Introduction

Intense human activity and rapid climate change have significantly affected natural terrestrial ecosystems [1,2,3,4], especially alpine ecosystems, which are widely distributed in high-altitude mountainous areas [5,6,7]. The vegetation composition of the ecosystem mainly involves alpine meadows, forests and grasslands. Vegetation expansion to higher altitudes in alpine areas has been recognized [8,9], with such changes in vegetation pattern and ecosystem services directly impacting socio-economic development downstream of alpine areas [10,11,12]. Concurrent greening in recent decades is evident from remotely sensed data [13,14,15], including within arid and semi-arid areas [12,16,17], though debate remains regarding the sustainability of afforestation with respect to water resource limits [18,19,20,21]. Land degradation and ecological destruction, such as deforestation and overgrazing, have also been detected in alpine areas [22,23,24].
The magnitude, direction and mechanisms of the impact of human activities on alpine ecosystems have been controversial and uncertain [12,15,25,26]. The monitoring of ecosystem dynamics records the impacts from both intense human activities and rapid climate change characterized by warming [7,15,23,24]. Hence, ecosystem dynamics cannot be attributed to human activity or climate change alone. The impacts of these two driving forces need to be clearly differentiated and quantified, so that the mechanisms of ecosystem dynamics can be properly constrained.
Assessments of ecological protection and damage that could support optimizing management of ecosystem in the future have become the focal issue for ecosystem maintenance and policy makers [27,28,29]. Moreover, the Community with Shared Future for Mankind policy and global sustainable development have been promoted continuously [30]. At present, it is a challenging but urgent matter to quantitatively assess the ecological impacts of human activity within a dynamic climate.
A number of studies have assessed the impact of human activity on the alpine ecosystems by remote sensing monitoring on ecosystem amelioration or deterioration [31,32,33]. These changes detected by image series are joint results of climate change, natural restorations and human activity [29,32,34], and thus these methods cannot exclude the impacts of climate change and natural resilience from the final assessment results [22,32,35].
Evans and Geerken [36] proposed a measurement of the impact of human activity through calculating the difference between potential changes and actual changes in vegetation. Recent studies have retrieved the potential changes of vegetation by regressing the relationship between ecological indicators and climatic factors so as to build a benchmark for the assessment of human impacts [29,32,37]. However, these retrievals might have partly mixed the impacts of human activity and climate change when they contributed to ecosystem dynamics in a similar fashion, which led to the uncertainty and unreliability of the assessment benchmark [22,32,33]. The potential status of the climax community was also used to build a benchmark under climate change [38] in the short term. Thus, the measurements based on such benchmarks are limited in practical application significance [28,33,39] and theoretically include both the human impacts during the assessment period and the historically accumulative ones. Besides, the impacts of natural resilience are also included in these assessment results [35].
Process-based simulations could provide a reliable dynamic benchmark for the assessment of the impact of human activities, with consideration of the initial condition of ecosystem and ecological processes [40,41,42]. The effects of natural resilience could be well presented by these process-based simulations [43,44]. The potential vegetation changes simulated with an actual initial condition are effective to exfoliate the impacts of both historical human activity and natural resilience [35,45,46].
In this study, we propose a multi-perspective method for the assessment of the impacts of human activity on the alpine ecosystem under the current dynamic climate, using net primary productivity (NPP) as an indicator. The potential changes of an ecosystem’s NPP under climate change conditions were adopted as the assessment benchmark, which was simulated by a process-based model IBISi [42] with a start-up of the initial ecosystem which had been already disturbed by human activity before the assessment period. The impact of human activities on NPP during the assessment period was then measured as the difference between the actual NPP monitored by remote sensing and the potential NPP. The dominant drivers of ecosystem changes were explored by their contribution rates. This assessment method was demonstrated on a typical alpine ecosystem in the upper Yellow River Catchment in Northwest China.

2. Materials and Methods

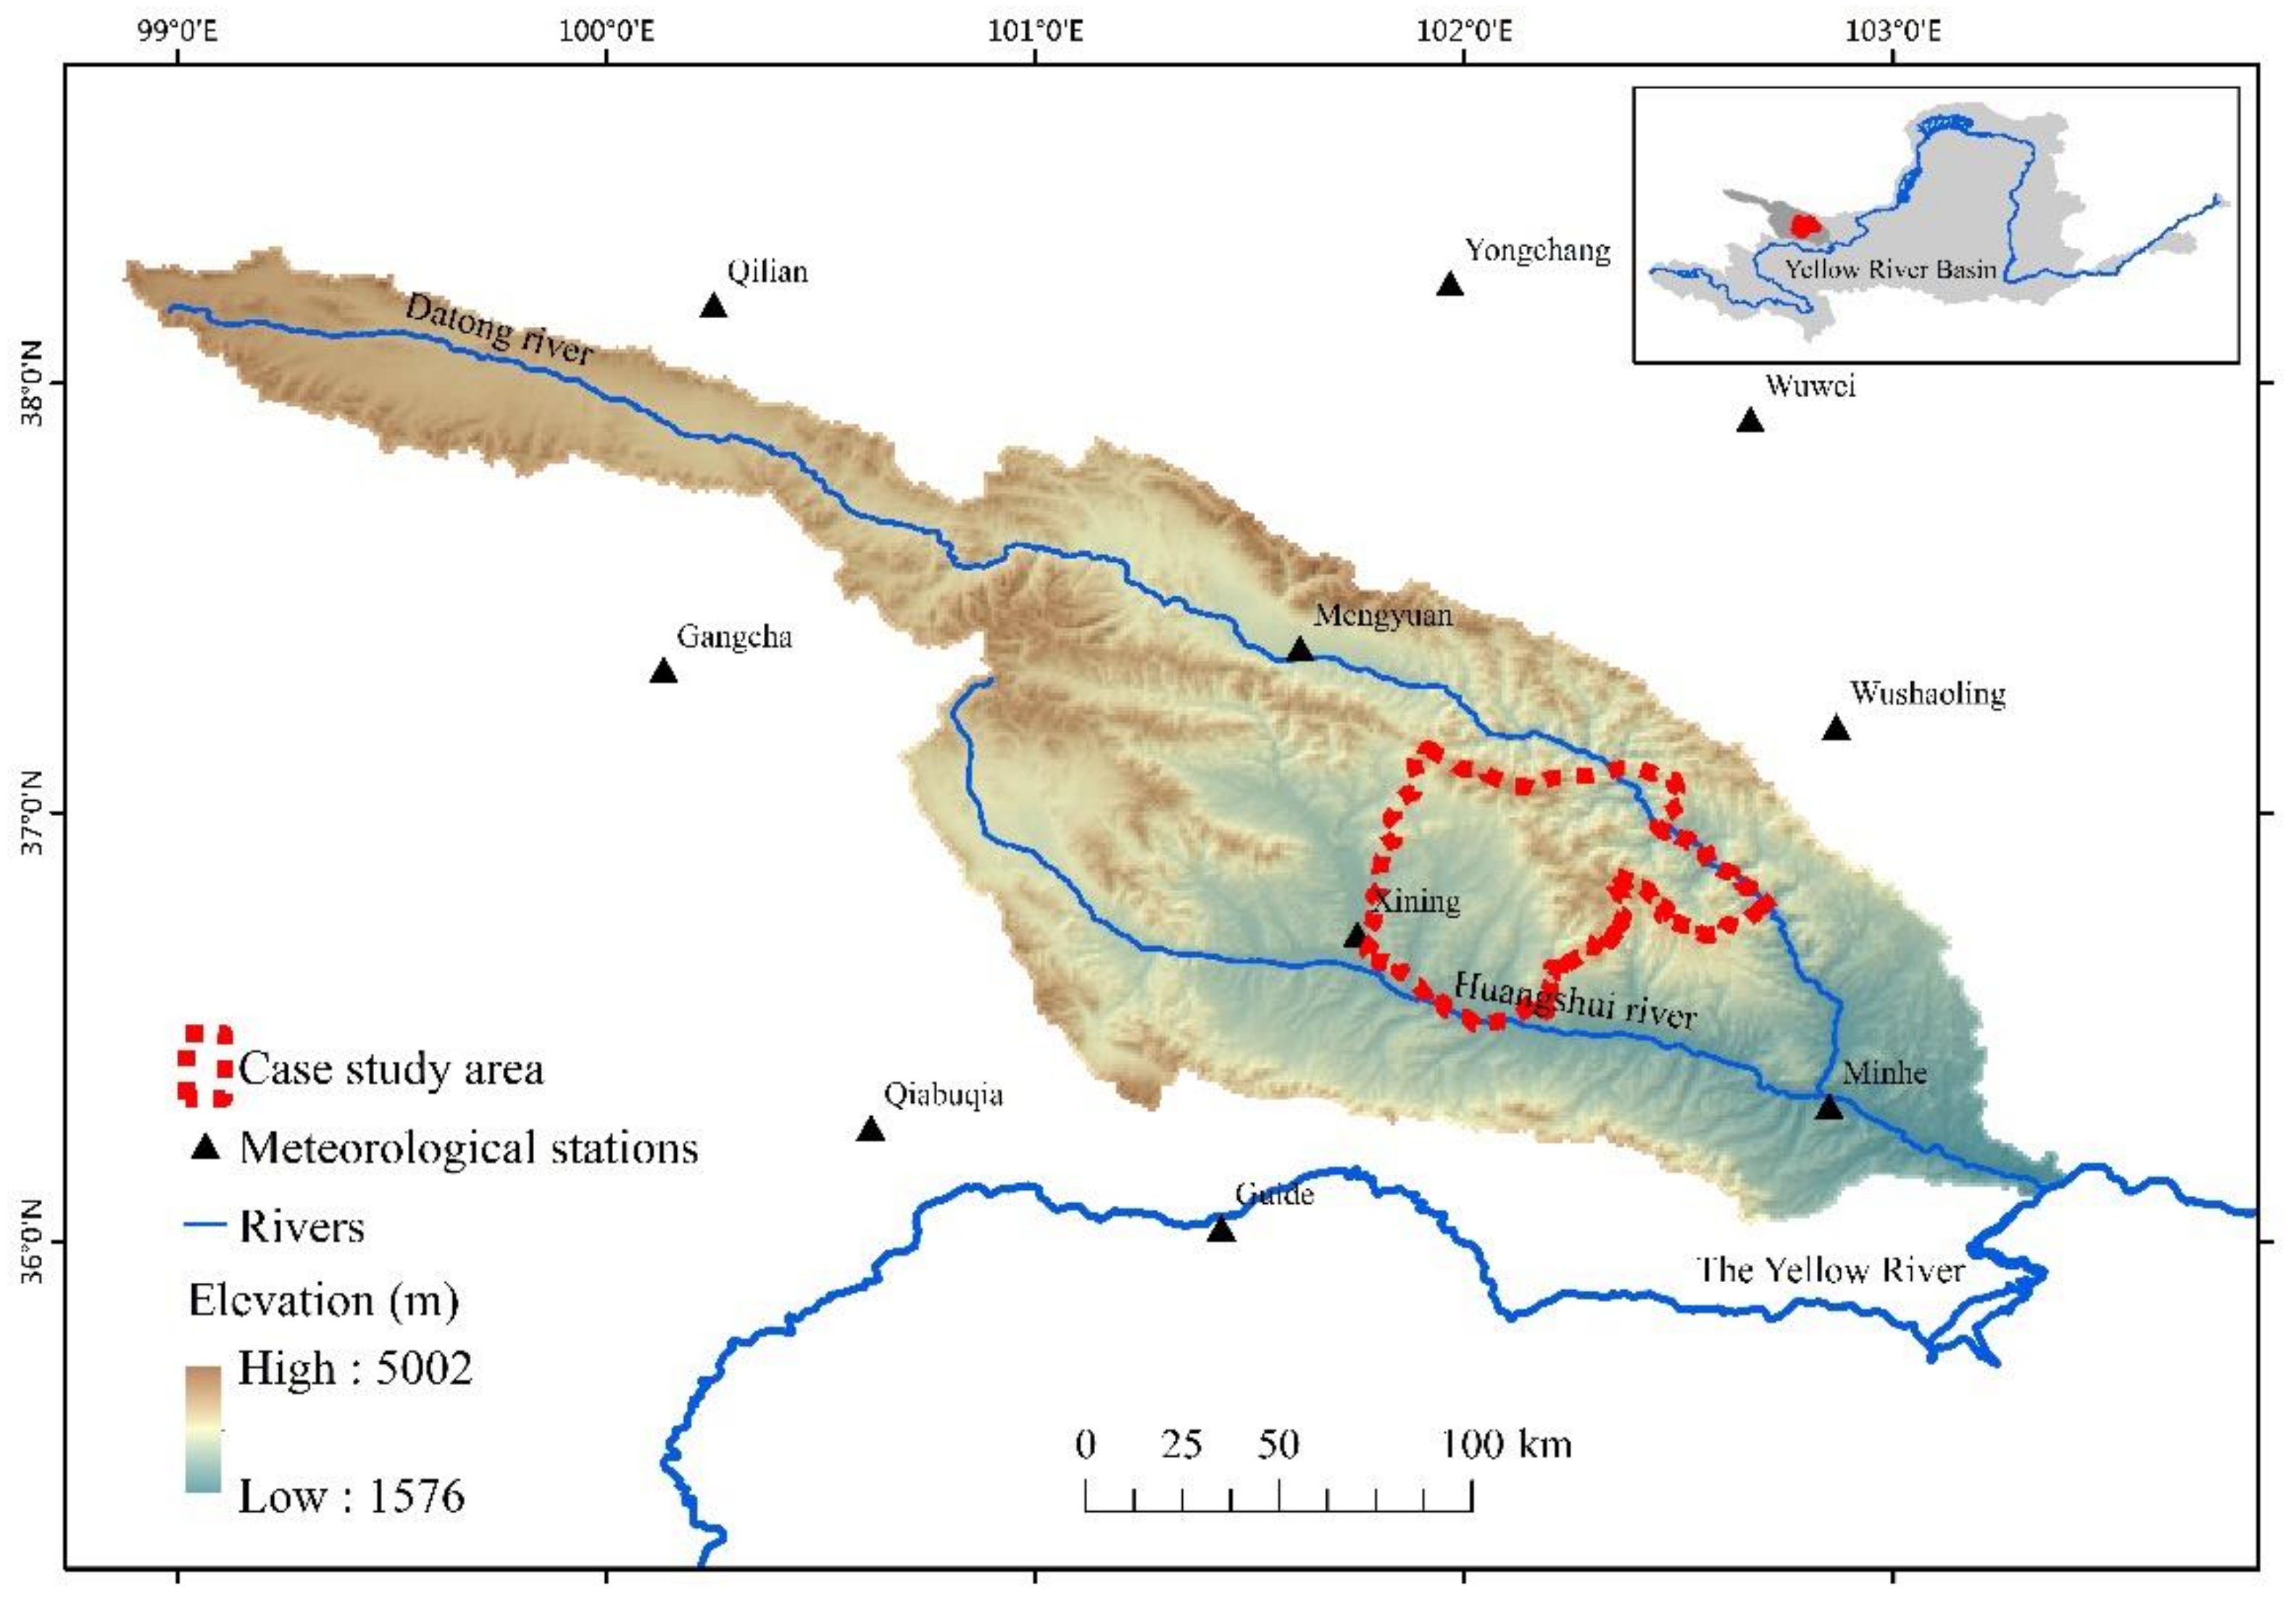
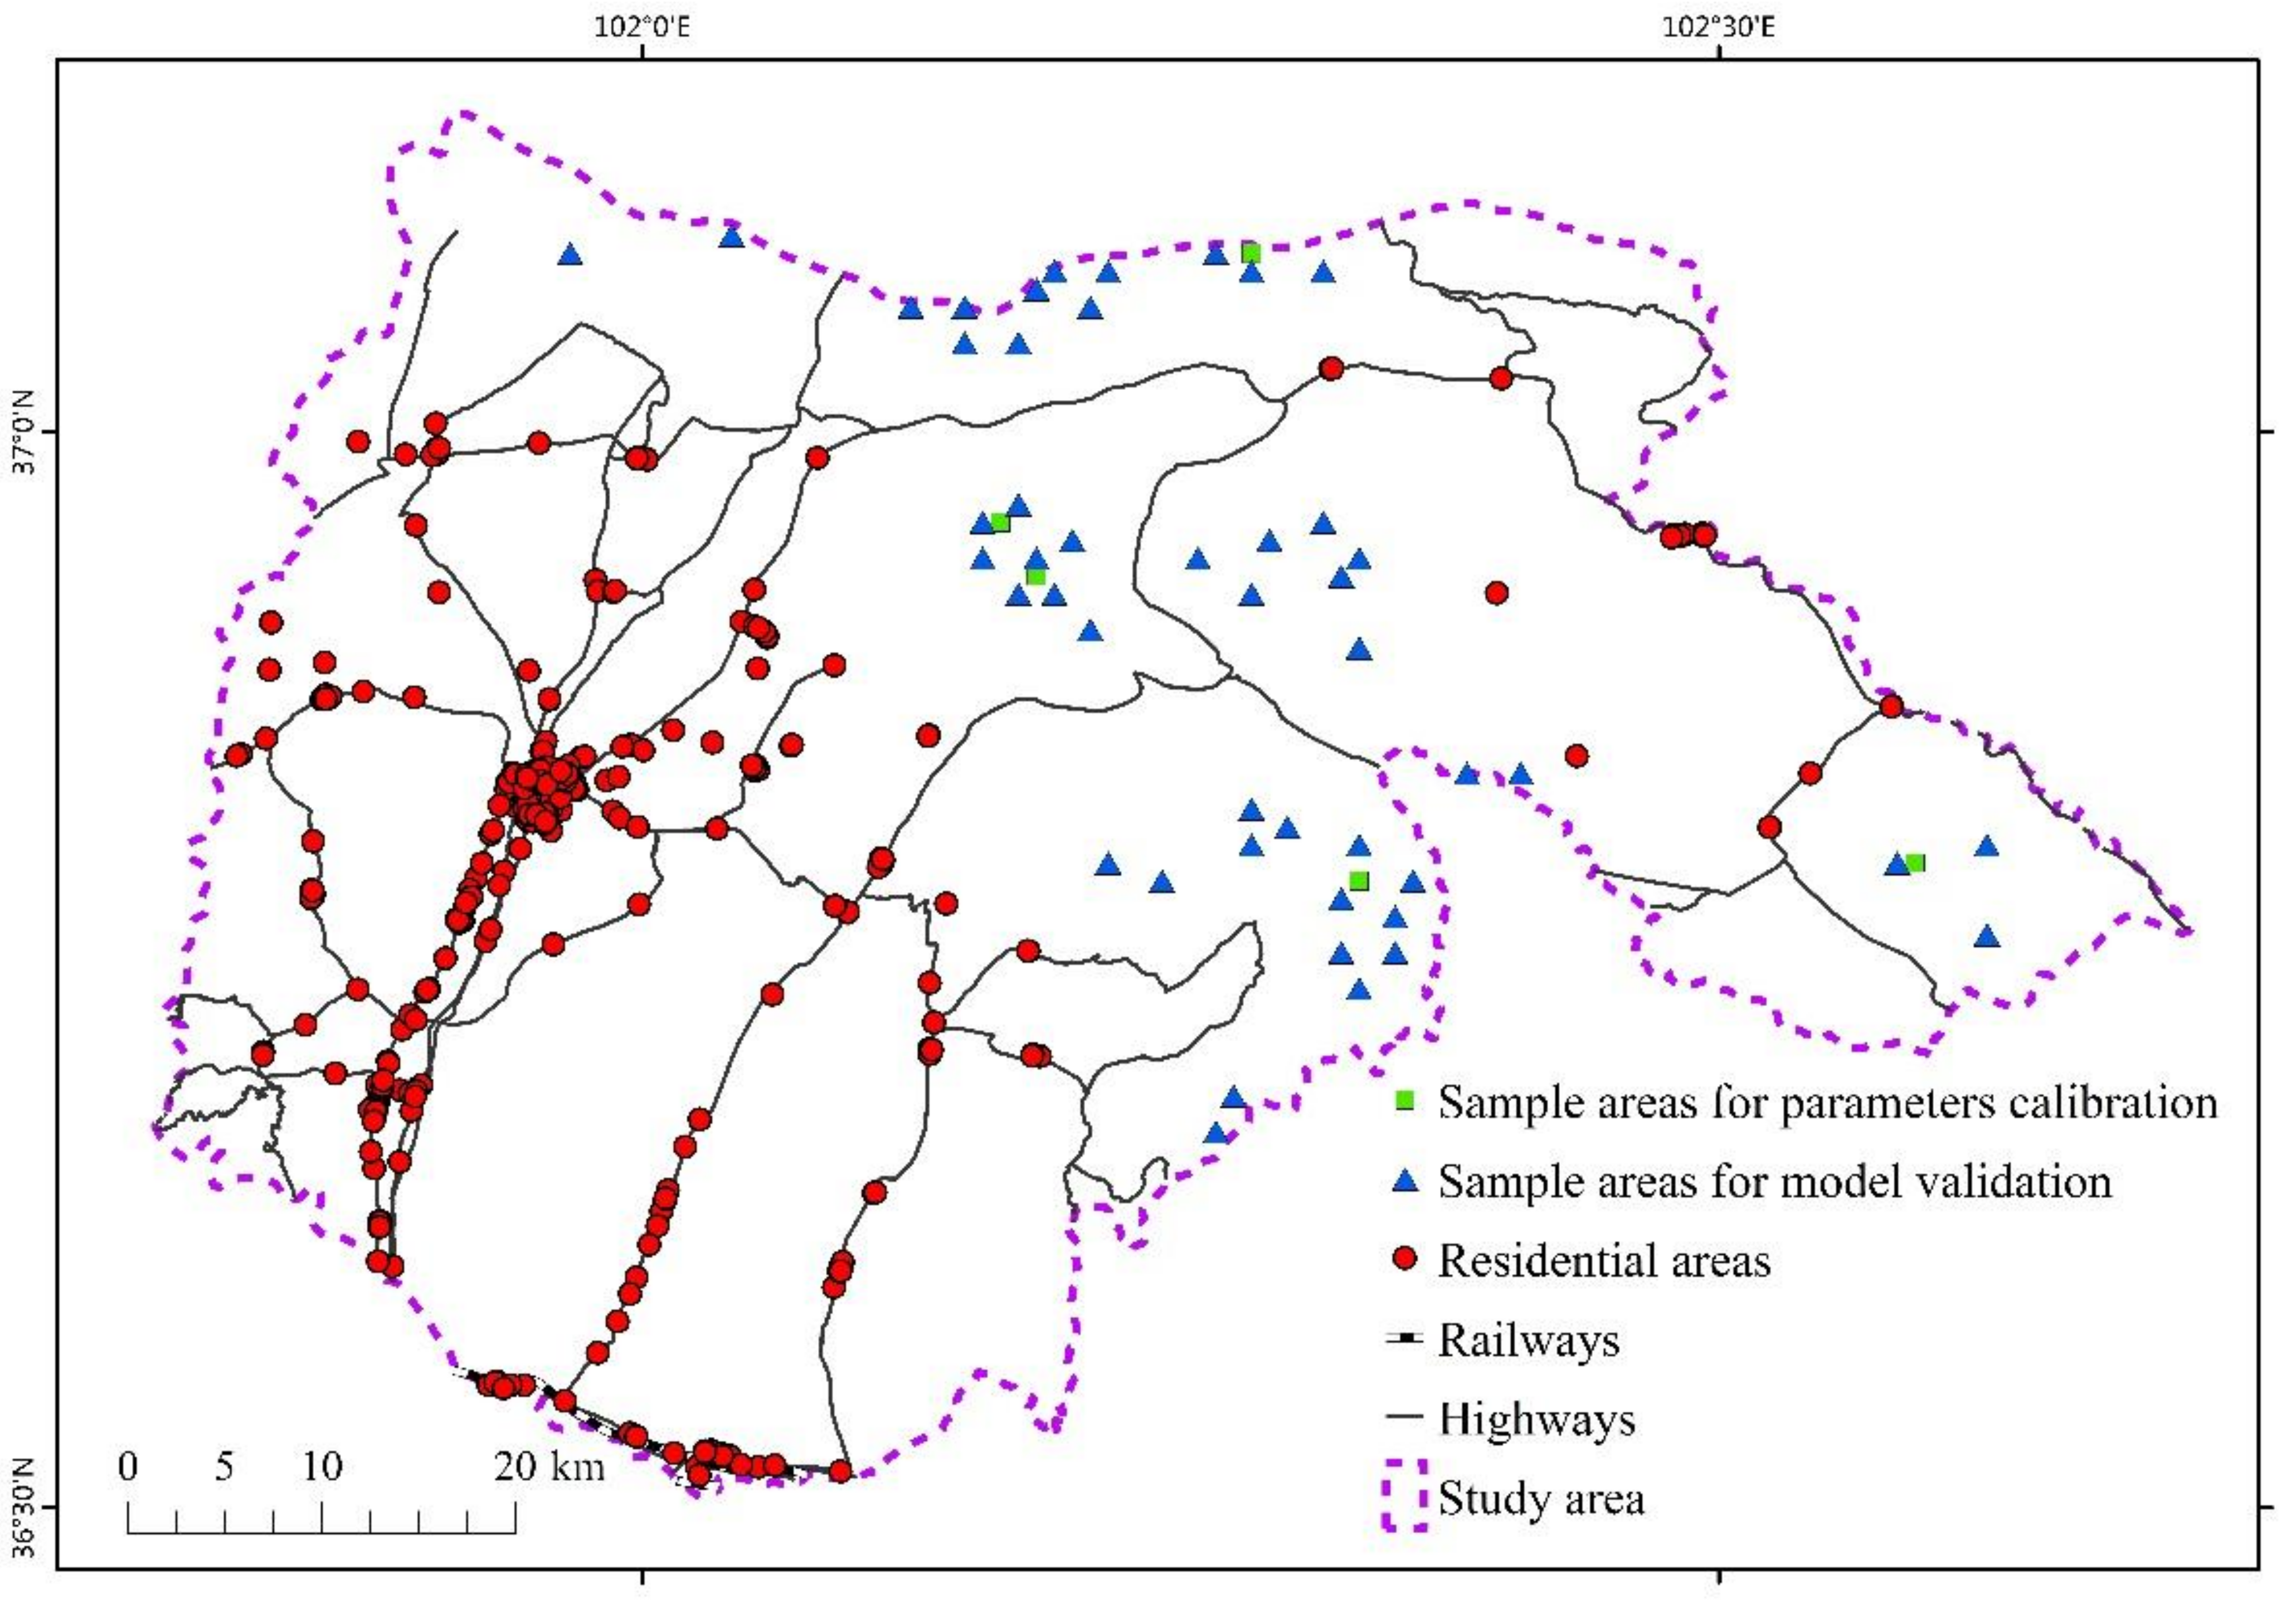
2.1. Case Study Area

Huzhu Tu Autonomous County (HZ) is located in the Huangshui river valley of the upper Yellow River Basin and covers a latitudinal range of 36°30′–37°9′N and a longitudinal range of 101°46′–102°45′E (Figure 1). The county is transected by the northwest–southeast trending Daban mountains; hence, the terrain is higher in the middle and lower in the east and west. The HZ is characterized by a temperate continental climate with an average annual temperature of about 5.8 °C and an annual precipitation of approximately 477.4 mm. Forests, croplands and rangelands cover most of the area, accounting for 35.01%, 11.57% and 52.19%, respectively. The HZ is a key agricultural and husbandry area in the Qinghai Province of Northwest China. Human activities such as afforestation, the conversion of cropland to grassland and grazing, resulted in a complex human-altered ecosystem [26,47,48].

2.2. Data and Processing

2.2.1. Basic Geographic Data

Daily climatic variables including temperature, precipitation, cloud cover, wind speed and relative humidity were interpolated at a spatial resolution of 1 km by the simple kriging with local means (SKLM) method [49,50,51], where the longitude, latitude and altitude were considered as the independent variables. The local means of climatic variables were evaluated by multiple linear regression with the three independent variables. The residuals between the local means and station-based observations were obtained and then spatially extrapolated by applying the simple kriging method to entire areas. The values of the climatic variable were finally determined as the sum of the local means and the residual extrapolations. Interpolation by SKLM performs well in the study area [8].
Soil texture data, with a spatial resolution of 1 km, was obtained from the Harmonized World Soil Database (version 1.21) constructed by the Food and Agriculture Organization of the United Nations and the International Institute for Applied Systems Analysis. These data contains up-to-date information on world soil resources and are widely used [52].
An initial vegetation map for the year 2000 was produced with the 1:1,000,000 scale vegetation map from survey data by the Chinese Academy of Sciences, using the International Geosphere–Biosphere Programme (IGBP) classification schemes.
ASTER DEM V2 data, with a horizontal resolution of approximately 30 m and a vertical resolution of 7–14 m, were obtained from the National Aeronautics and Space Administration. The DEM product has high accuracy in areas with complex terrain [53]. Elevation, slope and aspect data were extracted from the product and then resampled to the spatial resolution of 1 km using the area-weight method to gain a consistent scale across datasets.
The annual mean atmospheric CO2 concentration during 2000 was derived from the Waliguan global atmospheric background observation station in Qinghai province. The station is located near to the study area, and thus the observed results from that station are representative and highly reliable.

2.2.2. Remotely Sensed Data

The MODIS NPP product (MOD17A3HGapFill), with a spatial resolution of 500 m at yearly intervals, was applied to monitor ecosystem dynamics during the period 2000–2017. The accuracy of the simulations from the IBISi model was also validated by this product. MOD17A3HGapFill cleaned the source data that was flagged with poor-qualit; it has a high accuracy [54]. To gain a consistent scale across datasets, the NPP data was resampled to a spatial resolution of 1 km using the area-weight method.

2.2.3. Land Cover Types

Land cover dataset with a spatial resolution of 1 km for the period of 2001–2017 was derived from the MODIS Land Cover Type (MCD12Q1) Version 6 data product with the IGBP classification schemes, with a 500 m spatial resolution at yearly intervals [55]. The data within the case study area were resampled to the spatial resolution of 1 km using the majority method to gain a consistent scale across datasets. Less common types of land use and land cover appeared in the case study area, which mainly included croplands, grasslands and forest land. To validate the accuracy of the MCD12Q1 in the case study area, data for the year 2001 was compared with the vegetation map from survey data for the year 2000. The validation results show a high consistency (Kappa coefficient was 0.90) between the two data, which indicated that this MCD12Q1 met the requirements of this case study at the regional scale. Land cover conversions during the assessment period were detected by an overlay analysis of the datasets for 2001 and 2017.

2.2.4. Statistical Data of Human Activity

Overgrazing rate of rangeland and grazing density at the county level during the assessment period were obtained from the National Tibetan Plateau Data Center (https://data.tpdc.ac.cn/ (accessed on 1 December 2021)). Afforestation area at the county level during 2004–2017 was derived from the Qinghai Provincial Bureau of Statistics.

2.3. Methods

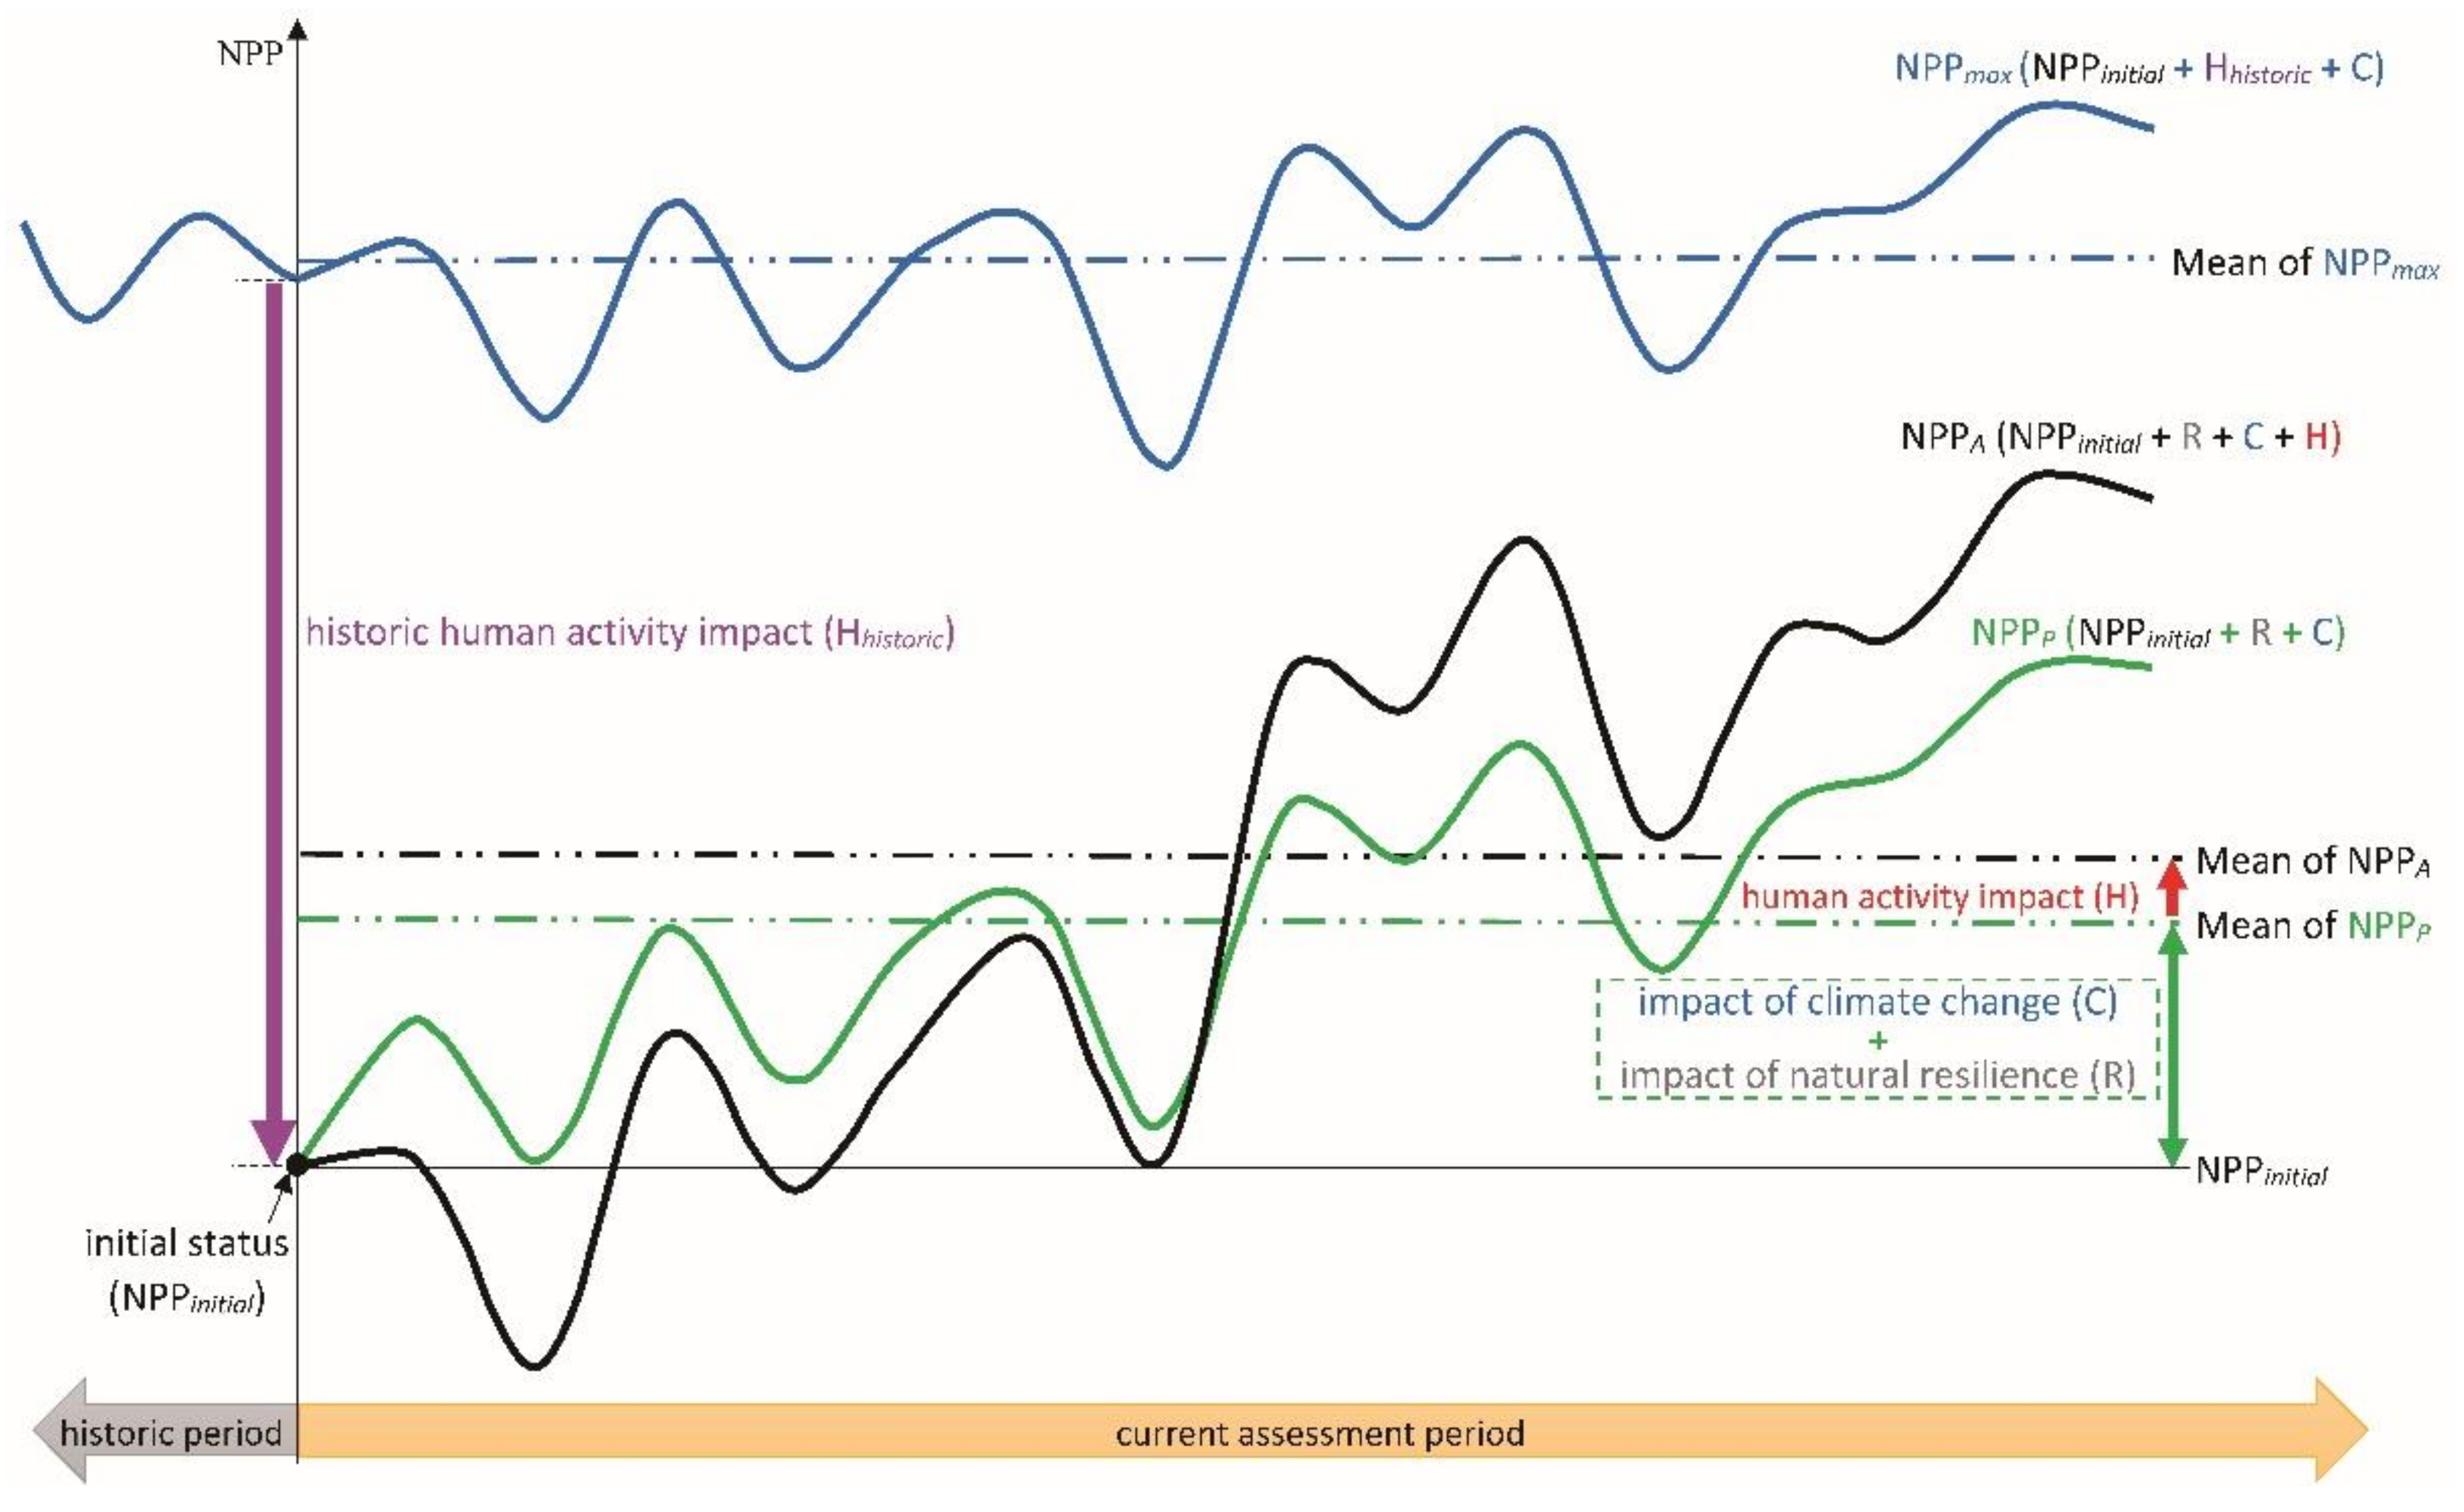
2.3.1. Establishing Assessment Benchmark—Potential NPP Simulation

The potential NPP series (NPPp) was simulated by the process-based IBISi model with climate change and natural resilience as dynamic benchmarks for assessment. The IBISi model was constructed based on the IBIS model [43] and included land surface processes, phenology, vegetation dynamic and soil biogeochemistry modules. This model integrated some key processes for alpine mountain ecosystems and yielded good results when simulating natural NPP dynamics [42]. In the case study, the actual ecosystem status in the year 2000 was set as the initial condition for the model, which had already been previously disturbed by human activity. The model was run for the period 2000–2017 using the climate series data and CO2 concentration of the year 2000. Thus, the simulated results included the NPP variations caused by climate change (C) and natural resilience (R) from the initial status (NPPinitial) and excluded the historical impacts of human activity (Hhistoric), resulting in
NPPp = NPPinitial + R + C
In the case study, 52 sampling areas without known intensive human disturbances (see Figure 2) were selected randomly from the areas, meeting the following conditions: (1) outside of a five-kilometer buffer zone for residential areas and roads and (2) within grazing-excluded areas or natural forest reserves, so as to validate the potential NPP simulations. Annual NPP from the IBISi model was compared with remotely sensed data in these sampling areas during the preliminary period. Five sampling areas (the green squares in Figure 2) were used for the calibration of key parameters in the model. The other sampling areas (blue triangles in Figure 2) were used for validating the reliability and accuracy of the potential NPP simulations. Root mean square error (RMSE) and mean absolute error (MAE) were used as measure indexes for the validation.

2.3.2. Assessing the Impact of Human Activities during the Assessment Period

The impact of human activity (H) on NPP refers to the comprehensive result of all impacts caused by human activities during the full assessment period, which was equal to the residual of counteraction between positive and negative human-caused NPP deviations. Here, human activities includes all behaviors carried out by human society or human individuals that exerted forces on the ecosystem through direct or indirect processes. In alpine areas, they mainly manifest as grazing, framing, afforesting, deforesting and land-cover changing, etc. For instance, an NPP loss caused by grazing was considered an impact of this human activity, but grazing prohibition should be identified as a kind of human activity change. Actually, grazing impact on ecosystem stopped after grazing prohibition, while natural resilience under climate change continued to drive the ecosystem changes.
In fact, the actual NPP series (NPPA) monitored by remote sensing was the joint result of NPP variations induced by natural resilience (R), climate change and human activity from the initial disturbed status. Thus, it could be expressed as
NPPA = NPPinitial + R + C + H
Comparing Equation (2) with Equation (1), it can be inferred that the impact of human activity was just the difference between the actual NPP and the potential one.
H = NPPA − NPPP
As a consequence, the impacts of natural resilience and climate change were effectively exfoliated from the final assessment results (see Equations (1) and (2) and Figure 3). Meanwhile, the impacts of historic human activity were naturally excluded when the initial status was adopted in the simulation for NPPP.
By contrast, if the maximum NPP (NPPmax) series under the constraints of natural conditions (akin to the NPP of a climax community under climate change conditions) was adopted as the assessment benchmark, the impacts of historical and current human activities were both included in the results, as well as the impacts of natural resilience. Consequently, the impact of human activity during the assessment period would be exaggerated. The reason is that the NPPmax series could be expressed as Equation (4), as shown in Figure 3.
NPPmax = NPPinitial + Hhstoric + C
On all these counts, the NPPP series was a reliable dynamic benchmark for the assessment of the impact of human activity on an ecosystem during a given period.
In practice, the multi-year mean value of the NPP series was calculated across the full assessment period to reflect their overall characteristics. The positive value of the the impact of human activities across the full assessment period represents NPP promotion due to human activities from a potential status of ecosystem, and vice versa (see Equation (3) and Figure 3).

2.3.3. Detecting Trend in the Impact of Human Activities during the Assessment Period

Trends in the actual and potential NPP series were detected separately as SlopeA and SlopeP using the linear regression [8]. The significance threshold was set at 0.05. A positive SlopeA or SlopeP indicates an increasing trend in NPP series, while the negative one suggests a decreasing trend in NPP series. The trend in the the impact of human activity (SlopeH) was calculated as the difference between SlopeA and SlopeP according to Equation (3).
SlopeH = SlopeA − SlopeP
A positive SlopeH indicated that the development of the impact of human activity was promoting NPP increase, and vice versa. However, these trends were not necessarily moving in the same direction as human impact itself (Table 1).

2.3.4. Assessing the Contribution of Human Activity to Ecosystem Changes

The contribution rates of human activity (CRH) and natural forces (CRN) to ecosystem changes were measured with SlopeH and SlopeP as
CRH = |SlopeH|/(|SlopeH| + |SlopeP|) × 100%
CRN = |SlopeP|/(|SlopeH| + |SlopeP|) × 100%
The natural forces included the natural resilience and climate change, and their contributions to ecosystem changes were comprehensively measured as the CRN.
The CRH and CRN were then compared to explore the dominant drivers of ecosystem changes during the current assessment period. The direction of the dominant drivers was also determined by the sign of the SlopeH and SlopeP. The dominant drivers of ecosystem changes were analyzed based on the spatial diversity of the nine situations in Table 2.

3. Results

3.1. Reliability of the Assessment Benchmark

Simulated NPP by the IBISi model showed good agreement (R2 = 0.91, p < 0.01) with monitored NPP from remotely sensed data in the samples without obvious human activities from the case study area (Figure 4). The range of the model error, MAE, and RMSE were ±0.050, 0.021 and 0.026 kgC·m−2·a−1, respectively. This high-accuracy simulation of potential NPP dynamics provided reliable benchmarks for the assessment of the impact of human activities during the current period.

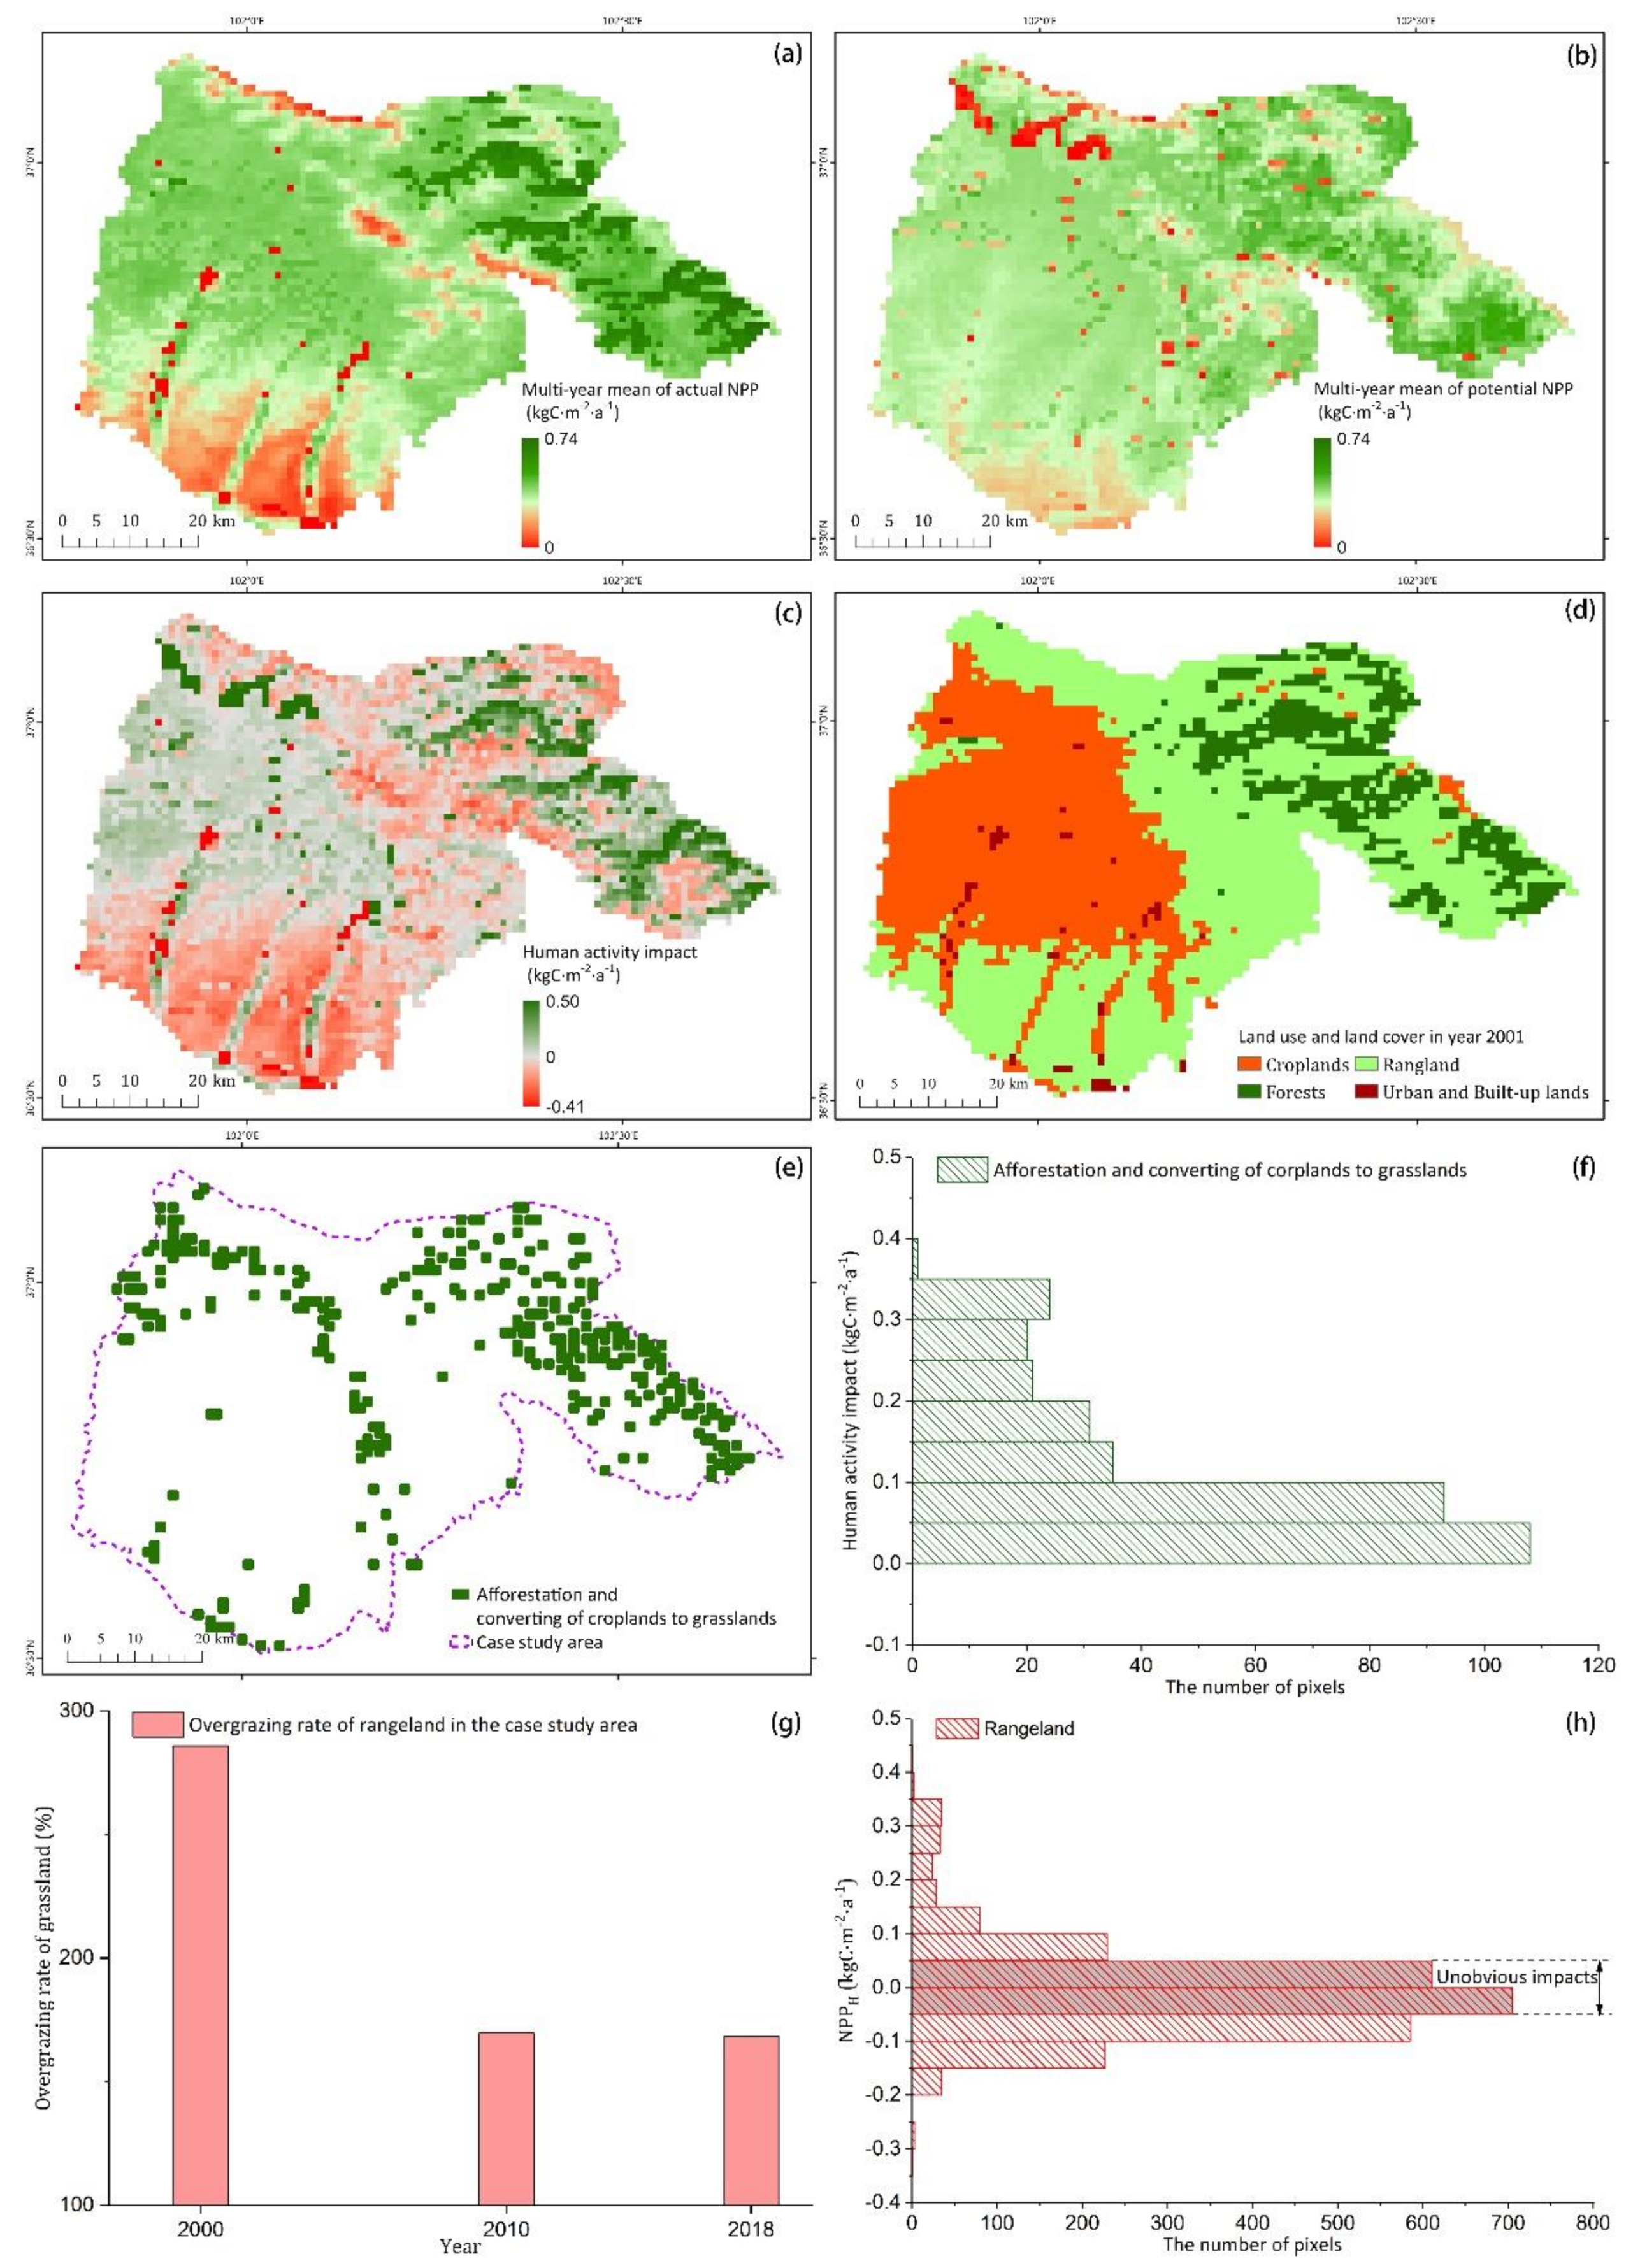
3.2. Assessment Result from the Case Study Area and Its Reliability

As shown in Figure 5c, heterogeneity in the impact of human activity on the case study area since 2000 was evident. Positive impacts of human activity were markedly concentrated in croplands, forests areas and their surroundings (Figure 5c,d). Afforestation and the converting of croplands to grasslands were widely distributed in these areas (Figure 5e) and caused a positive deviation of NPP to its lower potential values in these places (Figure 5a,b,f). Additionally, the negative impacts of human activity were mainly distributed in the rangelands in the HZ (Figure 5c,d). The degree of overgrazing in the rangelands was high in the case study area (Figure 5g). Grazing induced a negative deviation of NPP to its potential values, especially in the southern rangeland (Figure 5a,b,h).
The trend in the impact of human activities as a whole appeared positive but showed obvious spatial differences (Figure 6c,d). An increasing trend in the positive impacts of human activity was shown in croplands and afforestation and the converting of croplands to grasslands (Figure 5d,e). Continuous afforestation in protected forests resulted in an increasing trend of actual NPP around croplands and forests areas, while potential NPP mainly had a decreasing trend regarding the impacts of both climate change and natural resilience (Figure 6a,b,e,f).
Additionally, a decreasing trend in the negative impacts of human activity was revealed in the entire rangeland (Figure 6g). Grazing pressure had been decreasing but was still highly prominent due to the grazing restriction policy proposed by the government twenty years ago (Figure 5g and Figure 6h). The spatial difference of grazing impacts can be observed in Figure 6c. A decrease in the loss of NPP caused by grazing promoted the significant increasing trend in actual NPP in the southwestern rangeland, while potential NPP presented an insignificant increasing trend under the changing climate and natural restorations (Figure 6a,b). Concurrently, an increasing trend in actual NPP was still shown in rangeland in the northeastern mountainous areas due to a significant increasing trend in potential NPP, although NPP loss caused by grazing was strengthened.
The contribution rate of human activity to ecosystem NPP changes is shown in Figure 7. Its spatial pattern showed an obvious difference. A high contribution rate was seen in the croplands, southwestern rangeland and afforestation areas (Figure 5d,e). Human activities were revealed as the positive dominant driver there (Figure 8), while a low contribution rate appeared mainly in the rangeland in the northeastern mountainous areas. The ecosystem amelioration there was dominantly driven by natural forces (Figure 8c,d). A negative driving force from human activity was also shown in the northeastern mountainous areas.

4. Discussion

Multi-perspective assessment of the impact of human activities on the alpine ecosystem under the current dynamic climate is crucial and urgently needed for sustainable ecosystem protection and restoration [7,29,56,57], especially for disturbed ecosystems prior to the assessment period [27]. The initial conditions and a dynamic benchmark under a changing climate are critical to ensure the accuracy of the human impact measurement. The process-based simulation of the ecosystem could commendably solve these two issues. Compared with previous assessment methods that did not involve these issues [26,32,37], this assessment method with process simulation and a dynamic benchmark effectively excluded the impacts of climate change, natural resilience and historic human activities from the final assessment results. Thereby, the assessment results from this assessment method yielded a good performance in alpine ecosystems such as that used in the case study, where human activities mainly manifest in agriculture and husbandry practices. The applicability of this method in areas with lots of industrial activities and pollution still needs to be further explored.
Actually, areas dominated by alpine ecosystem are widely distributed in the Western China, where the Western Development Strategy and Grain for Green Project has been implemented since 2000 [58,59]. The intensity and direction of the impact of human activities in these areas could be assessed by the method proposed here. In this multi-perspective assessment scheme, the dominant drivers of ecosystem change could also be clarified, which could support the optimization of current ecological conservation and constructions.

5. Conclusions

This multi-perspective assessment method for the impact of human activity adopts a dynamic benchmark simulated by the IBISi based on an actually disturbed initial status. The impacts of historic human activities, natural resilience and climate change on ecosystems were reasonably uncovered by this method. The magnitude and direction of the impact of human activity and its contribution to ecosystem changes during the assessment period were quantified by the corresponding mathematical relationship of the actual and potential NPP series. This assessment method reasonably revealed the impacts and contributions by local afforestation, land-use optimization and grazing on NPP and showed a high reliability in the alpine ecosystem of the case study area in the upper Yellow River Catchment in Northwest China.

Author Contributions

Conceptualization, B.Z. and F.Z.; methodology, B.Z. and F.Z.; software, Y.Z.; validation, Y.Z. and Y.C.; formal analysis, Y.Z.; investigation, F.Z.; resources, Y.Z.; data curation, Y.C.; writing—original draft preparation, F.Z.; writing—review and editing, B.Z.; visualization, Y.Z.; supervision, T.Y.; project administration, B.Z.; funding acquisition, B.Z. All authors have read and agreed to the published version of the manuscript.

Funding

This research was funded by the National Natural Science Foundation of China (No.42171274).

Institutional Review Board Statement

Not applicable.

Informed Consent Statement

Not applicable.

Data Availability Statement

The data presented in this study are available on request from the corresponding author.

Conflicts of Interest

The authors declare no conflict of interest.

References

  1. Foley, J.; Defries, R.; Asner, G.; Barford, C.; Bonan, G.; Carpenter, S.; Chapin, F.; Coe, M.; Daily, G.; Gibbs, H.; et al. Global consequences of land use. Science 2005, 309, 570–574. [Google Scholar] [CrossRef] [Green Version]
  2. Turner, B.L., II; Lambin, E.F.; Reenberg, A. The emergence of land change science for global environmental change and sustainability. PNAS 2007, 104, 20666–20671. [Google Scholar] [CrossRef] [Green Version]
  3. Alkama, R.; Cescatti, A. Biophysical climate impacts of recent changes in global forest cover. Science 2016, 351, 600–604. [Google Scholar] [CrossRef] [PubMed] [Green Version]
  4. IPBES. IPBES, 2019: Summary for Policymakers of the Global Assessment Report on Biodiversity and Ecosystem Services of the Intergovernmental Science-Policy Platform on Biodiversity and Ecosystem Services; Díaz, S., Settele, J., Brondízio, E.S., Ngo, H.T., Guèze, M., Agard, J., Arneth, A., Balvanera, P., Brauman, K.A., Butchart, S.H.M., et al., Eds.; IPBES Secretariat: Bonn, Germany, 2019; pp. 1–5. [Google Scholar] [CrossRef]
  5. Wang, G.; Deng, W.; Yang, Y.; Cheng, D. The Advances, Priority and Developing Trend of Alpine Ecology. J. Mt. Sci. 2011, 29, 129–140. [Google Scholar] [CrossRef]
  6. Tao, J.; Xu, T.; Dong, J.; Yu, X.; Jiang, Y.; Zhang, Y.; Huang, K.; Zhu, J.; Dong, J.; Xu, Y.; et al. Elevation-dependent effects of climate change on vegetation greenness in the high mountains of southwest China during 1982–2013. Int. J. Climatol. 2018, 38, 2029–2038. [Google Scholar] [CrossRef]
  7. Wester, P.; Mishra, A.; Mukherji, A.; Shrestha, A.B. The Hindu Kush Himalaya Assessment—Mountains, Climate Change, Sustainability and People; Wester, P., Mishra, A., Mukherji, A., Shrestha, A.B., Eds.; Springer Nature Switzerland AG: Cham, Switzerland, 2019. [Google Scholar]
  8. Zeng, B.; Zhang, F.G.; Yang, T.; Qi, J.; Ghebrezgabher, M.G. Alpine sparsely vegetated areas in the eastern Qilian Mountains shrank with climate warming in the past 30 years. Prog. Phys. Geogr. 2018, 42, 415–430. [Google Scholar] [CrossRef]
  9. Anderson, K.; Fawcett, D.; Cugulliere, A.; Benford, S.; Jones, D.; Leng, R. Vegetation expansion in the subnival Hindu Kush Himalaya. Glob. Chang. Biol. 2020, 26, 1608–1625. [Google Scholar] [CrossRef] [PubMed] [Green Version]
  10. Immerzeel, W.W.; Lutz, A.F.; Andrade, M.; Bahl, A.; Biemans, H.; Bolch, T.; Hyde, S.; Brumby, S.; Davies, B.J.; Elmore, A.C.; et al. Importance and vulnerability of the world’s water towers. Nature 2020, 577, 364–369. [Google Scholar] [CrossRef]
  11. Qi, X.; Jia, J.; Liu, H.; Lin, Z. Relative importance of climate change and human activities for vegetation changes on China’s Silk Road economic belt over multiple timescales. Catena 2019, 180, 224–237. [Google Scholar] [CrossRef]
  12. Lian, X.; Piao, S.; Chen, A.; Huntingford, C.; Fu, B.; Li, L.Z.X.; Huang, J.; Sheffield, J.; Berg, A.M.; Keenan, T.F.; et al. Multifaceted characteristics of dryland aridity changes in a warming world. Nat. Rev. Earth Environ. 2021, 2, 232–250. [Google Scholar] [CrossRef]
  13. Zhu, Z.; Piao, S.; Myneni, R.B.; Huang, M.; Zeng, Z.; Canadell, J.G.; Ciais, P.; Sitch, S.; Friedlingstein, P.; Arneth, A.; et al. Greening of the earth and its drivers. Nat. Clim. Chang. 2016, 6, 791–795. [Google Scholar] [CrossRef]
  14. Chen, C.; Park, T.; Wang, X.; Piao, S.; Xu, B.; Chaturvedi, R.; Fuchs, R.; Brovkin, V.; Ciais, P.; Fensholt, R.; et al. China and India lead in greening of the world through land-use management. Nat. Sustain. 2019, 2, 122–129. [Google Scholar] [CrossRef]
  15. Piao, S.; Wang, X.; Park, T.; Chen, C.; Myneni, R.B. Characteristics, drivers and feedbacks of global greening. Nat. Rev. Earth Environ. 2020, 1, 14–27. [Google Scholar] [CrossRef]
  16. Pan, N.; Feng, X.; Fu, B.; Wang, S.; Ji, F.; Pan, S. Increasing global vegetation browning hidden in overall vegetation greening: Insights from time-varying trends. Remote. Sens. Environ. 2018, 214, 59–72. [Google Scholar] [CrossRef]
  17. He, B.; Wang, S.; Guo, L.; Wu, X. Aridity change and its correlation with greening over drylands. Agric. For. Meteorol. 2019, 278, 107663. [Google Scholar] [CrossRef]
  18. Cao, S.; Chen, L.; Shankman, D.; Wang, C.; Wang, X.; Zhang, H. Excessive reliance on afforestation in China’s arid and semi-arid regions: Lessons in ecological restoration. Earth Sci. Rev. 2011, 104, 240–245. [Google Scholar] [CrossRef]
  19. Feng, X.; Fu, B.; Piao, S.; Wang, S.; Ciais, P.; Zeng, Z.; Lü, Y.; Zeng, Y.; Li, Y.; Jiang, X.; et al. Revegetation in China’s Loess Plateau is approaching sustainable water resource limits. Nat. Clim. Chang. 2016, 6, 1019–1022. [Google Scholar] [CrossRef]
  20. Li, Y.; Piao, S.; Li, L.; Chen, A.; Wang, X.; Ciais, P.; Huang, L.; Lian, X.; Peng, S.; Zeng, Z.; et al. Divergent hydrological response to large-scale afforestation and vegetation greening in china. Sci. Adv. 2018, 4, eaar4182. [Google Scholar] [CrossRef] [PubMed] [Green Version]
  21. Ge, J.; Pitman, A.J.; Guo, W.; Zan, B.; Fu, C. Impact of revegetation of the Loess Plateau of china on the regional growing season water balance. Hydrol. Earth Syst. Sci. 2020, 24, 515–533. [Google Scholar] [CrossRef] [Green Version]
  22. Chen, B.; Zhang, X.; Tao, J.; Wu, J.; Wang, J.; Shi, P.; Zhang, Y.; Yu, C. The impact of climate change and anthropogenic activities on alpine grassland over the Qinghai-Tibet plateau. Agric. For. Meteorol. 2014, 189, 11–18. [Google Scholar] [CrossRef]
  23. Song, X.; Hansen, M.C.; Stehman, S.V.; Potapov, P.V.; Tyukavina, A.; Vermote, E.F.; Townshend, J.R. Global land change from 1982 to 2016. Nature 2018, 560, 639–643. [Google Scholar] [CrossRef] [PubMed]
  24. IPCC. Summary for policymakers. In Climate Change and Land: An IPCC Special Report on Climate Change, Desertification, Land Degradation, Sustainable Land Management, Food Security, and Greenhouse Gas Fluxes in Terrestrial Ecosystems; Shukla, P.R., Skea, J., Calvo Buendia, E., Masson-Delmotte, V., Pörtner, H.O., Roberts, D.C., Zhai, P., Slade, R., Connors, S., van Diemen, R., et al., Eds.; IPCC: Geneva, Switzerland, 2019; in press; Available online: https://www.ipcc.ch/srccl/chapter/summary-for-policymakers/ (accessed on 1 February 2020).
  25. Feng, Y.; Wu, J.; Zhang, J.; Zhang, X.; Song, C. Identifying the relative contributions of climate and grazing to both direction and magnitude of alpine grassland productivity dynamics from 1993 to 2011 on the northern Tibetan Plateau. Remote Sens. 2017, 9, 136. [Google Scholar] [CrossRef] [Green Version]
  26. Li, L.; Zhang, Y.; Liu, L.; Wu, J.; Wang, Z.; Li, S.; Zhang, H.M.; Zu, J.X.; Ding, M.J.; Paudel, B. Spatiotemporal Patterns of Vegetation Greenness Change and Associated Climatic and Anthropogenic Drivers on the Tibetan Plateau during 2000–2015. Remote Sens. 2018, 10, 1525. [Google Scholar] [CrossRef] [Green Version]
  27. Viña, A.; McConnell, W.J.; Yang, H.; Xu, Z.; Liu, J. Effects of conservation policy on China’s forest recovery. Sci. Adv. 2016, 2, e1500965. [Google Scholar] [CrossRef] [Green Version]
  28. Piao, S.; Yin, G.; Tan, J.; Cheng, L.; Huang, M.; Li, Y.; Liu, R.; Mao, J.; Myneni, R.B.; Peng, S.; et al. Detection and attribution of vegetation greening trend in China over the last 30 years. Glob. Chang. Biol. 2015, 21, 1601–1609. [Google Scholar] [CrossRef] [PubMed]
  29. Zhao, C.; Yan, Y.; Ma, W.; Shang, X.; Chen, J.; Rong, Y.; Xie, T.; Quan, Y. RESTREND-based assessment of factors affecting vegetation dynamics on the Mongolian Plateau. Ecol. Model. 2021, 440, 109415. [Google Scholar] [CrossRef]
  30. Guterres, A.; Liu, Z. The Sustainable Development Goals Report 2020; United Nations Publications: New York, NY, USA, 2020; ISBN 978-92-1-101425-9. [Google Scholar]
  31. Zhao, H.; Liu, S.; Dong, S.; Su, X.; Wang, X.; Wu, X.; Wu, L.; Zhang, X. Analysis of vegetation change associated with human disturbance using MODIS data on the rangelands of the Qinghai-Tibet plateau. Rangel. J. 2015, 37, 77. [Google Scholar] [CrossRef]
  32. Li, L.; Zhang, Y.; Liu, L.; Wu, J.; Paudel, B. Current challenges in distinguishing climatic and anthropogenic contributions to alpine grassland variation on the Tibetan Plateau. Ecol. Evol. 2018, 8, 5949. [Google Scholar] [CrossRef]
  33. Chen, T.; Bao, A.; Jiapaer, G.; Guo, H.; Zheng, G.; Jiang, L.; Chang, C.; Tuerhanjiang, L. Disentangling the relative impacts of climate change and human activities on arid and semiarid grasslands in central Asia during 1982–2015. Sci. Total Environ. 2019, 653, 1311–1325. [Google Scholar] [CrossRef]
  34. Verbesselt, J.; Umlauf, N.; Hirota, M.; Holmgren, M.; Van Nes, E.H.; Herold, M.; Zeileis, A.; Scheffer, M. Remotely sensed resilience of tropical forests. Nat. Clim. Chang. 2016, 6, 1028–1031. [Google Scholar] [CrossRef]
  35. Gunderson, L.H. Ecological resilience-in theory and application. Annu. Rev. Ecol. Syst. 2000, 31, 425–439. [Google Scholar] [CrossRef] [Green Version]
  36. Evans, J.; Geerken, R. Discrimination between climate and human-induced dryland degradation. J. Arid Environ. 2004, 57, 535–554. [Google Scholar] [CrossRef]
  37. Pan, T.; Zou, X.; Liu, Y.; Wu, S.; He, G. Contributions of climatic and non-climatic drivers to grassland variations on the Tibetan Plateau. Ecol. Eng. 2017, 108, 307–317. [Google Scholar] [CrossRef]
  38. Li, C.; Dou, T.; Wang, Y.; Zhu, T.; Yin, H.; Zhou, M.; Liu, L.; Wu, X. A Method for Quantifying the Impacts of Human Activities on Net Primary Production of Grasslands in Northwest China. Remote Sens. 2021, 13, 2479. [Google Scholar] [CrossRef]
  39. Wu, J.; Meng, L.; Zhang, X.; Fiedler, S.; Tietjen, B. Disentangling climatic and anthropogenic contributions to nonlinear dynamics of alpine grassland productivity on the Qinghai-Tibetan plateau. J. Environ. Manag. 2021, 281, 111875. [Google Scholar] [CrossRef]
  40. Kucharik, C.J.; Barford, C.C.; El Maayar, M.; Wofsy, S.C.; Monson, R.K.; Baldocchi, D.D. A multiyear evaluation of a Dynamic Global Vegetation Model at three AmeriFlux forest sites: Vegetation structure, phenology, soil temperature, and CO2 and H2O vapor exchange. Ecol. Model. 2006, 196, 1–31. [Google Scholar] [CrossRef]
  41. Hegerl, G.C.; Hoegh-Guldberg, O.; Casassa, G.; Hoerling, M.; Kovats, S.; Parmesan, C.; Pierce, D.; Stott, P. Good practice guidance paper on detection and attribution related to anthropogenic climate change. In Meeting Report of the Intergovernmental Panel on Climate Change Expert Meeting on Detection and Attribution of Anthropogenic Climate Change; Stocker, T.F., Field, C.B., Qin, D., Barros, V., Plattner, G.-K., Tignor, M., Midgley, P.M., Ebi, K.L., Eds.; IPCC Working Group I Technical Support Unit; University of Bern: Bern, Switzerland, 2010. [Google Scholar]
  42. Zeng, B.; Zhang, F.G.; Wei, L.; Zhang, X.; Yang, T. An improved IBIS model for simulating NPP dynamics in alpine mountain ecosystems: A case study in the eastern Qilian Mountains, Northeastern Tibetan Plateau. Catena 2021, 206, 105479. [Google Scholar] [CrossRef]
  43. Foley, J.A.; Prentice, I.C.; Ramankutty, N.; Levis, S.; Pollard, D.; Sitch, S.; Haxeltine, A. An integrated biosphere model of land surface processes, terrestrial carbon balance, and vegetation dynamics. Glob. Biogeochem. Cycles 1996, 10, 603–628. [Google Scholar] [CrossRef]
  44. Kucharik, C.J.; Foley, J.A.; Delire, C.; Fisher, V.A.; Coe, M.T.; Lenters, J.D.; Young-Molling, C.; Ramankutty, N.; Norman, J.M.; Gower, S.T. Testing the performance of a dynamic global ecosystem model: Water balance, carbon balance, and vegetation structure. Glob. Biogeochem. Cycles 2000, 14, 795–825. [Google Scholar] [CrossRef]
  45. Chambers, J.C.; Bradley, B.A.; Brown, C.S.; D’Antonio, C.; Germino, M.J.; Grace, J.B.; Hardegree, S.P.; Miller, R.F.; Pyke, D.A. Resilience to Stress and Disturbance, and Resistance to Bromus tectorum L. Invasion in Cold Desert Shrublands of Western North America. Ecosystems 2014, 17, 360–375. [Google Scholar] [CrossRef]
  46. Wang, L.; Wiesmeier, M.; Zhao, G.; Zhang, R.; Hou, F.; Han, G.; Siddique, K.; Hou, F. Grazing exclusion—An effective approach for naturally restoring degraded grasslands in Northern China. Land Degrad. Dev. 2018, 29, 4439–4456. [Google Scholar] [CrossRef]
  47. Yao, T. Tackling on environmental changes in Tibetan Plateau with focus on water, ecosystem and adaptation. Sci. Bull. 2019, 64, 417. [Google Scholar] [CrossRef] [Green Version]
  48. Mo, X. Grassland Productivity on the Qinghai-Tibetan Plateau since 1980; National Tibetan Plateau Data Center: Beijing, China, 2020. [Google Scholar] [CrossRef]
  49. Goovaerts, P. Geostatistical approaches for incorporating elevation into the spatial interpolation of rainfall. J. Hydrol. 2000, 228, 113–129. [Google Scholar] [CrossRef]
  50. Guan, H.; Wilson, J.L.; Makhnin, O. Geostatistical Mapping of Mountain Precipitation Incorporating Autosearched Effects of Terrain and Climatic Characteristics. J. Hydrometeorol. 2009, 6, 1018. [Google Scholar] [CrossRef]
  51. Szentimrey, T.; Bihari, Z.; Lakatos, M.; Szalai, S. Mathematical, methodological questions concerning the spatial interpolation of climate elements. Idojaras 2011, 115, 1–11. [Google Scholar]
  52. FAO/IIASA/ISRIC/ISSCAS/JRC. Harmonized World Soil Database; version 1.2; FAO: Rome, Italy; IIASA: Laxenburg, Austria, 2012. [Google Scholar]
  53. Tachikawa, T.; Hato, M.; Kaku, M.; Iwasaki, A. The characteristics of ASTER GDEM version 2. In Proceedings of the 2011 IEEE International Geoscience and Remote Sensing Symposium IGARSS, Vancouver, BC, Canada, 24–29 July 2011. [Google Scholar]
  54. Running, S.W.; Zhao, M. User’s Guide Daily GPP and Annual NPP (MOD17A2H/A3H) and Year-end Gap-Filled (MOD17A2HGF/A3HGF) Products NASA Earth Observing System MODIS Land Algorithm (For Collection 6); Version 4.2; LP DAAC: Sioux Falls, SD, USA, 2019. [Google Scholar]
  55. Sulla-Menashe, D.; Gray, J.M.; Abercrombie, S.P.; Friedl, M.A. Hierarchical mapping of annual global land cover 2001 to present: The MODIS Collection 6 Land Cover product. Remote Sens. Environ. 2019, 222, 183–194. [Google Scholar] [CrossRef]
  56. Haberl, H.; Erb, K.H.; Krausmann, F. Human appropriation of net primary production: Patterns, trends, and planetary boundaries. Soc. Sci. Electron. Publ. 2014, 39, 363–391. [Google Scholar] [CrossRef]
  57. Fu, B.; Yu, D. Trade-off analyses and synthetic integrated method of multiple ecosystem services. Resour. Sci. 2016, 38, 1–9. [Google Scholar] [CrossRef]
  58. Fu, B.; Forsius, M.; Liu, J. Ecosystem services: Climate change and policy impacts. Curr. Opin. Environ. Sustain. 2013, 5, 1–3. [Google Scholar] [CrossRef]
  59. Chen, T.; Tang, G.; Yuan, Y.; Guo, H.; Chen, X. Unraveling the relative impacts of climate change and human activities on grassland productivity in central Asia over last three decades. Sci. Total Environ. 2020, 743, 140649. [Google Scholar] [CrossRef]
Figure 1. The case study area.
Remotesensing 14 00208 g001
Figure 2. Sampling areas for calibration of parameters, and model validation.
Remotesensing 14 00208 g002
Figure 3. Schematic for the impact of human activities on NPP during the assessment period. Actual NPP series (NPPA) were the joint results of NPP variations caused by natural resilience (R), climate changes (C) and human activity (H) from initial disturbed status (NPPinitial, the black point), as shown by the black curve. Potential NPP series (NPPP) was the joint results of NPP variations induced by natural resilience and climate changes from the initial disturbed status, as shown by the green curve. Maximum NPP under the constraints of natural condition (NPPmax), as shown by the blue curve.
Remotesensing 14 00208 g003
Figure 4. A comparison of simulated NPP with monitored NPP.
Remotesensing 14 00208 g004
Figure 5. Spatial pattern of NPP and the impact of human activities in the case study area during the period 2000–2017: (a) Spatial distribution of the multi-year mean values of actual NPP, (b) potential NPP and (c) NPP changes caused by human activities (i.e., the impact of human activity) across the full assessment period. (d) Land use and land cover in the year 2001. (e) Afforestation areas and (f) frequency distribution histogram of the impact of human activity there. (g) Overgrazing rate of rangelands in the case study in 2000, 2010 and 2018. (h) Frequency distribution histogram of the impact of human activity in the rangelands.
Remotesensing 14 00208 g005
Figure 6. Trends in NPP and human activity changes in the case study area during 2000–2017. Trends in (a) actual NPP, (b) potential NPP and (c) the impact of human activity, respectively. Gray areas marked with “None” means that trends in actual and potential NPP were all insignificant. (d) Trends in NPP at the entire HZ scale. (e) NPP trends in the afforestation areas and (f) afforestation area during 2004–2017. (g) NPP trends in the rangelands and (h) grazing density during 2000–2015.
Remotesensing 14 00208 g006
Figure 7. Contribution rate of human activity to ecosystem NPP changes during the assessment period. Gray areas marked with “None” mean that trends in actual and potential NPP were all insignificant, which were not involved in the assessment of contribution.
Remotesensing 14 00208 g007
Figure 8. Dominant drivers of ecosystem NPP changes in the case study area from 2000 to 2017. The dominant drivers in (a) entire case study area, (b) croplands, (c) forest lands and (d) rangelands, respectively. “None” refers to no significant driver. H and N represent human activity and natural forces as driving factors, respectively. “+” means that the driving factor facilitated the improvement of the ecosystem and relieved the degradation of ecosystem. “-” means that the driving factor inhibited the improvement of ecosystem and accelerated degradation of ecosystem.
Remotesensing 14 00208 g008
Table 1. Trend in the impact of human activity.
SlopeH (gC·m−2·a−2)Description
>0Positive trend in the impact of human activity on NPP
An increase in the positive impact of human activity (NPPH > 0)
or a decrease in the negative impact of human activity (NPPH < 0).
<0Negative trend in the impact of human activity on NPP
An increase in the negative impact of human activity (NPPH < 0)
or a decrease in the positive impact of human activity (NPPH > 0).
Table 2. Dominant drivers of ecosystem changes.
Dominant DriversSituations
NoneSlopeH ∈ (−ε,+ε) and SlopeP ∈ (−ε,+ε)no significant driver.
Both|CRH − CRN| ≤ δ
Direction :   Sgn Slope H ,   Sgn Slope p
negative drivers (−H−N)
positive drivers (+H+N)
incongruous drivers
(+H−N, −H+N)
Human activity|CRH − CRN| > δ
Direction :   Sgn Slope H
positive driver (+H)
negative driver (−H)
Natural forces
(natural resilience and climate change)
|CRN − CRH| > δ
Direction :   Sgn Slope p
positive driver (+N)
negative driver (−N)
Note: The threshold ε was set as the ratio of the double standard deviation of the mean of model error to the assessment time span to ensure that at least one of the NPP drivers was significant. The threshold δ for identifying the significance of the difference between contribution rates was set to 0.2 in this case study. This threshold was allowed to be adjusted according to the requirement for distinguishing the contributions’ differences when this method was applied to a given assessment. Sgn is the function that returns sign of an argument.
Publisher’s Note: MDPI stays neutral with regard to jurisdictional claims in published maps and institutional affiliations.

