Technical Note

Assimilation of GNSS PWV with NCAR-RTFDDA to Improve Prediction of a Landfall Typhoon

1
Meteorological Observation Centre of China Meteorological Administration, Beijing 100081, China
2
National Center for Atmospheric Research (NCAR), Boulder, CO 80307, USA
3
Precision Regional Earth Modeling and Information Center, Nanjing University of Information Science & Technology, Nanjing 210044, China
*
Author to whom correspondence should be addressed.
Remote Sens. 2022, 14(1), 178; https://doi.org/10.3390/rs14010178
Submission received: 15 November 2021 / Revised: 22 December 2021 / Accepted: 22 December 2021 / Published: 1 January 2022

Abstract

:
Precipitable water vapor (PWV) retrieved from ground-based global navigation satellite system (GNSS) stations acquisition signal of a navigation satellite system provides high spatial and temporal resolution atmospheric water vapor. In this paper, an observation-nudging-based real-time four-dimensional data assimilation (RTFDDA) approach was used to assimilate the PWV estimated from GNSS observation into the WRF (Weather Research and Forecasting) modeling system. A landfall typhoon, “Mangkhut”, is chosen to evaluate the impact of GNSS PWV data assimilation on its track, intensity, and precipitation prediction. The results show that RTFDDA can assimilate GNSS PWV data into WRF to improve the water vapor distribution associated with the typhoon. Assimilating the GNSS PWV improved the typhoon track and intensity prediction when and after the typhoon made landfall, correcting a 5–10 hPa overestimation (too deep) of the central pressure of the typhoon at landfall. It also improved the occurrence and the intensity of the major typhoon spiral rainbands.

1. Introduction

Water vapor is one of most important components in the atmosphere, which plays a key role in the energy and water cycle of the earth’s climate system. It is also an important factor in the formation and evolution of severe weather. The temporal and spatial distribution of water vapor has important indications for atmospheric stability and the formation of clouds and precipitation. Ground-based GNSS (global navigation satellite system) remote-sensing measures atmospheric water vapor information by acquiring navigation satellite system signals. A ground-based GNSS water vapor detection network provides water vapor data that make up for large gaps of conventional twice-daily soundings in time and space [1,2]. The recent development of composite satellite navigation systems allows ground-based GNSS stations to provide abundant water vapor data [3].
Contemporary numerical weather prediction models play an important role in daily weather forecasting and weather research. Data assimilation and model initialization with weather observations are one of the key model components that influence the model forecast performance. Further improving the accuracy of numerical models by incorporating more observations from the modern and new remote-sensing technology is an important way to improve the accuracy of numerical predictions. The application of ground-based GNSS remote-sensing water vapor detection in numerical forecasting has received increasing attention.
In the last two decades, several methods have been developed to assimilate the GNSS data in numerical weather prediction models. Kuo et al. [4] investigated a “profile-processing” method for assimilating precipitable water vapor (PWV) into a mesoscale model. With an assimilation experiment based on an idealized observation system simulation experiment (OSSE) method, Kuo et al. found a possible impact of PWV data assimilation on predicting convection. Cucurull et al. [5] used a 3DVAR (three-dimension variational) method to assimilate GPS PWV for modeling a heavy precipitation process in the Western Mediterranean. Their results showed that the GPS PWV data improved the forecast of the wind and temperature while adjusting the humidity field. Kuo et al. [6], Guo et al. [7], De Pondeca and Zou [8], and Ha et al. [9] tested a 4DVAR (four-dimensional variational) method with the mesoscale model version 5 (MM5) model [10] to assimilate GPS PWV and significantly improved precipitation forecasts of convective systems. Smith et al. [11], Guo et al. [12], Zus et al. [13], Kawabata et al. [14], Järvinen et al. [15], Vedel and Huang [16], and Memmo et al. [17] all found the benefit of assimilating GPS PWV or zenith tropospheric delay into the numerical forecast model in improving the analysis of the humidity, temperature, and wind and the forecasting of precipitation. The research results of Benjamin et al. [18] indicated that GPS PWV data assimilation has a positive contribution to short-term typhoon forecasting.
In the past 10 years, many GNSS observation stations have been built in China. The China Meteorological Administration has established several GNSS networks, including the “Meteorological Monitoring and Disaster Warning Project”, “Crustal Movement Observation Network of China”, and local Provincial GNSS Comprehensive Application Networks. With the construction and data sharing effort, a real-time operational data acquisition system has been built at the China Meteorological Administration. The system operationally collects and monitors 1164 GNSS observations across the country to monitor the troposphere and ionosphere. The system is able to obtain GNSS observations and retrieve PWV within a 1 h latency. It is of great interest to assess the assimilation technologies and develop an effective algorithm to assimilate these GNSS observations in weather forecast models.
Nudging-based assimilation technology is a highly efficient four-dimensional assimilation technology that has been widely used in mesoscale operational forecast [19,20,21]. There are three main advantages of the nudging method. One is that it only requires an additional trend term in the prognostic equations of the numerical weather prediction models, and it is very computing efficient, the second is that it allows effective and continuous assimilation of the observations available at high time frequency, and finally, the third is that it achieves spin-up and dynamics-physical consistent initial conditions for the model forecast. The main disadvantage of the nudging method is that it does not directly support assimilation for the observed variables that are not the model prognostic variables. Anthes et al. [22] introduced a nudging assimilation method. After that, Stauffer et al. [23,24,25], Seaman et al. [26,27], Warner et al. [28], Pacione et al. [29], and Grell et al. [10] described or tested the nudging method in MM5. Liu et al. [30,31,32] applied this method to WRF and developed a real-time four-dimensional data assimilation system (RTFDDA). RTFDDA supports over 20 short-term forecast systems in the world [33,34,35,36].
In this paper, the GNSS PWV data are stratified by a “profile processing method”, similar to Kuo et al. [4], before being assimilated into WRF-RTFDDA. The water vapor mixing ratio on the model vertical layers was retrieved from the PWV estimated from GNSS observations and then assimilated into WRF with the observation-nudging four-dimensional data assimilation module. The effect of assimilating GNSS PWV data into the WRF prediction of a landfall typhoon was evaluated using observations of the automatic weather stations (AWSs).

2. GNSS PWV Assimilation Method and Model Setups

2.1. Algorithm for GNSS PWV Data Assimilation

The nudging method makes gradual, incremental adjustments to the model state variables to correct the departure of the model state from observations [37]. One of the nudging methods is observation nudging, a form of Newtonian relaxation where artificial observation-correction terms are introduced into the model prognostic equations to nudge the model forecast states to be aligned with the observed reality. Observation-nudging is a continuous data assimilation method that is applied in every time step of the model integration during a given assimilation time window. The model prognostic equation with observation nudging is [38]:
q μ t ( x , y , z , t ) = F q ( x , y , z , t ) + μ G q i = 1 N W q 2 ( i , x , y , z , t ) [ q o ( i ) q m ( x i , y i , z i , t ) ] i = 1 N W q ( i , x , y , z , t )
where q represents the model forecast variables being nudged, µ is the dry hydrostatic pressure, Fq represents the physical tendency terms of the q equation, Gq is the nudging coefficient for q, N is the total number of observations, i is the index to the current observation, Wq is the spatiotemporal weighting function based on the temporal and spatial separation between the observation and the current model integration time and location, qo is the observed value of the variable q, and qm(xi,yi,zi,t) is the model value of q interpolated to the observation location (xi,yi,zi).
In the observation-nudging assimilation, the variables that can be assimilated directly include temperature, wind, water vapor mixing ratio, and so forth. The water vapor measured by ground-based GNSS remote sensing is in the form of PWV, which is not a model prognostic variable, and thus, it cannot be directly assimilated with the nudging method. Therefore, PWV needs to be appropriately processed and converted into a water vapor mixing ratio to be assimilated. This paper adopts a method similar to what was proposed by Kuo et al. [4], using GNSS PWV (observed PWV) to retrieve the water vapor mixing ratios in the vertical layers of the model and then assimilate them to the WRF-RTFDDA model. Below is a brief description of the algorithm.
First, the model PWV is calculated by integrating the water vapor in the model column at the location of the ith observation.
P W mod i = P s P t g k = 1 N q mod i ( k ) Δ σ ( k )
where Ps is the surface pressure, Pt is the pressure at the top of model, g is the acceleration of gravity, Δσ(k) is the thickness of the kth layer, qmod is the model water vapor mixing ratio, and N is the number of layers.
The second step is to compute the observation innovation (i.e., the difference between the observed PWV and the model PWV). By assuming that the structure of the vertical profile of the model humidity field remains unchanged, the difference between the observed PWV and the model PWV is proportionally distributed to each layer of the model in the column:
q mod i + 1 ( k ) = q mod i P W o b s P W mod i
To prevent the model layer from supersaturating, if q mod i + 1 ( k ) is greater than the saturated water vapor mixing ratio, the value is taken as the saturated water vapor mixing ratio, and the excess water vapor is distributed to the adjacent layers. This redistribution process is iterated to obtain the final pseudo-water-vapor mixing ratio observation profile.

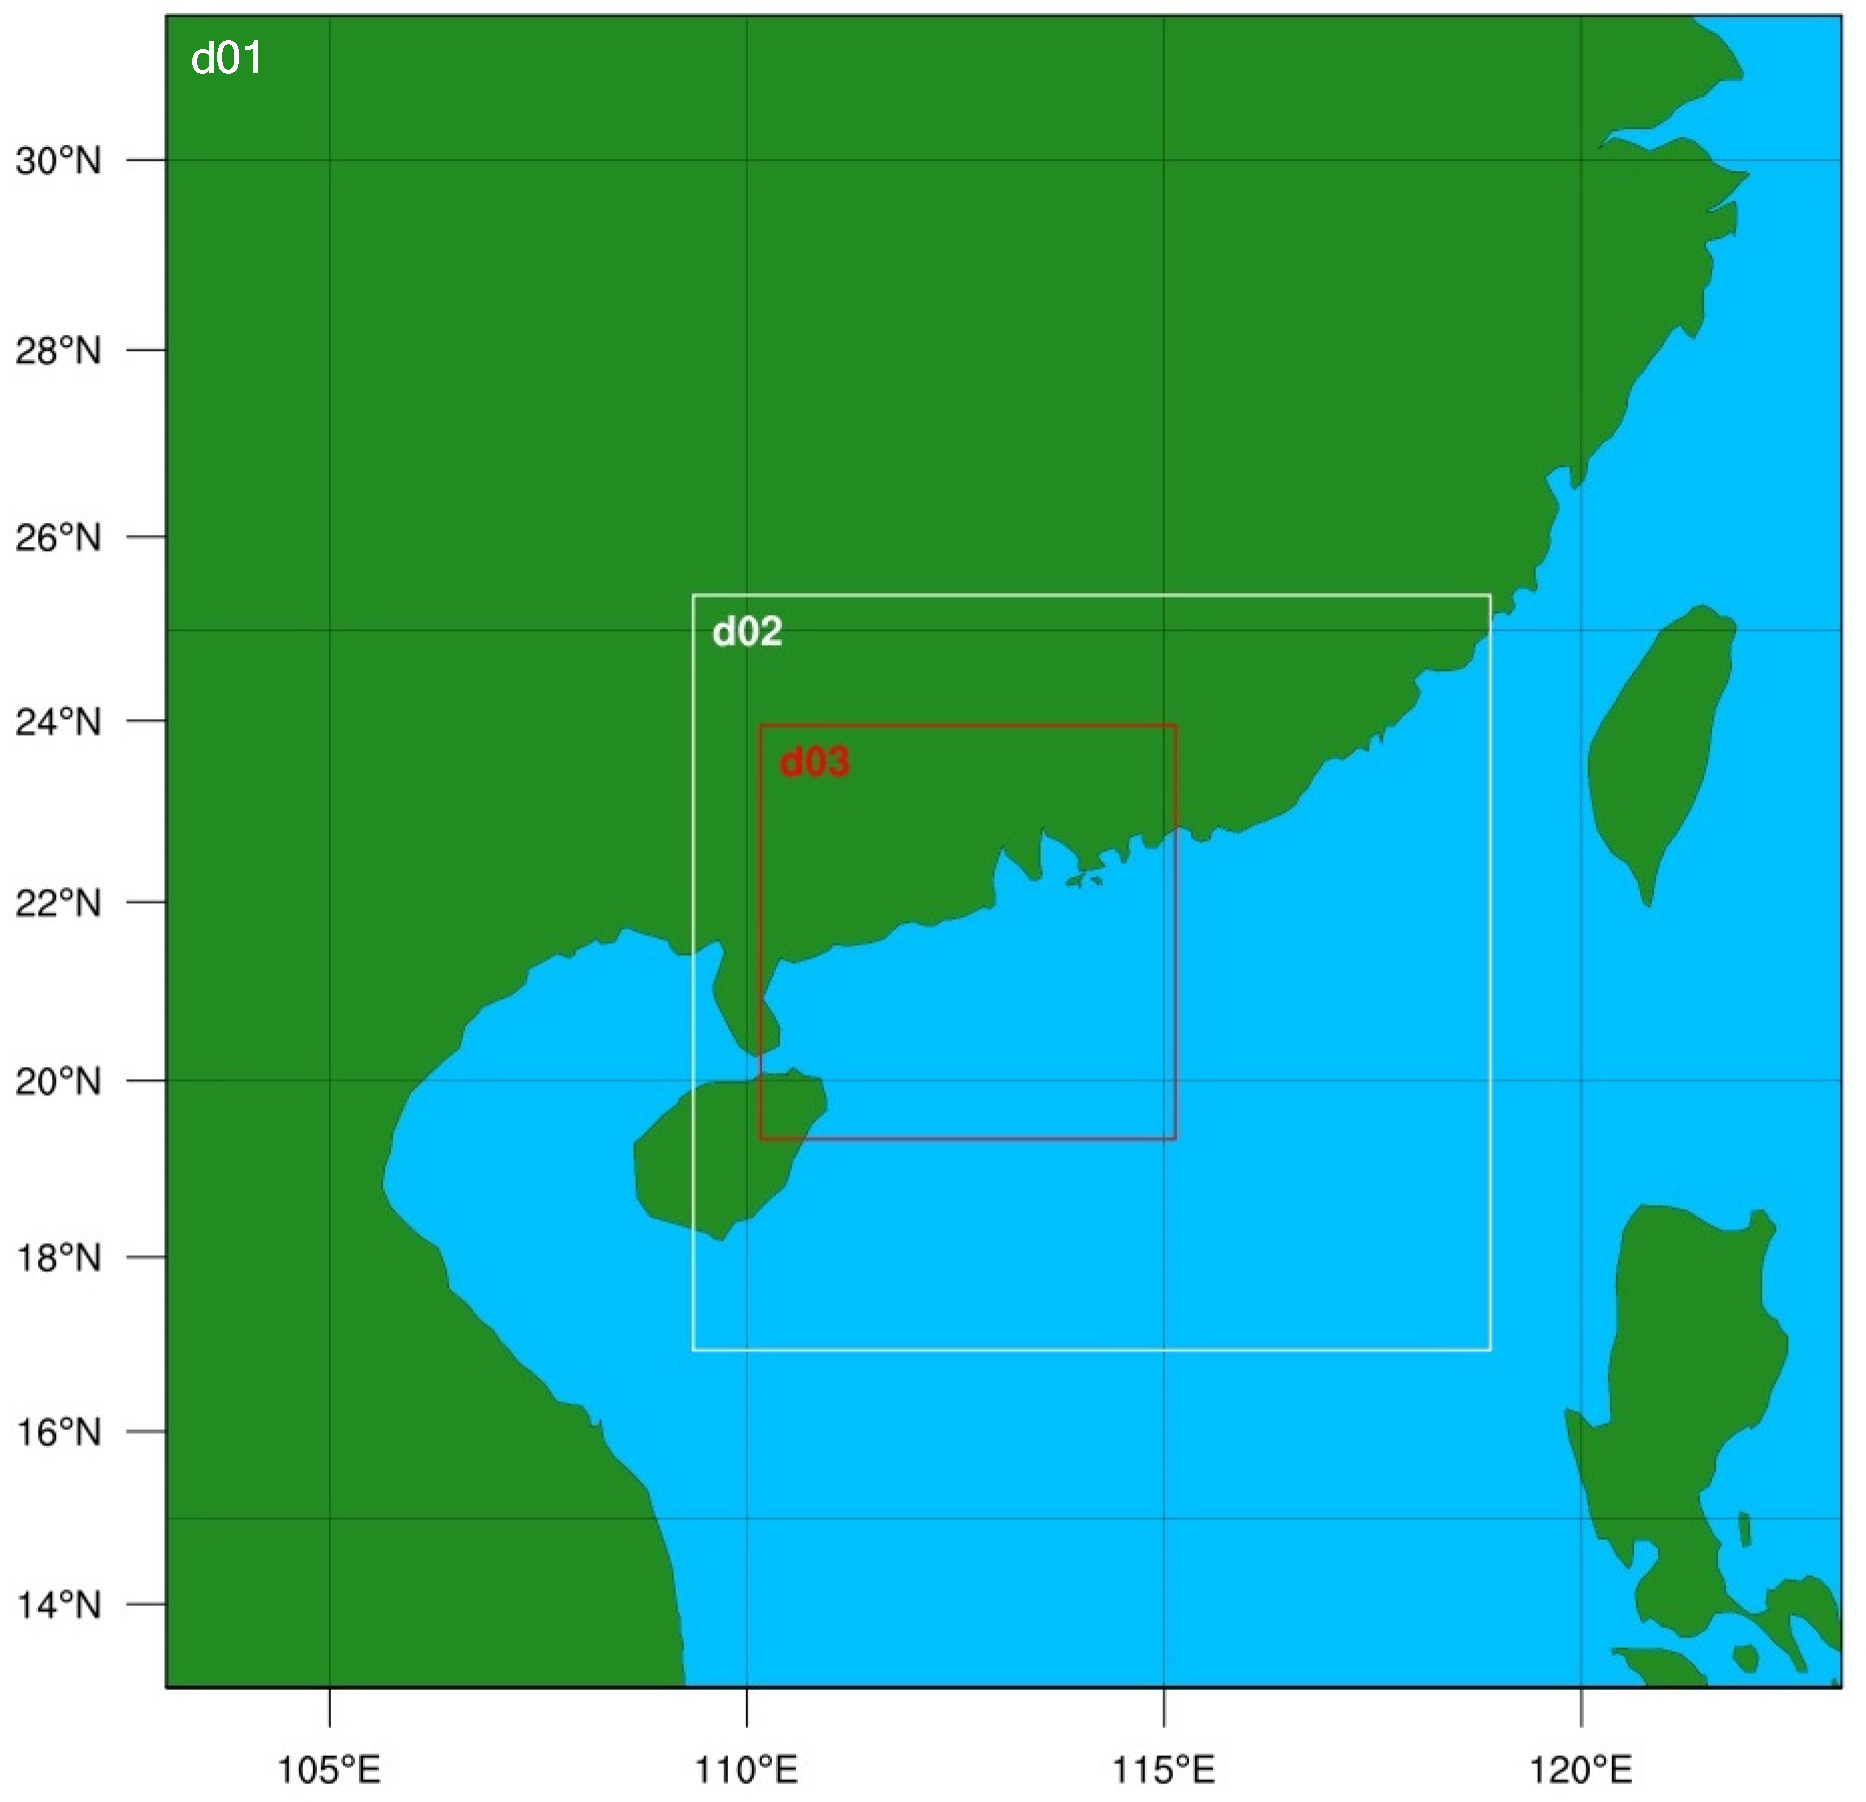
2.2. Case Description and Experiment Design

An intense typhoon, “Mangkhut”, that occurred in 2018 was selected for demonstrating the GNSS PWV data assimilation experiments. Typhoon “Mangkhut” was generated over the ocean surface of the Northwest Pacific at 12:00 UTC on 7 September 2018. It made landfall at Taishan City, Guangdong Province, China, at 09:00 UTC on 16 September 2018. When “Mangkhut” made landfall, the maximum wind force near the center reached 45 m/s, and the center pressure was 955 hPa. From 16 to 18 September 2018, strong winds with a wind force of 28–45 m/s occurred in the Pearl River Delta of Guangdong, with a heavy rainfall of 300–497 mm, causing significant economic losses.
The model domain is set up for simulating “Mangkhut” from 09:00 UTC on 15 August 2018 to 21:00 UTC on 16 August 2018, spanning the period of approaching southern China and making landfall. The center of the simulation area is at 22.57°N and 113.08°E. The model uses three-level nested grids, with 34 vertically stretched levels. The number of grid points of the three domains are 125 × 125, 178 × 169, 277 × 277, and the grid intervals are 9, 3, and 1 km, respectively (Figure 1). In this study, the employed model microphysical scheme is WSM6 [39], the radiation scheme is RRTMG [40], the cumulus parameterization scheme is Grell–Freitas [41], the land surface process scheme is Noah [42], the boundary layer scheme is YSU [42], and the near-surface layer scheme is Monin–Obukhov [43] (Table 1). The lateral boundary conditions and initial fields are constructed using NCEP/GFS (National Centers for Environmental Prediction/Global Forecast System) forecasts with a horizontal resolution of 0.5° × 0.5° and a time interval of 3 h.
Three simulation experiments were designed, and all were run for 36 h. The first one is the control experiment (CTRL), which does not assimilate any data; the second (GNSS) assimilates the observed PWV data for the whole simulation period; and the third one (FCST) assimilates the observed PWV data during the 0–24 h, and then continues a 12 h forecast. Table 2 gives the time information of the experiments.

3. Data Used in the Experiments

Figure 2 shows the distribution of the GNSS and the national AWS stations available in the model domain. Measurements of these GNSS stations were used to calculate the hourly PWV over the stations, and then the PWV was assimilated into WRF-RTFDDA. The AWSs report air pressure, temperature, wind speed, and hourly rainfall, which were used to verify the simulation results of the modeling experiments. The time interval of GNSS and AWS data is 1 h, and the data used in this study is from 09:00 UTC on 15 September 2018 to 21:00 UTC on 16 September 2018. All the GNSS and AWS data can be obtained from the China Meteorological Administration (CMA). It should be noted that real-time GNSS and AWS data are processed in the CMA and many global weather centers. The data assimilation algorithm discussed in this paper supports both real-time data assimilation and historical case studies.
The GNSS data signal source is the GPS constellation of the United States. The GAMIT (GPS Analysis at Massachusetts Institute of Technology) software is used to process GNSS data. With GAMIT, the zenith tropospheric delay is calculated from the GNSS observation. Then, the hydrostatic delay is subtracted from the zenith tropospheric delay to obtain the wet delay. Finally, PWV is obtained according to the conversion relationship between PWV and the wet delay [44].

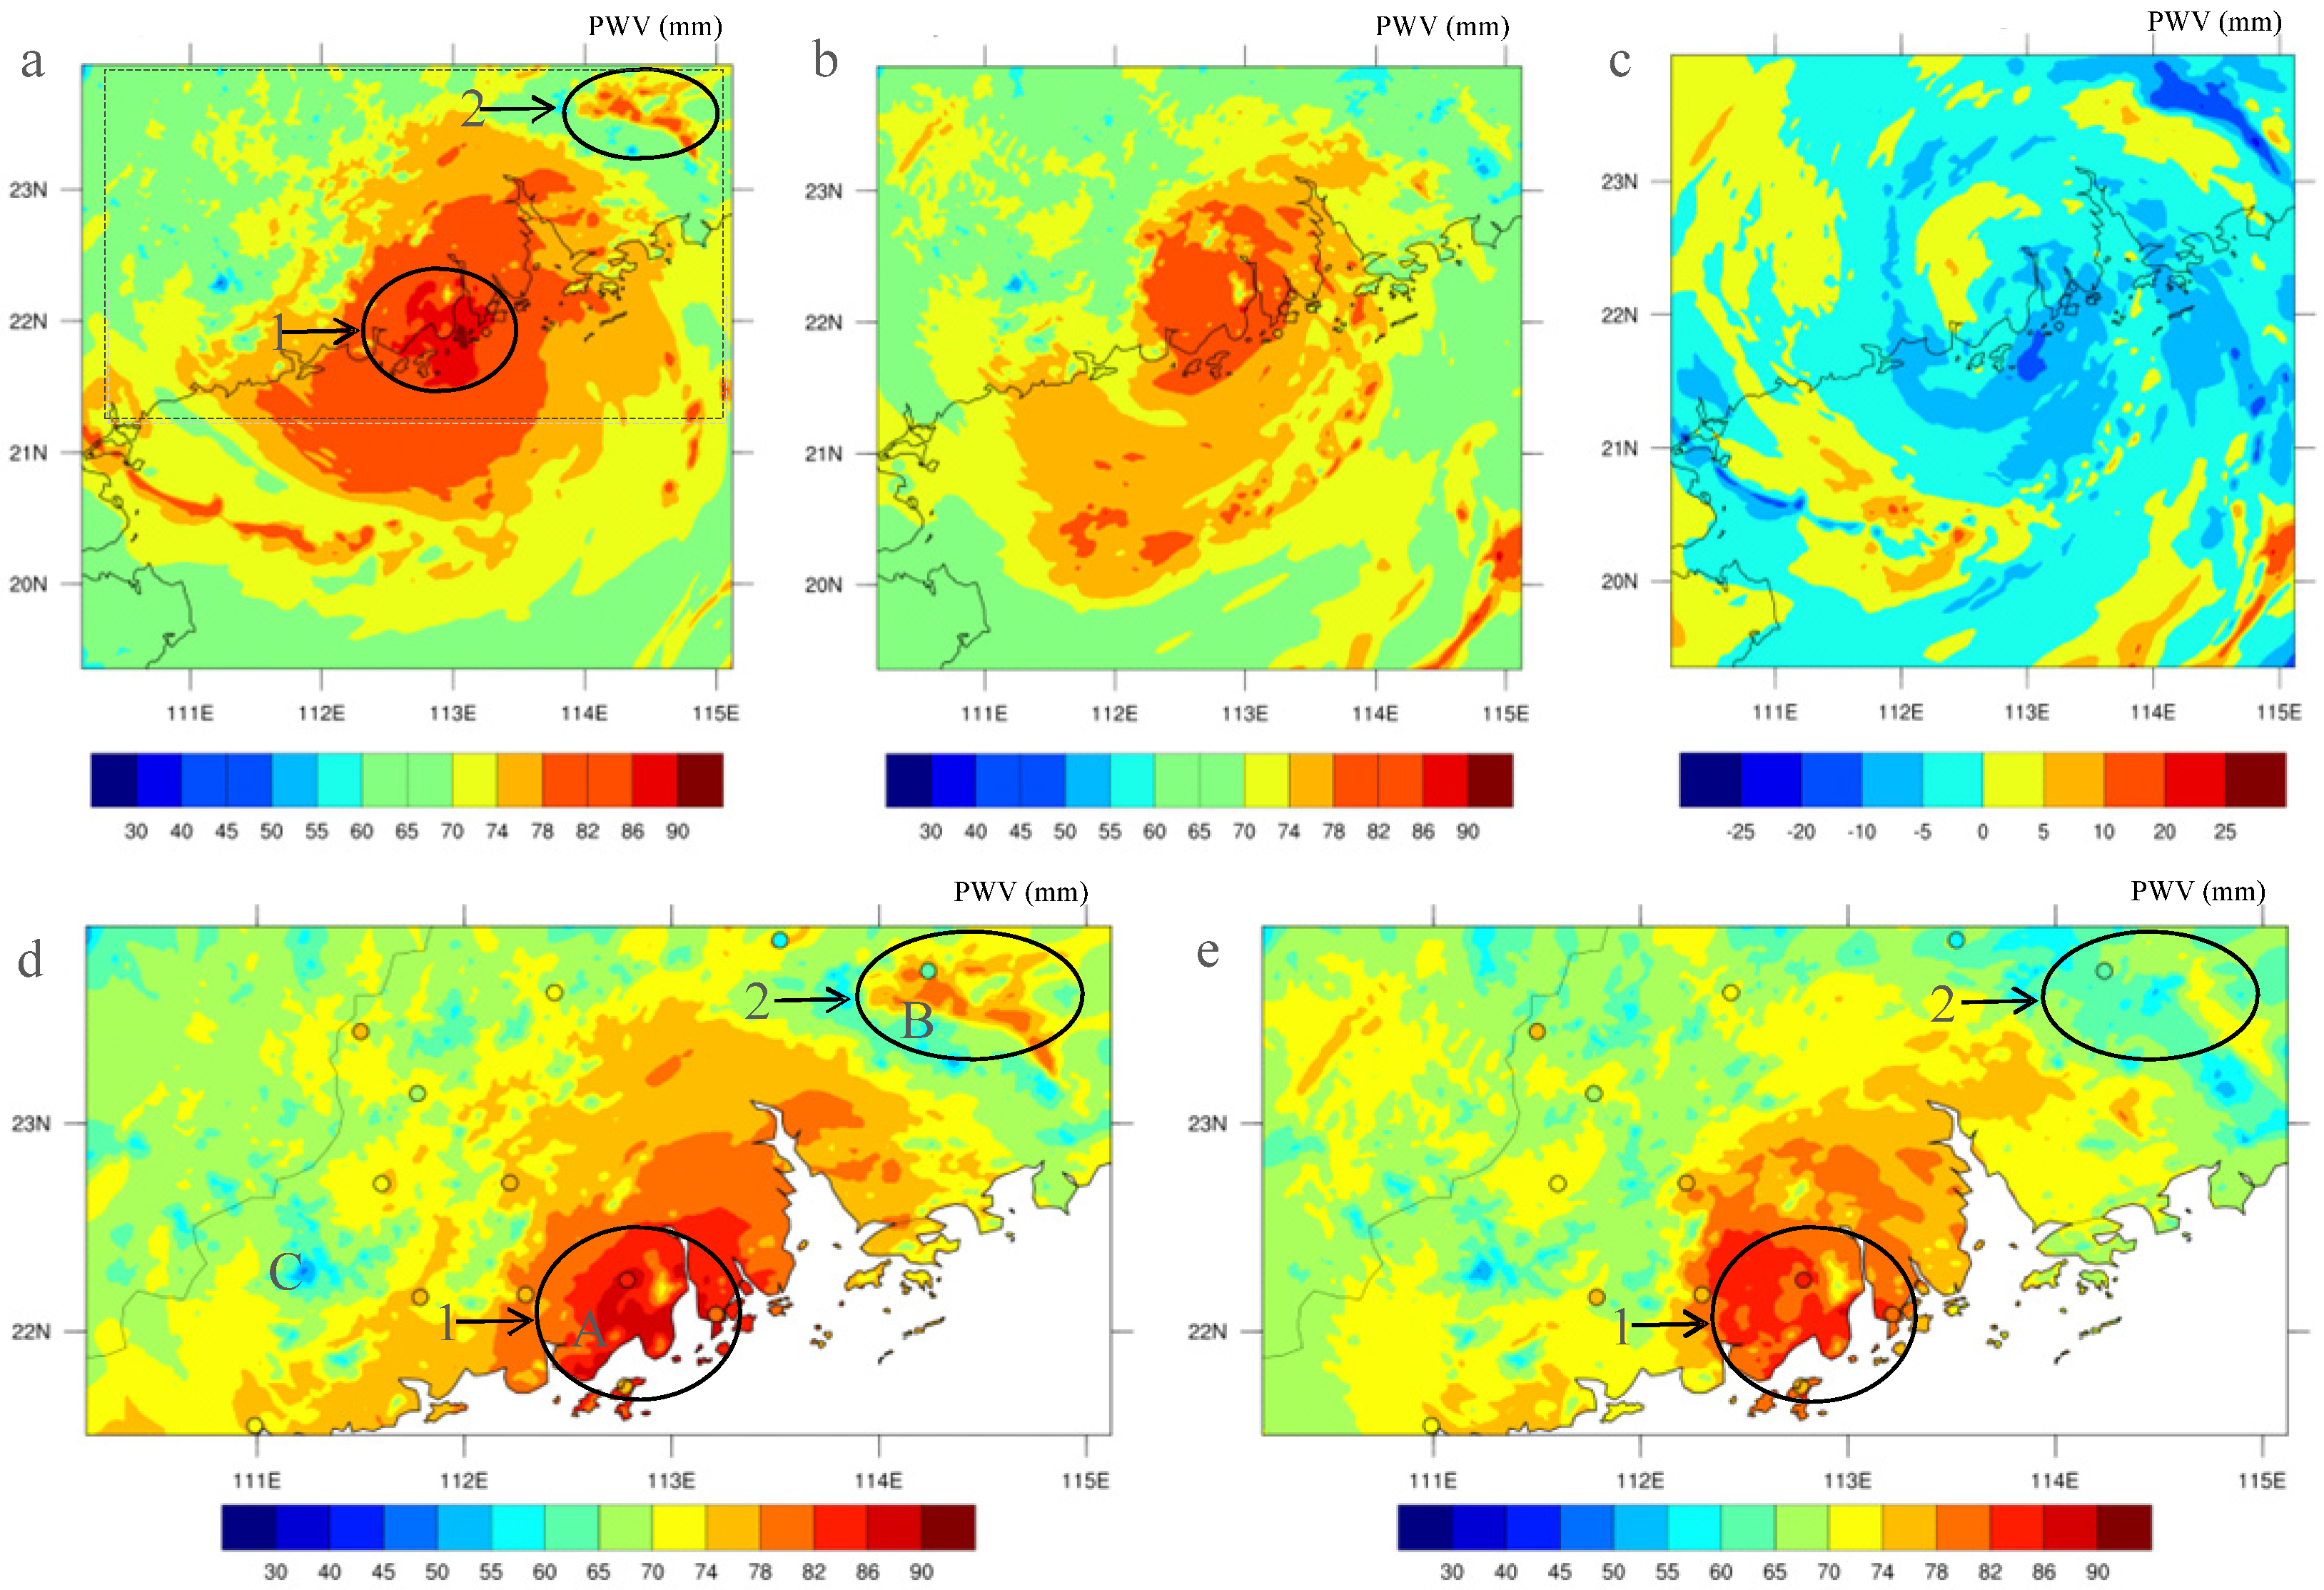
4. Effect of GNSS PWV Assimilation on the Water Vapor

We first examine the impact of GNSS PWV data assimilation on the water vapor in the inner-core region of the typhoon “Mangkhut”. Figure 3a,b shows the PWV of the CTRL and the GNSS experiments at 09:00 UTC on 16 September 2018, while “Mangkhut” made landfall in Guangdong Province, China.
The model PWV at the core region of the typhoon of the GNSS experiment is lower than that at the CTRL experiment, and the model PWV in the GNSS experiment is more consistent with the observed PWV. A more detailed comparison of the model PWV of CTRL and GNSS experiments with the observed PWV is plotted for a zoomed-in inner-core region (Figure 3d,e). Two regions in Figure 3 are worthy of special note: one is the inner-core area (Region 1) and the other is Region 2 located in the northeastern outside. The verification results show that the GNSS experiment significantly mitigated the overestimation of the model PWV of the CTRL experiment at the GNSS stations in both regions. With the GNSS PWV data assimilation, the overestimated model PWV is reduced by 5–15 mm and 10–20 mm for Regions 1 and 2, respectively.
The bias, root mean squared error (RMSE), and correlation coefficient of the model PWV of the CTRL and GNSS experiments against the observed PWV in the domain d03 are calculated and given in Table 3. For computing the verification statistics, the model results were interpolated to the GNSS stations. Table 3 shows that before the typhoon landfall (at 03:00 UTC, 16 September 2018), the CTRL experiment underestimated the PWV by 1.42 mm, and the GNSS experiment reduced the error to −0.44 mm. After the typhoon landfall, the PWV in the typhoon’s inner core was high over land. The CTRL experiment overestimated the PWV significantly, and the GNSS experiment effectively suppressed this positive bias. Assimilating the GNSS PWV data also obviously reduced the RMSE and increased the correlation coefficient before and after landfall of the typhoon.
To analyze the effect of the GNSS PWV data assimilation on the vertical water vapor structure, we compared the vertical profiles of the water vapor mixing ratios at Points A, B, and C, representing Regions 1 and 2 and a precipitation-free area, respectively. It can be seen from Figure 4 that after assimilating the GNSS PWV data, at Points A and B, the water vapor in most layers is lower than that in the CTRL experiment and the largest reduction corresponds to the maximum water vapor layer. The reduction of the water vapor in the columns at A and B is consistent with the correction of the positive bias of the PWV by the GNSS PWV data assimilation (cf. Figure 3). In contrast, at Point C, the water vapor in most layers increases after assimilation of the GNSS PWV, corresponding to the positive PWV innovation at the point.

5. Impact on the Typhoon Track, Intensity, and Precipitation
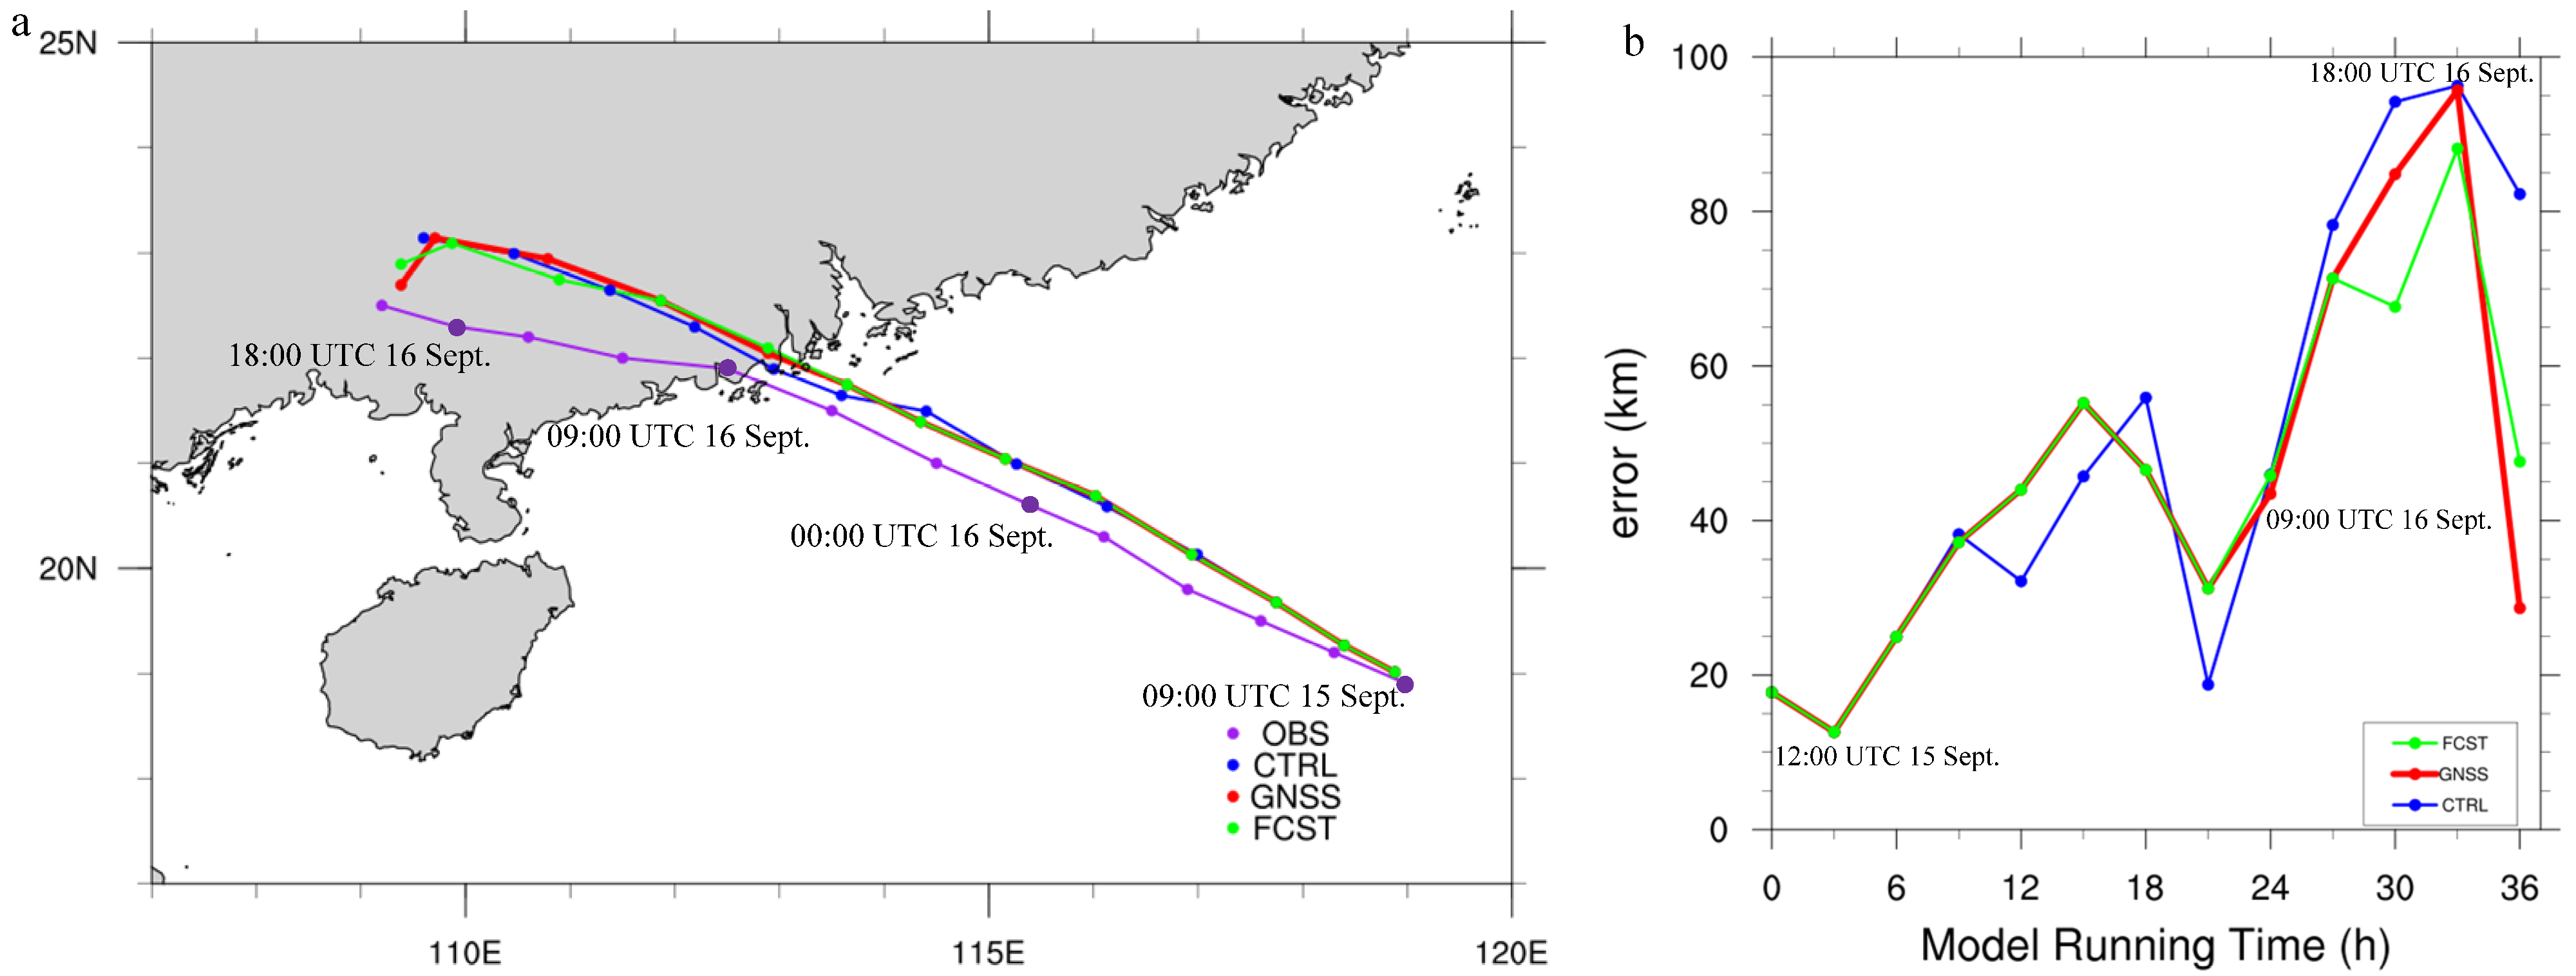
5.1. Typhoon Track

The point with the lowest sea level pressure is typically used to determine the typhoon center. In this work, in order to mitigate the positioning error of the typhoon center caused by the coarse model grid interval, the typhoon center position is determined by the spline interpolation using the lowest-point sea-level pressure and those at the four surrounding grid points. The model domain d02 was used to determine the center of the typhoon.
Figure 5a compares the typhoon tracks simulated by the three experiments. The time period is from 09:00 UTC on 15 September 2018 to 21:00 UTC on 16 September 2018, and the time interval is 3 h. The typhoon made landfall at 09:00 UTC on 16 September 2018 (model running time = 24 h). Additionally, the observed typhoon track (OBS) (i.e., the “best track”, dataset of the typhoon is obtained from the Shanghai Typhoon Research Institute of the China Meteorological Administration. The uncertainty of the “best track” dataset is within 5.5 km, and the uncertainty of the model (domain d02) is less than 3 km. All three experiments simulated the observed typhoon track well. Nevertheless, assimilating the GNSS PWV results in evident improvements to the simulation of the typhoon track after its landfall. The FCST experiment started the forecast from the landfall time, at 09:00 UTC on 16 September 2018. Both GNSS and FCST assimilate the same data before 09:00 UTC on 16 September 2018. Therefore, the path of the typhoon in the GNSS and FCST experiments are the same by this time. Because of the momentum of the typhoon development, the path of the typhoon in the GNSS and FCST experiments started to diverge very slowly after the GNSS PWV data assimilation stopped at 09:00 UTC on 16 September 2018 in the FCST experiment and kept very close within the first 3 h. Thereafter, the path of the typhoon in the GNSS and FCST experiments became significantly different.
Figure 5b compares the typhoon track errors during the simulation period. Assimilating the GNSS PWV had little effect on the simulation track about 9 h before the typhoon landfall. The effect of assimilating the GNSS PWV became evident at 09:00 UTC on 16 September 2018 (model running time = 24 h). Assimilating the GNSS PWV was able to reduce the track error by nearly 65% at 12 h after the landfall (at 21:00 UTC, 16 September 2018). The reason for the track correction that occurred in the late stage of the modeling is that the GNSS stations are generally located over inland regions.

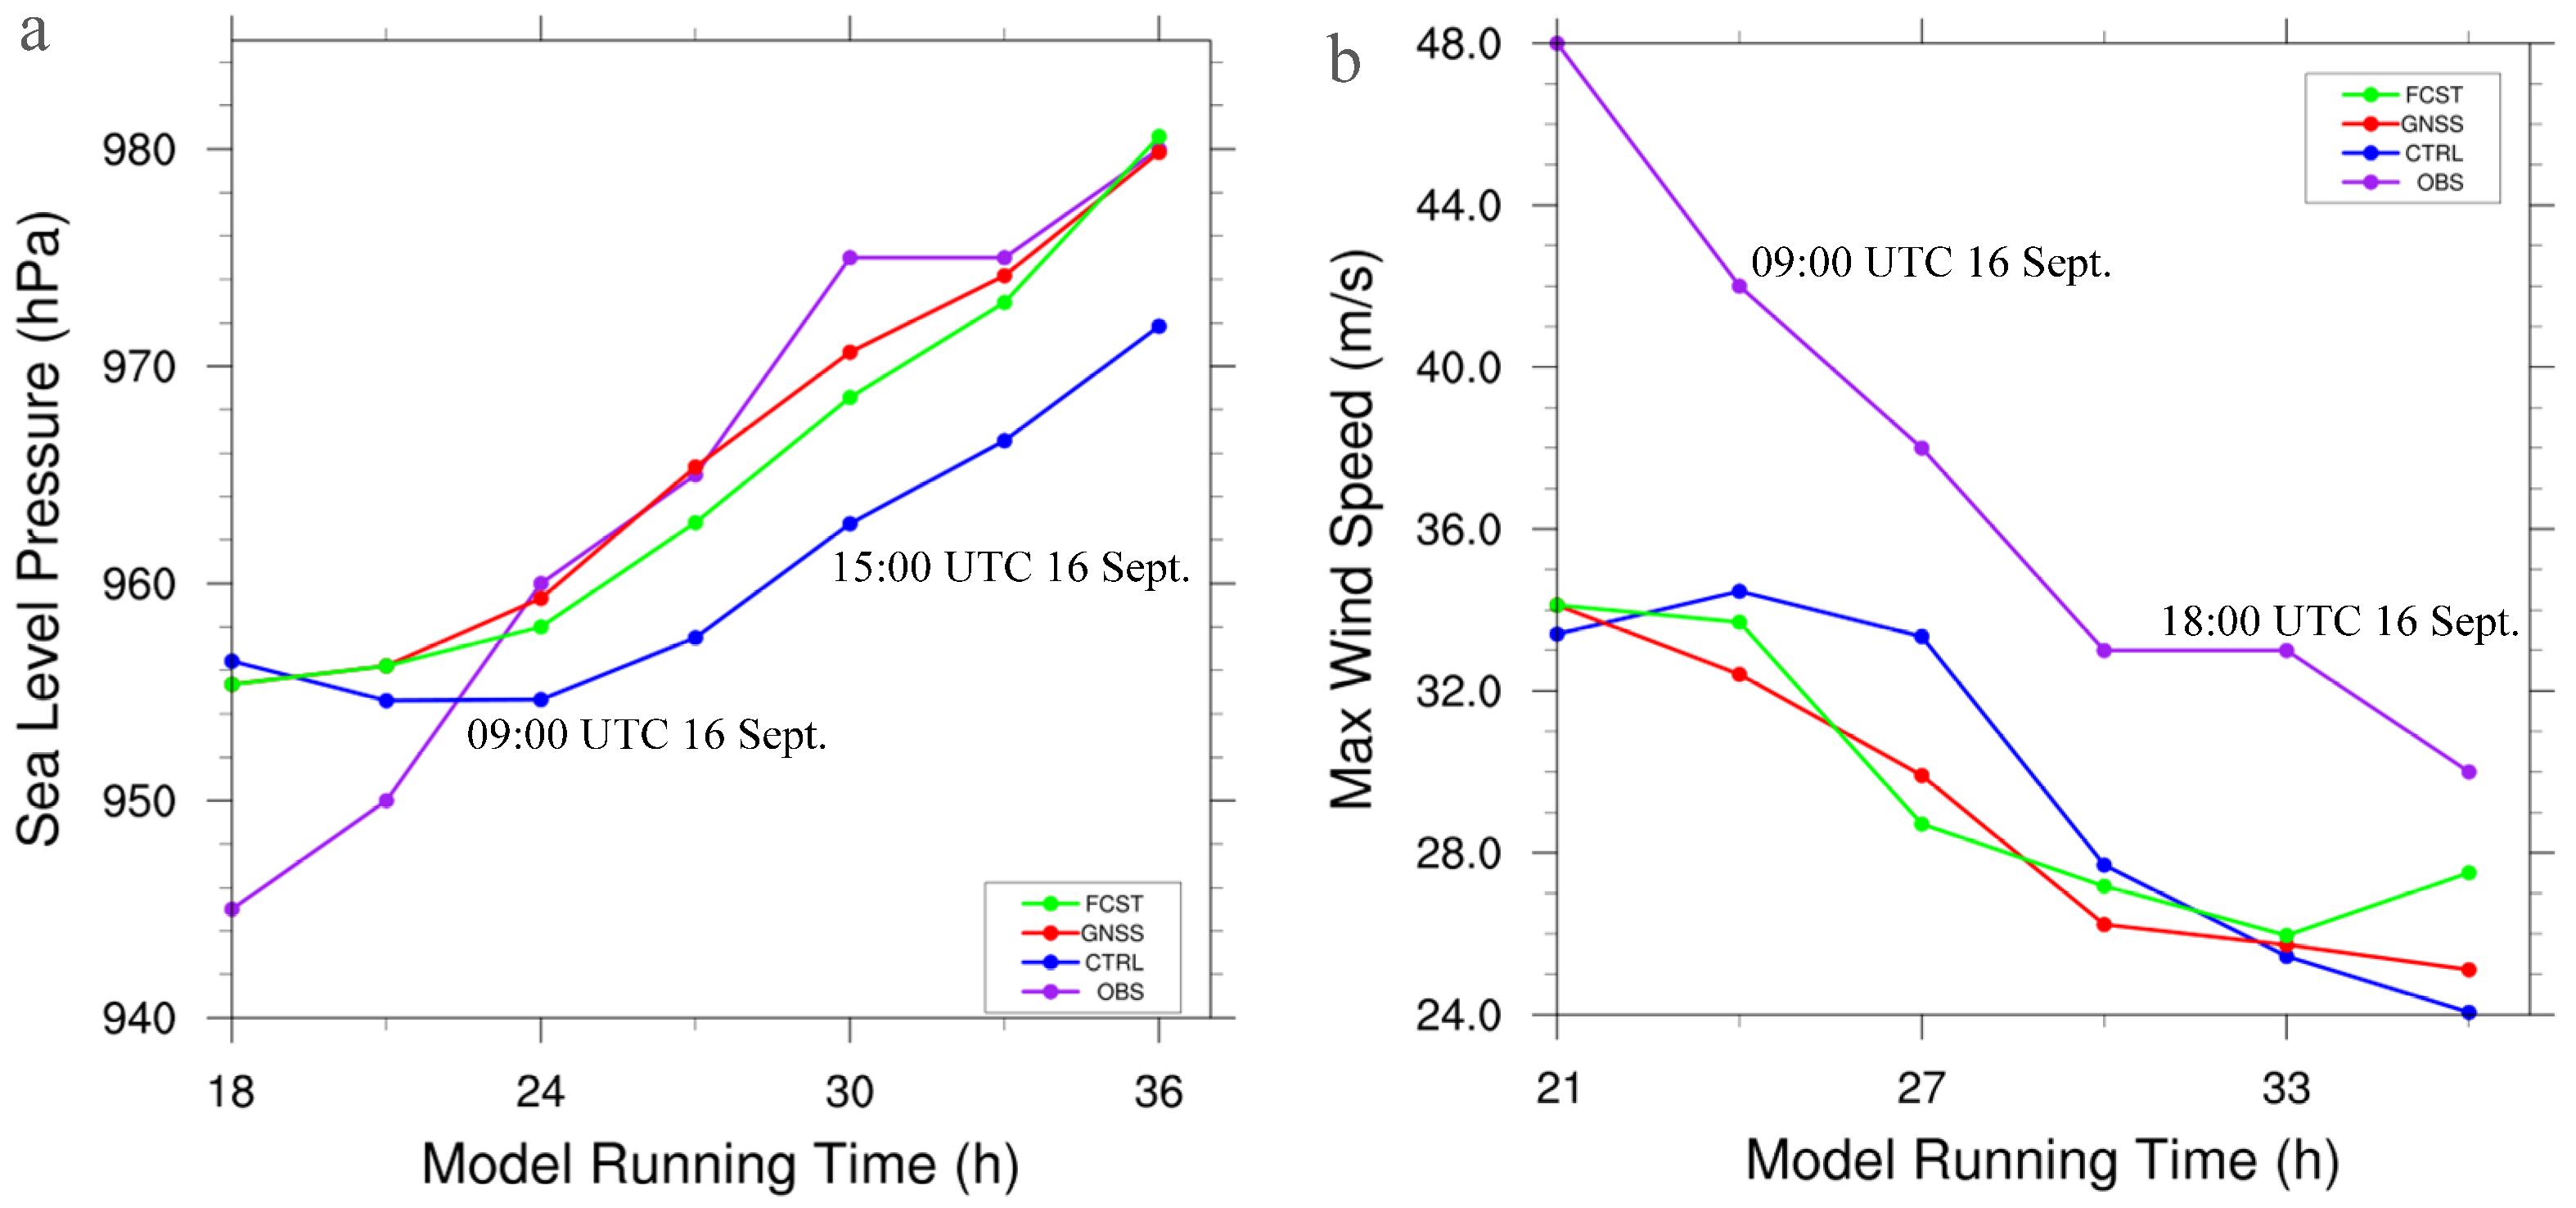
5.2. Typhoon Intensity

Figure 6 compares the typhoon central pressure and maximum wind simulated by three experiments with the observations. The initial model running time is 09:00 UTC on 15 September 2018. Before the typhoon landfall, the model simulations underestimated the typhoon intensity, and after its landfall, the simulated typhoon intensity weakened at a slow rate. Assimilating the GNSS PWV data improves the model simulation of the central low pressure of the typhoon. The central pressure of the typhoon simulated by both the GNSS and FCST experiments is close to the observed at and after the typhoon’s landfall, which is evidently better than the CTRL experiment. The FCST experiment started forecasting at the time of the typhoon landfall at 09:00 UTC on 16 September 2018 (i.e., after 24 h data assimilation). Assimilating the GNSS PWV improved the model states at the starting time of the forecast and helped the model prediction. Thus, during the first 9 h forecast (24–33 h), although the forecast was gradually degraded from the GNSS experiment, it still outperformed the CTRL experiment significantly.
All experiments underestimated the maximum wind speed (Figure 6b). Assimilating GNSS PWV data became worse within 6 h after the typhoon landfall. The GNSS and FCST experiments became better than the CTRL experiments after a 30 h forecast. In general, the impact of GNSS PWV assimilation on wind speed was not promising. The reason may be related to the limited model resolution, but it is certainly worthy of further investigation.

5.3. Typhoon Precipitation

Heavy precipitation is an important feature of typhoons. Here, we compare the model 1 h accumulated precipitation of the CTRL and GNSS experiments at 07:00 UTC on 16 September 2018 with those observed at the AWS stations. Assimilation of the GNSS PWV resulted in quite large changes of the inner-core rainbands (Figure 7). For the purpose of illustrating the impact of the GNSS PWV assimilation, we selected five subareas in the inner core to compare the model results with the AWS station observations.
In Region 1 (Figure 7a,d,e), the observed precipitation exceeded 22 mm. The CTRL experiment only simulated 12–18 mm. The GNSS experiment added more precipitation in the region, making it closer to the observed. The observed precipitation in Region 2 was relatively low, where the CTRL experiment overestimated it, and assimilating the GNSS PWV achieved a better estimation. In Region 3, the observed precipitation exceeded 20 mm. The CTRL experiment seriously underestimated the amount, with only 4–8 mm. Assimilating the GNSS PWV increased the precipitation significantly. For Region 4, the observed precipitation was relatively low, only 4–8 mm. Assimilating the GNSS PWV was able to correct the large overprediction by CTRL, from over 22 mm to 4–14 mm. Finally, in Region 5, the observed precipitation was low, but both CTRL and GNSS simulated relatively high amounts. The assimilation of the GNSS PWV did not bring benefit to this region.
In order to quantitatively evaluate the impact of assimilating the GNSS PWV on the model precipitation simulation, threat scores (TSs) of the model precipitation were computed and are shown in Figure 8. TS is an objective verification method to reflect the model skill on quantitative precipitation forecasts, which is also called the critical success index [45]. When calculating TS for precipitation, the formula is as follows for a given area and an intensity grade:
T S = N A N A + N B + N C
where NA is the number of stations with actual precipitation and predicted precipitation, NB is the number of stations with predicted precipitation and no actual precipitation, and NC is the number of stations with actual precipitation and no predicted precipitation. The ideal TS is 1, and the value range is 0–1. The larger the value, the better score, indicating that the model has higher accuracy in precipitation prediction.
Like Wang et al. [46], we divide the 1 h accumulated precipitation into five grades (bins): light rain (0–2 mm), moderate rain (2–4 mm), heavy rain A (4–8 mm), heavy rain B (8–20 mm), and heavy rain C (20–45 mm). The TS for each grade is plotted in Figure 8. Figure 8 shows that, except for a slight degrading for moderate rain, the TSs of the GNSS experiment are significantly higher than those of the CTRL experiment. This is also consistent with the results of assimilating the GNSS PWV for precipitation simulation in each region in Figure 7. Both Figure 7 and Figure 8 indicate that assimilating the GNSS PWV improves the model precipitation simulation.

6. Conclusions

Ground-based GNSS observations provide high-accuracy and high-frequency data. Assimilation of the weather-related variables estimated from GNSS observations into numerical weather prediction models is an important means to improve the forecast accuracy of the models. In this paper, the water vapor mixing ratio in the vertical layers of the WRF model is inverted from the PWV estimated from GNSS observations, and then assimilated into RTFDDA based on WRF. Typhoon “Mangkhut” in 2018 was selected to test the data assimilation algorithm and demonstrate the effect of the data assimilation on the analysis and forecasting of the typhoon. The following conclusions can be drawn from this study:
(1)
The water vapor profile retrieving procedure and nudging-based RTFDDA are capable of adequately assimilating GNSS PWV data into the WRF modeling system to improve the water vapor fields of Typhoon “Mangkhut”, especially in its inner-core region. In comparison with the CTRL experiment (no data assimilation), the GNSS PWV data assimilation can correct regions with either overestimation or underestimation of water vapor, reducing bias by 1–2 mm and improving the correlation coefficient by 0.1–0.3.
(2)
Assimilation of GNSS PWV data improves the simulation and prediction of the typhoon track, central pressures, and surface precipitation. The typhoon track simulation and prediction only occurred after the typhoon moved close the coast and after landfall because most GNSS stations are located inland. Assimilating GNSS PWV data corrected 5–10 hPa bias of the central pressure of the typhoon at and after its landfall from the CTRL run. Furthermore, assimilating the GNSS PWV data improved majority of the inner-core rainbands and their precipitation intensity. The TSs of the precipitation simulation and forecast in the inner-core region were improved by 0.04–0.09.
The present research shows that the assimilation of GNSS PWV data is beneficial for improving the simulation and forecasting of the moisture structures, tracks, and intensity of typhoons. It is noted that at present GNSS stations are mainly available over the mainland. There are few or no stations over oceans where typhoons develop and move. It is recommended that more GNSS stations be established on islands or floating platforms over the remote oceans where typhoons are active. Setting up more stations on the islands about a few hundreds of kilometers from shore may help improve the prediction of landfall in terms of their tracks, intensity, and precipitation.
We pointed out that the present work was mainly focused on the landfall time of the typhoon. After the typhoon landfall, the precipitation process of the system is largely affected by land–atmosphere interaction due to the existence of a very complex terrain in the study region, and the impact of the GNSS PWV data assimilation becomes less effective. We plan to investigate how the GNSS PWV could help to improve the model forecast of the typhoon as it moves deep inland in the future. Interaction between data assimilation and physical parameterization is extremely complex and important. We wish to continue this study to investigate the impact of different microphysical schemes and PBL schemes on the GNSS PWV assimilation in our next step. Finally, in this work, we only tested GNSS PWV data assimilation. It is highly desired to examine the contribution of GNSS PWV data when combined with radiosondes, satellite remote sensing, GNSS occultation, ocean buoy data, and so forth to improve typhoon simulation and forecasting.

Author Contributions

Conceptualization, H.W. and Y.L. (Yubao Liu); investigation, H.W.; methodology, Y.L. (Yubao Liu) and H.W.; software, H.W.; data curation, H.W., Y.L. (Yuwei Liu), H.L., H.H., J.L., and M.T.; writing—original draft preparation, H.W.; writing—review and editing, Y.L. (Yubao Liu), Yuewei L., and Y.C.; funding acquisition, Y.L. (Yubao Liu) and Y.C. All authors have read and agreed to the published version of the manuscript.

Funding

This work was supported by the Northwestern Region’s Artificial Weather Modification Capacity Building Project (ZQC-19176), the international (regional) cooperation and exchange project of the National Natural Science Foundation of China (41961144015), and the Youth Science Foundation Project (41804023).

Institutional Review Board Statement

Not applicable.

Informed Consent Statement

Not applicable.

Data Availability Statement

The GNSS and automatic weather station data can be accessed from the China Meteorological Administration (CMA).

Acknowledgments

The authors thank the China Scholarship Council for funding the first author’s research visit to the United States to conduct this research (Grant No. 201705330015) and the National Center for Atmospheric Research (NCAR) for working on the RTFDDA modeling system and providing the computing resource for the modeling computation.

Conflicts of Interest

The authors declare no conflict of interest.

References

  1. Tregoning, P.; Boers, R.; O’Brien, D.; Hendy, M. Accuracy of absolute precipitable water vapor estimates from GPS observations. J. Geophys. Res. Atmos. 1998, 103, 28701–28710. [Google Scholar] [CrossRef]
  2. Gutman, S.I.; Benjamin, S.G. The Role of Ground-Based GPS Meteorological Observations in Numerical Weather Prediction. GPS Solut. 2001, 4, 16–24. [Google Scholar] [CrossRef]
  3. Shi, C.; Wang, H.; Cao, Y.; Zhang, E.; Liang, H.; Fu, Z. Analysis on Performance of Water Vapor Detection Based on BeiDou Satellite. Geomat. Inf. Sci. Wuhan Univ. 2016, 41, 285–289. [Google Scholar] [CrossRef]
  4. Kuo, Y.-H.; Guo, Y.-R.; Westwater, E.R. Assimilation of Precipitable Water Measurements into a Mesoscale Numerical Model. Mon. Weather Rev. 1993, 121, 1215–1238. [Google Scholar] [CrossRef] [Green Version]
  5. Cucurull, L.; Vandenberghe, F.; Barker, D.; Vilaclara, E.; Rius, A. Three-Dimensional Variational Data Assimilation of Ground-Based GPS ZTD and Meteorological Observations during the 14 December 2001 Storm Event over the Western Mediterranean Sea. Mon. Weather Rev. 2004, 132, 749–763. [Google Scholar] [CrossRef] [Green Version]
  6. Kuo, Y.-H.; Zou, X.; Guo, Y.-R. Variational Assimilation of Precipitable Water Using a Nonhydrostatic Mesoscale Adjoint Model. Part I: Moisture Retrieval and Sensitivity Experiments. Mon. Weather Rev. 1996, 124, 122–147. [Google Scholar] [CrossRef] [Green Version]
  7. Guo, Y.-R.; Kuo, Y.-H.; Dudhia, J.; Parsons, D.; Rocken, C. Four-Dimensional Variational Data Assimilation of Heterogeneous Mesoscale Observations for a Strong Convective Case. Mon. Weather Rev. 2000, 128, 619–643. [Google Scholar] [CrossRef]
  8. De Pondeca, M.S.F.V.; Zou, X. A Case Study of the Variational Assimilation of GPS Zenith Delay Observations into a Mesoscale Model. J. Appl. Meteorol. 2001, 40, 1559–1576. [Google Scholar] [CrossRef]
  9. Ha, S.-Y.; Kuo, Y.-H.; Guo, Y.-R.; Lim, G.-H. Variational Assimilation of Slant-Path Wet Delay Measurements from a Hypothetical Ground-Based GPS Network. Part I: Comparison with Precipitable Water Assimilation. Mon. Weather Rev. 2003, 131, 2635–2655. [Google Scholar] [CrossRef] [Green Version]
  10. Grell, G.A.; Dudhia, J.; Stauffer, D.R. Description of the Fifth-Generation Penn State/NCAR Mesoscale Model (MM5); Technical Note NCAR/TN-398+STR; National Center for Atmospheric Research (NCAR): Boulder, CO, USA, 1994. [Google Scholar] [CrossRef]
  11. Smith, T.L.; Benjamin, S.G.; Schwartz, B.E.; Gutman, S.I. Using GPS-IPW in a 4-D data assimilation system. Earth Planets Space 2000, 52, 921–926. [Google Scholar] [CrossRef] [Green Version]
  12. Guo, Y.R.; Kusaka, H.; Barker, D.M.; Kuo, Y.H.; Crook, A. Impact of Ground-based GPS PW and MM5-3DVar Background Error Statistics on Forecast of a Convective Case. SOLA 2005, 1, 73–76. [Google Scholar] [CrossRef] [Green Version]
  13. Zus, F.; Grzeschik, M.; Bauer, H.; Wulfmeyer, V.; Dick, G.; Bender, M. Development and optimization of the IPM MM5 GPS slant path 4DVAR system. Meteorol. Z. 2008, 17, 867–885. [Google Scholar] [CrossRef]
  14. Kawabata, T.; Shoji, Y.; Seko, H.; Saito, K. A Numerical Study on a Mesoscale Convective System over a Subtropical Island with 4D-Var Assimilation of GPS Slant Total Delays. J. Meteorol. Soc. Japan. Ser. II 2013, 91, 705–721. [Google Scholar] [CrossRef] [Green Version]
  15. Järvinen, H.; Eresmaa, R.; Vedel, H.; Salonen, K.; Niemelä, S.; de Vries, J. A variational data assimilation system for ground-based GPS slant delays. Q. J. R. Meteorol. Soc. 2007, 133, 969–980. [Google Scholar] [CrossRef]
  16. Vedel, H.; Huang, X.-Y. Impact of Ground Based GPS Data on Numerical Weather Prediction. J. Meteorol. Soc. Jpn. 2004, 82, 459–472. [Google Scholar] [CrossRef] [Green Version]
  17. Memmo, A.; Fionda, E.; Paolucci, T.; Cimini, D.; Ferretti, R.; Bonafoni, S.; Ciotti, P. Comparison of MM5 integrated water vapor with microwave radiometer, GPS, and radiosonde measurements. IEEE Trans. Geosci. Remote Sens. 2005, 43, 1050–1058. [Google Scholar] [CrossRef]
  18. Benjamin, S.; Jamison, B.; Moninger, W.; Sahm, S.; Schwartz, B.; Schlatter, T. Relative Short-Range Forecast Impact from Aircraft, Profiler, Radiosonde, VAD, GPS-PW, METAR, and Mesonet Observations via the RUC Hourly Assimilation Cycle. Mon. Weather Rev. 2010, 138, 1319–1343. [Google Scholar] [CrossRef]
  19. Lorenc, A.; Bell, R.S.; Macpherson, B. The Meteorological Office analysis correction data assimilation scheme. Q. J. R. Meteorol. Soc. 1991, 117, 59–89. [Google Scholar] [CrossRef]
  20. Wang, J. A Nowcast/Forecast System for Coastal Ocean Circulation Using Simple Nudging Data Assimilation. J. Atmos. Ocean. Technol. 2001, 18, 1037–1047. [Google Scholar] [CrossRef]
  21. Yap, K.-S. Impact of a Newtonian Assimilation and Physical Initialization on the Initialization and Prediction by a Tropical Mesoscale Model. Mon. Weather Rev. 1995, 123, 833–861. [Google Scholar] [CrossRef] [Green Version]
  22. Anthes, R.A.; Hsie, E.Y.; Kuo, Y.H. Description of the Penn State/NCAR Mesoscale Model, Version 4 (MM4); NCAR Technical Note TN-282+STR; National Center for Atmospheric Research (NCAR): Boulder, CO, USA, 1987. [Google Scholar] [CrossRef]
  23. Stauffer, D.R.; Seaman, N.L. Use of Four-Dimensional Data Assimilation in a Limited-Area Mesoscale Model. Part I: Experiments with Synoptic-Scale Data. Mon. Weather Rev. 1990, 118, 1250–1277. [Google Scholar] [CrossRef] [Green Version]
  24. Stauffer, D.R.; Seaman, N.L.; Binkowski, F.S. Use of Four-Dimensional Data Assimilation in a Limited-Area Mesoscale Model Part II: Effects of Data Assimilation within the Planetary Boundary Layer. Mon. Weather Rev. 1991, 119, 734–754. [Google Scholar] [CrossRef] [Green Version]
  25. Stauffer, D.R.; Seaman, N.L. Multiscale Four-Dimensional Data Assimilation. J. Appl. Meteorol. Climatol. 1994, 33, 416–434. [Google Scholar] [CrossRef] [Green Version]
  26. Seaman, N.L.; Stauffer, D.R.; Lario-Gibbs, A.M. A Multiscale Four-Dimensional Data Assimilation System Applied in the San Joaquin Valley during SARMAP. Part I: Modeling Design and Basic Performance Characteristics. J. Appl. Meteorol. Climatol. 1995, 34, 1739–1761. [Google Scholar] [CrossRef] [Green Version]
  27. Seaman, N.L.; Stauffer, D.R.; McNally, D.E.; Tanrikulu, S. Application of the MM5-FDDA Meteorological Model to the Southern California SCAQS-1997 Domain: Preliminary Test Using the SCAQS August 1987 Case; American Meteorological Society: Boston, MA, USA, 1996. [Google Scholar]
  28. Warner, T.T.; Seaman, N.L. A Real-Time, Mesoscale Numerical Weather-Prediction System Used for Research, Teaching, and Public Service at The Pennsylvania State University. Bull. Am. Meteorol. Soc. 1990, 71, 792. [Google Scholar] [CrossRef] [Green Version]
  29. Pacione, R.; Sciarretta, C.; Faccani, C.; Ferretti, R.; Vespe, F. GPS PW assimilation into MM5 with the nudging technique. Phys. Chem. Earth Part A Solid Earth Geod. 2001, 26, 481–485. [Google Scholar] [CrossRef]
  30. Liu, Y.; Bourgeois, A.; Warner, T.; Swerdlin, S.; Hacker, J. IMPLEMENTATION OF OBSERVATION-NUDGING BASED FDDA INTO WRF FOR SUPPORTING ATEC TEST OPERATIONS. 2005. Available online: https://www.researchgate.net/publication/228942774_Implementation_of_observation-nudging_based_on_FDDA_into_WRF_for_supporting_AFEC_test_operations (accessed on 24 December 2021).
  31. Liu, Y.; Warner, T.T.; Bowers, J.F.; Carson, L.P.; Chen, F.; Clough, C.A.; Davis, C.A.; Egeland, C.H.; Halvorson, S.F.; Huck, T.W.; et al. The Operational Mesogamma-Scale Analysis and Forecast System of the U.S. Army Test and Evaluation Command. Part I: Overview of the Modeling System, the Forecast Products, and How the Products Are Used. J. Appl. Meteorol. Climatol. 2008, 47, 1077–1092. [Google Scholar] [CrossRef] [Green Version]
  32. Liu, Y.; Warner, T.T.; Astling, E.G.; Bowers, J.F.; Davis, C.A.; Halvorson, S.F.; Rife, D.L.; Sheu, R.-S.; Swerdlin, S.P.; Xu, M. The Operational Mesogamma-Scale Analysis and Forecast System of the U.S. Army Test and Evaluation Command. Part II: Interrange Comparison of the Accuracy of Model Analyses and Forecasts. J. Appl. Meteorol. Climatol. 2008, 47, 1093–1104. [Google Scholar] [CrossRef] [Green Version]
  33. Liu, Y.; Chen, F.; Warner, T.; Basara, J. Verification of a Mesoscale Data-Assimilation and Forecasting System for the Oklahoma City Area during the Joint Urban 2003 Field Project. J. Appl. Meteorol. Climatol. 2006, 45, 912–929. [Google Scholar] [CrossRef]
  34. Pan, L.; Liu, Y.; Liu, Y.; Li, L.; Jiang, Y.; Cheng, W.; Roux, G. Impact of four dimensional data assimilation (FDDA) on urban climate analysis. J. Adv. Modeling Earth Syst. 2015, 7, 1997–2011. [Google Scholar] [CrossRef]
  35. Rife, D.L.; Davis, C.A.; Liu, Y.; Warner, T.T. Predictability of Low-Level Winds by Mesoscale Meteorological Models. Mon. Weather Rev. 2004, 132, 2553–2569. [Google Scholar] [CrossRef]
  36. Wyszogrodzki, A.A.; Liu, Y.; Jacobs, N.; Childs, P.; Zhang, Y.; Roux, G.; Warner, T.T. Analysis of the surface temperature and wind forecast errors of the NCAR-AirDat operational CONUS 4-km WRF forecasting system. Meteorol. Atmos. Phys. 2013, 122, 125–143. [Google Scholar] [CrossRef] [Green Version]
  37. Huang, Y.; Liu, Y.; Xu, M.; Liu, Y.; Pan, L.; Wang, H.; Cheng, W.Y.Y.; Jiang, Y.; Lan, H.; Yang, H.; et al. Forecasting severe convective storms with WRF-based RTFDDA radar data assimilation in Guangdong, China. Atmos. Res. 2018, 209, 131–143. [Google Scholar] [CrossRef]
  38. Reen, B. A Brief Guide to Observation Nudging in WRF; Battlefield Environment Division, Army Research Laboratory: Adelphi, Maryland, 2016. [Google Scholar]
  39. Hong, S.-Y.; Lim, J. The WRF Single-Moment 6-Class Microphysics Scheme (WSM6). Asia-Pac. J. Atmos. Sci. 2006, 42, 129–151. Available online: https://www2.mmm.ucar.edu/wrf/users/workshops/WS2006/abstracts/PSession05/P5_4_Hong.pdf (accessed on 24 December 2021).
  40. Iacono, M.J.; Delamere, J.S.; Mlawer, E.J.; Shephard, M.W.; Clough, S.A.; Collins, W.D. Radiative forcing by long-lived greenhouse gases: Calculations with the AER radiative transfer models. J. Geophys. Res. Atmos. 2008, 113, D13103. [Google Scholar] [CrossRef]
  41. Grell, G.A.; Freitas, S.R. A scale and aerosol aware stochastic convective parameterization for weather and air quality modeling. Atmos. Chem. Phys. 2014, 14, 5233–5250. [Google Scholar] [CrossRef] [Green Version]
  42. Alapaty, K. Development and Testing of the Dynamic Formulation of Relaxation Timescale for use in Cumulus Convection Parameterizations. In Proceedings of the American Geophysical Union, Fall Meeting, San Francisco, CA, USA, 15–19 December 2008; Available online: https://www.researchgate.net/publication/252244666_Development_and_Testing_of_the_Dynamic_Formulation_of_Relaxation_Timescale_for_use_in_Cumulus_Convection_Parameterizations (accessed on 24 December 2021).
  43. Betts, A.K.; Chen, F.; Mitchell, K.E.; Janjic, Z.I. Assessment of the Land Surface and Boundary Layer Models in Two Operational Versions of the NCEP Eta Model Using FIFE Data. Mon. Weather Rev. 1997, 125, 2896–2916. [Google Scholar] [CrossRef]
  44. Wu, M.; Jin, S.; Li, Z.; Cao, Y.; Ping, F.; Tang, X. High-Precision GNSS PWV and Its Variation Characteristics in China Based on Individual Station Meteorological Data. Remote Sens. 2021, 13, 1296. [Google Scholar] [CrossRef]
  45. Wang, C. On the Calculation and Correction of Equitable Threat Score for Model Quantitative Precipitation Forecasts for Small Verification Areas: The Example of Taiwan. Weather Forecast. 2014, 29, 788–798. [Google Scholar] [CrossRef]
  46. Wang, S.; Hui, J.; Zhang, G.; Gao, J.; Hu, J.; He, X. Research on the Precipitation Grade Standards for Short-term Proximity Meteorological Services. In Proceedings of the 34th Annual Meeting of China Meteorological Society, Zhengzhou, China, 26–29 September 2017; Available online: http://cpfd.cnki.com.cn/Article/CPFDTOTAL-ZGQX201709011069.htm (accessed on 24 December 2021).
Figure 1. Model domain configuration. The horizontal grid intervals of d01, d02, and d03 are 9, 3, and 1 km, respectively.
Remotesensing 14 00178 g001
Figure 2. Distribution of observation stations: (a) GNSS stations, (b) AWS stations.
Remotesensing 14 00178 g002
Figure 3. Comparison between the model PWV (color shades) with the observed PWV (filled circles) at 09:00 UTC on 16 September 2018: (a) PWV from the CTRL experiment, (b) PWV from the GNSS experiment, (c) difference of the PWV between CTRL and GNSS experiments, (d) overlay of the model PWV from the CTRL experiment and the observed PWV in the zoomed-in inner-core region of the typhoon “Mangkhut”, and (e) overlay of the model PWV from the GNSS experiment and the observed PWV.
Remotesensing 14 00178 g003
Figure 4. Vertical profile of the layer water vapor depth at Points (AC), valid at 09:00 UTC on 16 September 2018.
Remotesensing 14 00178 g004
Figure 5. Comparison of typhoon tracks of the CTRL, GNSS, and FCST experiments with the observed (a) and the track error of the three experiments (b).
Remotesensing 14 00178 g005
Figure 6. Comparison of the simulated and the observed typhoon intensity: (a) minimum sea level pressure at the typhoon center of the CTRL, GNSS, and FCST experiments and the observed, (b) maximum wind speed at the typhoon center of the CTRL, GNSS, and FCST experiments and the observed. The abscissa is for the model running hours starting at 09:00 UTC on 15 September 2018.
Remotesensing 14 00178 g006
Figure 7. Comparison of 1 h accumulated precipitation of the CTRL and GNSS experiments (color shades) with the AWS-observed precipitation (filled circles), valid at 07:00 UTC on September 16, 2018: (a) 1 h accumulated precipitation from the CTRL experiment, (b) 1 h accumulated precipitation from the GNSS experiment, (c) difference of the model 1 h accumulated precipitation between the CTRL and GNSS experiment, (d) overlay of the 1 h accumulated precipitation of the CTRL experiment and the observed in the zoomed-in inner-core region, (e) overlay of the 1 h accumulated precipitation of the GNSS experiment and the observed in the zoomed-in inner-core region.
Remotesensing 14 00178 g007
Figure 8. TS of precipitation in the CTRL and GNSS experiments at 07:00 UTC on 16 September 2018.
Remotesensing 14 00178 g008
Table 1. Model grid settings and physical parameterization configuration.
Grid Regiond01d02d03
Grid point125 × 125178 × 169277 × 277
Grid interval9 km3 km1 km
Vertical levels34 levels
Microphysical process schemeWSM6 scheme
Radiation process schemeRRTMG scheme
Cumulus parameterization schemeGrell–Freitas scheme (d01 only)
Land surface process schemeNoah scheme
Boundary layer schemeYSU scheme
Near-surface layer schemeMonin–Obukhov scheme
Table 2. Design of the assimilation scheme.
Exp.SchemeTime (UTC)
CTRLNo data assimilation09:00 15 September 2018–21:00 16 September 2018
GNSSAssimilation of GNSS PWV for the whole period09:00 15 September 2018–21:00 16 September 2018
FCSTAssimilation of GNSS PWV during the 0–24 h and forecasting starts at the 24th h09:00 15 September 2018–09:00 16 September 2018
09:00 16 September 2018–21:00 16 September 2018
Table 3. Verification of the model PWV of the CTRL and GNSS experiments.
Time (UTC)BIAS (mm)RMSE (mm)Correlation
Coefficient
CTRLGNSSCTRLGNSSCTRLGNSS
03:00 16 September 2018−1.42−0.444.804.660.460.67
09:00 16 September 20182.080.096.045.930.560.70
12:00 16 September 20182.410.375.304.820.370.68
Publisher’s Note: MDPI stays neutral with regard to jurisdictional claims in published maps and institutional affiliations.

