Abstract
In this study, the Fengyun-3D (FY-3D) clear-sky microwave temperature sounder-2 (MWTS-2) radiances were directly assimilated in the regional mesoscale Weather Research and Forecasting (WRF) model using the Gridpoint Statistical Interpolation (GSI) data assimilation system. The assimilation experiments were conducted to compare the track errors of typhoon Lekima from uses of the Advanced Microwave Sounding Unit-A (AMSU-A) radiances (EXP_AD) with those from FY-3D MWTS-2 upper-air sounding data at channels 5–7 (EXP_AMD). The clear-sky mean bias-corrected observation-minus-background (O-B) values of FY-3D MWTS-2 channels 5, 6, and 7 are 0.27, 0.10 and 0.57 K, respectively, which are smaller than those without bias corrections. Compared with the control experiment, which was the forecast of the WRF model without use of satellite data, the assimilation of satellite radiances can improve the forecast performance and reduce the mean track error by 8.7% (~18.4 km) and 30% (~58.6 km) beyond 36 h through the EXP_AD and EXP_AMD, respectively. The direction of simulated steering flow changed from southwest in the EXP_AD to southeast in the EXP_AMD, which can be pivotal to forecasting the landfall of typhoon Lekima (2019) three days in advance. Assimilation of MWTS-2 upper-troposphere channels 5–7 has great potential to improve the track forecasts for typhoon Lekima.
1. Introduction
The observations from satellite microwave temperature sounders play a key role in numerical weather prediction (NWP), typhoon monitoring, and climate change research [1,2]. Significant progress has been made in the NWP centers around the world regarding the direct assimilation of the satellite microwave and infrared radiances [3], and in the application of satellite observations for typhoon monitoring and forecasting. The AMSU-A clear-sky radiances are assimilated by a limited-area ensemble Kalman filter (EnKF) to improve forecast skills for tropical cyclone (TC) prediction [4]. The brightness temperatures from the Advanced Technology Microwave Sounder (ATMS) onboard the Suomi-NPP satellite were directly assimilated into the Hurricane Weather Research and Forecasting (HWRF) model, which improved the track and intensity forecasts of Hurricane Sandy (2012) [5]. Results from the assimilation of multiple satellite data also indicated that satellite radiances can improve the typhoon Chan-Hom (2015) forecast skills [6]. In conclusion, the incorporation of satellite data, especially microwave observations, has greatly improved the NWP forecast skills of the worldwide NWP centers [7,8,9].
Fengyun-3D (FY-3D), an operational satellite from the China Meteorological Administration (CMA), was launched in November 2017. There are 13 oxygen channels in the microwave temperature sounder-2 (MWTS-2) instrument onboard the FY-3D, which observe the atmospheric temperature from the surface to the upper stratosphere. However, the FY-3D MWTS-2 lacks the two window channels at 23.8 and 31.4 GHz (see Table 1), which are critical for retrieving the cloud liquid water path (CLW) [10] and for cloud detection in the Gridpoint Statistical Interpolation (GSI) data assimilation system [11]. In previous studies, the cloud detection methods for the MWTS-2 were developed mainly by setting the cloud products from other instruments [12,13]. Recently, a convenient cloud detection method was proposed by Yang and Weng (2019) [14] that uses the brightness temperatures of 23.8 and 31.4 GHz channels reconstructed from a machine learning method. The data from the FY-3C/D MWTS-2 and the microwave humidity sounder-2 (MWHS-2) were recently evaluated and assimilated into the Met Office operational global model. The results indicate that assimilating MWTS-2 and MWHS-2 can reduce the errors of the global forecasts [15]. Besides, FY-3D MWTS-2 channels have similar global O-B biases with those from NOAA-20 ATMS at the same frequencies, which suggests that MWTS-2 has a similar performance to ATMS [16]. Therefore, the FY-3D MWTS-2 can play a significant role in satellite data assimilation of the global/regional NWP model, tropical cyclone warm core retrievals [17], and detection of atmospheric gravity waves [18]. In order to further investigate the potential impact of assimilating FY-3D data into the regional NWP model, in this study observations from the MWTS-2 upper-troposphere channels were firstly assimilated into a regional model to quantify the impacts on typhoon forecast.

Table 1.
Channel number, frequency, noise equivalent differential temperature, bandwidth, and weighting function peak of the AMSU-A and FY-3D MWTS-2.
2. Case and Model Configurations
2.1. Brief Description of Typhoon Lekima
Typhoon Lekima formed as a tropical depression (TD) at 0000 UTC on 2 August 2019 over the ocean to the east of the Philippines, and further strengthened into a typhoon (TY) around 1800 UTC on 6 August 2019. The best track of Lekima from the Regional Specialized Meteorological Center (RSMC), Tokyo, is shown in Figure 1. Lekima landed on the coast of Wenling City, Zhejiang Province, around 1800 UTC on 9 August 2019, and brought sufficient water vapor and abundant rainfall with an 85 kt (1 kt = 0.51 m/s) maximum sustained wind. Lekima caused severe province-wide rainstorms and disasters in Zhejiang, Jiangsu, and Shandong Provinces from 0000 UTC on 5 August to 1200 UTC on 17 August 2019 [19]. Therefore, it was essential to accurately forecast the landfall of Lekima two or three days in advance.
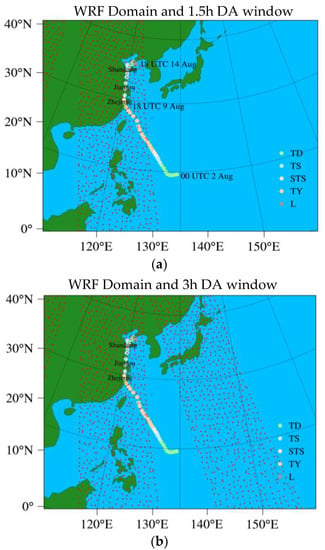
Figure 1.
Model domain configuration and the best track of typhoon Lekima during the period from 0000 UTC on 2 August 2019, to 1800 UTC on 14 August 2019. Lekima made first landfall at 1800 UTC on 9 August 2019 in the Zhejiang Province. TD, TS, STS, TY, and L stand for tropical depression, tropical storm, severe tropical storm, typhoon, and extra-tropical cyclone, respectively. The red points stand for the FY-3D MWTS-2 data points after data thinning in the GSI with (a) a 1.5 h data assimilation time window and (b) a 3 h data assimilation time window at 0600 UTC on 6 August 2019.
2.2. Model and Experimental Setup
In this study, WRF version 3.8 [20,21,22] and GSI version 3.7 were used for regional forecast and data assimilation, respectively. For the data assimilation experiments, the three-dimensional variational (3D-Var) data assimilation (DA) method was adopted [23,24]. The forecast domain was centered at (25° N, 135° E) with a horizontal resolution of 9 km. It is well known that WRF has a cumulus parameterization grey-zone between 1 and 10 km, which can lead to errors in small-scale convection systems [25,26], so the cumulus parameterization scheme was not used in this study. There were 51 Eta levels in the vertical direction for simulations from Eta = 1 to Eta = 0, and the WRF model maximum was set to 10 hPa. The WRF model was initialized by the National Centers for Environmental Prediction (NCEP) Global Forecast System (GFS) analysis and forecasts with the spatial resolution of 0.5° × 0.5° [27]. The Duhia shortwave scheme [28], the rapid radiative transfer model (RRTM) scheme for longwave radiation [29], the Thompson microphysical scheme [30], the Noah land-surface model [31], and a three-dimensional (3D) scale-adaptive turbulent kinetic energy-based boundary layer scheme [32] were adopted in the WRF model (see Table 2). The advanced radiative transfer modeling system (ARMS) was coupled as an observation operator in the GSI to simulate the FY-3D MWTS-2 brightness temperatures [33]. The brightness temperatures of MWTS-2 channels 1–13 and the machine-learned 23.8 and 31.4 GHz were stored in the binary universal form for the representation of meteorological data as one data stream in the GSI system.

Table 2.
Model set up with main physical parameterization schemes in the simulation.
Three experiments were conducted twice daily at 0600 and 1800 UTC, respectively, during the period from 5 August 2019 to 8 August 2019. Firstly, a model-free run without data assimilation (to be denoted as CTRL) was conducted. Then, two data assimilation experiments, EXP_AD and EXP_AMD, were carried out. The EXP_AD assimilated the conventional data and radiance data from NOAA-15, -18, -19, and the Meteorological Operations Platform A/B (MetOp-A/B) Advanced Microwave Sounding Unit-A (AMSU-A) channels 1–11 and 15 [34]. AMSU-A channels 12–14 were set by default not to be assimilated in the GSI because their weighting function peaks are above the WRF model maximum (10 hPa). The EXP_AMD is the same as EXP_AD except that it assimilated extra data from the FY-3D MWTS-2 upper-troposphere channels 5–7. In data assimilation experiments, a 3 h assimilation window was applied, instead of the 1.5 h window, because more MWTS-2 observations over the Northwest Pacific (Figure 1b) can be assimilated to improve the forecast skills for Lekima.
3. Results
3.1. Quality Control
Latitudinal and scan-angle biases from instruments, calibrations, and models are sometimes larger than the atmospheric signal [35,36,37], which will cause a significant decrease in the quality of the analysis and forecast fields [38]. Therefore, a combined variational bias correction (VarBC) scheme was used to quantify and remove the latitudinal biases and scan-angle biases for the satellite radiances in the GSI. The quality control procedure of data thinning was also applied to the MWTS-2 data to reduce the correlated observation errors. A 120 km thinning box was selected for FY-3D MWTS-2 data thinning criteria, which is the same as for the Suomi-NPP ATMS [39]. A cloud detection method based on the retrieved CLW was carried out to remove the cloudy data points from the cloud-affected channels, MWTS-2 channel 4 (53.59 GHz), and channel 5 (54.4 GHz). Figure 2 shows the differences between the observations and the simulations (O–B) of the MWTS-2 channels 5, 6, and 7 at 0600 UTC on 7 August 2019 before and after bias corrections. Negative scan-angle biases of channel 5 were removed after the bias correction, and the cloudy data points around the typhoon Lekima were also rejected. The clear-sky mean O-B biases of FY-3D MWTS-2 channels 5–7 decreased from −1.8, −1.6 and −1.4 K to 0.27, 0.10 and 0.57 K, respectively, after bias corrections.
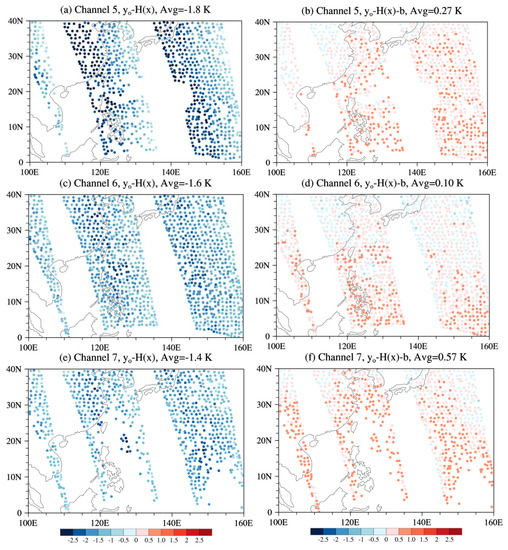
Figure 2.
(a–f) O–B for FY-3D MWTS-2 channels 5, 6, and 7 before (left panel) and after (right panel) bias corrections at 0600 UTC on 7 August 2019.
3.2. Impact on Initial Conditions
Figure 3 shows the vertical root-mean-square errors (RMSEs) for the increments of temperature, water vapor mixing ratio, zonal wind (U), and meridional wind (V) at the initial time in the EXP_AD and EXP_AMD. The vertical RMSE value refers to the sensitivity of physical variables at different model levels after assimilating satellite radiance. The larger RMSE value implies the larger data impact on the model’s initial condition. The RMSE values were slightly increased by EXP_AMD after adding FY-3D MWTS-2 channels 5–7 in data assimilation based on the EXP_AD. More changes were observed in the common physical variables by EXP_AMD, which resulted in slightly larger RMSE values. The RMSE values of increments for the water vapor mixing ratio in the EXP_AMD did not change much, compared with those in the EXP_AD, because there were only three MWTS-2 temperature sounding channels added to the EXP_AMD. Therefore, there was no significant improvement in forecast skills for typhoon intensity (not shown). However, the change of temperature led to the shift in the mass field, which resulted in the evolution of wind fields, especially zonal wind, from the 25th (~470 hPa) to the 34th (~210 hPa) model level. The shift in wind fields can directly affect the large-scale environmental steering flow of a typhoon, which will significantly influence the accuracy of the typhoon track forecasts.
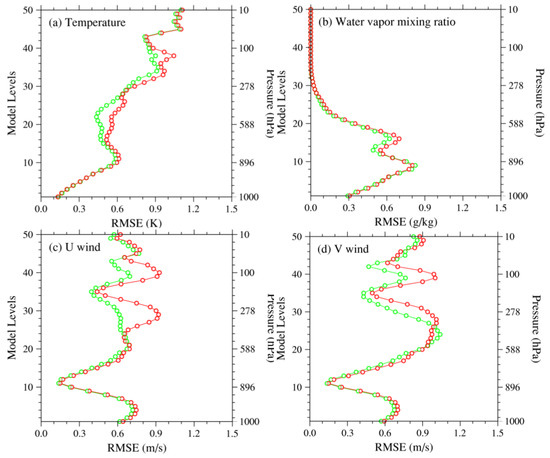
Figure 3.
Domain-averaged RMSEs of vertical profiles of the (a) temperature, (b) water vapor mixing ratio, (c) U and (d) V increments of the EXP_AD (green) and EXP_AMD (red) at the initial time at 0600 UTC on 7 August 2019.
3.3. Track Forecasts
The large-scale environmental steering flow and the beta drift are the most critical factors for the motion of a tropical cyclone. To understand how the MWTS-2 upper-troposphere channels 5–7 affect the track forecast, the steering flows of EXP_AD and EXP_AMD were examined in this study. Firstly, the mean wind flow in deep layers is calculated by using the following formula [40,41]:
Then, the steering flow is defined as the average of the mean wind flows within 500 km of the typhoon center [41].
Figure 4a shows the three-day best track along with the forecast tracks of the CTRL, EXP_AD, and EXP_AMD from 0600 UTC on 7 August 2019. Only the EXP_AMD could forecast the landfall of typhoon Lekima, indicating its good performance in simulating the steering flow. Figure 4b,c shows the comparison of mean wind flows, wind speed (shaded) and calculated steering flows from the 48 h forecasts in the EXP_AD and EXP_AMD. The direction of the simulated steering flow changed from southwest in the EXP_AD to southeast in the EXP_AMD, which contributed to the northwest movement of typhoon Lekima.
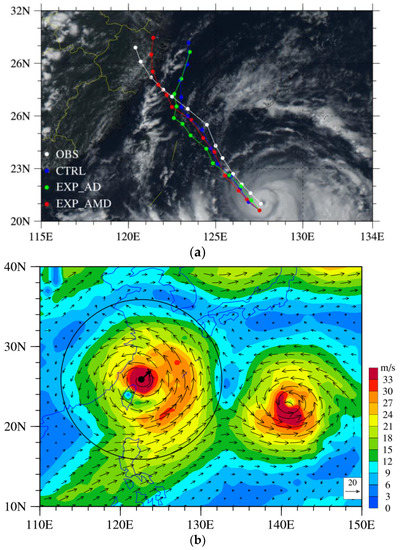
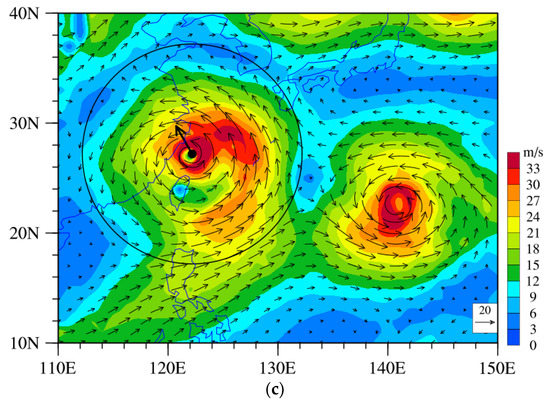
Figure 4.
(a) The best track (white) and the track forecasts from CTRL (blue), EXP_AD (green), and EXP_AMD (red) from 0600 UTC on 7 August 2019 to 0600 UTC on 10 August 2019. The background image shows the Fengyun-4A (FY-4A) Advanced Geostationary Radiation Imager (AGRI) True Color Imagery on 0600 UTC 7 August 2019. The mean wind flow, wind speed (shaded), and calculated steering flow (solid circle with black arrow) by the 48 h forecasts of the (b) EXP_AD and (c) EXP_AMD on 0600 UTC 9 August 2019.
Figure 5 shows the comparison of track errors of CTRL, EXP_AD, and EXP_AMD at eight different initial times. The track errors (D) are calculated by the distances between the model simulations (φ2, λ2) and best tracks (φ1, λ1) as follows:
where R represents the radius of the earth, and λ and φ are the longitude and latitude, respectively. In general, the EXP_AMD performed the best in the track forecast with the leading time of 36 h to 72 h, followed by the EXP_AD, which indicated the good performance when the AMSU-A and MWTS-2 data were both assimilated into the model. The mean track errors and percentages of improvement, i.e., (EXP_AD–CTRL)/CTRL and (EXP_AMD–CTRL)/CTRL, are shown in Figure 6. There was no significant improvement from the initial time to the 30 h forecasts by the EXP_AD and EXP_AMD compared with that by the CTRL. However, the mean track errors, calculated by averaging track errors of eight different initial times from Figure 5 with the forecast hours of 42 h to 72 h by the EXP_AD, decreased by 8.7% (~18.4 km) approximately, while the mean track errors of the forecasts, with the leading time of 36 h to 72 h by the EXP_AMD, reduced by 30% (~58.6 km).
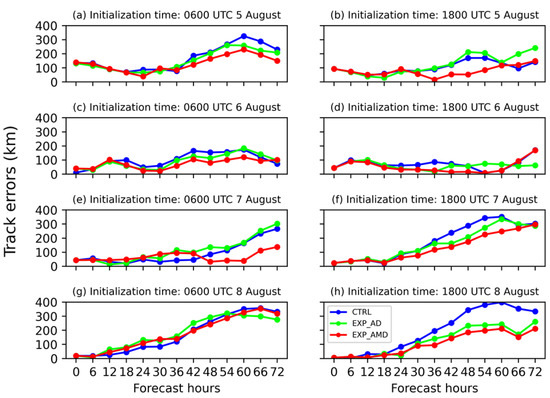
Figure 5.
(a–h) 72 h track errors (unit: km) of the CTRL (blue), EXP_AD (green), and EXP_AMD (red) with the model initialization times at 0600 UTC (left panel) and 1800 UTC (right panel) from 5 to 8 August 2019. The x-axis represents the forecast hours (unit: h).
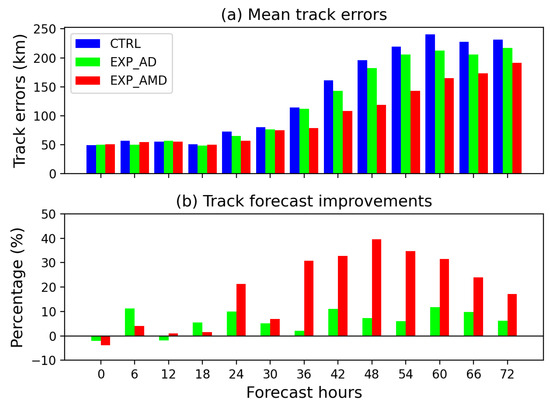
Figure 6.
(a) Mean track errors (unit: km) calculated by averaging track errors of eight different initial times from Figure 5 and (b) mean track forecast improvement (unit: %) relative to the CTRL (blue) for EXP_AD (green) and EXP_AMD (red). The x-axis represents the forecast hours.
4. Conclusions and Discussion
In this study, the results show that the combined assimilation of the AMSU-A and MWTS-2 upper-troposphere channels 5–7 has great potential to improve the track forecast for typhoon Lekima. The main conclusions are as follows.
(i) Compared with the CTRL and EXP_AD, the EXP_AMD can significantly reduce the mean track errors by improving the zonal wind and meridional wind in the middle and upper layer for the analysis and forecasts. Assimilating FY-3D MWTS-2 upper-troposphere channels 5–7 shows added value for typhoon Lekima track forecasts.
(ii) The steering flow [42,43,44,45] plays an important role in the northwest movement of typhoon Lekima, which is conductive to forecasting typhoon Lekima’s landfall three days in advance.
(iii) The VarBC scheme is effective to remove the latitudinal biases and scan-angle biases for the satellite radiances in the GSI. The clear-sky mean bias-corrected O-B values of FY-3D MWTS-2 channels 5, 6, and 7 are smaller than those without bias correction.
In this study, only the data from the MWTS-2 channels 5–7 were assimilated because there were considerable noise equivalent differential temperatures (see Table 1) in channels 8–13 (greater than 1.2 K). Moreover, the retrieved CLW can identify most cloudy data points (CLW > 0.05 mm), but some data points partially affected by the clouds were located near the edges of the cloud, which are hard to remove. Therefore, the data from the MWTS-2 channels 1–4 were not easily assimilated. In the future, we will assimilate the MWTS-2 channels 1–4 to improve the low tropospheric structures of the storm by removing the cloud-edge data points and optically thin clouds, based on the cloud detection method proposed by Niu and Zou (2020) [13].
Because only clear sky radiances from satellite temperature sounder channels were assimilated, there was no significant improvement in storm intensity forecasts in this study. In order to improve intensity forecasts, more effort should be made on assimilating observations within or surrounding the storm center, such as all-sky assimilation [46] and storm vortex initialization (VI) [47]. In the future, the data from the 183 GHz humidity channels of the microwave humidity sounder onboard the FY-3D will be assimilated into the GSI system to improve the performance in simulating the tropical cyclone three-dimensional water vapor structures. Furthermore, other advanced assimilation methods, such as the ensemble Kalman filter or hybrid data assimilation methods, will also be used to further improve the tropical cyclone forecast skills.
Author Contributions
Conceptualization, Z.N. and L.Z.; Data curation, Z.N. and L.Z.; Formal analysis, Z.N. and L.Z.; Funding acquisition, L.Z.; Investigation, Z.N. and L.Z.; Methodology, L.Z. and P.D.; Project administration, W.H. and F.W.; Resources, W.H. and F.W.; Writing—original draft, Z.N.; Writing—review and editing, L.Z. and F.W. All authors have read and agreed to the published version of the manuscript.
Funding
This work was supported by the National Key Research and Development Program of China (Grant No. 2016YFE0109700), the Natural Science Foundation of China Project (Grant No. 41675027), Research Program from Science and Technology Committee of Shanghai (Grant No. 19dz1200101), and the Natural Science Foundation of Jiangsu Province (Grant No. BK20201505).
Institutional Review Board Statement
Not applicable.
Informed Consent Statement
Not applicable.
Data Availability Statement
Not applicable.
Acknowledgments
The authors would like to thank all reviewers and editors for their comments on this paper.
Conflicts of Interest
The authors declare no conflict of interest.
References
- Zou, C.-Z.; Wang, W.; Wang, L.; Long, C. Recalibration and merging of SSU observations for stratospheric temperature trend studies. J. Geophys. Res. Atmos. 2016, 119, 13–180. [Google Scholar] [CrossRef]
- Zou, X. Atmospheric Satellite Observations: Variational Assimilation and Quality Assurance; Academic Press: Cambridge, MA, USA; Elsevier Inc.: Amsterdam, The Netherlands, 2020; 313p, ISBN 978-0-12-820950-9. [Google Scholar]
- McNally, A.P.; Watts, P.D.; Smith, J.A.; Engelen, R.; Kelly, G.A.; Thépaut, J.N.; Matricardi, M. The assimilation of AIRS radiance data at ECMWF. Q. J. R. Meteorol. Soc. 2006, 132, 935–957. [Google Scholar] [CrossRef]
- Liu, Z.Q.; Schwartz, C.S.; Snyder, C.; Ha, S.Y. Impact of assimilating AMSU-A radiances on forecasts of 2008 Atlantic tropical cyclones initialized with a limited-area ensemble kalman filter. Mon. Weather Rev. 2012, 140, 4017–4034. [Google Scholar] [CrossRef]
- Zou, X.; Weng, F.; Zhang, B.; Lin, L.; Qin, Z.; Tallapragada, V. Impacts of assimilation of ATMS data in HWRF on track and intensity forecasts of 2012 four landfall hurricanes. J. Geophys. Res. Atmos. 2014, 118, 558–576. [Google Scholar] [CrossRef]
- Xu, D.; Shu, A.; Shen, F.; Min, J.; Li, H.; Xia, X. Impacts of Multiple Radiance Data Assimilation on the Simulation of Typhoon Chan-Hom. Atmosphere 2020, 11, 957. [Google Scholar] [CrossRef]
- McNally, A.P.; Derber, J.C.; Wu, W.; Katz, B.B. The use of TOVS Level-1B radiances in the NCEP SSI analysis system. Q. J. R. Meteorol. Soc. 2000, 126, 689–724. [Google Scholar] [CrossRef]
- Collard, A.; Hilton, F.; Forsythe, M.; Candy, B. From Observations to Forecasts—Part 8: The use of satellite observations in numerical weather prediction. Weather 2011, 66, 31–36. [Google Scholar] [CrossRef]
- Geer, A.J.; Bauer, P.; English, S. Assimilating AMSU-A temperature sounding channels in the presence of cloud and precipitation. ECMWF Tech. Memo. 2012, 670, 41. [Google Scholar]
- Grody, N.; Zhao, J.; Ferraro, R.; Weng, F.; Boers, R. Determination of precipitable water and cloud liquid water over oceans from the NOAA-15 advanced microwave sounding unit. J. Geophys. Res. Atmos. 2001, 106, 2943–2953. [Google Scholar] [CrossRef]
- Zhu, Y.; Derber, J.; Collard, A.; Dee, D.; Treadon, R.; Gayno, G.; Jung, J.A. Enhanced radiance bias correction in the National Centers for Environmental Prediction’s Gridpoint Statistical Interpolation data assimilation system. Q. J. R. Meteorol. Soc. 2014, 140, 1479–1492. [Google Scholar] [CrossRef]
- Han, H.; Li, J.; Goldberg, M.; Wang, P.; Li, J.; Li, Z.; Sohn, B.-J.; Li, J. Microwave sounder cloud detection using a collocated high-resolution imager and its impact on radiance assimilation in tropical cyclone forecasts. Mon. Weather Rev. 2015, 144, 3937–3959. [Google Scholar] [CrossRef]
- Niu, Z.; Zou, X.; Ray, P.S. Development and testing of a clear-sky data selection algorithm for FY-3C/D Microwave Temperature Sounder-2. Remote Sens. 2020, 12, 1478. [Google Scholar] [CrossRef]
- Yang, J.; Weng, F.; Hu, H.; Dong, P. Retrieval of the total precipitable water vapor and cloud liquid water path over ocean from the Feng-Yun 3D microwave temperature and humidity sounders. Atmos. Meas. Tech. Discuss. 2019. [Google Scholar] [CrossRef]
- Lu, Q.F.; Lawrence, H.; Bormann, N.; English, S.; Lean, K.; Atkinson, N.; Bell, W.; Carminati, F. An evaluation of FY-3C satellite data quality at ECMWF and the Met Office. ECMWF Tech. Memo. 2015, 767. [Google Scholar] [CrossRef]
- Carminati, F.; Atkinson, N.; Candy, B.; Lu, Q.F. Insights into the microwave instruments onboard the Feng-Yun 3D satellite: Data quality and assimilation in the Met Office NWP system. Adv. Atmos. Sci. 2020. [Google Scholar] [CrossRef]
- Tian, X.; Zou, X. ATMS- and AMSU-A-derived hurricane warm core structures using a modified retrieval algorithm. J. Geophys. Res. Atmos. 2016, 121, 12630–12646. [Google Scholar] [CrossRef]
- Wu, D.L. Mesoscale gravity wave variances from AMSU-A radiances. Geophys. Res. Lett. 2004, 31. [Google Scholar] [CrossRef]
- Xiang, C.; Wu, L.; Qin, N. Characteristics of extreme rainfall and rainbands evolution of Super Typhoon Lekima (2019) during its landfall. Front. Earth Sci. 2021, 14, 409–430. [Google Scholar]
- Chen, F.; Dudhia, J. Coupling an advanced land surface–hydrology model with the Penn State–NCAR MM5 modeling system. Part I: Model implementation and sensitivity. Mon. Weather Rev. 2001, 129, 569–585. [Google Scholar] [CrossRef]
- Hong, S.Y.; Dudhia, J.; Chen, S.H. A revised approach to ice microphysical processes for the bulk parameterization of clouds and precipitation. Mon. Weather Rev. 2004, 132, 103–120. [Google Scholar] [CrossRef]
- Hong, S.Y.; Noh, Y.; Dudhia, J. A new vertical diffusion package with an explicit treatment of entrainment processes. Mon. Weather Rev. 2006, 134, 2318–2341. [Google Scholar] [CrossRef]
- Zhu, Y.; Gayno, G.; Purser, R.J.; Su, X.; Yang, X. Expansion of the all-sky radiance assimilation to ATMS at NCEP. Mon. Weather Rev. 2019, 147, 2603–2620. [Google Scholar] [CrossRef]
- Qin, Z.; Zou, X.; Weng, F. Evaluating added benefits of assimilating GOES Imager radiance data in GSI for coastal QPFs. Mon. Weather Rev. 2013, 141, 75–92. [Google Scholar] [CrossRef]
- Marsham, J.H.; Dixon, N.S.; Garcia-Carreras, L.; Lister, G.M.S.; Parker, D.J.; Knippertz, P.; Birch, C.E. The role of moist convection in the West African monsoon system: Insights from continental-scale convection-permitting simulations. Geophys. Res. Lett. 2013, 40, 1843–1849. [Google Scholar] [CrossRef]
- Birch, C.; Parker, D.; Marsham, J.; Copsey, D.; Garcia-Carreras, L. A seamless assessment of the role of convection in the water cycle of the West African monsoon. J. Geophys. Res. 2014, 119, 2890–2912. [Google Scholar] [CrossRef]
- Whitaker, J.S.; Hamill, T.M.; Wei, X.; Song, Y.; Toth, Z. Ensemble data assimilation with the NCEP global forecast system. Mon. Weather Rev. 2008, 136, 463–482. [Google Scholar] [CrossRef]
- Dudhia, J. Numerical study of convection observed during the Winter Monsoon Experiment using a mesoscale two–dimensional model. J. Atmos. Sci. 1989, 46, 3077–3107. [Google Scholar] [CrossRef]
- Mlawer, E.J.; Taubman, S.J.; Brown, P.D.; Iacono, M.J.; Clough, S.A. Radiative transfer for inhomogeneous atmospheres: RRTM, a validated correlated–k model for the longwave. J. Geophys. Res. 1997, 102, 16663–16682. [Google Scholar] [CrossRef]
- Thompson, G.; Field, P.R.; Rasmussen, R.M.; Hall, W.D. Explicit Forecasts of Winter Precipitation Using an Improved Bulk Microphysics Scheme. Part II: Implementation of a New Snow Parameterization. Mon. Weather Rev. 2008, 136, 5095–5115. [Google Scholar] [CrossRef]
- Tewari, M.; Chen, F.; Wang, W.; Dudhia, J.; LeMone, M.A.; Mitchell, K.; Ek, M.; Gayno, G.; Wegiel, J.; Cuenca, R.H. Implementation and verification of the unified NOAH land surface model in the WRF model. In Proceedings of the 20th Conference on Weather Analysis and Forecasting/16th Conference on Numerical Weather Prediction, Seattle, WA, USA, 12 January 2004; pp. 11–15. [Google Scholar]
- Zhang, X.; Bao, J.; Chen, B.; Grell, E. A Three-Dimensional Scale-Adaptive Turbulent Kinetic Energy Scheme in the WRF-ARW Model. Mon. Weather Rev. 2018, 146, 2023–2045. [Google Scholar] [CrossRef]
- Weng, F.; Yu, X.; Duan, Y. Advanced Radiative Transfer Modeling System (ARMS): A New-Generation Satellite Observation Operator Developed for Numerical Weather Prediction and Remote Sensing Applications. Adv. Atmos. Sci. 2020, 37, 131–136. [Google Scholar] [CrossRef]
- Mo, T. Postlaunch calibration of the MetOp-A advanced microwave sounding unit-A. IEEE Trans. Geosci. Remote Sens. 2008, 46, 3581–3600. [Google Scholar] [CrossRef]
- Dee, D.P. Bias and data assimilation. Q. J. R. Meteorol. Soc. 2005, 131, 3323–3343. [Google Scholar] [CrossRef]
- Eyre, J.R.; Watts, P. A sequential estimationapproach to cloud-clearing for satellite temperature sounding. Q. J. R. Meteorol. Soc. 2007, 113, 1349–1376. [Google Scholar] [CrossRef]
- Li, X.; Zou, X. Bias characterization of CrIS radiance at 399 selected channels with respect to NWP model simulation. Atmos. Res. 2017, 196, 164–181. [Google Scholar] [CrossRef]
- Lin, L.; Zou, X.; Weng, F.Z. Combining CrIS double CO2 bands for detecting clouds located in different verticallayers of the atmosphere. J. Geophys. Res. Atmos. 2017, 122, 1811–1827. [Google Scholar] [CrossRef]
- Zhu, Y.; Liu, E.; Mahajan, R.; Thomas, C.; Groff, D.; Van Delst, P.; Collard, A.; Kleist, D.; Treadon, R.; Derber, J.C. All-sky microwave radiance assimilation in NCEP’s GSI analysis system. Mon. Weather Rev. 2016, 144, 4709–4735. [Google Scholar] [CrossRef]
- Carr, L.E., III; Elsberry, R.L. Observational evidence for predictions of tropical cyclone propagation relative to environmental steering. J. Atmos. Sci. 1990, 47, 542–546. [Google Scholar] [CrossRef]
- Wu, Y.; Zou, X. Numerical test of a simple approach for using TOMS total ozone data in hurricane environment. Q. J. R. Meteorol. Soc. 2008, 134, 1397–1408. [Google Scholar] [CrossRef]
- Velden, C.S.; Leslie, L.M. The basic relationship between tropical cyclone intensity and the depth of the environmental steering layer in the Australian region. Weather Forecast. 1991, 6, 244–253. [Google Scholar] [CrossRef]
- Wu, L.; Chen, X. Revisiting the steering principle of tropical cyclone motion in a numerical experiment. Atmos. Chem. Phys. 2016, 16, 14925–14936. [Google Scholar] [CrossRef]
- Torn, R.D.; Elless, T.J.; Papin, P.P.; Davis, C.A. Tropical cyclone track sensitivity in deformation steering flow. Mon. Weather Rev. 2018, 146, 3183–3201. [Google Scholar] [CrossRef]
- Kurihara, Y.; Bender, M.A.; Ross, R.J. An initialization scheme of hurricane models by vortex specification. Mon. Weather Rev. 1993, 121, 2030–2045. [Google Scholar] [CrossRef]
- Geer, A.J.; Bauer, P. Observation errors in all-sky data assimilation. Q. J. R. Meteorol. Soc. 2011, 137, 2024–2037. [Google Scholar] [CrossRef]
- Tian, X.; Zou, X. Development of the tangent linear and adjoint models of the MPAS-Atmosphere dynamic core and applications in adjoint relative sensitivity studies. Tellus 2020, 72, 1–17. [Google Scholar] [CrossRef]
Publisher’s Note: MDPI stays neutral with regard to jurisdictional claims in published maps and institutional affiliations. |
© 2021 by the authors. Licensee MDPI, Basel, Switzerland. This article is an open access article distributed under the terms and conditions of the Creative Commons Attribution (CC BY) license (https://creativecommons.org/licenses/by/4.0/).