Article

Delineation of Urban Agglomeration Boundary Based on Multisource Big Data Fusion—A Case Study of Guangdong–Hong Kong–Macao Greater Bay Area (GBA)

1
School of Geography and Planning, Sun Yat-sen University, Guangzhou 510275, China
2
School of Architecture and Planning, Yunnan University, Kunming 650031, China
3
Key Laboratory of the Sustainable Development of Xinjiang’s Historical and Cultural Tourism, Xinjiang University, Urumqi 830046, China
*
Author to whom correspondence should be addressed.
Remote Sens. 2021, 13(9), 1801; https://doi.org/10.3390/rs13091801
Submission received: 5 April 2021 / Revised: 30 April 2021 / Accepted: 2 May 2021 / Published: 5 May 2021
(This article belongs to the Special Issue Applications of AI and Remote Sensing in Urban Systems)

Abstract

:
The accurate delineation of urban agglomeration boundary is conductive to not only the better understanding of the development relationship between cities in urban agglomeration but also to the guidance of regional functions as well as the formulation of regional management policies. At the same time, the fusion of land relations and urban internal relations can greatly improve the accuracy of the delineation of urban agglomeration boundary. Still, for all that, previous studies delineated the boundary only from the perspective of land relations. In this study, firstly, wavelet transform is used to fuse Night-time Light data (NTL), POI (Point of Interest) data and Tencent Migration data, respectively. Then, the image is segmented by multiresolution segmentation to delineate the urban agglomeration boundary of GBA. Finally, the results are verified. The results show that the accuracy of urban agglomeration boundary delineated by NTL data is 85.57%, with the Kappa value as 0.6256, respectively. While, after fusing POI data, the accuracy is 88.97%, with the Kappa value as 0.7011, respectively. What is more, the accuracy of delineating urban agglomeration boundary by continuous fusion of population movement data reaches 93.60%, and that of Kappa value as 0.8155. Therefore, it can be concluded that compared with delineating the boundary of urban agglomeration only based on land relations, the fusion of population movement data of urban agglomerations by wavelet transform strengthens the interconnection between cities in urban agglomeration and contributes to the accurate division of urban agglomeration boundaries. What is more, such accurate delineation not only has important practical value for optimizing the spatial structure of urban agglomerations, but also assists in the formulation of regional management and development planning policies.

1. Introduction

Urban agglomeration is a brand new regional areal unit for a country to participate in global competition and international division of labor, and it is the most dynamic and potential growth pole in economic development [1]. China’s unique institutional environment makes the spatial evolution texture of Chinese urban agglomerations different from that of western countries, so as the scope and scale of it [2]. However, as an urban system with complex internal urban ecology, information exchange and so on [3,4], urban agglomeration would play an important role in both country and region with a greater impact far beyond the administrative boundaries no matter whether in China or a western country. Therefore, the accurate boundary delineation is of great significance to optimize the spatial structure of urban agglomeration.
However, it is a pity that there is still no unified delineation standard for the boundaries of urban agglomerations at present, instead, the boundary delineation in different urban agglomerations around the world is relative and somehow of local regional characteristics [5]. For China, it is increasingly difficult to delineate the boundary of urban agglomerations accurately. The reasons are as follows: first, the level of output, per capita output value, innovation input and urbanization process of China’s urban agglomerations are far lower than those of global urban agglomerations except for its administrative area; second, the rapid urbanization in China in recent years has accelerated the evolution of urban agglomerations [6]. Therefore, it is an important prerequisite to study and understand urban agglomeration and the key to spatial optimization and governance of urban agglomeration in the future to determine the scope and boundary of urban agglomeration through scientific and accurate methods [7].
As basic data representing ground information, remote sensing satellite images are one of the most extensive bases for studying urban spatial structure. With the advantages of high resolution and fast collection speed, remote sensing satellite images gradually replace the traditional statistical data on economy and population [3]. While as the most common remote sensing data, NTL data could represent the intensity of urban activities and further represent the distribution characteristics of urban population and economy as well as evaluate the level of urbanization [8,9,10]. The NTL data including Defence Meteorological Program Operational Line-Scan System/Suomi National Polar-orbiting Partnership/Visible Infrared Imaging Radiometer Suite and Luoojia-01 are used by researchers to refer to and further carry out the identification of urban spatial structure [11], the comparison of urban development level [12], the extraction of urban built-up areas [13], and the delineation of urban boundaries [14], etc. On the one hand, the spatial resolution of Defence Meteorological Program Operational Line-Scan System data is only 1000m, which is so low that the research of Defence Meteorological Program Operational Line-Scan System data in urban space is not refined enough. Moreover, the time span of Defence Meteorological Program Operational Line-Scan System data is only from 1992 to 2013, so the time scale is too early to reflect the drastic changes of current urban space [15]. While, the appearance of Suomi National Polar-orbiting Partnership/Visible Infrared Imaging Radiometer Suite data improves the spatial resolution of NTL data from 1000 to 500 m. At the same time, NPP/VIIRS data can provide longer-time series of observation data, which all have made great progress in related studies of urban space [16]. However, for the study of urban space, the spatial resolution of 500 m is still too high, which makes the research of Defence Meteorological Program Operational Line-Scan System and Suomi National Polar-orbiting Partnership/Visible Infrared Imaging Radiometer Suite data focus more on the spatial scope of large geographic scale of metropolitan circle and urban agglomeration [17,18]. In October 2018, the emergence of Luojia-01 data provided new possibilities for detailed research on urban space. Compared to the Defence Meteorological Program Operational Line-Scan System and Suomi National Polar-orbiting Partnership/Visible Infrared Imaging Radiometer Suite data, with the spatial resolution of 130 m, Luojia-01 data greatly improve the observation precision of the urban space, higher observation precision also makes the study of NTL in urban space shift from large geographic scales such as urban agglomeration and metropolitan circle to small and medium geographic scales [19,20]. However, due to the short time series of Luojia-01 data, less observation images can be provided, making it difficult for Luojia-01NTL data to be applied in multiperiod simulation of urban spatial structure [21].
At present, as a widely used geospatial data, POI data mainly expresses the spatial form of urban functions by reflecting the density range of the data in geographic space, which has a good application in the extraction of urban built-up areas and the identification of urban centers [22,23]. However, the relatively single attribute of POI density not only makes the study of POI data in urban space focus more on the form of spatial function, but also makes the expression of structural characteristics of urban function not deep enough [24]. Therefore, researchers began to try to fuse the two kinds of data in related studies due to the advantages and disadvantages of POI data and NTL data, respectively [22]. Data fusion is one of the important directions of data analysis [25], which has been widely used in urban spatial analysis [26], urban calculation [27] and other aspects. Data fusion refers to the fusion of the data acquired by different sensors of the same target or in the same region. The fused data can not only reflect the information of different data, but also make a more comprehensive and accurate judgment on the target and region [28,29]. In addition, data fusion can improve the efficiency and effectiveness of the data after fusion while retaining the characteristics of different data, thereby improving the accuracy of data in use [30,31]. The development of existing data fusion research has evolved from simple addition to arithmetic averaging to pyramid fusion, but the results obtained after data fusion are not much better than that before the fusion [32]. From the perspective of basic image fusion of data, image fusion at pixel scale is the most basic and important way of fusion of images [33]. It has been shown that in existing studies that due to the high spatial correlation between NTL data and POI data in cities [34], the accuracy of urban built-up area extraction [35], urban spatial structure identification [36], urban boundary division [37] has been greatly improved after the fusion of NTL data and POI data. It can be found that the fusion of POI data and NTL data makes the related research of urban space more refined [38,39], which indicates that data fusion is one of the important directions of future research [40].
Tencent Migration data is an index of population movement in a fixed area within a certain period of time provided by Amap of Tencent, which reflects the population movement in a short period of time [41]. Compared with Baidu heat map and other data, Tencent Migration Data has the advantages of more extensive data coverage and more accurate sampling with the help of Tencent APP. With these advantages, Tencent Migration data plays an important role in reflecting the inter-regional movement of urban population [42], especially in providing important support for the risk assessment of epidemic transmission during COVID-19 in 2020 [43,44]. In the current study of urban agglomeration, data including NTL data and POI data are mainly used to delineate the boundary of urban agglomeration from the perspective of urban spatial structure and urban functional form with the help of land relations [45]. Although some studies have explored the relationship between urban population movement and urban boundaries, few studies have fully considered the relationship between urban population and urban land in delineating urban agglomeration boundaries [46,47]. However, it is well known that the boundary of urban agglomeration is not only the boundary of urban construction land, the delineation of urban infrastructure and urban functional form [2,48], but also the relationship of population movement within urban agglomeration [49]. Therefore, the delineation of urban boundary should fully consider the relationship between population and land.
Through sorting out and comparing research on the delineation of urban agglomeration boundaries, it can be found that the delineation of urban agglomeration boundaries mainly focuses on the following aspects: first, the boundary of urban agglomeration is delineated by the basic theories of urban agglomeration, including the central place theory [50], growth pole theory [51], fractal theory [52], agglomeration and diffusion effect of classical geography [53], in an attempt to explain and clarify the relatively fuzzy boundary problem of urban agglomeration from geological theory. Second, the delineation of urban boundaries is based on model calculation and simulation, including urban gravity model [54], gravity model [55], urban network model [56], Voronoi diagram and so on [57] to quantitatively simulate and measure the scope of urban agglomeration. Using these spatial model methods, the boundary of urban agglomeration can be well delineated quantitatively. Third, spatial big data is widely used in the delineation of urban boundaries. In the past, the traditional population, economy, transportation and other statistical data were used by spatial econometric methods [58,59], which caused that the boundaries of urban agglomerations failed to reflect the regional cooperation and regional influence of urban agglomerations [60,61,62]. Therefore, it is necessary to adopt research methods suitable for spatial big data to effectively delineate the most real boundaries of urban agglomerations.
GBA is a world-class urban agglomeration with the highest degree of openness and the strongest economic vitality in China. However, at present, the boundary of the urban agglomeration in the area is determined by administrative divisions and socioeconomic indicators, which greatly limits the spatial regional development within the urban agglomeration [63]. In this study, Luojia-01 data, POI data and Tencent Migration data are fused to delineate the urban agglomeration boundary with the help of multiresolution segmentation. Finally, the segmentation results are tested and comparatively analyzed.

2. Materials and Methods
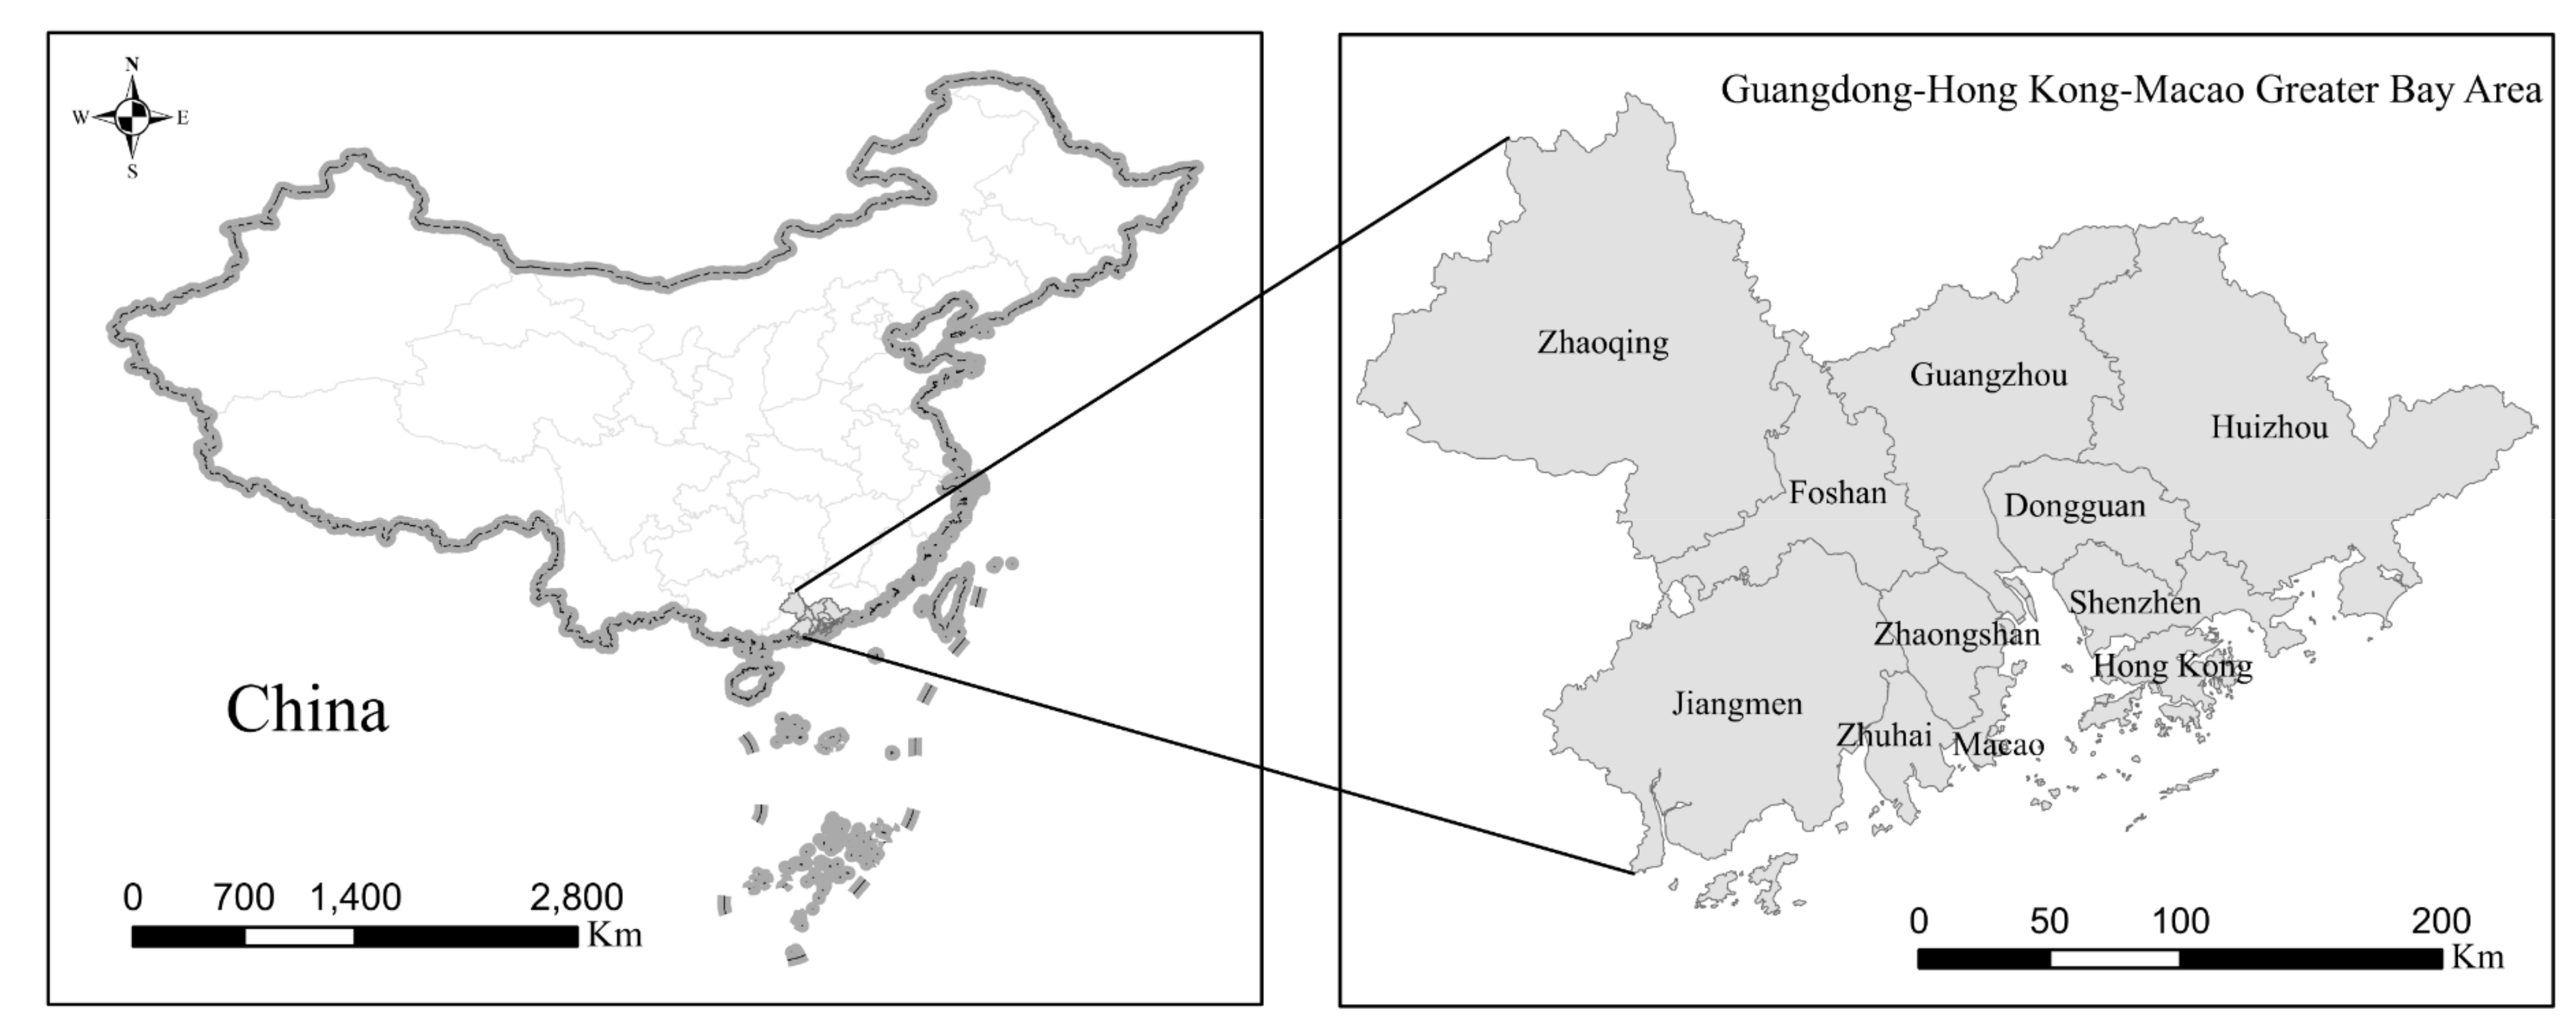
2.1. Study Area

Located in the Pearl River Delta region, GBA consists of the two special administrative regions of Hong Kong and Macao, and nine cities in Guangdong Province, including Guangzhou, Shenzhen, Zhuhai, Foshan, Huizhou, Dongguan, Zhongshan, Jiangmen, and Zhaoqing (Figure 1). With a total area of 56,000 square kilometers and a total population of 70 million in 2018, GBA is the largest urban agglomeration currently under construction in China and is playing an important strategic role in China’s national development [47]. Therefore, accurate delineation of the boundaries of the urban agglomeration in GBA will not only help to accurately determine the urbanization status of the area, thereby formulating corresponding regional development policies, but also could greatly contribute to provide an important reference for the healthy and rapid development of urban agglomerations in both China and the whole world.

2.2. Study Data

The data used in this study include Luojia-01 data, POI data, Tencent Migration data and Google Earth data.

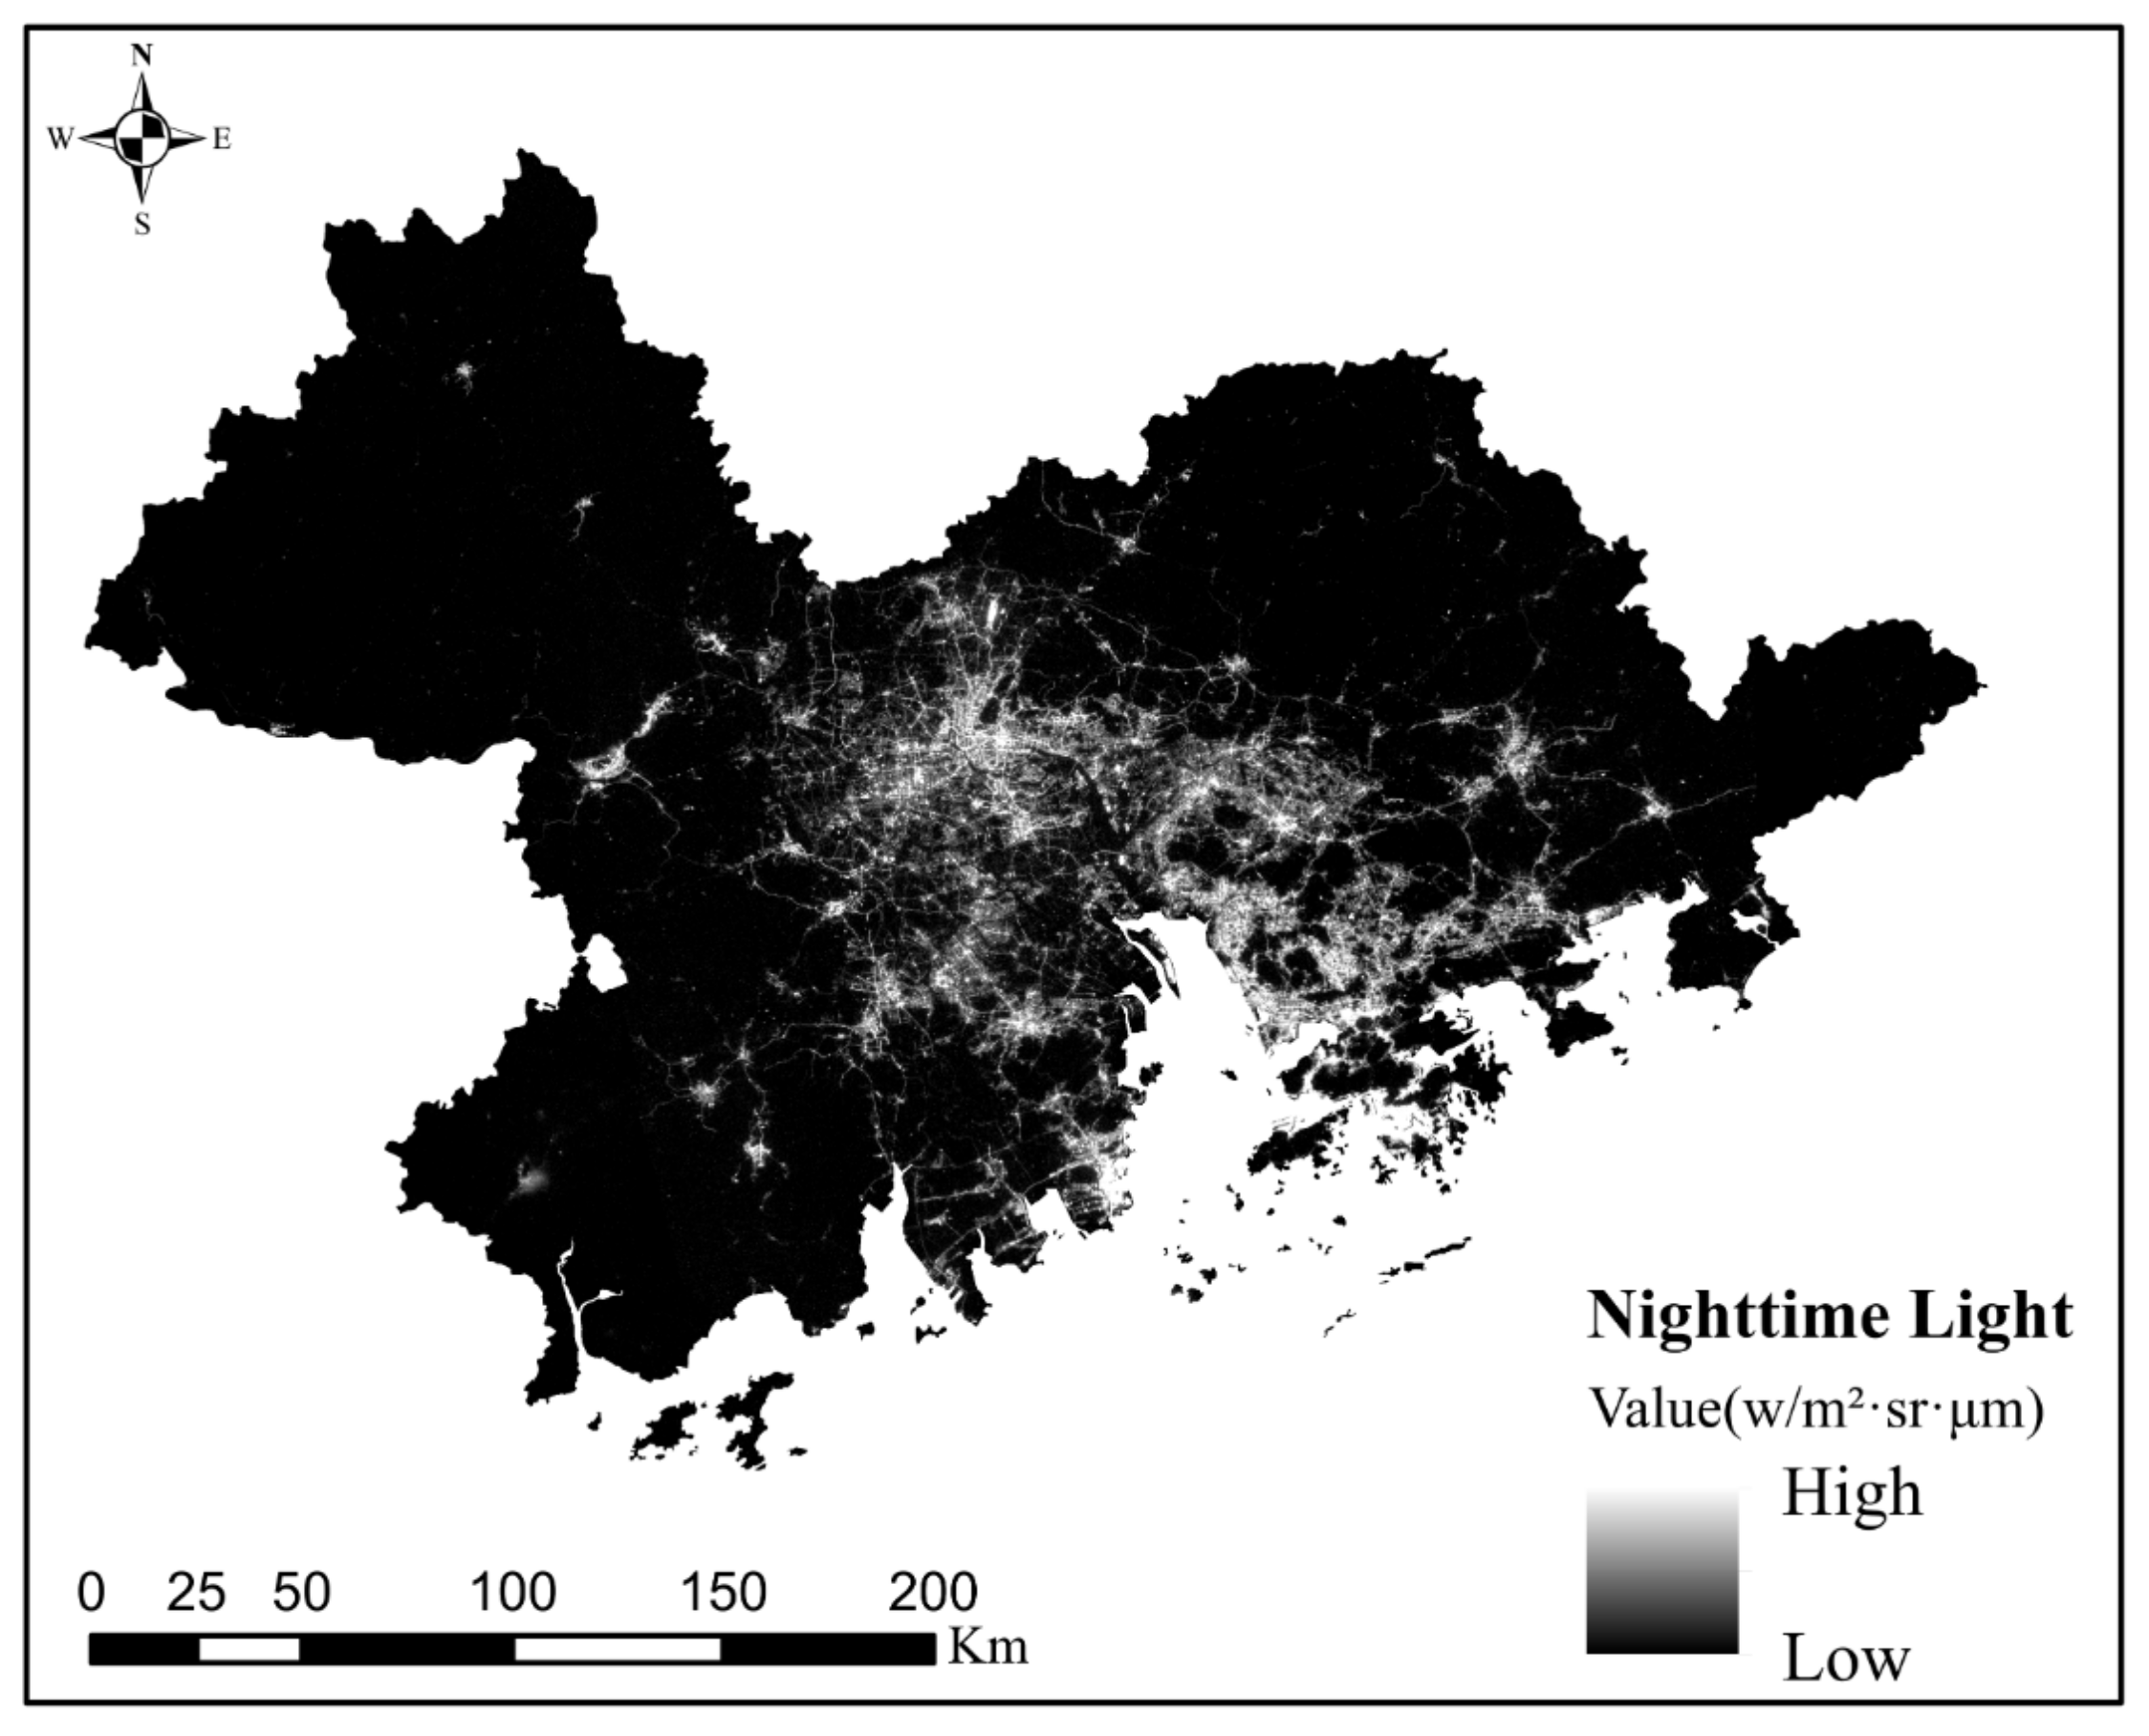
2.2.1. Night-Time Light Data

Luojia-01 night-time light data was launched by Wuhan University in 2018. It is equipped with a large field of view and highly sensitive night-light remote sensing camera, which has the capability of 130m resolution and 260km width night-light imaging. Luojia-01 data can be obtained from Hubei Data and Application Network of High-Resolution Earth Observation System (http://59.175.109.173:8888/index.html, accessed on 25 March 2021), where it provides a free download service. Luojia-01 data proposed the satellite-borne coupled stray light avoidance method and the dynamic range extension method of combined gain processing to construct the in-orbit geometric radiation calibration model of "daytime imaging calibration + night imaging correction". LuoJia-01 data implements nocturnal imaging with high sensitivity, high dynamic range and high geometric radiation quality, which is in the leading position of similar satellite sensors in the world. In addition, Luojia-01 data also proposes a weak rendezvous plane-area net adjustment method, which makes its absolute geometric accuracy superior to other night-time light data. The Luojia-01 data of GBA from October 2018 to March 2019 were obtained through the website, and the preprocessing result of monthly average processing was conducted to obtain the NTL data in Figure 2.

2.2.2. POI Data

POI generally refers to point data in Internet electronic maps, which basically contains four attributes: name, address, coordinate and category. It is derived from the vector data set of point map elements in the basic mapping result Digital Line Graphic. In Geographic Information System, it refers to an object that can be abstracted into points for management, analysis and calculation. The amount of POI data represents the development level of a city to some extent. As for the POI data used in this study, it was obtained by using the Application Programming Interface of Amap (www.amap.com). Although there are as many as 22 kinds of POI data, parts of PO1 data do not have practical significance. Therefore, 14 kinds POI data of GBA were finally obtained after screening, filtering and cleaning of POI data obtained in 2021, with a total number of 2,477,184. The POI data of each city and the corresponding classification are shown in Table 1.

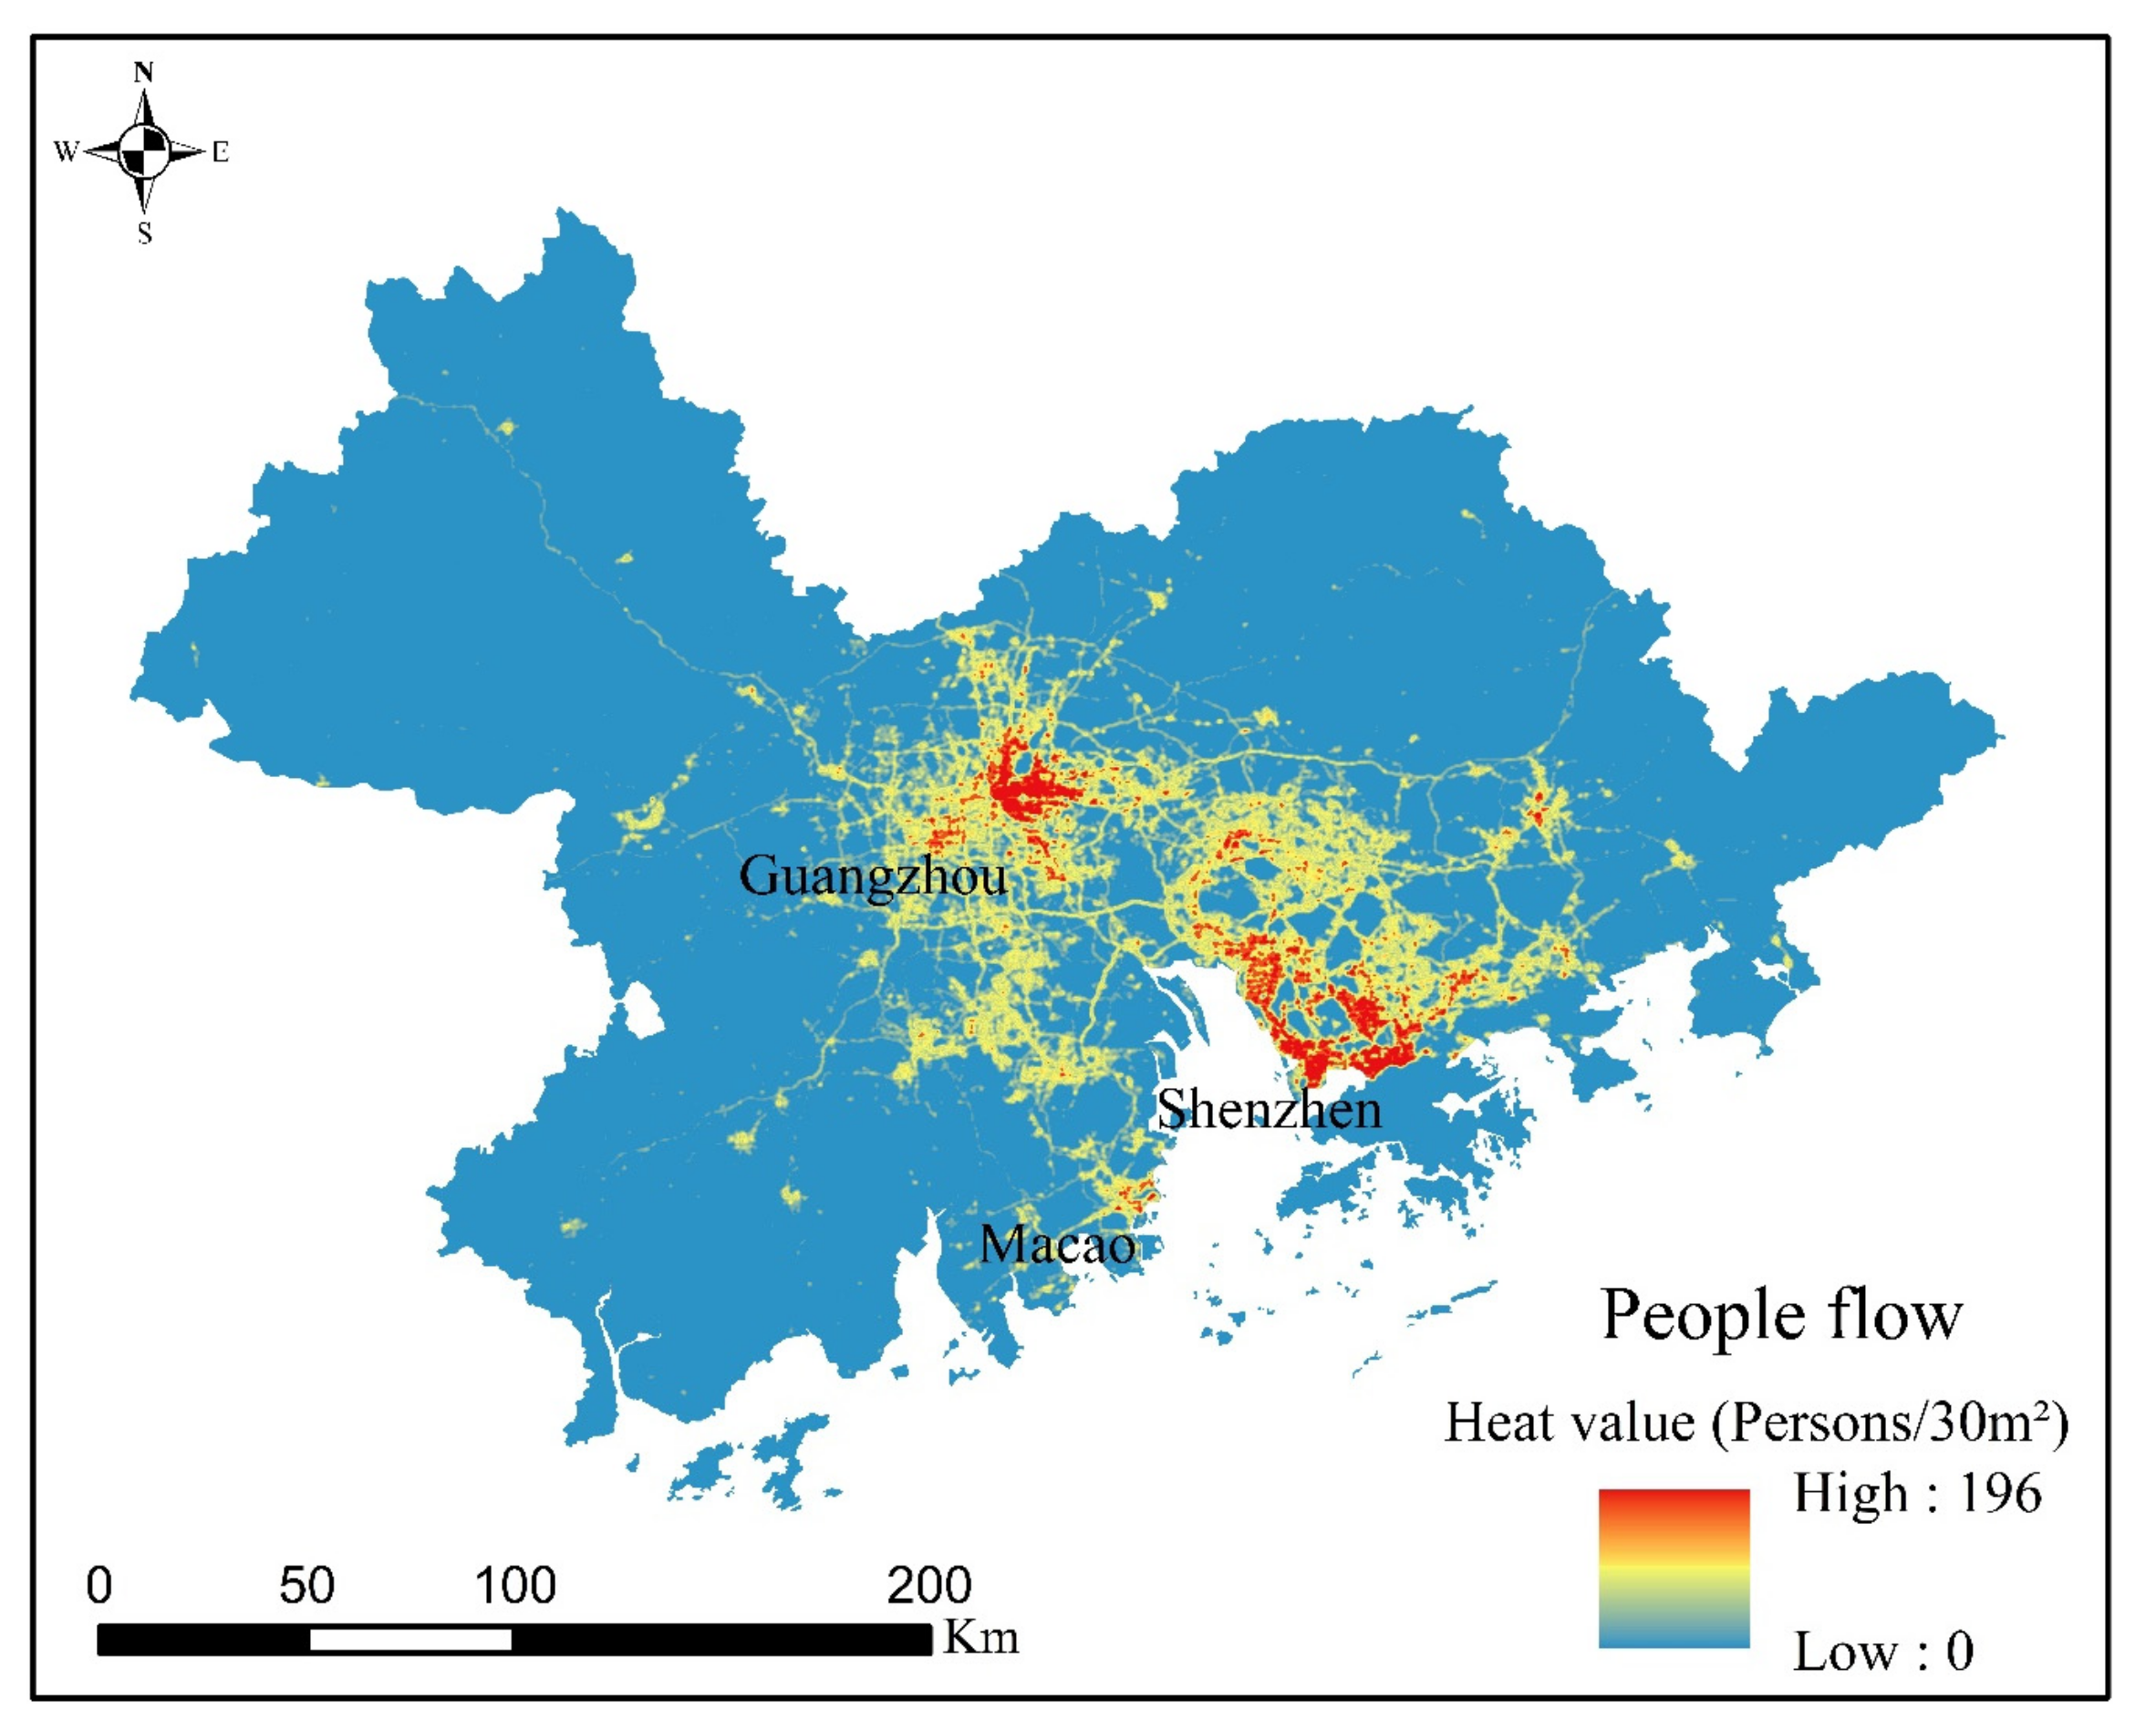
2.2.3. Population Movement Data
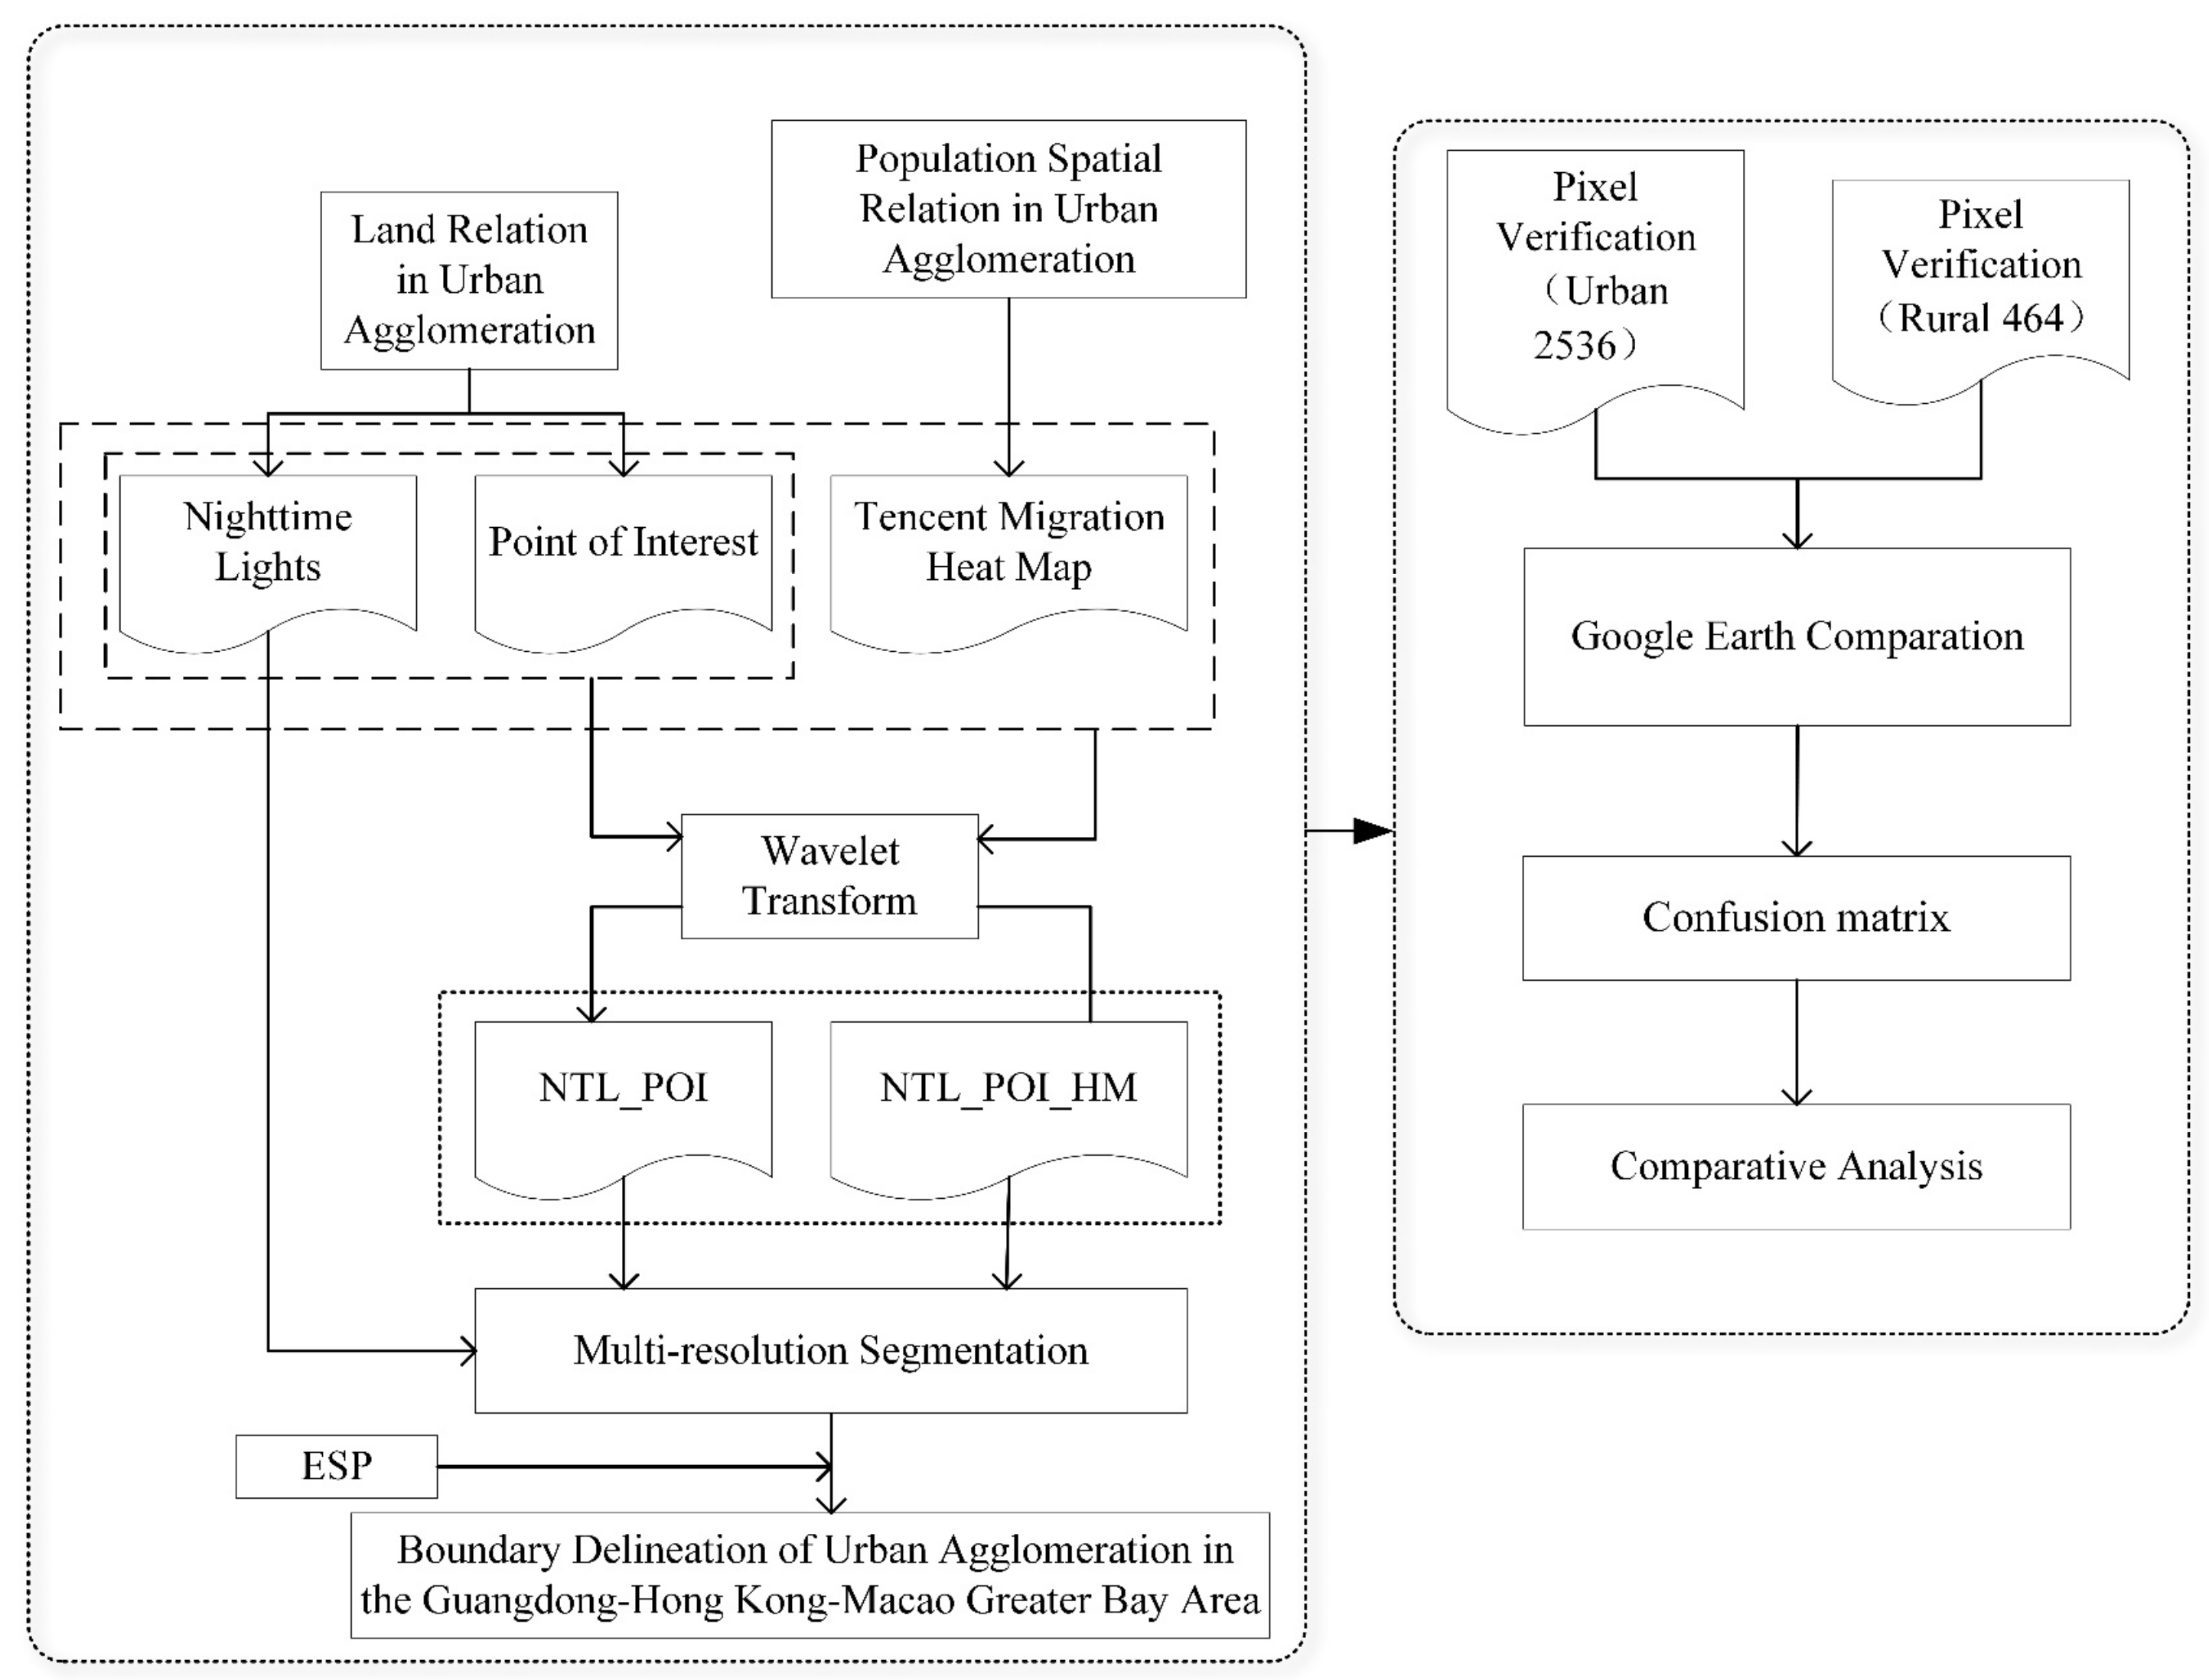
Tencent migration data shows the regional population flow and the overall proportion of the geographical area where the population is in the designated area in the form of special highlighting. Tencent Migration data from January 2020 to January 2021 of GBA was also obtained by using the Application Programming Interface of Amap (www.amap.com, accessed on 25 March 2021). Then the heat map of population movement in the area (Figure 3) was obtained by performing the monthly average processing of the data. The reference verification data is a high-resolution satellite image of the area in March 2021 provided by Google Earth, with a spatial resolution of 4.78 m. The use of the reference verification data is helpful for the final comparison and verification of the extracted urban agglomeration boundaries. The corresponding description of the data is shown in Table 2.

2.3. Methods

2.3.1. Kernel Density Analysis (KDA)

KDA is a method to simulate the spatial distribution by calculating the distribution density of points and lines in geographic space [64], so as to reflect the spatial agglomeration form of points and lines elements. The formula of kernel density analysis is as follows:
p i = 1 n π R 2 × j = 1 n k j 1 D i j 2 R 2 2
where, p i   stands for the nuclear density value of the spatial location,   D i j for the distance between the spatial point i and the research object j, n represents the spatial location where the distance is less than or equal to   D i j , k j stands for the spatial weight, and R the search radius. The geometric meaning of KDA is that the density value is the highest in each core, and the increase of spatial distance between the point and the core will lead to the decrease of density value until the kernel density value is 0. In addition, different search radius will lead to different results of nuclear density analysis. Therefore, the results of nuclear density analysis can be determined by the verified search radius. The formula of search radius is as follows:
0.9 × m i n S D , D m × 1 l n 2 × n 0.2
where, S D stands for the standard distance, D m for the median of the distance, and n for the number of event points.

2.3.2. Multiresolution Segmentation

At present, Multiresolution Segmentation is one of the most widely used methods [65]. The main reason is that image segmentation is the most important step for image classification and feature extraction in geographic image analysis [66]. On the other hand, Multiresolution Segmentation is one of the object-oriented algorithms, which can be implemented in the image recognition software such as Trimble eCognition. What is more, Multiresolution Segmentation is also a bottom-up segmentation algorithm, which can segment images more accurately on the premise of ensuring the heterogeneity and homogeneity of images. Therefore, it soon becomes one of the most important segmentation algorithms in the image analysis of geographic objects [67].
Multiresolution Segmentation segments the image into objects depending on the scale parameter. The scale parameter controls the internal heterogeneity of the image through Shape, Scale, and Compactness. The precision of Multiresolution Segmentation depends on the average size of the segmenting object, which is why the selection of an accurate scale parameter value becomes an important process of segmentation of remote sensing images. Visual judgment is considered to be one of the best evaluation methods at present, but the lack of automation makes it difficult to deal with large-scale image segmentation [68]. In 2010, relevant scholars proposed a new tool named ESP (Estimation of Scale Parameters) [69], which can continuously conduct scale tests on images to finally approximate the most appropriate scale parameter value, thus greatly improving the processing speed and accuracy of Multiresolution Segmentation.
In addition, the number of images after segmentation, the mean value of objects and the area of images can be obtained by using the scale parameters determined by ESP tool, and the weighted mean variance can be calculated to verify whether the segmentation effect is optimal.
C ¯ k = 1 n i = 1 n C i
C ¯ k = 1 m k = 1 m C ¯ K
S 2 = 1 m k = 1 m ( C ¯ k C ¯ ) 2
where n stands for the number of pixels of the geographical object after segmentation, C ¯ i for the DN (Digital Numbers) value of the pixel i in the k segment, m for the total number of geographical objects after segmentation, and S 2 for the weighted average variance of the DN value of the geographical object after segmentation.

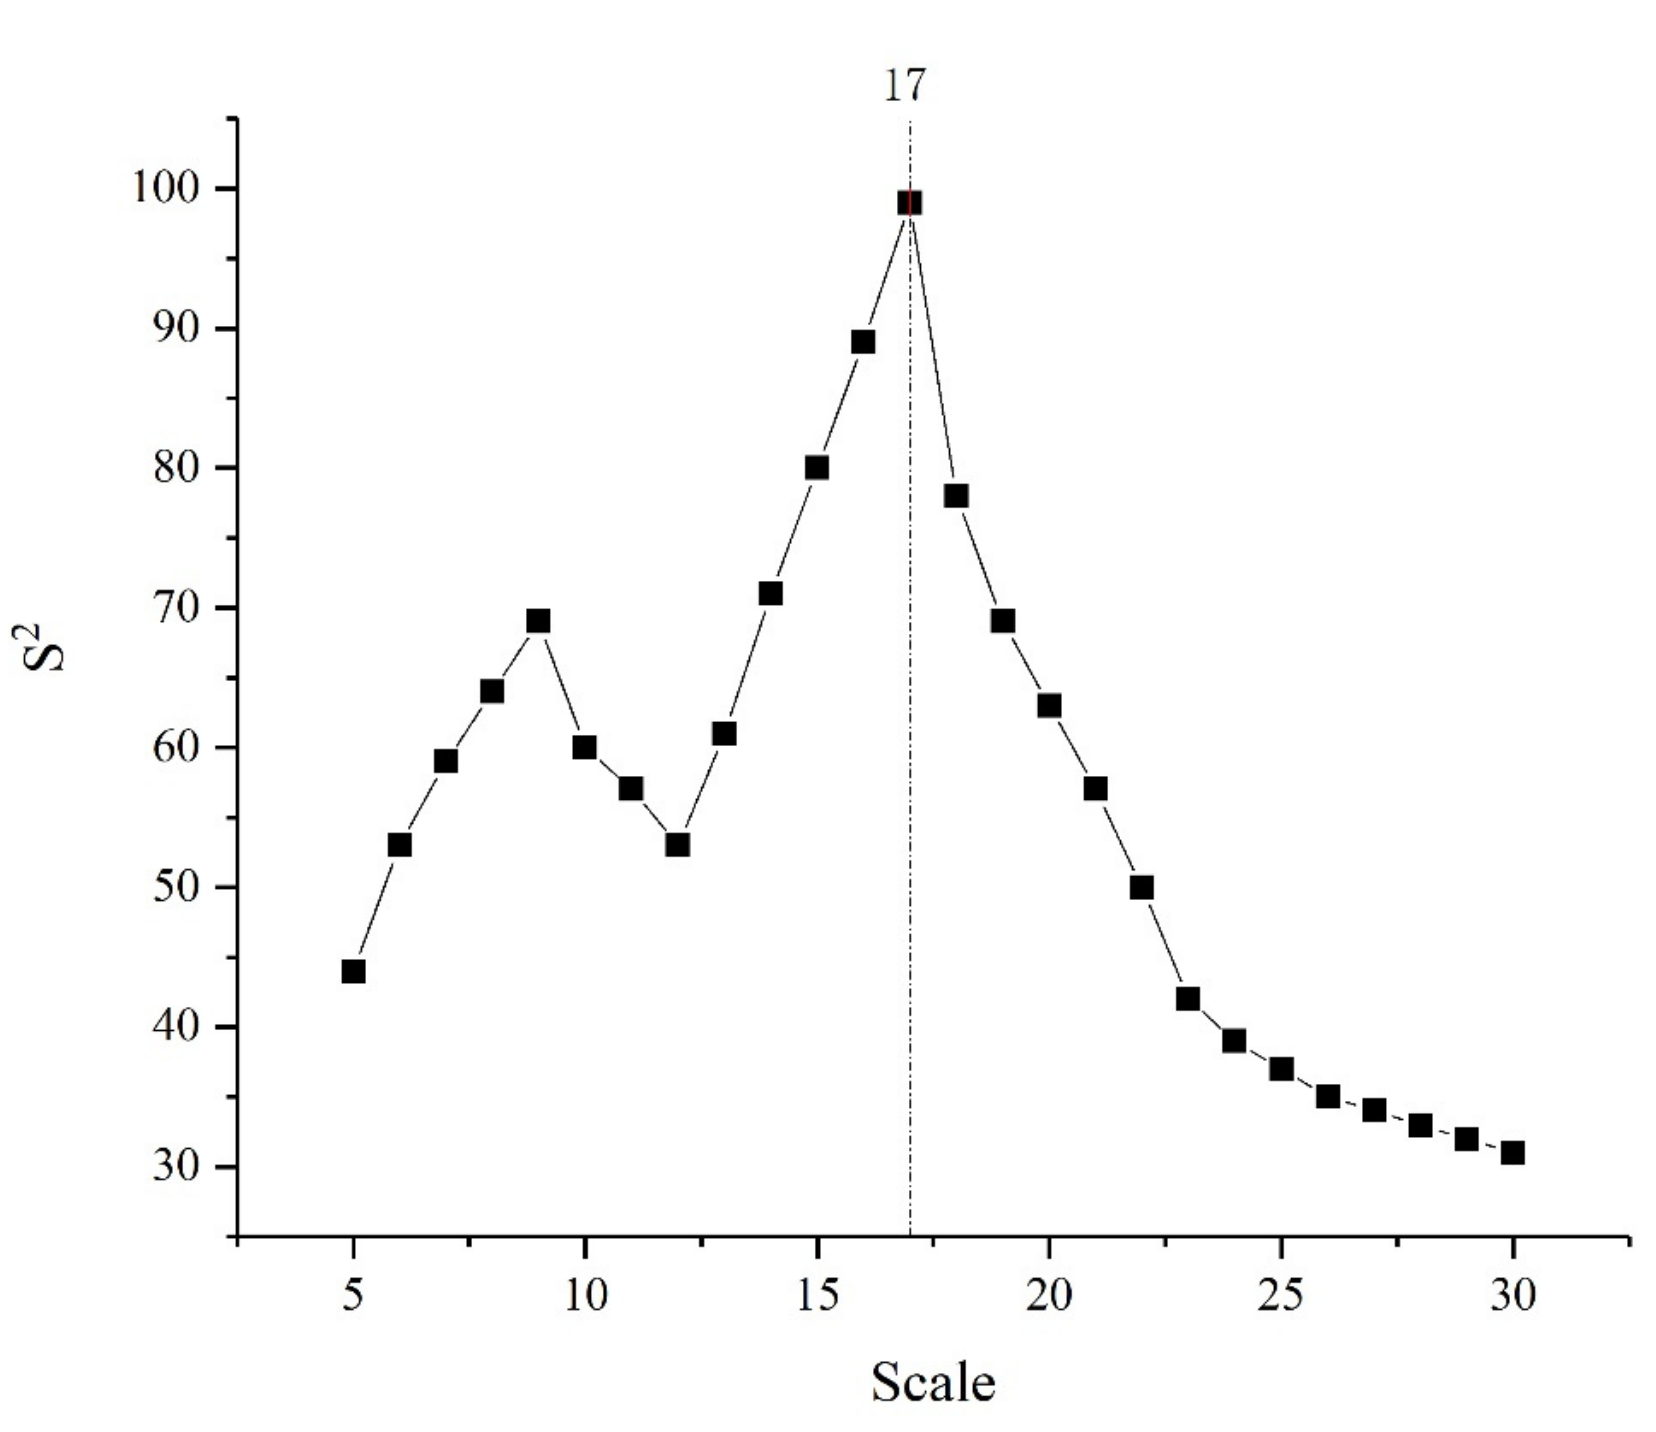
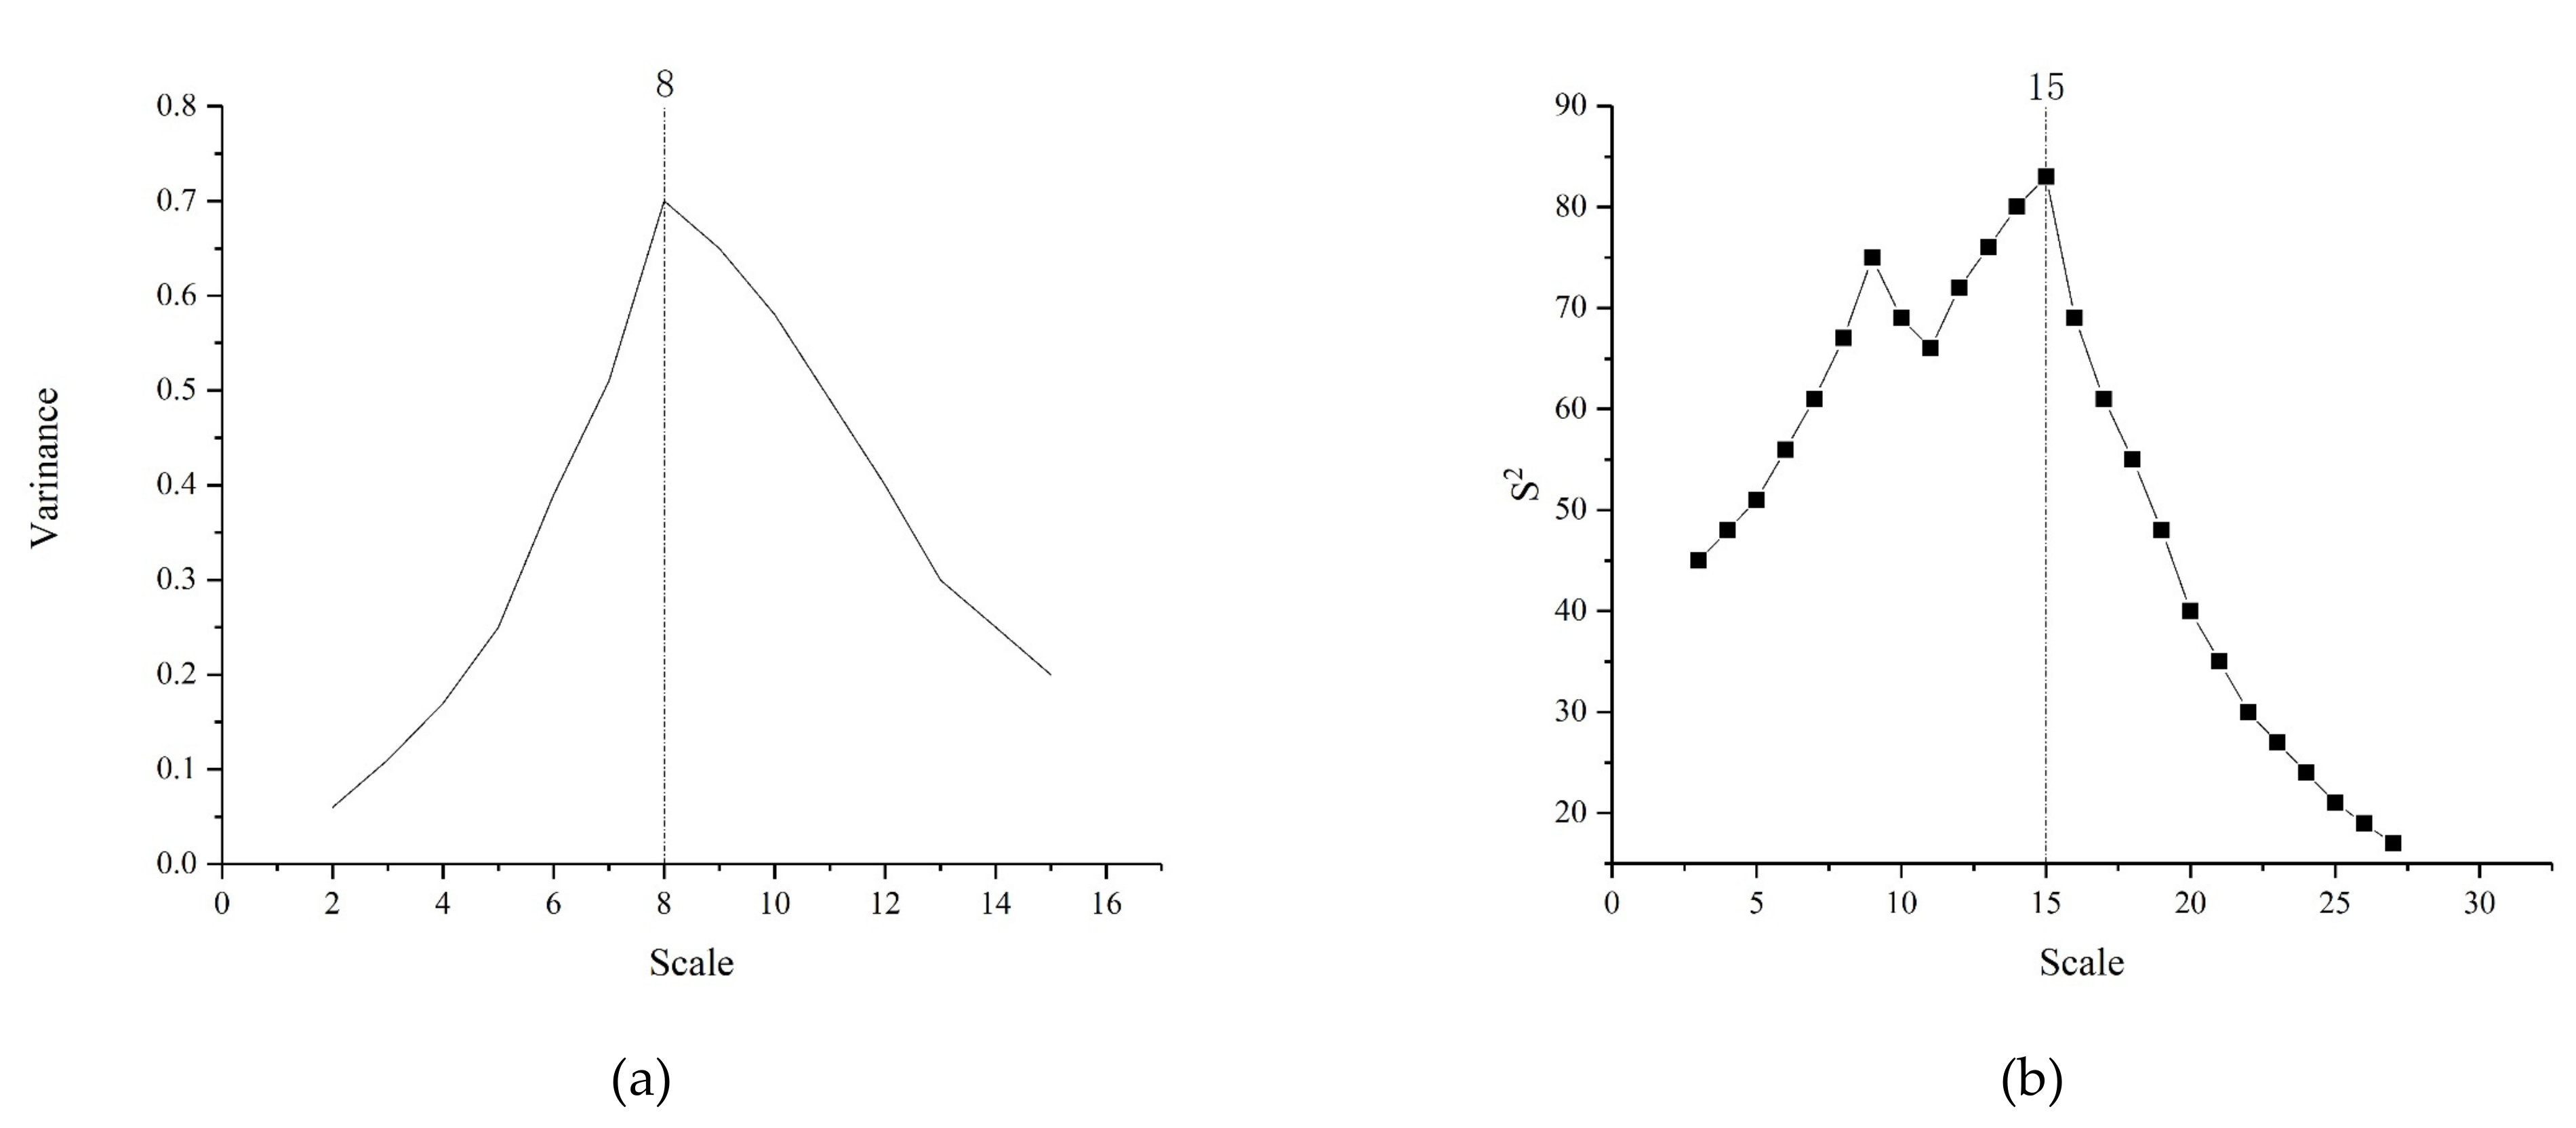
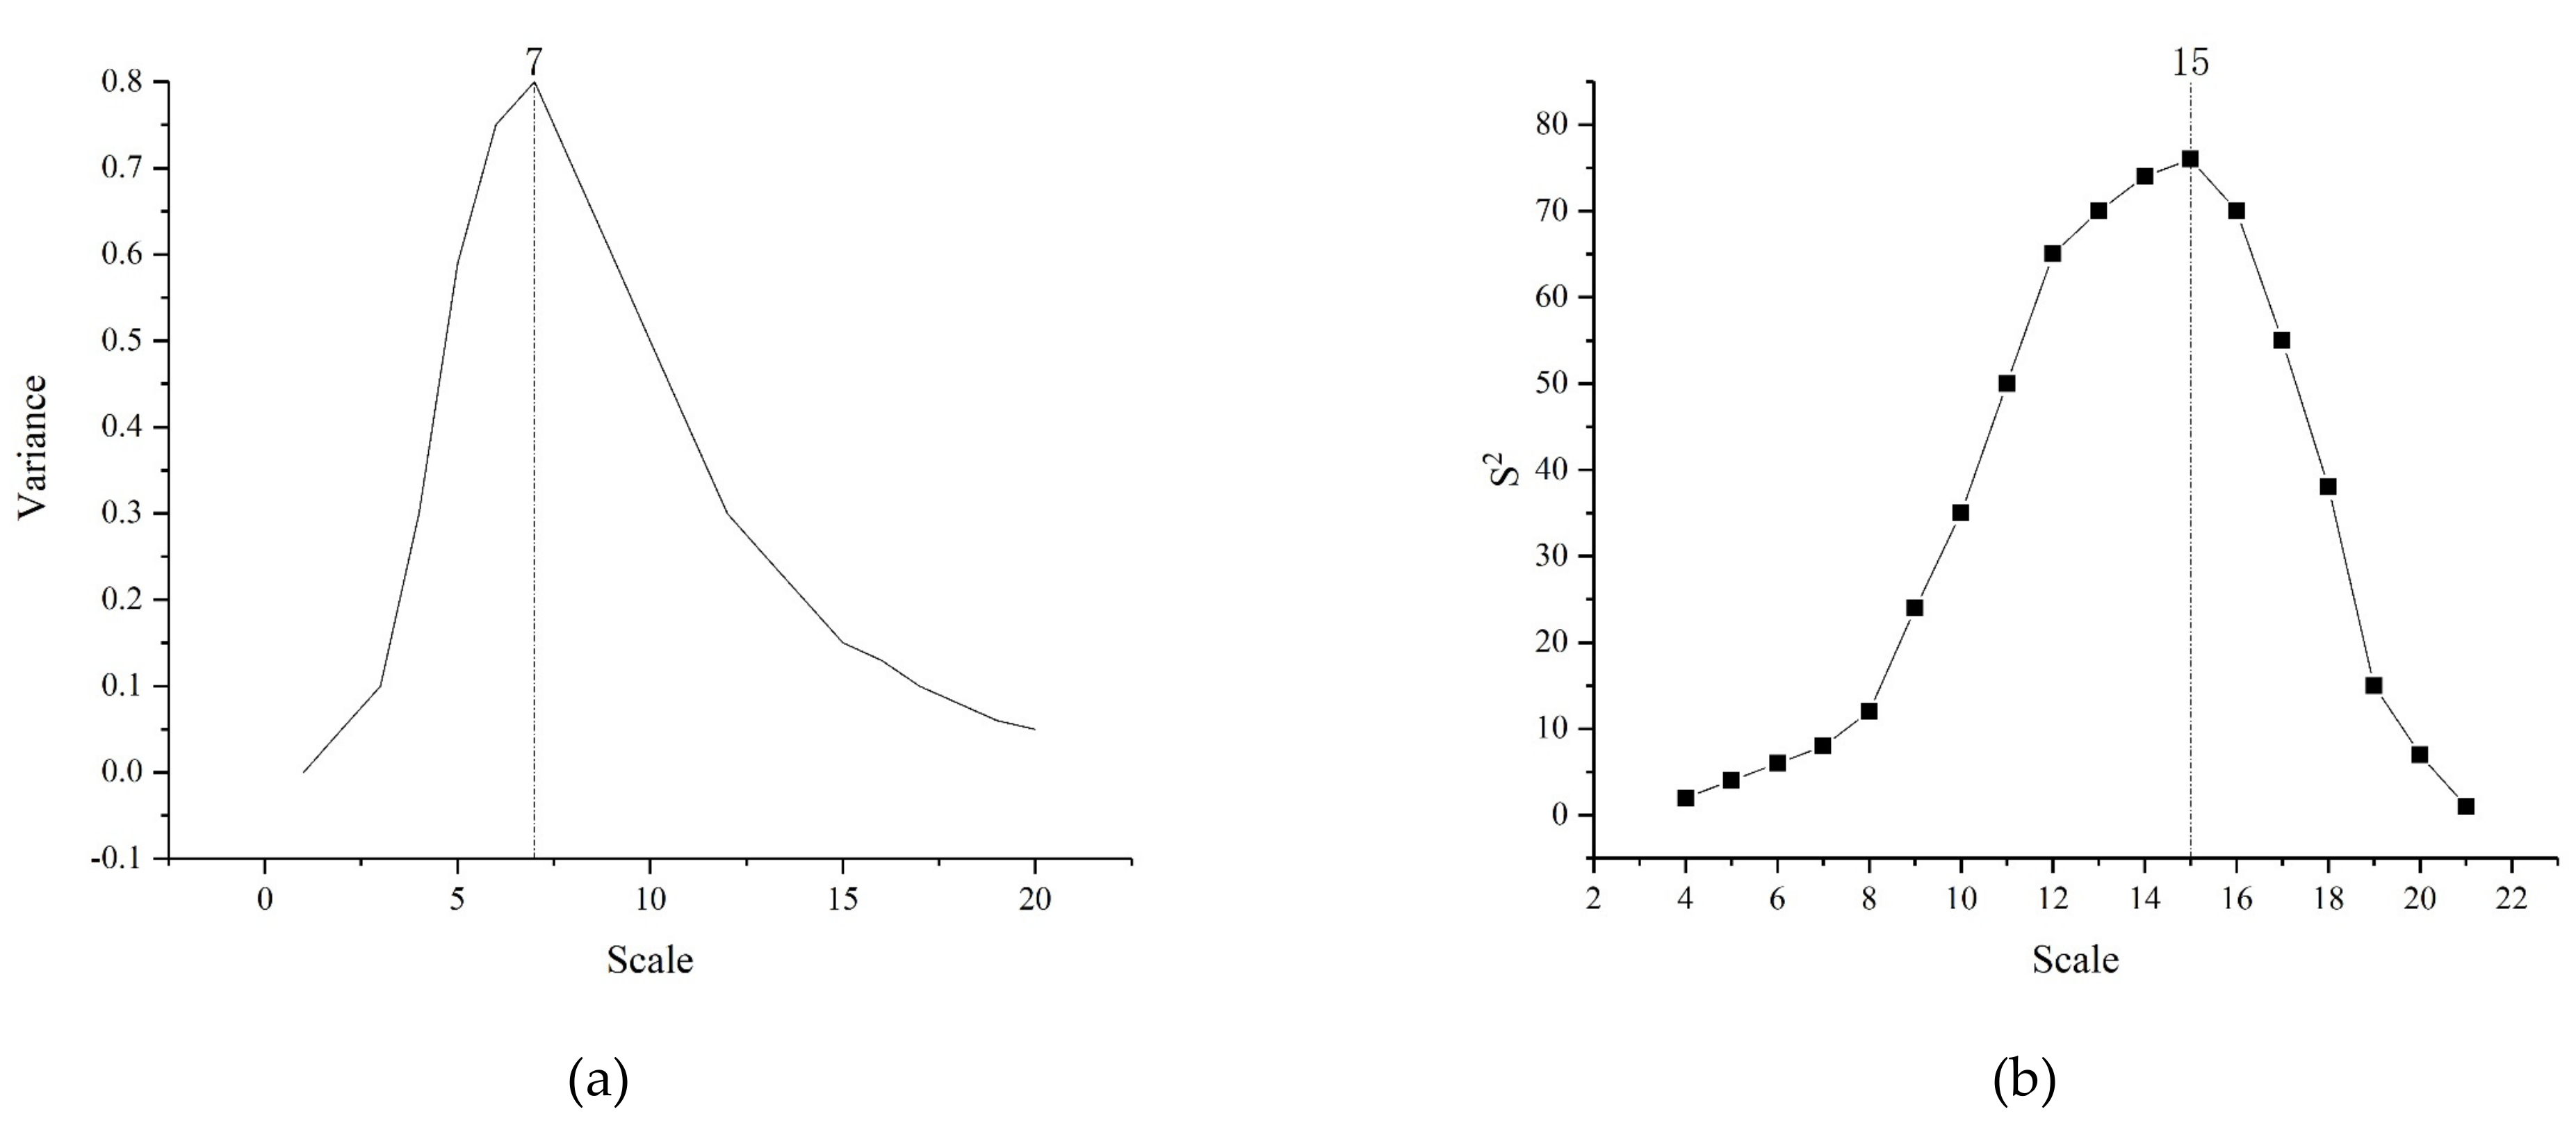
2.3.3. Wavelet Transform

The relationship between time and frequency in the image should be considered during the image fusion process. The wavelet transform has the function of amplification of localization in time and frequency [70], which is mainly realized by a time observation window that changes with frequency. The local features of time and frequency are focused to analyze some parts of the image, so as to achieve a good unification of frequency in the time domain. Wavelet transform can decompose the image into several time and frequency independent parts without losing the information contained in the original image [71]. The specific formula is as follows:
W T α , τ = f t φ t = 1 α f t + φ t b α d t
wherein, f t stands for the signal vector, φ t   for the wavelet function, and α , τ ,     b , respectively, represent the scale, translation and parameters.
The fundamental of wavelet transform is to segment the image which needed to be fused by wavelet transform, then the horizontal, vertical and diagonal high and low frequency components, that include the details of all images, can be obtained, respectively. Subsequently, the details of different images are compared in the wavelet transform domain, the appropriate scale is selected for image fusion, and finally the inverse wavelet transform is performed, and the resulting image is the final fused image [72].
The analysis structure of this study is shown in Figure 4.

3. Results

3.1. Boundaries of Urban Agglomerations Delineated by Different Data

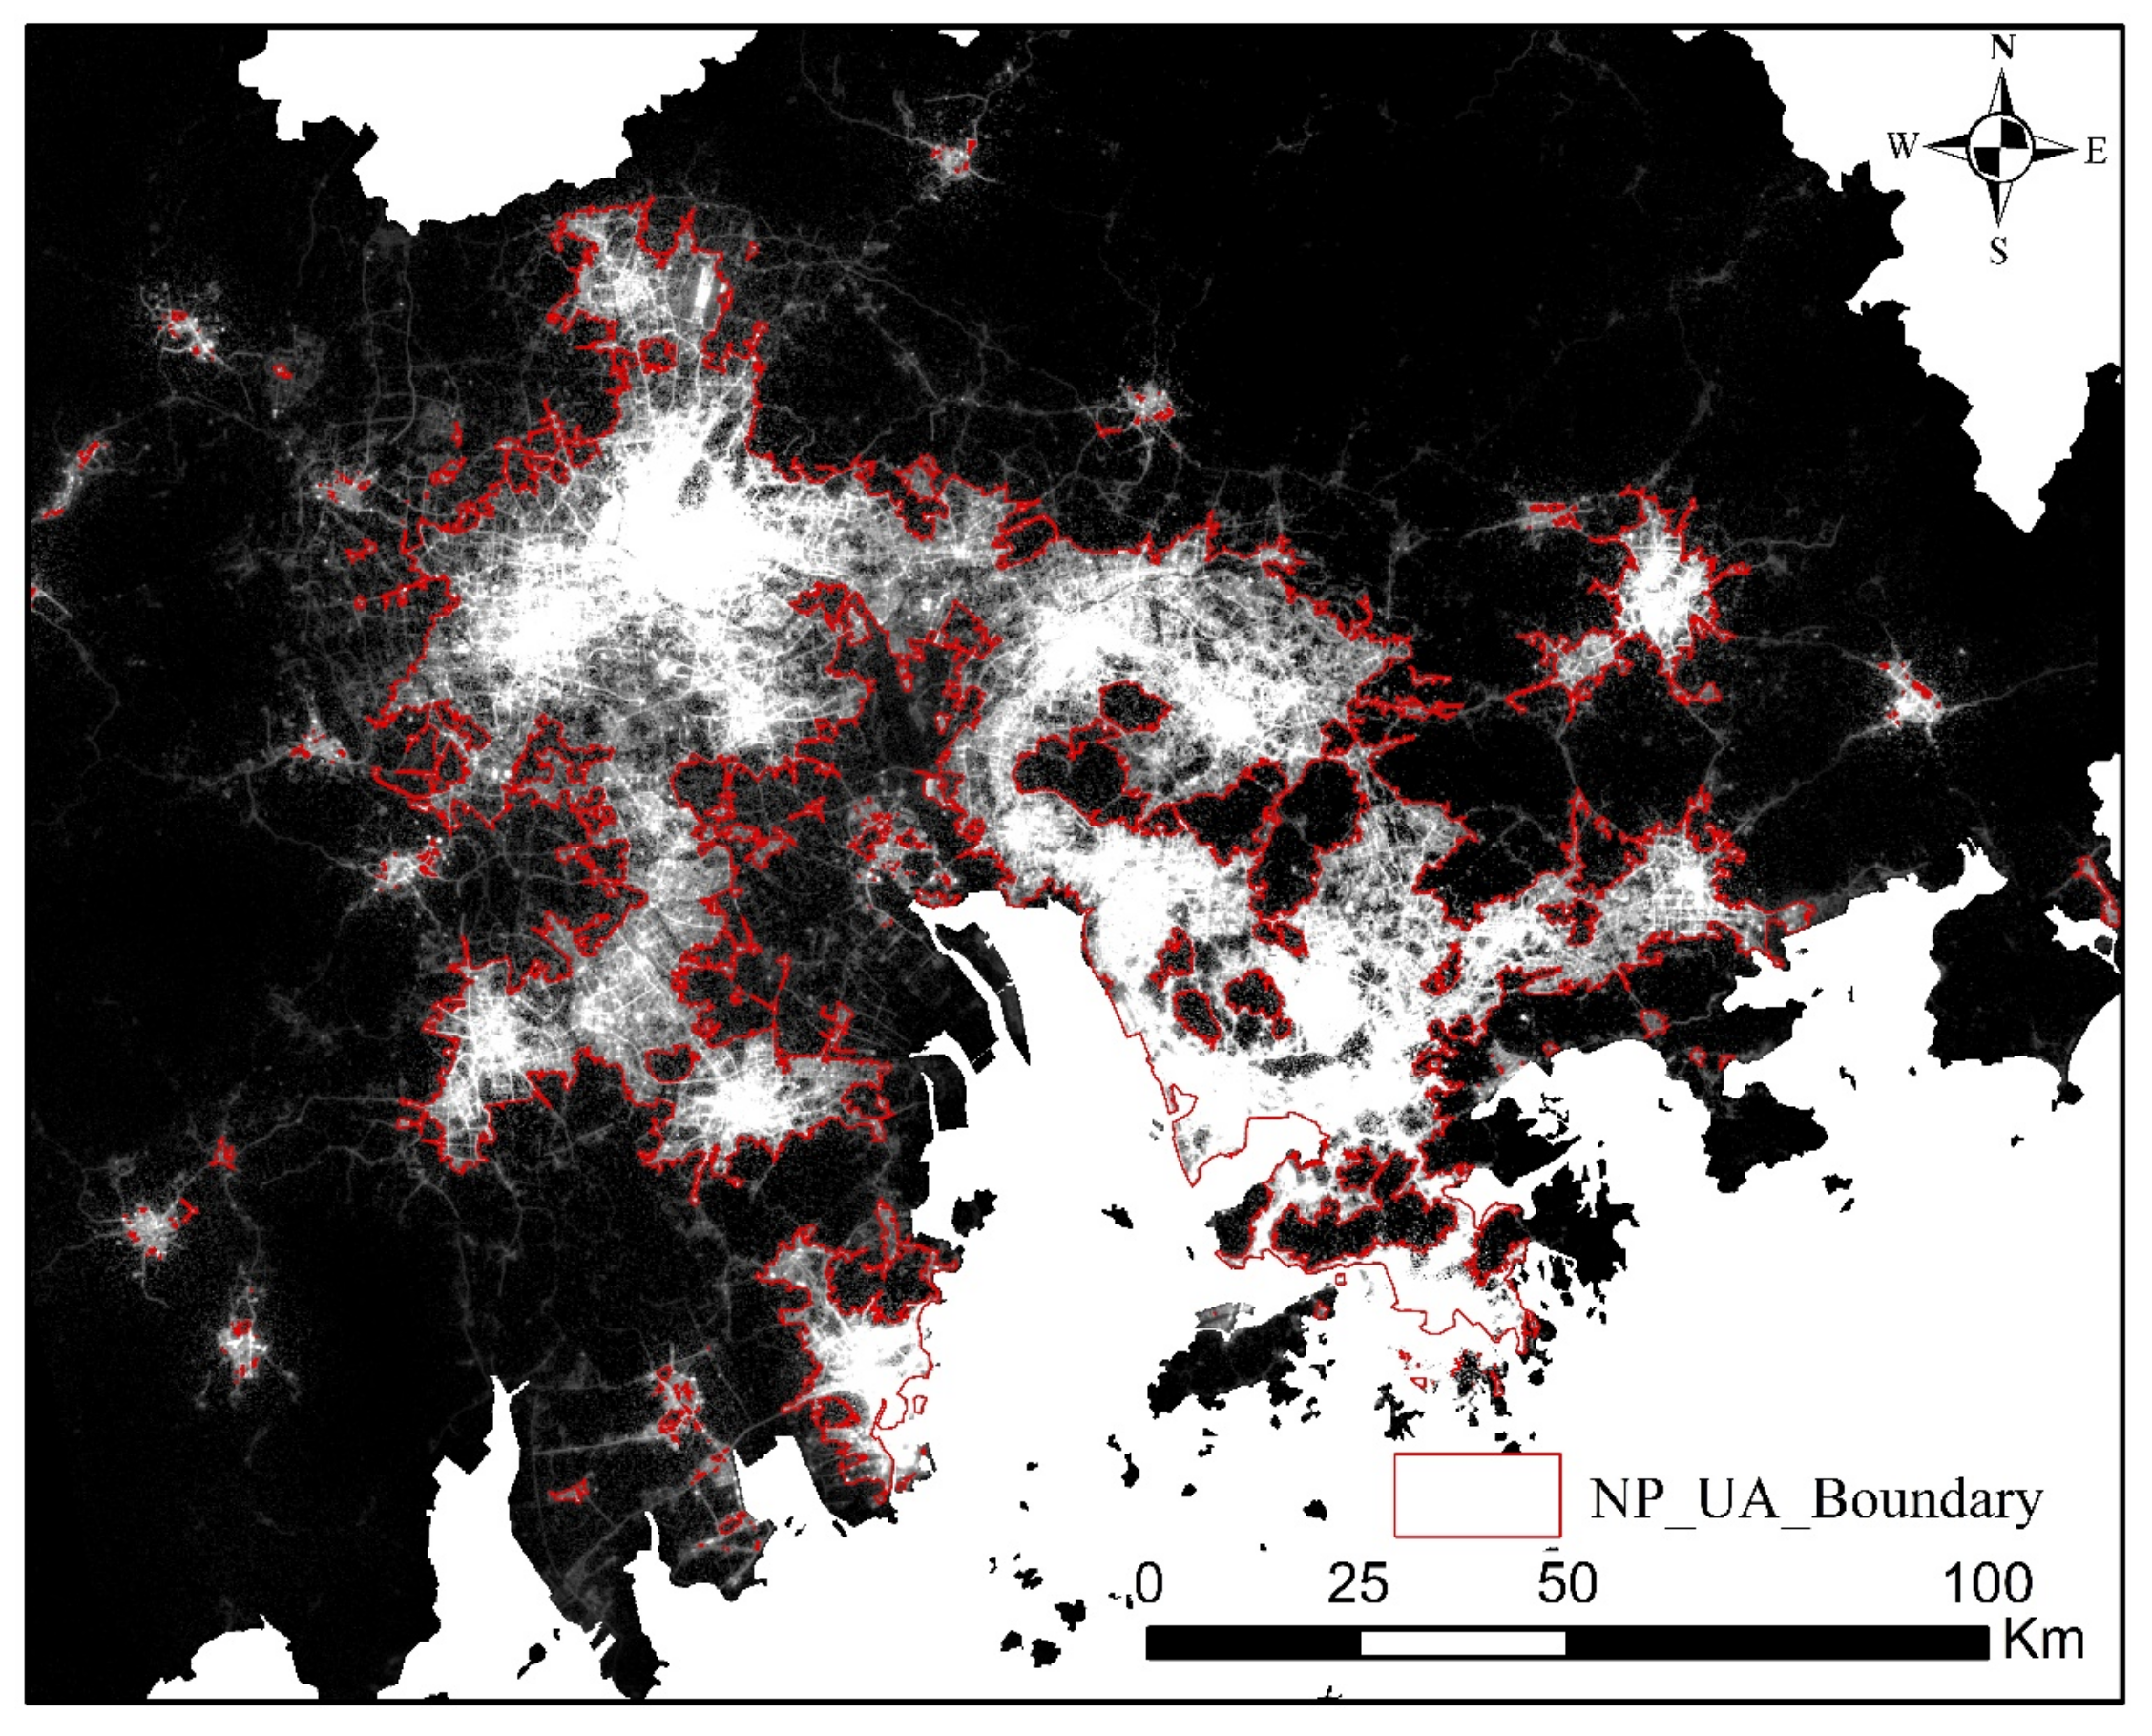
3.1.1. Boundary of the Urban Agglomeration Delineated by Luojia-01 Data

The airport was selected as the highest light threshold region, and the sea was selected as the lowest light threshold region for Luojia-01NTL data processing. According to the NTL map of GBA in Figure 2, it can be seen that the regions with high NTL values are located in the central and southern parts, including the main urban areas of Guangzhou, Shenzhen and Dongguan, as well as Macao and Hong Kong. NTL values are relatively lower in the western and northeastern parts of GBA, which also reflects that there are obvious differences in urbanization levels in the area.
In this study, image threshold segmentation was carried out by using cognition. Since different segmentation scales would change the number of segmentation regions, the weighted mean variance diagram of ESP and Scale (Figure 5) was used to determine the corresponding Scale parameters. The Scale, Shape, and Compactness values are 17, 0.4, and 0.6, respectively.
The image segmentation of Luojia-01NTL data was carried out by using Scale, Shape and Compactness, whose scale parameter values are 17, 0.4, 0.6. respectively. Then the boundary of the urban agglomeration in GBA was obtained as shown in Figure 6. It can be seen that the area of the urban agglomeration in the area delineated by NTL data is 8719.14 square kilometers, accounting for 15.57% of the administrative area. The delineated urban agglomeration regions are mainly concentrated in the main urban areas of Guangzhou, Foshan and Shenzhen, as well as Hong Kong and Macao. From the point of view of the urban agglomeration boundaries delineated by NTL, the urban agglomeration boundaries of Guangzhou, Hong Kong and Macao are relatively more complete, while the boundary of urban agglomerations in other regions is more fragmented, which is caused by the appearance of several light clusters due to the different brightness of the light values.

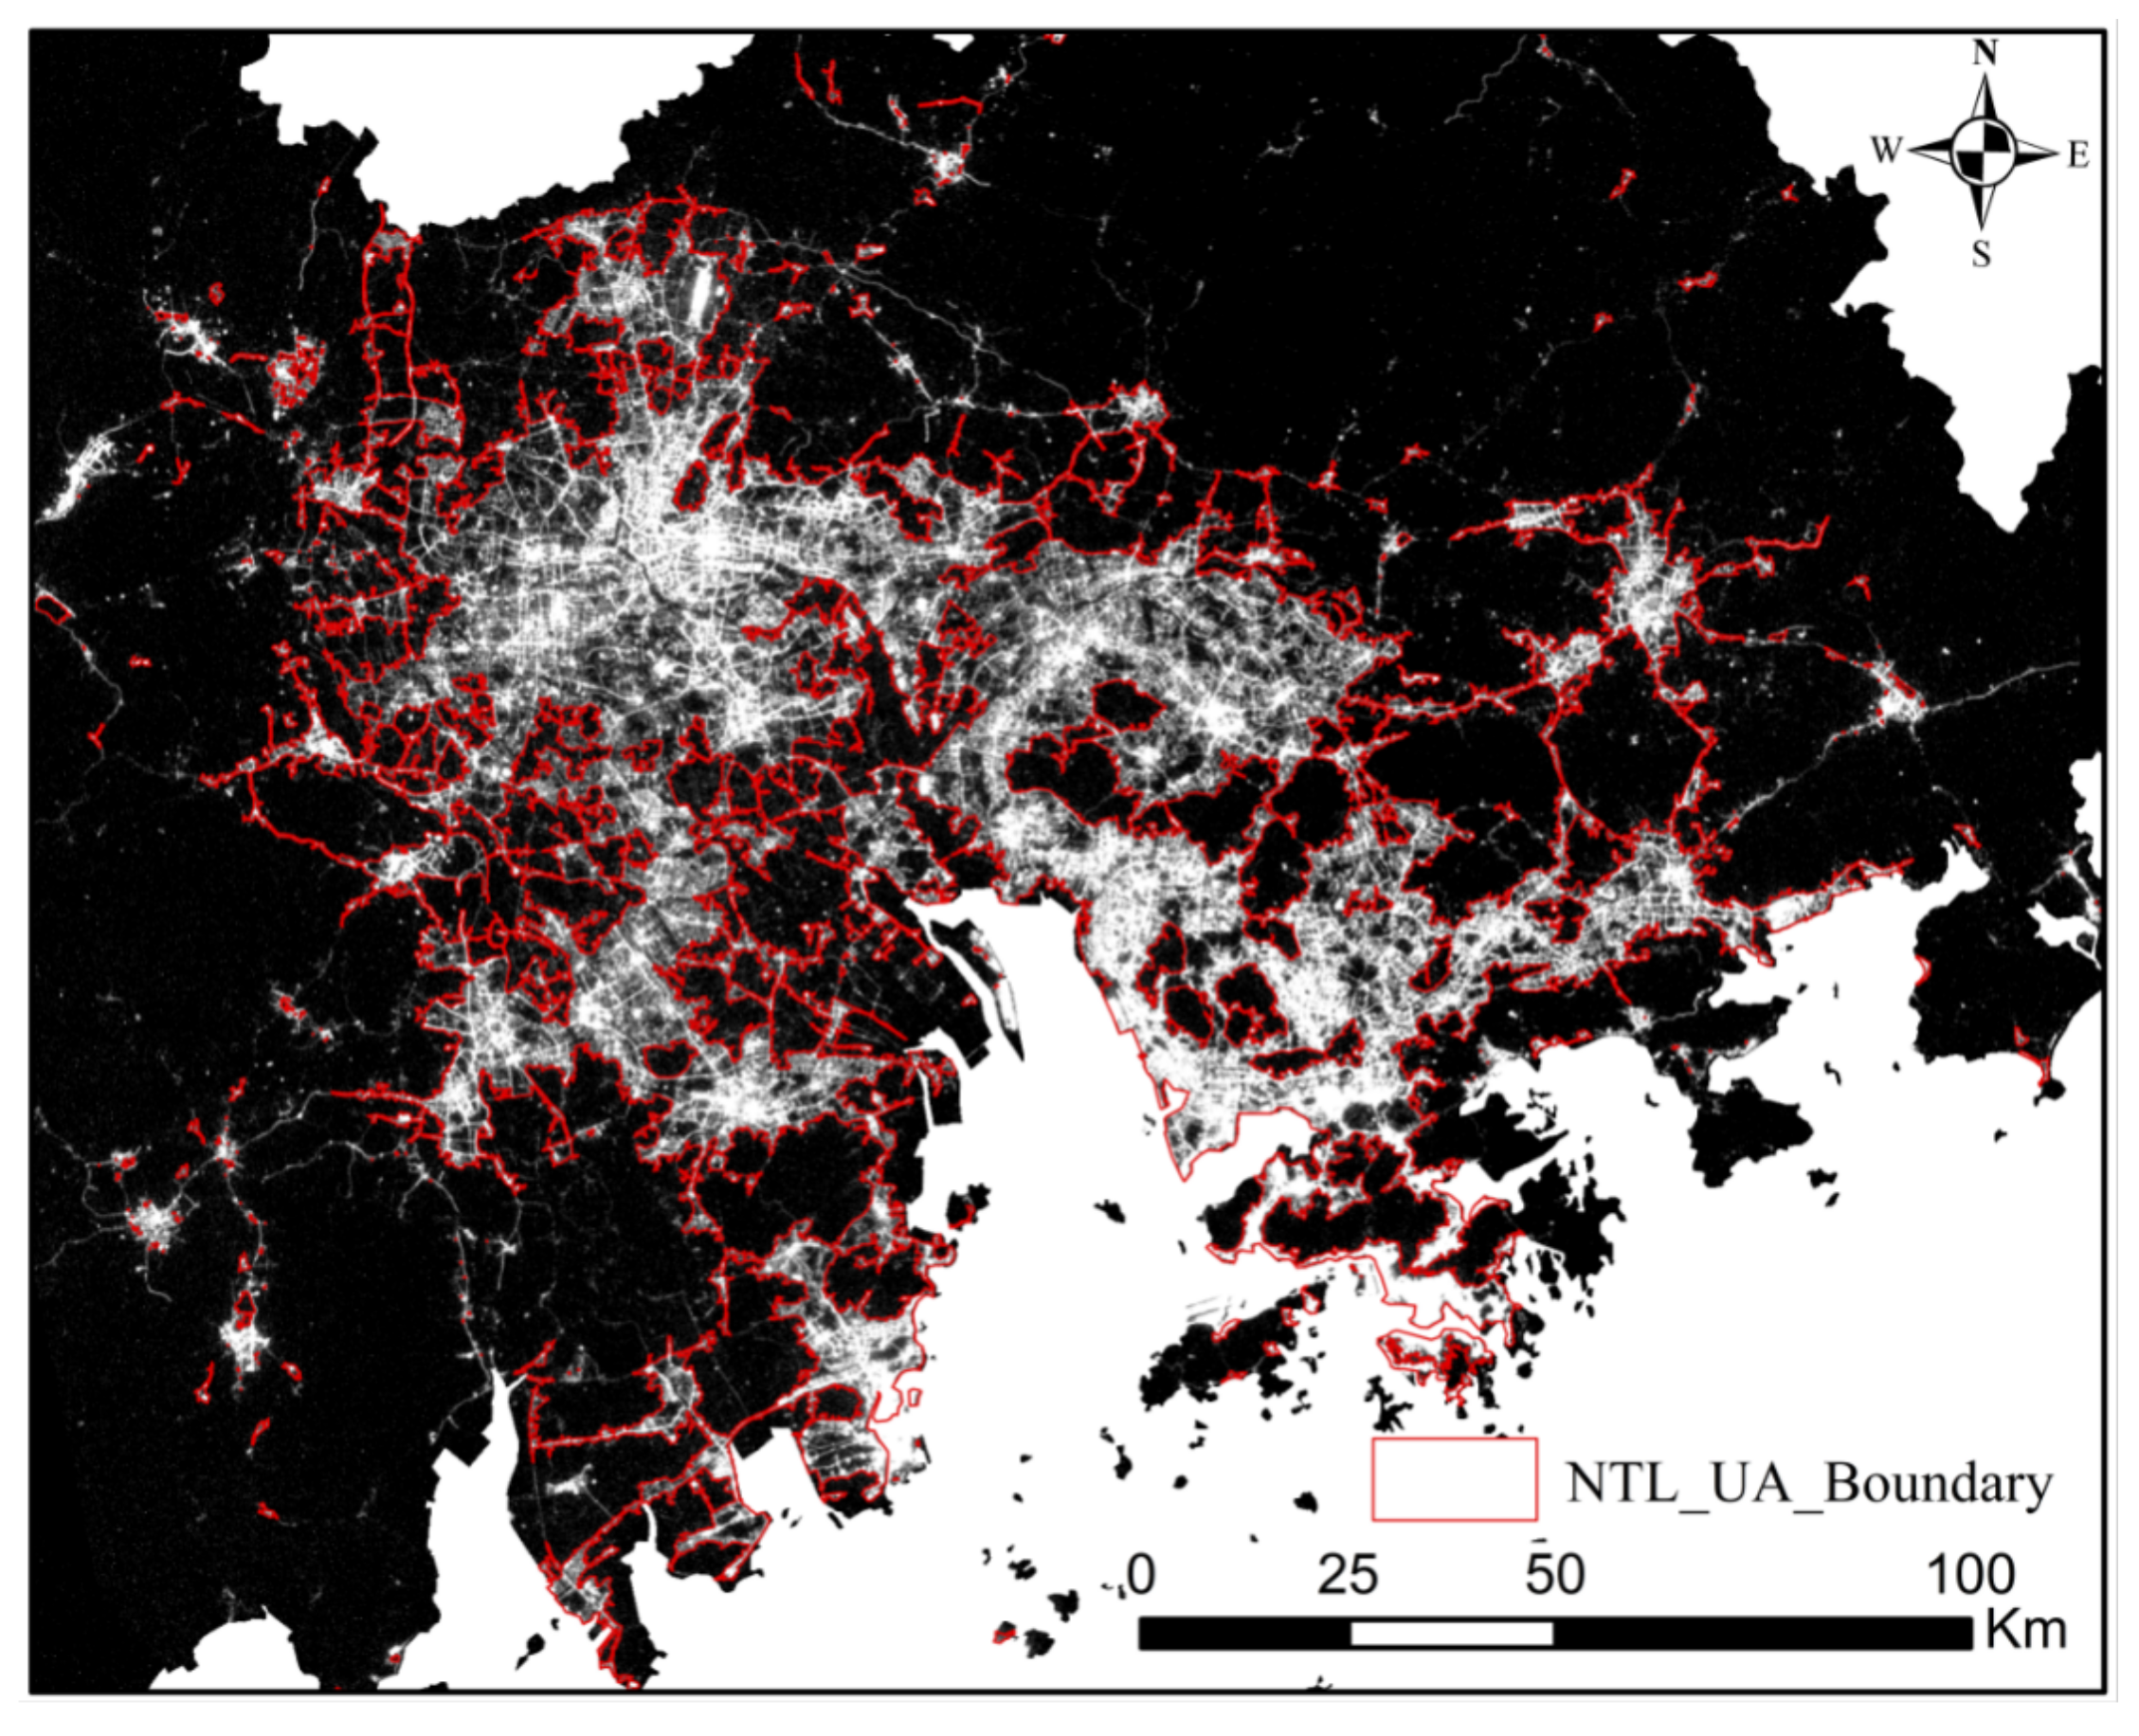
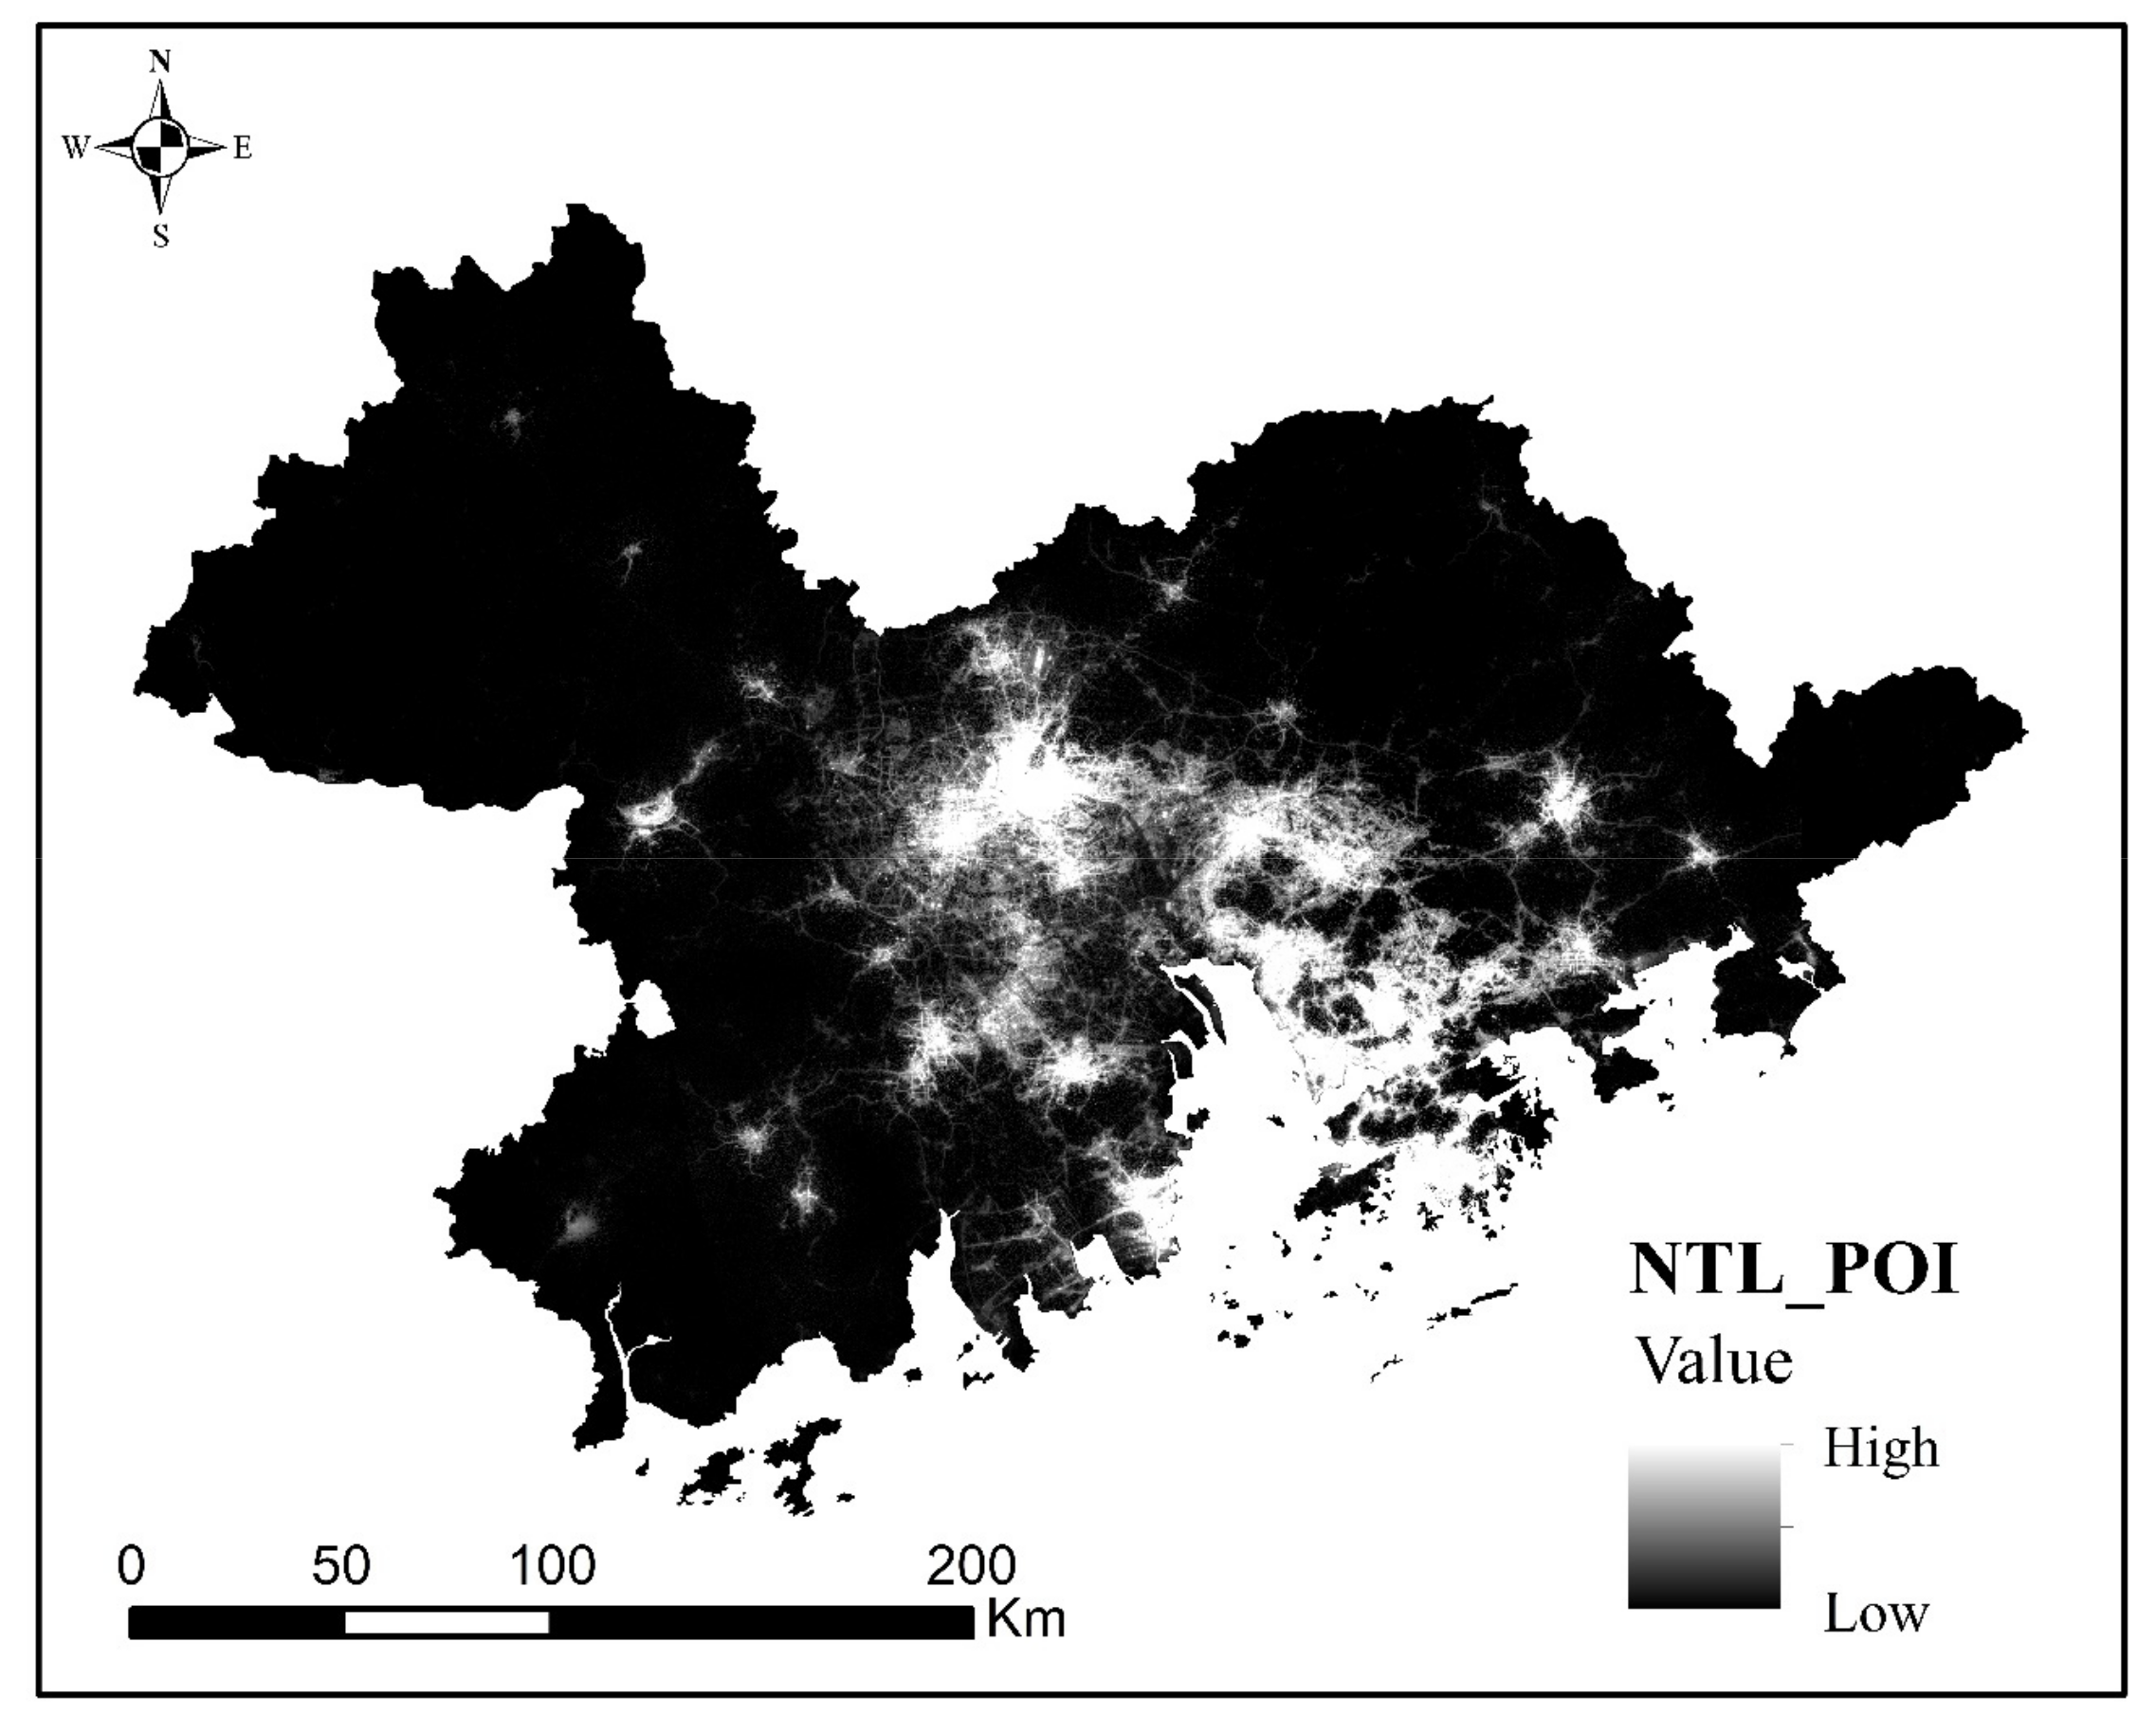
3.1.2. Urban Agglomeration Boundaries Delineated by NTL and POI Data Fusion

POI data represents the virtual representation of the actual unit of each city in the geographical space, therefore, POI data can reflect the morphological differences of different functions in urban space by showing the agglomeration of density [73]. Besides, what is shown in most studies is that there is a significant difference in the density distribution of POI between urban and rural areas. Therefore, in the study of urban agglomeration delineation, areas with a higher POI density can be delineated into urban areas, and on the contrary, areas with a lower POI density can be delineated into rural areas. Kernel density analysis of POI in the urban agglomeration of GBA shows that the POI high-density areas are concentrated in Guangzhou, Foshan, Dongguan and parts of Shenzhen, as well as Hong Kong and Macao. The results are shown in Figure 7 as follows.
The fusion of NTL and POI density maps was realized by wavelet transform, which needs to highlight the feature parts of the transformed image, and these feature parts correspond to the absolute value of the wavelet coefficient. Therefore, the larger the absolute value of the wavelet coefficient, the more obvious the feature parts of the transformed image. In other words, as long as the absolute value of wavelet coefficients in wavelet transform domain can be ensured to be the largest, wavelet fusion with different resolutions can be realized. Therefore, when processing the image signals of NTL and POI, the optimal scale of image fusion can be determined by analyzing the variance graph of wavelet coefficients (Figure 8a). In this study, the optimal scale of image fusion of NTL and POI is 8.
The fusion image after wavelet transform is shown in Figure 9. It can be seen that compared with NTL images, the high values of NP (NTL_POI) images are still concentrated in Guangzhou, Foshan, Shenzhen, Hong Kong and Macao. However, compared with NTL images, the details of the fused NP images are more complete in the center and boundary.
The parameters of Scale, Shape and Compactness determined by the ESP tool and the weighted mean variance diagram (Figure 8b) are 17, 0.5, and 0.7, respectively. According to the determined scale parameters, the urban agglomeration boundaries of the NP image are delineated. Then the boundary of the urban agglomeration in GBA is obtained as shown in Figure 10. It can be seen that the area of the urban agglomeration in the area delineated in Figure 10 is 8,279.56 square kilometers, accounting for 14.78% of the administrative area. The delineated urban agglomeration regions mainly concentrate in the main urban areas of Guangzhou, Shenzhen, Dongguan and Foshan, as well as Hong Kong and Macao. From the point of view of the urban agglomeration boundaries delineated here, the urban agglomeration boundaries of Guangzhou, Foshan, Dongguan and Shenzhen are relatively more complete. What is more, the outlines of these urban agglomerations are more obvious because there are relatively few interference groups.

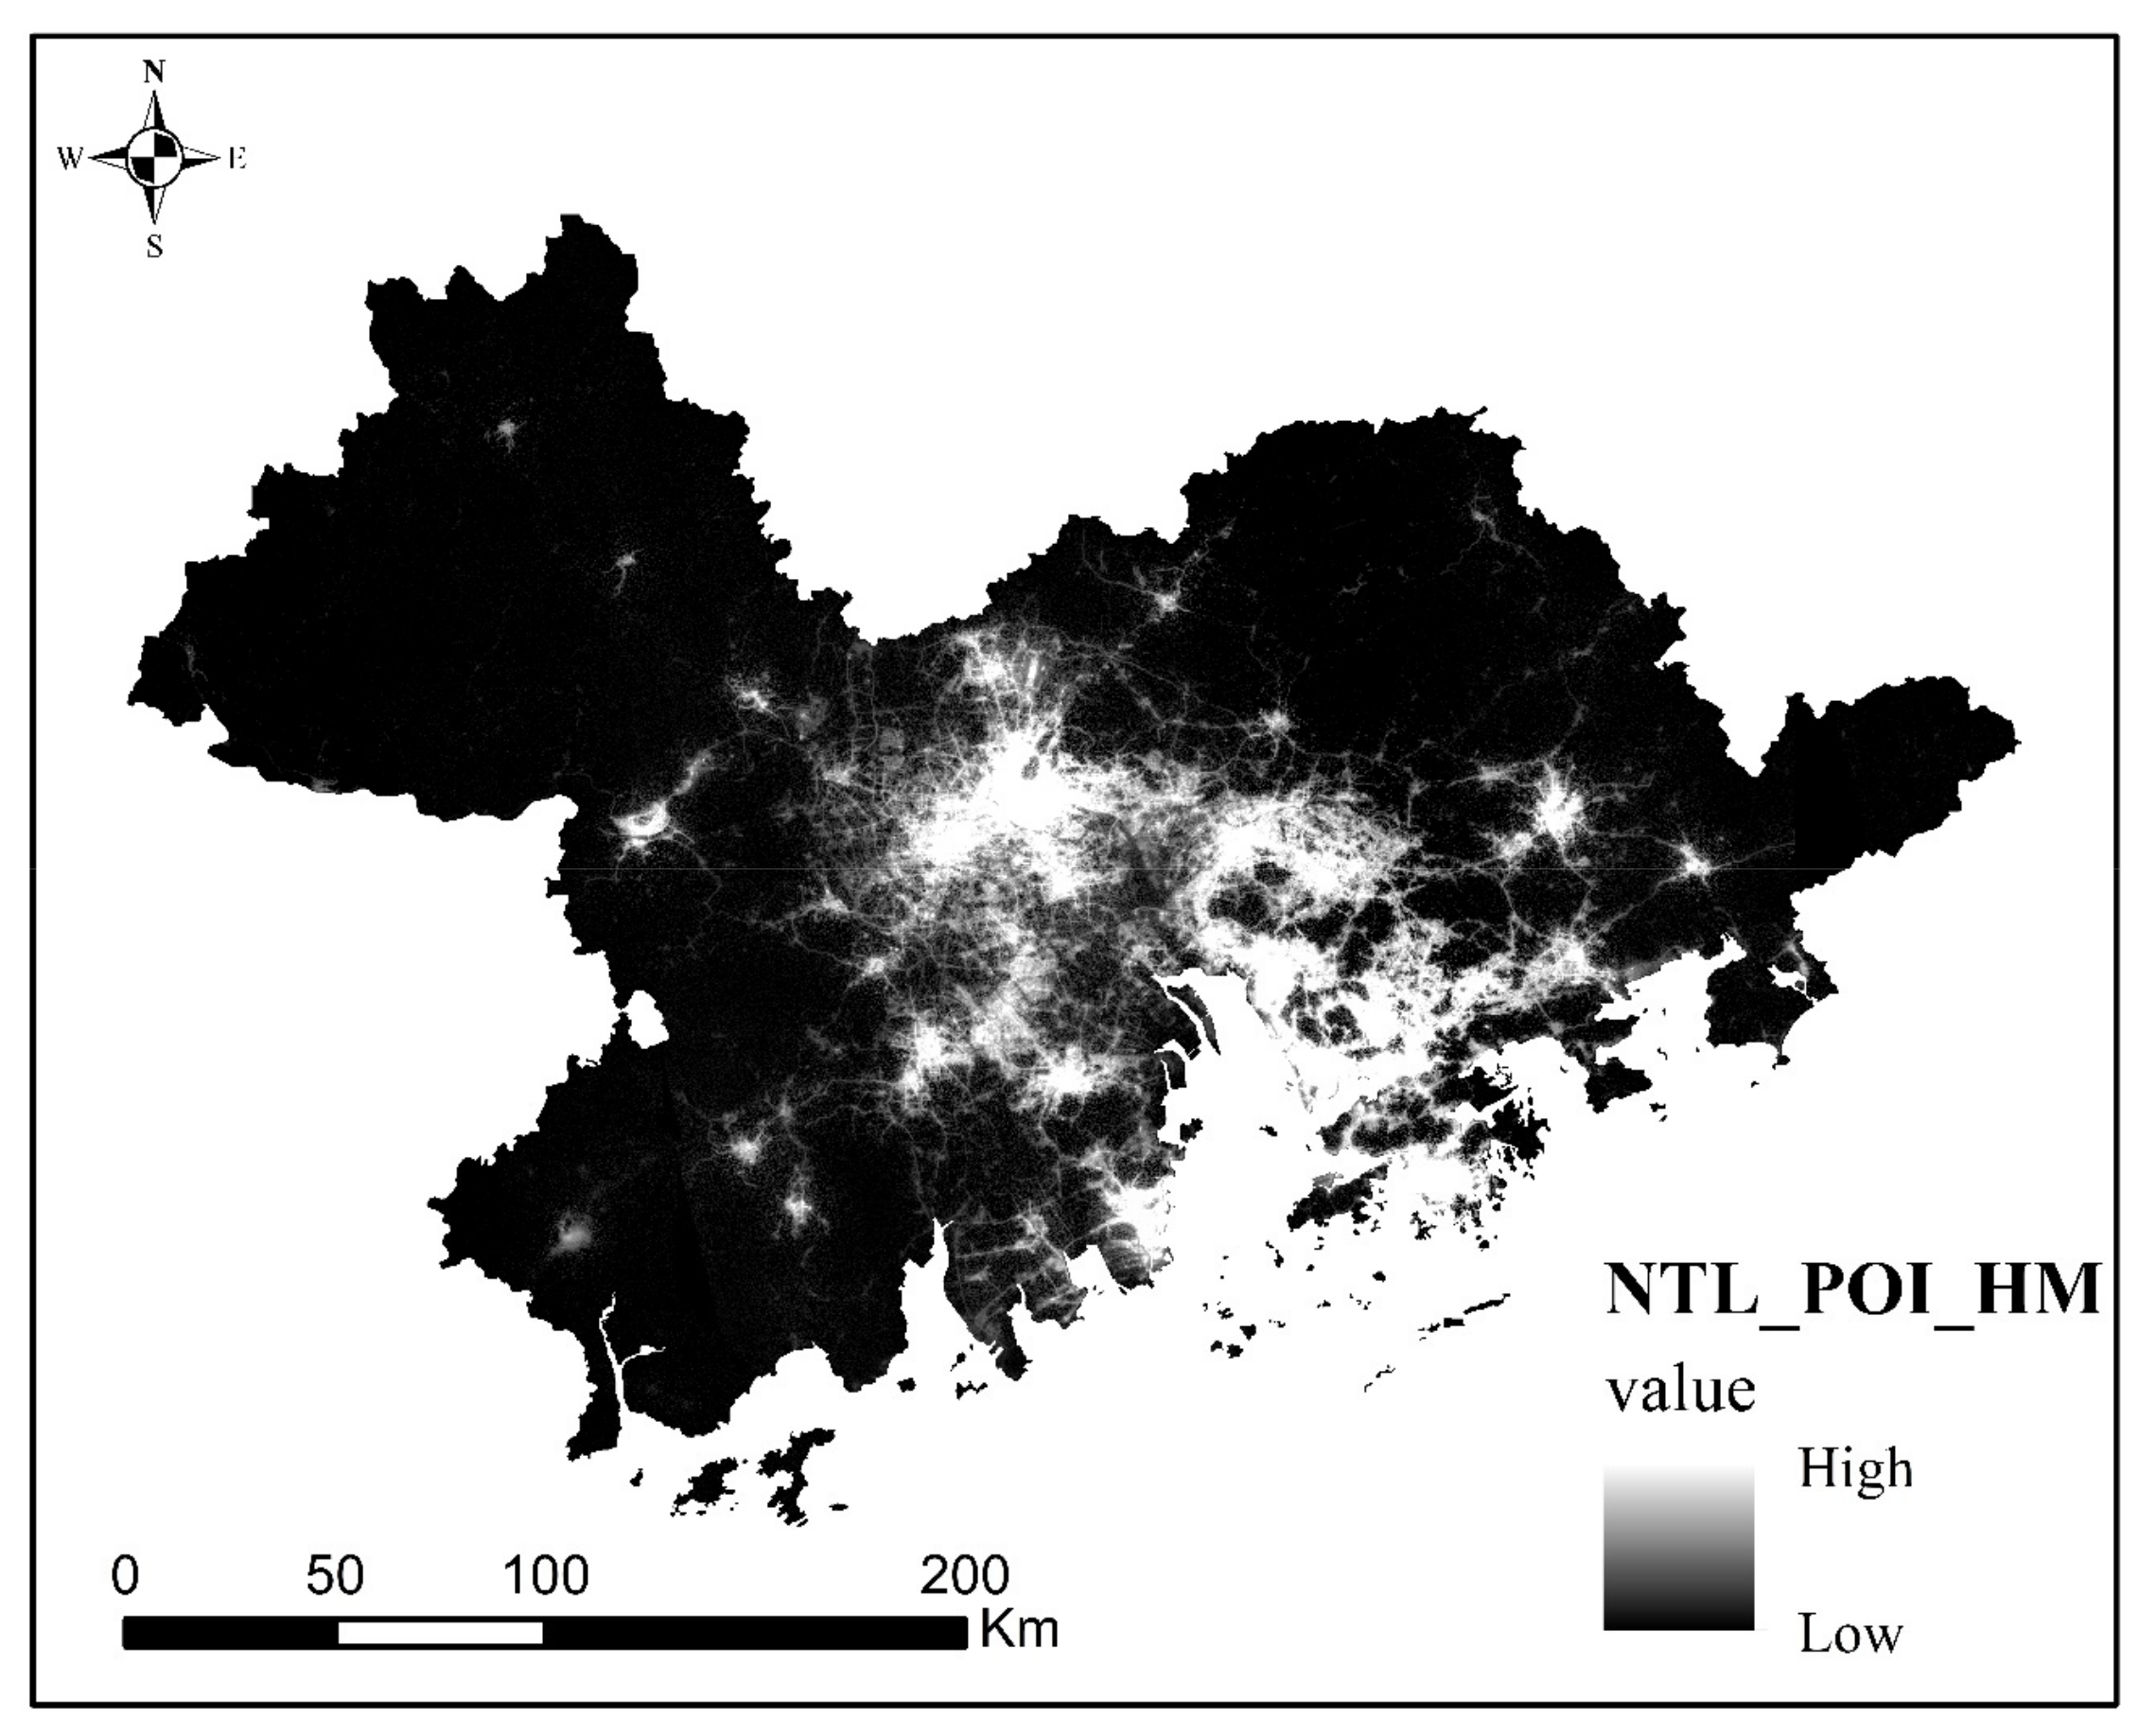
3.1.3. Urban Agglomeration Boundaries Delineated by NTL, POI and Population Movement Data Fusion

A heat map of population movement change was generated according to population movement data. The heat map represents the population movement change index in a fixed area within a certain period of time. The higher the value, the more obvious the regional population movement change [74]. Therefore, heat maps are mostly used for the study of population movement in different cities and among cities. The more significant the urbanization is, the more obvious the population movement is. After average processing of Tencent Migration data in GBA from 2019 to 2020, the heat map shown in Figure 3 is obtained.
Firstly, NTL, POI density and heat map were fused by wavelet transform, and then the optimal scale of fusion of the three images was determined to be 7 by wavelet coefficient variance (Figure 11a). The NPH (NTL_POI_HM) image after wavelet change fusion is shown in Figure 12. It can be found that compared with the NTL and NP images, the high value of the fused NPH image is more obvious in Guangzhou, Foshan, Shenzhen, Hong Kong and Macao. In addition, the details of NPH images in the urban center and boundary are further improved, and the urban center is more prominent.
After the fusion by wavelet transform, the scale parameters of Scale, Shape and Compactness of NPH image determined by the ESP tool and the weighted mean variance diagram (Figure 11b) are 15, 0.5 and 0.5, respectively. According to the determined scale parameters, the urban agglomeration boundaries of the NPH image, delineated as shown in Figure 13, were obtained. It can be seen that the area of the urban agglomeration delineated in Figure 13 is 8925.11 square kilometers, accounting for 15.93% of the administrative area. Compared with NTL and NP, the area of the delineated urban agglomeration regions by NPH is the largest, which mainly concentrate in the most parts of Guangzhou and Shenzhen, as well as the main urban areas of Dongguan and Foshan. The boundary of the urban agglomeration is the most complete, and there is almost no single city group within the urban agglomeration.

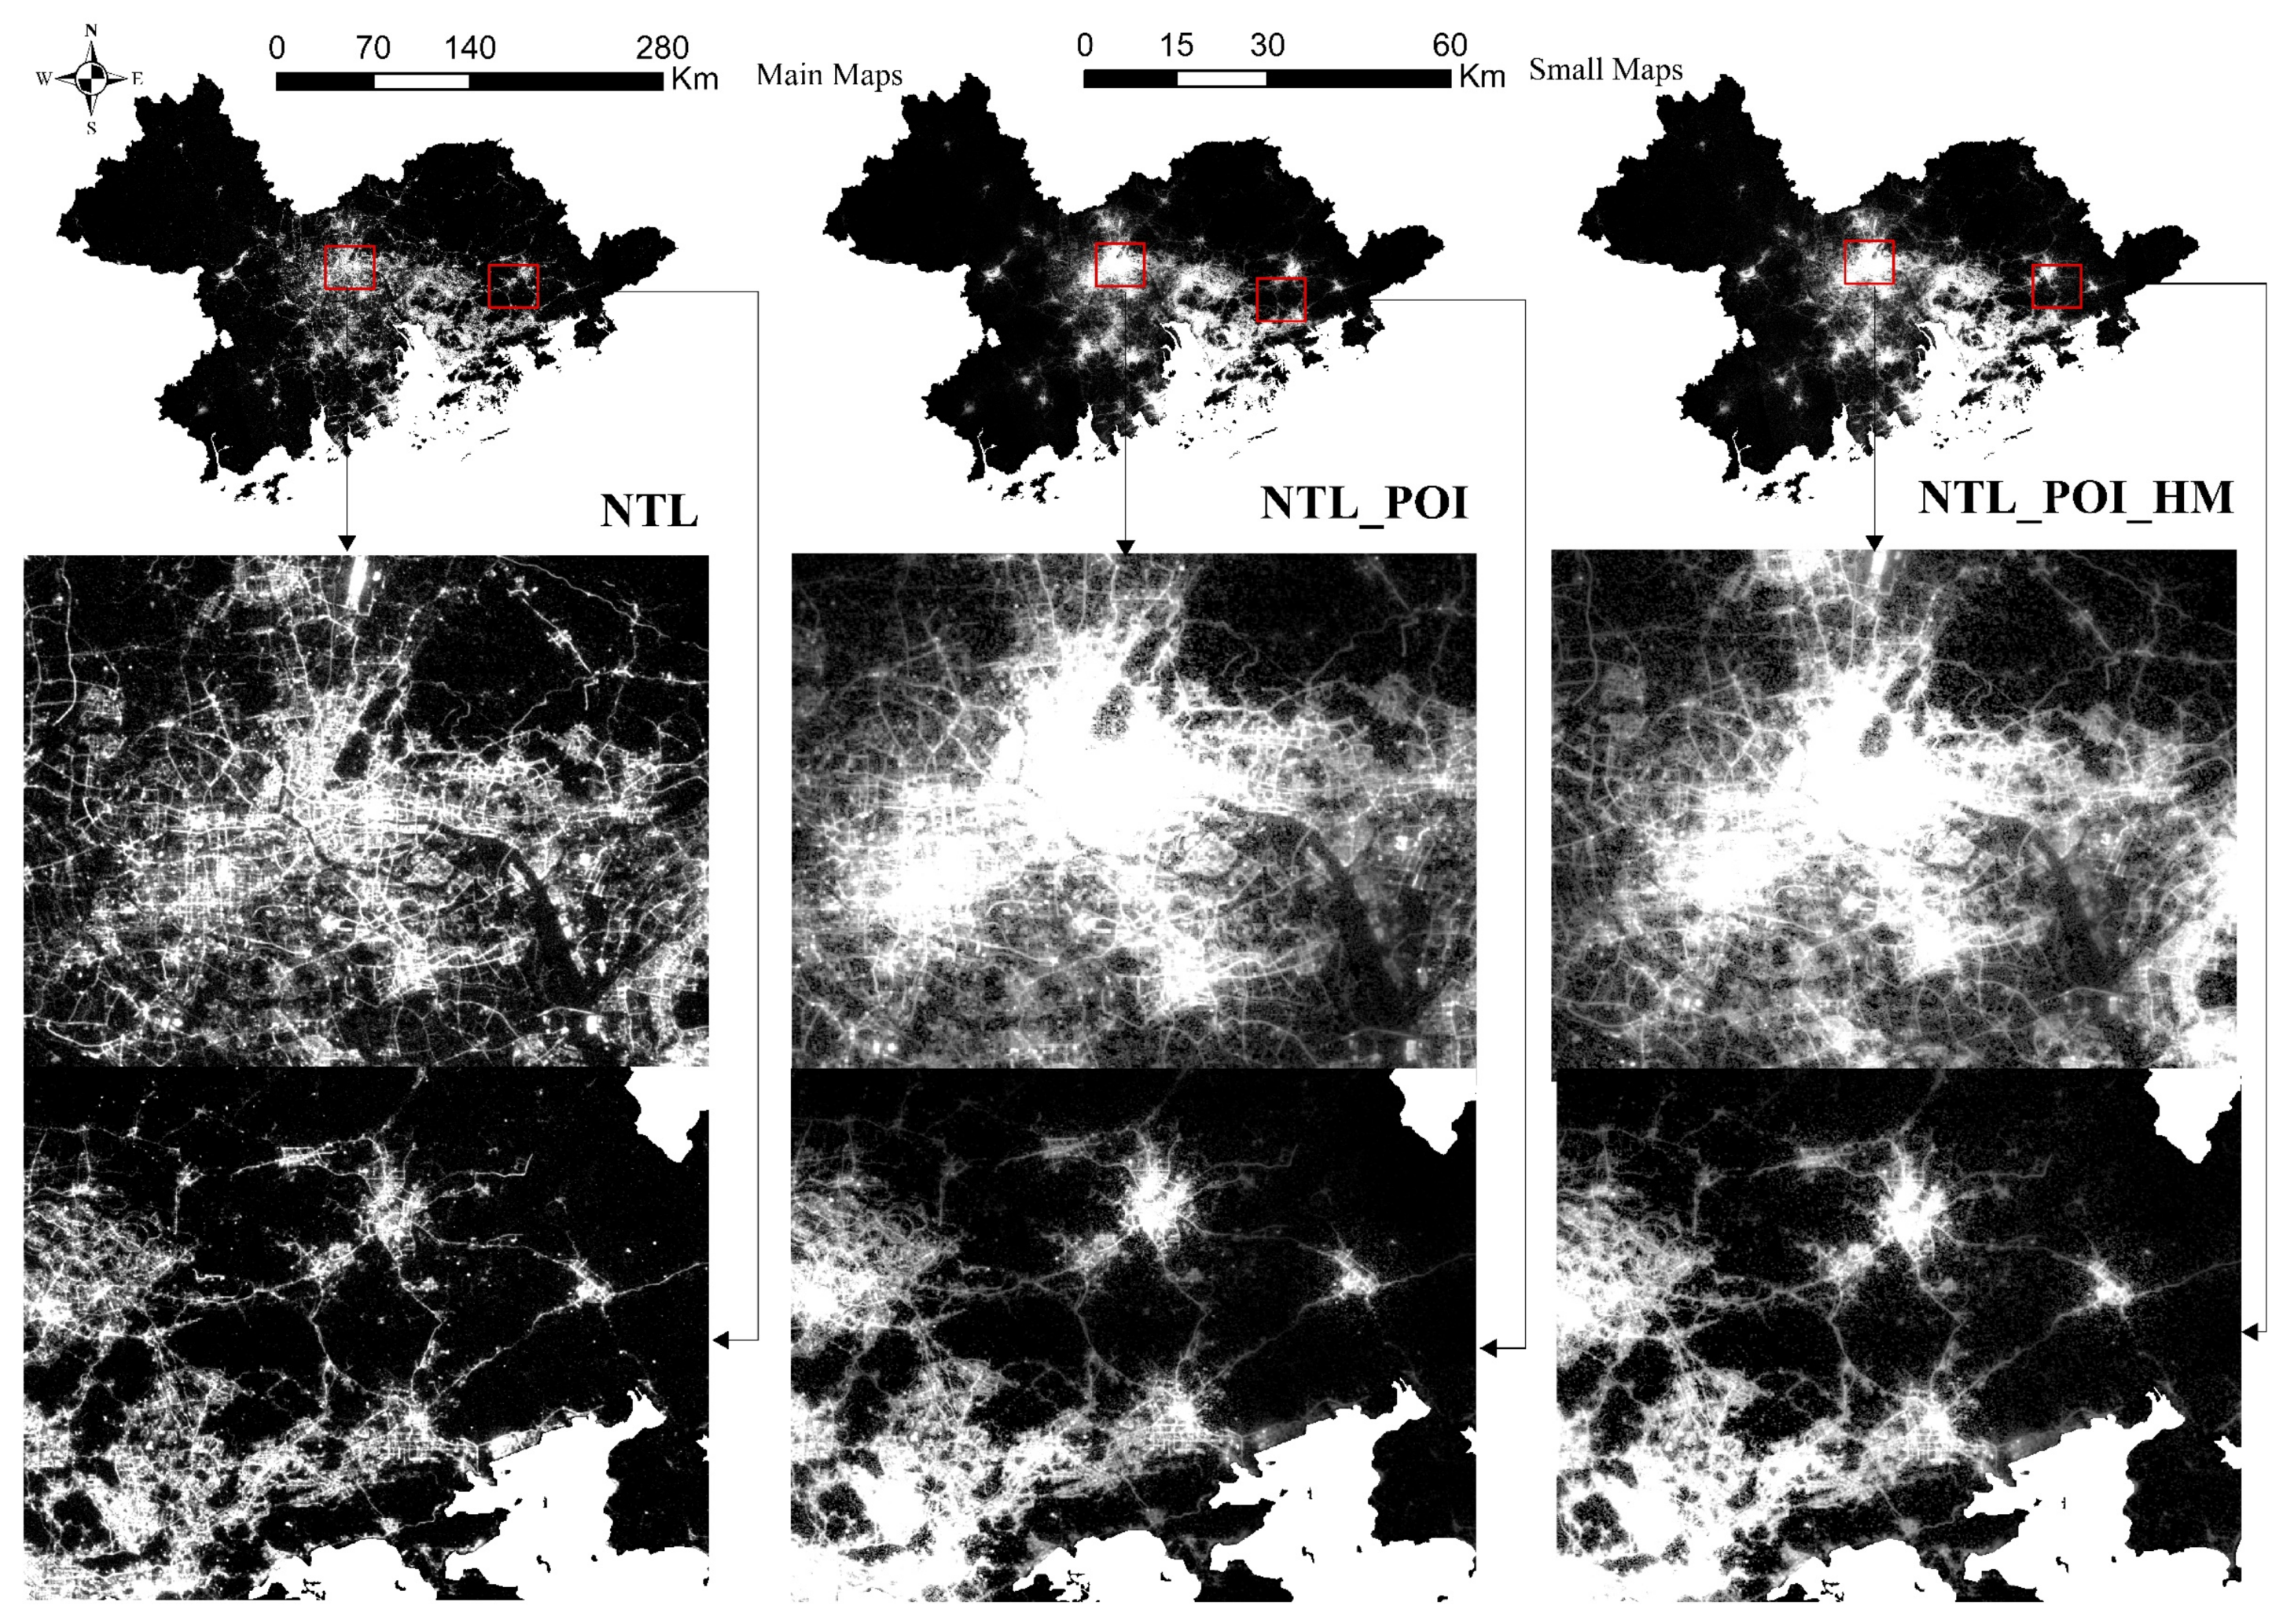
3.2. Comparison before and after Data Fusion

Through the analysis of Figure 14, it can be found that the urban agglomeration of GBA delineated by these three single data of NTL, NP and NPH has the following characteristics: firstly, the spatial structures delineated by these three single data are similar; secondly, from the perspective of the distribution of high and low values of different data, the values of NTL, NP, and NPH show an overall downward trend from urban center to urban fringe and finally to rural areas. Moreover, the spatial distribution of the high value regions of the three kinds of data is also roughly the same in urban agglomerations, which mainly concentrated in the main urban areas of Guangzhou, Shenzhen, Dongguan, as well as Hong Kong and Macao. These characteristics all indicate that NTL, NP and NPH data all have the advantage of NTL data, that is, they all can reflect the basic spatial structure of urban agglomeration by reflecting the brightness of urban light.
By comparing NTL data with NP data, it can be found that on the one hand, NTL data can only determine whether this area is a city or a country by reflecting the light brightness threshold of this area in the urban agglomeration, the reason for this is that NTL data only has the attribute of light brightness, which to a certain extent makes the delineation of urban agglomeration have certain error [35]. For example, the strong light brightness that appears in the main traffic road network at night makes the traffic road and the surrounding urban area have a clear contrast of light brightness, resulting in the appearance of light "holes", which will make the inner space of urban agglomeration fragmented in the boundary delineation of urban agglomeration [75]. While, on the contrary, NP data, after fusion with POI data, not only retains the advantages of POI data, that is, even when the light intensity around the main traffic road network is very strong, the density of POI would not lead to a significant difference in the light intensity between the main road and the urban area. This is why the fusion of NP data and POI data can better explain the regional differentiation in the process of urbanization.
By comparing NPH data with NP data, it can be found that although both NP data and NPH data all are fused with POI data, which contribute to the repair of the urban internal space fragmentation in the main areas of urban agglomerations, the NP data fused with NTL and POI more reflects the urban spatial function of urban land. However, there should be spatial connection between cities and urban clusters in urban agglomerations, which constitutes urban agglomerations different from administrative divisions. NPH data, which fuses population movement data, strengthens the relationship between cities and urban clusters, makes the spatial structure within urban agglomerations more complete, and helps to express the development status of urban agglomerations.
In a word, although NTL data can reflect the urban macro spatial structure by reflecting the light brightness in the city at night, the difference in light brightness will produce more "holes" of urban light, which will affect the integrity of urban internal space. Compared with NTL data, POI data can reflect the agglomeration of urban functions by expressing its distribution density, which enables POI data to correct the light differences in cities by portraying the urban functions so as to enrich the details of the inner space of urban agglomerations. As for population movement data, it can reflect the spatial connection between cities and urban clusters through the spatial movement of population in a certain period of time, which can greatly strengthen the interaction between urban agglomerations.

3.3. Comparison and Verification of the Results of Urban Agglomeration Delineation

The results of urban agglomerations delineated by different data are shown in Figure 15. It can be seen that the urban agglomerations identified by NTL, NP and NPH data are 8719.14, 8279.56 and 8925.11 square kilometers, respectively, accounting for 15.57%, 14.78% and 15.93% of the total area of the administrative area. Besides, from the perspective of the scope of urban agglomerations identified, there is no obvious difference among these different data. However, from the perspective of urban agglomeration boundaries delineated by different data, there are many urban "holes" at the boundary between urban and rural areas in the urban agglomeration boundaries delineated NTL data, which makes the delineated urban agglomeration boundaries too fragmented and difficult to obtain continuous and effective urban agglomeration boundaries [76]. What is worse, due to the difference of light brightness, NTL data will generate some urban clusters far away from the main area of the urban agglomeration, which reflects that NTL data fails to consider the interrelation among cities when identifying the urban agglomeration scope.
Comparing the boundaries of urban agglomerations delineated by NP data and NTL data, the fragmentation of inner space of urban agglomerations caused by NTL data leads to the emergence of discontinuity in the boundary delineation of urban agglomerations. This discontinuity results in two consequences: firstly, it makes the edge details of the borders delineated by NTL too complicated, and secondly, the fragmented urban interior space would produce redundant urban boundary lines. While, after the fusion with POI data, NP data not only has the advantage of NTL data to identify the scope of urban agglomerations, but also could highlight the importance of urban functions in urban space. By combining urban functions with urban space, the fragmentation of urban internal space will undoubtedly be improved. For example, in the area of Qingyuan and Shenzhen, the newly delineated urban agglomeration boundary eliminates the fragmentation and imperfection before, which makes the delineated urban agglomeration boundary more continuous.
Comparing the urban agglomeration boundaries delineated by NPH data and NTL, NP data, it can be found that, first, there are many overlapping parts of the urban agglomeration boundaries delineated by NPH data and NP data in space. Second, when delineating the boundary, the fusion with the urban function by these data makes the boundary of urban agglomeration more similar on the whole. However, both NTL data and NP data do not take into account the interrelation between cities and urban clusters in urban agglomerations, which means that there are still many urban clusters in the urban agglomeration boundary delineated by both NP data and NTL data, such as Foshan and Dongguan. On the other side, the fusion of population movement data with NPH data greatly strengthens the flow connection of elements within urban agglomerations, which makes the boundary of urban agglomerations delineated by NPH not far away from the main region of urban agglomerations.
In a word, although NTL, NP and NPH data can delineate urban agglomeration boundaries, the urban agglomeration boundaries delineated by NTL data do not take into account urban functions and population movement, which leads to serious fragmentation and discontinuity of the delineated urban agglomeration boundaries. On the one hand, NP data solves the problem of fragmentation by taking advantage of the agglomeration of POI data. On the other hand, on the premise of taking into account the urban land relationship, NPH data also takes into account the relationship of population movement within the urban agglomeration, which strengthens the interconnection within the delineated urban agglomeration and makes the boundary of the urban agglomeration more complete.
In this study, 3000 random verification pixel points located in GBA were selected to verify the delineated boundary of the urban agglomeration. Then Google Earth high-resolution image data was used for field confirmation. It can be found that among the 3000 random pixel points, 464 pixel points are located in urban areas and 2536 pixel points are located in rural areas. The confusion matrix of urban agglomeration boundary delineated by different data based on the verification of random pixel points is shown in Table 3. Where, accuracy is the percentage of the number of all random pixel points that are successfully verified, while Kappa coefficient is used for consistency test and can be used to measure classification accuracy. The calculation steps of Kappa coefficient are as follows: the first step is to multiply the total number of pixels in all real surface classification by the sum of diagonal lines of confusion matrix, and the second step is to subtract the product of the total number of real surface pixels of a certain type and the total number of pixels mistakenly divided into the same type to sum all types. The third step is to divide by the square variance of the total number of pixels and subtract the sum of the total number of surface real pixels in a certain category and the total number of classified pixels in this category. The value of Kappa coefficient is -1–1. The closer the coefficient value is to 1, the higher the classification accuracy.
It can be seen from Table 3 that the precision of the boundaries of the urban agglomeration delineated by NTL data, NP data and NPH data is 85.57%, 88.97% and 93.60%, respectively. From the point of the effect of the precision, the improvement of precision of the boundaries delineated by the fusion of POI and NTL data is only 3.4%, and the improvement of precision delineated by the fusion of NPH data and population movement is only 4.63%. Compared with the area of 56,000 square kilometers, although the verification accuracy of the NP data integrated with POI is close to 90%, the improvement effect is not significant. However, by comparing the Kappa coefficients, it can be found that the Kappa coefficients of the boundaries delineated by NTL, NP and NPH are 0.6256, 0.7011 and 0.8155, respectively. It can be concluded that from the perspective of the improvement of Kappa coefficient, the boundaries of urban agglomerations can be delineated with higher accuracy after the fusion of POI and population movement data.
In a word, the fusion of NTL data and POI data improves the integrity of the internal structure of urban agglomerations, which contribute to the improvement of the accuracy of the boundaries of the delineated urban agglomerations as well. On this basis, the continuous integration of population movement data reflects the clusters among cities within urban agglomerations and among cities, which strengthens the internal connection of urban agglomerations and further improves the accuracy of boundary delineation of urban agglomerations.

4. Discussion

The characteristics of NTL data, POI data, and population movement data in urban agglomerations were analyzed in this study. Combining the characteristics of the three types of data, on the premise of combining the characteristics of the three data and considering the land relationship and population movement within the urban agglomeration, this study holds the idea that the urban agglomeration boundary delineated by the fusion of NTL, POI and population movement data has significant advantages.
Although NTL data is one of the most important data in the study of urban space, the research accuracy is reduced due to the existence of light spillover and over-saturation of NTL data in the study of urban space [12]. Therefore, researchers began to pay attention to the study on the fusion of NTL data and POI data in urban space. It has been shown in most studies that POI data can effectively make up for the deficiency of NTL data in urban space research [17,36], especially in the extraction of urban built-up areas and the delineation of urban boundaries with significant accuracy improvement [35,39]. The accuracy of the boundary delineated by the fusion of NTL and POI data also reached 88.97%, which is close to the overall research accuracy of 90% of the global artificial impervious area [77]. On the premise of considering urban space and urban function, this study further considers the influence of population movement on boundary delineation in urban agglomerations. This makes the accuracy of delineating the boundary of urban agglomeration by fusing the NPH data of population movement reach 93.60%, which is higher than that of other research on urban built-up areas and urban boundaries. Moreover, on the premise of highlighting the relationship between urban land, NPH data further fuses the relationship of population movement data within urban agglomerations, making the boundary delineation of urban agglomerations more accurate.
Traditionally, the delineation of urban agglomeration boundary mainly refers to the establishment of an index system of administrative region [14], or the delineation of urban agglomeration boundary by the use of spatial analysis of socioeconomic and geographical data [19]. Although studies ranging from the single NTL data to the fusion of NTL and POI have played an important role in promoting the study of urban agglomeration [40], most studies have ignored population movement, which is the most critical aspect reflecting the inter-relationship within cities [37]. Based on the fusion of NTL data and POI data, this study further fuses population movement data, and finds a new index that delineates the boundaries of urban agglomerations, which not only comprehensively considers urban land relations and population movement, but also plays a great role in delineating urban agglomeration boundaries. The research results of GBA also show that the fused data has a more significant effect in delineating the boundaries of urban agglomerations.
However, it is true that this study has certain limitations. First of all, the population movement data is obtained using Tencent Migration Data, which cannot reflect the migration of all urban populations (mainly confined to the elderly and children), so the population movement value obtained in this study should be a little smaller than the actual population movement value. Secondly, the boundary of urban agglomeration is dynamic and uncertain, which would change with the actual development of the urban city. Even so, the delineation of current urban agglomeration boundaries is still conducive to the delineation of urban agglomeration and the identification of internal development relations. Therefore, in order to better promote the formulation of regional policies on urban agglomeration, it is also necessary to simulate future urban agglomeration boundaries so as to better serve urban planning and practice.

5. Conclusions

Accurate delineation of urban agglomeration boundaries plays an important role not only in judging the process of urbanization but also in evaluating the inter-relationships within cities. Based on NTL and POI data, this study further fuses urban population movement data. While by comparing and verifying the urban agglomeration boundaries delineated by different data, it was found that the accuracy of NTL data is 85.57%, and that of Kappa is 0.6256. The accuracy of NP data, which fuses POI and NTL data, is 88.97%, and that of Kappa is 0.7011. The accuracy of NPH, which fuses population movement, NTL and POI data, for dividing urban agglomeration boundary is 93.60%, and Kappa is 0.8155. It can be concluded that although NTL data and POI data eliminate the inner hole of urban cities, the fused population movement data strengthen the inner relationship of urban agglomerations by reflecting the population movement among cities and among urban clusters within urban agglomerations, which contributes to the improvement of the accuracy of urban agglomeration boundary. A more accurate urban agglomeration boundary that is delineated by fusing new data on land relations and urban population movement on the basis of wavelet transform used in this study could not only contribute to more efficient management of urban agglomerations, but also has important value for the policy formulation and planning development of regional space in urban agglomerations.

Author Contributions

Conceptualization, X.H. and X.Y.; methodology, X.H.; software, X.H.; validation, M.L., C.Z. and R.Z.; formal analysis, D.Z.; investigation, X.H.; resources, C.Z.; data curation, X.Y.; writing—original draft preparation, X.H., C.Z.; writing—review and editing, X.H.; visualization, C.Z. All authors have read and agreed to the published version of the manuscript.

Funding

This research received no external funding.

Data Availability Statement

Data disclosure access link: Doi 10.5281/zenodo.4662949.

Acknowledgments

Thanks to all editors and commenters.

Conflicts of Interest

The authors declare no conflict of interest.

References

  1. Zheng, W.; Kuang, A.; Liu, Z.; Wang, X. Analysing the spatial structure of urban growth across the Yangtze River Middle reaches urban agglomeration in China using NPP-VIIRS night-time lights data. GeoJournal 2021, 1–18. [Google Scholar] [CrossRef]
  2. Chakraborty, S.; Maity, I.; Patel, P.P.; Dadashpoor, H.; Pramanik, S.; Follmann, A.; Novotný, J.; Roy, U. Spatio-temporal patterns of urbanization in the Kolkata Urban Agglomeration: A dynamic spatial territory-based approach. Sustain. Cities Soc. 2021, 67, 102715. [Google Scholar] [CrossRef]
  3. Liu, Y.; Li, H.; Gao, P.; Zhong, C. Monitoring the detailed dynamics of regional thermal environment in a developing urban agglomeration. Sensors 2020, 20, 1197. [Google Scholar] [CrossRef] [Green Version]
  4. Zhao, G.; Dong, J.; Liu, J.; Zhai, J.; Cui, Y.; He, T.; Xiao, X. Different patterns in daytime and nighttime thermal effects of urbanization in Beijing-Tianjin-Hebei urban agglomeration. Remote Sens. 2017, 9, 121. [Google Scholar] [CrossRef] [Green Version]
  5. Pan, H.; Cong, C.; Zhang, X.; Zhang, Y. How do high-speed rail projects affect the agglomeration in cities and regions? Transp. Res. Part D Transp. Environ. 2020, 88, 102561. [Google Scholar] [CrossRef]
  6. Zeng, X.; Xiang, H.; Xue, Y.; Su, Y.; Tong, Y.; Mao, Z. A scenario-based optimization frame to adjust current strategy for population-economy-resource-environment harmony in an urban agglomeration, China. Sustain. Cities Soc. 2021, 67, 102710. [Google Scholar] [CrossRef]
  7. Kantakumar, L.N.; Kumar, S.; Schneider, K. SUSM: A scenario-based urban growth simulation model using remote sensing data. Eur. J. Remote Sens. 2019, 52, 26–41. [Google Scholar] [CrossRef] [Green Version]
  8. Roni, R.; Jia, P. An optimal population modeling approach using geographically weighted regression based on high-resolution remote sensing data: A case study in Dhaka City, Bangladesh. Remote Sens. 2020, 12, 184. [Google Scholar] [CrossRef] [Green Version]
  9. Xu, H.; Hu, S. Chinese city size evolution under perspective of nighttime light remote sensing. Wuhan Daxue Xuebao 2021, 1, 40–49. [Google Scholar]
  10. Chen, J.; Wei, H.; Li, N.; Chen, S.; Qu, W.; Zhang, Y. Rxploring the spatial-temporal dynamics of the Yangtze River Delta urban agglomeration based on night-time light remote sensing technology. IEEE J. Sel. Top. Appl. Earth Obs. Remote Sens. 2020, 13, 5369–5383. [Google Scholar] [CrossRef]
  11. Li, H.-M.; Li, X.-G.; Yang, X.-Y.; Zhang, H. Analyzing the relationship between developed land area and nighttime light emissions of 36 Chinese cities. Remote Sens. 2019, 11, 10. [Google Scholar] [CrossRef] [Green Version]
  12. Xu, P.; Jin, P.; Cheng, Q. Monitoring regional urban dynamics using DMSP/OLS nighttime light data in Zhejiang Province. Math. Probl. Eng. 2020, 2020, 9652808. [Google Scholar] [CrossRef]
  13. Zhai, W.; Han, B.; Cheng, C. Evaluation of Luojia 1–01 nighttime light imagery for built-up urban area extraction: A case study of 16 cities in China. IEEE Geosci. Remote Sens. Lett. 2019, 17, 1802–1806. [Google Scholar] [CrossRef]
  14. Liu, X.; Ning, X.; Wang, H.; Wang, C.; Zhang, H.; Meng, J. A rapid and automated urban boundary extraction method based on nighttime light data in China. Remote Sens. 2019, 11, 1126. [Google Scholar] [CrossRef] [Green Version]
  15. Small, C.; Pozzi, F.; Elvidge, C.D. Spatial analysis of global urban extent from DMSP-OLS night lights. Remote Sens. Environ. 2005, 96, 277–291. [Google Scholar] [CrossRef]
  16. Jiang, Z.; Zhai, W.; Meng, X.; Long, Y. Identifying shrinking cities with NPP-VIIRS nightlight data in China. J. Urban Plan. Dev. 2020, 146, 0402003. [Google Scholar] [CrossRef]
  17. Yuan, X.; Jia, L.; Menenti, M.; Zhou, J.; Chen, Q. Filtering the NPP-VIIRS nighttime light data for improved detection of settlements in Africa. Remote Sens. 2019, 11, 3002. [Google Scholar] [CrossRef] [Green Version]
  18. Zheng, Q.; Weng, Q.; Wang, K. Developing a new cross-sensor calibration model for DMSP-OLS and Suomi-NPP VIIRS night-light imageries. ISPRS J. Photogramm. Remote Sens. 2019, 153, 36–47. [Google Scholar] [CrossRef]
  19. Jiang, W.; He, G.; Long, T.; Guo, H.; Yin, R.; Leng, W.; Liu, H.; Wang, G. Potentiality of using Luojia 1-01 nighttime light imagery to investigate artificial light pollution. Sensors 2018, 18, 2900. [Google Scholar] [CrossRef] [Green Version]
  20. Wang, L.; Fan, H.; Wang, Y. Improving population mapping using Luojia 1-01 nighttime light image and location-based social media data. Sci. Total Environ. 2020, 730, 139148. [Google Scholar] [CrossRef] [PubMed]
  21. Zhao, Z.; Cheng, G.; Wang, C.; Wang, S.; Wang, H. City grade classification based on connectivity analysis by Luojia I night-time light images in Henan Province, China. Remote Sens. 2020, 12, 1705. [Google Scholar] [CrossRef]
  22. Zhang, J.; Yuan, X.D.; Lin, H. The extraction of urban built-up areas by integrating night-time light and POI data—A case study of Kunming, China. IEEE Access 2021, 9, 22417–22429. [Google Scholar]
  23. Lou, G.; Chen, Q.; He, K.; Zhou, Y.; Shi, Z. Using nighttime light data and poi big data to detect the urban centers of hangzhou. Remote Sens. 2019, 11, 1821. [Google Scholar] [CrossRef] [Green Version]
  24. Zhang, X.; Du, S.; Wang, Q. Hierarchical semantic cognition for urban functional zones with VHR satellite images and POI data. ISPRS J. Photogramm. Remote Sens. 2017, 132, 170–184. [Google Scholar] [CrossRef]
  25. Bin, J.; Gardiner, B.; Li, E.; Liu, Z. Multi-source urban data fusion for property value assessment: A case study in philadelphia. Neurocomputing 2020, 404, 70–83. [Google Scholar] [CrossRef]
  26. Liu, J.; Li, T.; Xie, P.; Du, S.; Teng, F.; Yang, X. Urban big data fusion based on deep learning: An overview. Inf. Fusion 2020, 53, 123–133. [Google Scholar] [CrossRef]
  27. Cao, R.; Tu, W.; Yang, C.; Li, Q.; Liu, J.; Zhu, J.; Zhang, Q.; Li, Q.; Qiu, G. Deep learning-based remote and social sensing data fusion for urban region function recognition. ISPRS J. Photogramm. Remote Sens. 2020, 163, 82–97. [Google Scholar] [CrossRef]
  28. Zhang, Y.; Li, Q.; Tu, W.; Mai, K.; Yao, Y.; Chen, Y. Functional urban land use recognition integrating multi-source geospatial data and cross-correlations. Comput. Environ. Urban Syst. 2019, 78, 101374. [Google Scholar] [CrossRef]
  29. Ma, X.; Li, C.; Tong, X.; Liu, S. A new fusion approach for extracting urban built-up areas from multisource remotely sensed data. Remote Sens. 2019, 11, 2516. [Google Scholar] [CrossRef] [Green Version]
  30. Ferreira, D.L.; Nunes, B.A.A.; Campos, C.A.V.; Obraczka, K. A deep learning approach for identifying user communities based on geographical preferences and its applications to urban and environmental planning. ACM Trans. Spat. Algorithms Syst. 2020, 6, 1–24. [Google Scholar] [CrossRef] [Green Version]
  31. Tu, W.; Hu, Z.; Li, L.; Cao, J.; Jiang, J.; Li, Q.; Li, Q. Portraying urban functional zones by coupling remote sensing imagery and human sensing data. Remote Sens. 2018, 10, 141. [Google Scholar] [CrossRef] [Green Version]
  32. Zhao, F.; Zhang, W.; Yan, Z.; Yu, H.; Diao, W. Multi-feature map pyramid fusion deep network for semantic segmentation on remote sensing data. J. Electron. Inf. Technol. 2019, 41, 2525–2531. [Google Scholar]
  33. Vergara, C.; Martin, R.K.; Collins, P.J.; Lievsay, J.R. Multi-sensor data fusion between radio tomographic imaging and noise radar. IET Radar Sonar Navig. 2019, 14, 187–193. [Google Scholar] [CrossRef]
  34. Liu, J.; Deng, Y.; Wang, Y.; Huang, H.; Du, Q.; Ren, F. Urban nighttime leisure space mapping with nighttime light images and POI data. Remote Sens. 2020, 12, 541. [Google Scholar] [CrossRef] [Green Version]
  35. He, X.; Zhou, C.; Zhang, J.; Yuan, X. Using wavelet transforms to fuse nighttime light data and POI big data to extract urban built-up areas. Remote Sens. 2020, 12, 3887. [Google Scholar] [CrossRef]
  36. Li, F.; Yan, Q.; Bian, Z.; Liu, B.; Wu, Z. A POI and LST adjusted NTL urban index for urban built-up area extraction. Sensors 2020, 20, 2918. [Google Scholar] [CrossRef]
  37. Liu, Q.; Zhan, Q.; Li, J.; Yang, C.; Liu, W. Extracting built-up areas using Luojia-1A nighttime light imageries in Wuhan, China. Geomat. Inf. Sci. Wuhan Univ. 2021, 46, 30–39. [Google Scholar]
  38. Chen, Z.; Yu, B.; Ta, N.; Shi, K.; Yang, C.; Wang, C.; Zhao, X.; Deng, S.; Wu, J. Delineating seasonal relationships between Suomi NPP-VIIRS nighttime light and human activity across Shanghai, China. IEEE J. Sel. Top. Appl. Earth Obs. Remote Sens. 2019, 12, 4275–4283. [Google Scholar] [CrossRef]
  39. Ye, T.; Zhao, N.; Yang, X.; Ouyang, Z.; Liu, X.; Chen, Q.; Hu, K.; Yue, W.; Qi, J.; Li, Z.; et al. Improved population mapping for China using remotely sensed and points-of-interest data within a random forests model. Sci. Total. Environ. 2019, 658, 936–946. [Google Scholar] [CrossRef]
  40. Zhao, F.; Ding, J.; Zhang, S.; Luan, G.; Song, L.; Peng, Z.; Du, Q.; Xie, Z. Estimating rural electric power consumption using NPP-VIIRS night-time light, toponym and POI data in ethnic minority areas of China. Remote Sens. 2020, 12, 2836. [Google Scholar] [CrossRef]
  41. Lai, J.; Pan, J. China’s city network structural characteristics based on population flow during spring festival travel rush: Empirical analysis of “Tencent Migration” big data. J. Urban Plan. Dev. 2020, 146, 04020018. [Google Scholar] [CrossRef]
  42. Chen, M.; Luo, X.; Hu, M.; Zhang, X. Club characteristic and the proximity effect of travel links between cities in China. Complexity 2020, 2020, 5786384. [Google Scholar] [CrossRef]
  43. Xu, X.K.; Wen, C.; Zhang, G.Y.; Sun, H.C.; Liu, B.; Wang, X.W. The geographical destination distribution and effect of outflow population of Wuhan when the outbreak of COVID-19. J. Univ. Electron. Sci. Technol. China 2020, 49. [Google Scholar] [CrossRef]
  44. Zhang, Y.; Li, Y.; Yang, B.; Zheng, X.; Chen, M. Risk assessment of COVID-19 based on multisource data from a geographical viewpoint. IEEE Access 2020, 8, 125702–125713. [Google Scholar] [CrossRef]
  45. Zeng, C.; Song, Y.; Cai, D.; Hu, P.; Cui, H.; Yang, J.; Zhang, H. Exploration on the spatial spillover effect of infrastructure network on urbanization: A case study in Wuhan urban agglomeration. Sustain. Cities Soc. 2019, 47, 101476. [Google Scholar] [CrossRef]
  46. Xu, Z.N.; Gao, X.L. A novel method for identifying the boundary of urban built-up areas with POI data. Acta Geogr. Sin. 2016, 71, 928–939. [Google Scholar]
  47. Feng, R.; Wang, F.; Wang, K.; Xu, S. Quantifying influences of anthropogenic-natural factors on ecological land evolution in mega-urban agglomeration: A case study of Guangdong-Hong Kong-Macao greater Bay area. J. Clean. Prod. 2021, 283, 125304. [Google Scholar] [CrossRef]
  48. Sahana, M.; Hong, H.; Sajjad, H. Analyzing urban spatial patterns and trend of urban growth using urban sprawl matrix: A study on Kolkata urban agglomeration, India. Sci. Total. Environ. 2018, 628, 1557–1566. [Google Scholar] [CrossRef]
  49. Zhen, F.; Cao, Y.; Qin, X.; Wang, B. Delineation of an urban agglomeration boundary based on Sina Weibo microblog ‘check-in’ data: A case study of the Yangtze River Delta. Cities 2017, 60, 180–191. [Google Scholar] [CrossRef]
  50. Kotthaus, S.; Grimmond, C.S.B. Atmospheric boundary-layer characteristics from ceilometer measurements. Part 2, Application to London’s urban boundary layer. Q. J. R. Meteorol. Soc. 2018, 144, 1511–1524. [Google Scholar] [CrossRef] [Green Version]
  51. Ricci, A.; Burlando, M.; Repetto, M.; Blocken, B. Simulation of urban boundary and canopy layer flows in port areas induced by different marine boundary layer inflow conditions. Sci. Total. Environ. 2019, 670, 876–892. [Google Scholar] [CrossRef] [PubMed]
  52. Guoai, G.U. Analysis on system structure and complexity of urban development. Int. J. Simul. Syst. Sci. Tech. 2016, 17, 5.1–5.6. [Google Scholar]
  53. Yang, Y.; Fan, S.; Wang, L.; Gao, Z.; Zhang, Y.; Zou, H.; Miao, S.; Li, Y.; Huang, M.; Yim, S.; et al. Diurnal evolution of the wintertime boundary layer in urban Beijing, China: Insights from Doppler Lidar and a 325-m meteorological tower. Remote Sens. 2020, 12, 3935. [Google Scholar] [CrossRef]
  54. Wu, K.; Fang, C.; Huang, H.; Wang, J. Comprehensive delimitation and ring identification on urban spatial radiation of regional central cities: Case study of Zhengzhou. J. Urban Plan. Dev. 2013, 139, 258–273. [Google Scholar] [CrossRef]
  55. Zhou, B.; Kockelman, K.M.; Lemp, J.D. Applications of integrated transport and gravity-based land use models for policy analysis. Transp. Res. Rec. 2009, 2133, 123–132. [Google Scholar] [CrossRef]
  56. Xiang, S.; Fu, X.; Zhou, J.; Wang, Y.; Zhang, Y.; Hu, X.; Xu, J.; Liu, H.; Liu, J.; Ma, J.; et al. Non-intrusive reduced order model of urban airflow with dynamic boundary conditions. Build. Environ. 2021, 187, 107397. [Google Scholar] [CrossRef]
  57. Kong, X.; Xia, F.; Ma, K.; Li, J.; Yang, Q. Discovering transit-oriented development regions of megacities using heterogeneous urban data. IEEE Trans. Comput. Soc. Syst. 2019, 6, 943–955. [Google Scholar] [CrossRef]
  58. Li, Q.; Zheng, B.; Tu, B.; Yang, Y.; Wang, Z.; Jiang, W.; Yao, K.; Yang, J. Refining urban built-up area via multi-source data fusion for the analysis of Dongting Lake eco-economic zone spatiotemporal expansion. Remote Sens. 2020, 12, 1797. [Google Scholar] [CrossRef]
  59. Ning, X.; Wang, H.; Liu, Y.; Hao, M.; Dong, Q.; Xu, W.; Cai, X.; Fu, M.; Dong, W.; Liu, Y. Urban ecological space changes of 338 prefecture-level cities in China from 2016 to 2017 with high-precision urban boundary and land cover data. ISPRS Int. Arch. Photogramm. Remote Sens. Spat. Inf. Sci. 2020, XLIII-B4-2, 157–160. [Google Scholar] [CrossRef]
  60. Wang, W.; Jiao, L.; Zhang, W.; Jia, Q.; Su, F.; Xu, G.; Ma, S. Delineating urban growth boundaries under multi-objective and constraints. Sustain. Cities Soc. 2020, 61, 102279. [Google Scholar] [CrossRef]
  61. Xian, S.; Li, L.; Qi, Z. Toward a sustainable urban expansion: A case study of Zhuhai, China. J. Clean. Prod. 2019, 230, 276–285. [Google Scholar] [CrossRef]
  62. Xue, X.; Yu, Z.; Zhu, S.; Zheng, Q.; Weston, M.; Wang, K.; Gan, M.; Xu, H. Delineating urban boundaries using Landsat 8 multispectral data and VIIRS nighttime light data. Remote Sens. 2018, 10, 799. [Google Scholar] [CrossRef] [Green Version]
  63. Zhou, Z.; Du, J.; Liu, Y. Evolution, development and evaluation of eco-transportation in Guangdong-Hong Kong-Macao Greater Bay Area. Syst. Sci. Control. Eng. 2020, 8, 97–107. [Google Scholar] [CrossRef]
  64. Peng, J.; Zhao, S.; Liu, Y.; Tian, L. Identifying the urban-rural fringe using wavelet transform and kernel density estimation: A case study in Beijing City, China. Environ. Model. Softw. 2016, 83, 286–302. [Google Scholar] [CrossRef]
  65. Sun, Y.; Zhang, X.; Xin, Q.; Huang, J. Developing a multi-filter convolutional neural network for semantic segmentation using high-resolution aerial imagery and LiDAR data. ISPRS J. Photogramm. Remote Sens. 2018, 143, 3–14. [Google Scholar] [CrossRef]
  66. Haque, M.E.; Al-Ramadan, B.; Johnson, B.A. Rule-based land cover classification from very high-resolution satellite image with multiresolution segmentation. J. Appl. Remote Sens. 2016, 10, 036004. [Google Scholar] [CrossRef]
  67. Johnson, B.A.; Jozdani, S.E. Identifying generalizable image segmentation parameters for urban land cover mapping through meta-analysis and regression tree modeling. Remote Sens. 2018, 10, 73. [Google Scholar] [CrossRef] [Green Version]
  68. Zhang, H.; Fritts, J.E.; Goldman, S.A. Image segmentation evaluation: A survey of unsupervised methods. Comput. Vis. Image Underst. 2008, 110, 260–280. [Google Scholar] [CrossRef] [Green Version]
  69. Drǎguţ, L.; Tiede, D.; Levick, S.R. ESP: A tool to estimate scale parameter for multiresolution image segmentation of remotely sensed data. Int. J. Geogr. Inf. Sci. 2010, 24, 859–871. [Google Scholar] [CrossRef]
  70. Ma, J.; Li, Q.; Ying, W. Identification of a rural-urban fringe based on wavelet transform—A case study of Wuhan. Geomat. Inf. Sci. Wuhan Univ. 2016, 41, 235–241. [Google Scholar]
  71. Menaka, D.; Suresh, L.P.; Premkumar, S.S. Wavelet transform-based land cover classification of satellite images. Adv. Intell. Syst. Comput. 2015, 325, 45–854. [Google Scholar]
  72. Huang, X.; Zhang, L. A multiscale urban complexity index based on 3D wavelet transform for spectral-spatial feature extraction and classification: An evaluation on the 8-channel WorldView-2 imagery. Int. J. Remote Sens. 2012, 33, 2641–2656. [Google Scholar] [CrossRef]
  73. Zhang, J.; He, X. The center of city function in Guiyang, China: An evaluation with emerging data. Int. J. Sustain. Dev. Plan. 2020, 15, 735–741. [Google Scholar] [CrossRef]
  74. Chen, S.; Lang, W.; Li, X.; Shen, C.; Fan, Q. Determining the influence of building density on heat island effect using Baidu map and remote sensing. Photogramm. Eng. Remote Sens. 2018, 84, 549–558. [Google Scholar] [CrossRef]
  75. Aubrecht, C.; Torres, J.A.L. Evaluating multi-sensor nighttime earth observation data for identification of mixed vs. residential use in urban areas. Remote Sens. 2016, 8, 114. [Google Scholar] [CrossRef] [Green Version]
  76. Xiao, P.; Wang, X.; Feng, X.; Zhang, X.; Yang, Y. Detecting China’s urban expansion over the past three decades using nighttime light data. IEEE J. Sel. Top. Appl. Earth Obs. Remote Sens. 2014, 7, 4095–4106. [Google Scholar] [CrossRef]
  77. Gong, P.; Li, X.; Wang, J.; Bai, Y.; Chen, B.; Hu, T.; Liu, X.; Xu, B.; Yang, J.; Zhang, W.; et al. Annual maps of global articular impervious area (GAIA) between 1985 and 2018. Remote Sens. Environ. 2020, 236, 111510. [Google Scholar] [CrossRef]
Figure 1. Guangdong–Hong Kong–Macao Greater Bay Area, China.
Remotesensing 13 01801 g001
Figure 2. NTL data preprocessing of urban agglomerations in GBA.
Remotesensing 13 01801 g002
Figure 3. The heat map of Tencent Migration data in GBA.
Remotesensing 13 01801 g003
Figure 4. Structure analysis diagram.
Remotesensing 13 01801 g004
Figure 5. Weighted mean variance results of different scales.
Remotesensing 13 01801 g005
Figure 6. Urban agglomeration boundaries delineated by NTL.
Remotesensing 13 01801 g006
Figure 7. KDA of POI in Guangdong–Hong Kong–Macao Greater Bay Area.
Remotesensing 13 01801 g007
Figure 8. (a) Wavelet coefficient variance graph; (b) weighted average variance graph.
Remotesensing 13 01801 g008
Figure 9. Image after fusion of NTL and POI data by wavelet transform.
Remotesensing 13 01801 g009
Figure 10. Urban agglomeration boundaries delineated by NTL_POI.
Remotesensing 13 01801 g010
Figure 11. (a) Wavelet coefficient variance graph; (b) weighted average variance graph.
Remotesensing 13 01801 g011
Figure 12. NTL, POI and heat map image fused by wavelet transform.
Remotesensing 13 01801 g012
Figure 13. Urban agglomeration boundaries delineated after NTL_POI_HM fusion.
Remotesensing 13 01801 g013
Figure 14. Comparison before and after different data fusion.
Remotesensing 13 01801 g014
Figure 15. Comparison of results of urban agglomerations delineated by different data.
Remotesensing 13 01801 g015
Table 1. The proportion of the 22 kinds of POI data in Guangdong–Hong Kong–Macao Greater Bay Area during 2021.
DataSpatialData SourcesTime
Luojia-01130 m × 130 mhttp://59.175.109.173:8888/index.html, accessed on 25 March 20212018.10–2019.03
POI Density30 m × 30 mwww.amap.com, accessed on 25 March 20212021.03
Tencent Migration30 m × 30 mwww.amap.com, accessed on 25 March 20212020.01–2021.01
Google Earth4.78 m × 4.78 mhttp://earth.google.com/, accessed on 25 March 20212021.03
Table 2. Data description.
TrafficRestaurantShoppingLifeLeisureResidentialSchool
Macao170715723293031278153248
Hong Kong50,56957,50331,143870821,42831533285
Dongguan13,87813,38013,047899714,27018,9421350
Foshan7793615959384762820857641714
Guangzhou21,64527,73824,68612,39614,36616,1342544
Huizhou25,58028,14123,194541863577688625
Jiangmen10,47311,6875648223044102055607
Shenzhen15,51216,92010,52213,39718,96516,2021990
Zhaoqing475648413256125241311496298
Zhongshan738180116227346452615519579
Zhuhai11,94512,8399334231430532687315
Tourist AttractionsHospitalHotelFinancialGovernmentPublic ServicesBusiness
Macao8138621811562826847274
Hong Kong646810,95615,758131,8643178685757
Dongguan18,80822,29232,77543,27749692,46947,315
Foshan16,50220,60627,34237,26448267,09934,385
Guangzhou34,89346,57557,88276,418103495,45958,195
Huizhou10,16213,89512,34025,62223442,46711,564
Jiangmen90408168850917,94417455,4717996
Shenzhen20,65431,44949,31956,927675127,60350,372
Zhaoqing79636033724613,10115237,0994777
Zhongshan690710,32911,11817,2615837,35413,137
Zhuhai45766876590312,3323619,5846073
Table 3. Confusion matrix.
Data UrbanRuralAccuracyKappa
NTLUrban3326685.57%0.6256
Rural2612235
NPUrban3583688.97%0.7011
Rural712311
NPHUrban4461693.60%0.8155
Rural362362
Publisher’s Note: MDPI stays neutral with regard to jurisdictional claims in published maps and institutional affiliations.

