Abstract
This paper describes a simple, iterative atmospheric correction procedure based on the MODTRAN®5 radiative transfer code. Such a procedure receives in input a spectrally resolved at-sensor radiance image, evaluates the different contributions to received radiation, and corrects the effect of adjacency from surrounding pixels permitting the retrieval of ground reflectance spectrum for each pixel of the image. The procedure output is a spectral ground reflectance image obtained without the need of any user-provided a priori hypothesis. The novelty of the proposed method relies on its iterative approach for evaluating the contribution of surrounding pixels: a first run of the atmospheric correction procedure is performed by assuming that the spectral reflectance of the surrounding pixels is equal to that of the pixel under investigation. Such information is used in the subsequent iteration steps to estimate the spectral radiance of the surrounding pixels, in order to make a more accurate evaluation of the reflectance image. The results are here presented and discussed for two different cases: synthetic images produced with the hyperspectral simulation tool PRIMUS and real images acquired by CHRIS–PROBA sensor. The retrieved reflectance error drops after a few iterations, providing a quantitative estimate for the number of iterations needed. Relative error after the procedure converges is in the order of few percent, and the causes of remaining uncertainty in retrieved spectra are discussed.
1. Introduction
The radiance observed by a hyperspectral imager depends on illumination and observation geometry and on the interaction of solar radiation with the ground and atmosphere [1]. Gas absorption is the major responsible for the modulation of the atmospheric transmission spectrum. Furthermore, scattering by molecules and aerosols plays a significant role in the extinction of radiation [2] so that the radiation received by the sensor can be ascribed to different contributions, depending on scattering events occurring along each photon’s trajectory and its interaction with the ground. The estimate of these different contributions to the received radiation can be carried out by means of a direct Radiative Transfer Model (RTM) [3].
An atmospheric correction procedure performs the so-called inversion of the direct model: it retrieves the surface spectral reflectance from the (calibrated) at-sensor spectral radiance [4,5,6,7] and permits the characterization of the observed surface, regardless of the effects of atmosphere, illumination and observation geometry. Ground surface spectral reflectance is the starting point for terrain classification, the determination of different environmental parameters and the Earth radiation budget estimate [8]. Inversion is performed by simulating, via the RTM, the propagation of solar radiation through the atmospheric medium and its interaction with ground and air components.
Due to atmospheric scattering, a single sensor pixel collects, together with the radiance directly received from the corresponding ground pixel along the ground-to-sensor direction, two different contributions [5,6,9]: radiation diffused by the atmosphere without interaction with the ground (called path-radiance) and radiation scattered from the ground surrounding the generic ground pixel into its Instantaneous Field Of View (IFOV) by one or more scattering events. The latter contribution produces the mixing of signals coming from different (mainly adjacent) pixels. Such a mixing effect arises from the sum of two terms. The first is given by the light illuminating the pixel of interest after subsequent reflections and scattering between the surface and the atmosphere (due to light “trapping” between the ground and the overlaying air/aerosol) [9]. The second term takes into account the ground-leaving radiation received into the pixel’s IFOV after reflection by the surrounding ground (adjacency effect) and is the main subject of this paper [10].
Accurate atmospheric correction procedures are usually supervised, as the ones implemented in widely used software packages, such as FLAASH® (Fast Line-of-sight Atmospheric Analysis of Hypercubes) [11,12] and ATCOR® (Atmospheric & Topographic Correction) [13,14], which are both based on the outputs of the MODTRAN® (MODerate resolution atmospheric TRANsmission) RTM software [14,15,16]. These codes incorporate both scattering processes and the absorption of gas components. Iterative procedures have mainly been developed for the retrieval of spectral reflectance without a priori knowledge of atmospheric characteristics, e.g., the iterative procedure introduced in [17], which was developed for hyperspectral imagers working in the visible–Short Wave InfraRed (SWIR) spectral range. The iterative approach to atmospheric correction procedures has also been used in the retrieval of ocean colour from multispectral/hyperspectral images [18,19].
Since the first studies on atmospheric corrections, efforts have been made to evaluate the impact of adjacency effects on such procedures [20,21,22,23,24]. Generally, adjacency effects are evaluated by using an priori information on the spectral reflectance of neighbour pixels. Tanre et al. proposed one of the first approaches to solve the problem by defining a function, F(r), that models the effect of surrounding pixels as a function of their distance r from the observed one [21]. This function was later incorporated into the Radiative Transfer Equation (RTE) software 5S® and 6S® [9,22]. A similar, yet more sophisticated approach was adopted by Minomura et al., in which the dependence of the adjacency effect is correlated to the aerosol optical thickness [25]. Richter adopted a different approach to model adjacency, which relies on the difference between target reflectance and average reflectance and the ratio between diffuse transmittance and direct transmittance [26]. Atmospheric correction procedures often use the average reflectance of the surrounding pixels to evaluate the adjacency contribution to at-sensor radiance [27,28]. The procedure implemented in a recent release of ATCOR® used a spatial filter to derive the adjacent area’s apparent reflectance [29]. A different approach is the one developed for the detection and correction of water pixels affected by adjacency effects based on the comparison of spectra [30].
Starting from version 5.3.2, the MODTRAN® software [31] has been designed to produce dedicated outputs that can be easily implemented in the atmospheric correction procedure proposed by Verhoef [6,10]. The latter procedure evaluates effects related to the presence of adjacent areas by assuming a contribution that depends on their spatially averaged reflectance.
This paper proposes a method that iteratively applies the model adopted by Verhoef in order to correct the surrounding pixel contribution, assuming that the direct radiative transfer model provided by MODTRAN® 5.3.2 output is representative of the actual atmospheric conditions. The reflectance of the pixels present in the image is computed iteratively by successive approximations without the need of any a priori knowledge or assumptions about their reflectance. The novelty of the proposed method relies on its iterative approach to evaluate the contribution of surrounding pixels: a first run of the atmospheric correction procedure is performed by assuming that the spectral reflectance of the surrounding pixels is equal to that of the pixel under investigation. Such information is used in the subsequent iteration steps to calculate a new value for the mean spectral radiance of the surrounding pixels in order to make a more accurate evaluation of the reflectance image.
Below, the iterative procedure is described and the results obtained by applying it to both synthetic and real images are presented and discussed.
2. Materials and Methods
The atmospheric correction procedure proposed in this paper is an iterative procedure that uses MODTRAN® to model electromagnetic radiation propagation through the atmosphere. MODTRAN®, one of the most widely used radiation transfer models, assumes that the atmosphere is a stratified medium made up of plane-parallel layers between the ground and the Top Of Atmosphere (TOA) [16]. Starting from version 5, the MODTRAN® radiative transfer code implements the modelling approach proposed by Verhoef [1,6,10,31] for adjacency effects. Atmospheric correction input parameters are the Sun and observation (i.e., the sensor) geometries and atmosphere scattering, and absorption properties calculated from the constituent (i.e., gas and aerosol) profile at a given spectral resolution. The proposed approach considers flat terrain, absence of cloud cover, and Lambertian surfaces but neglects light polarization.
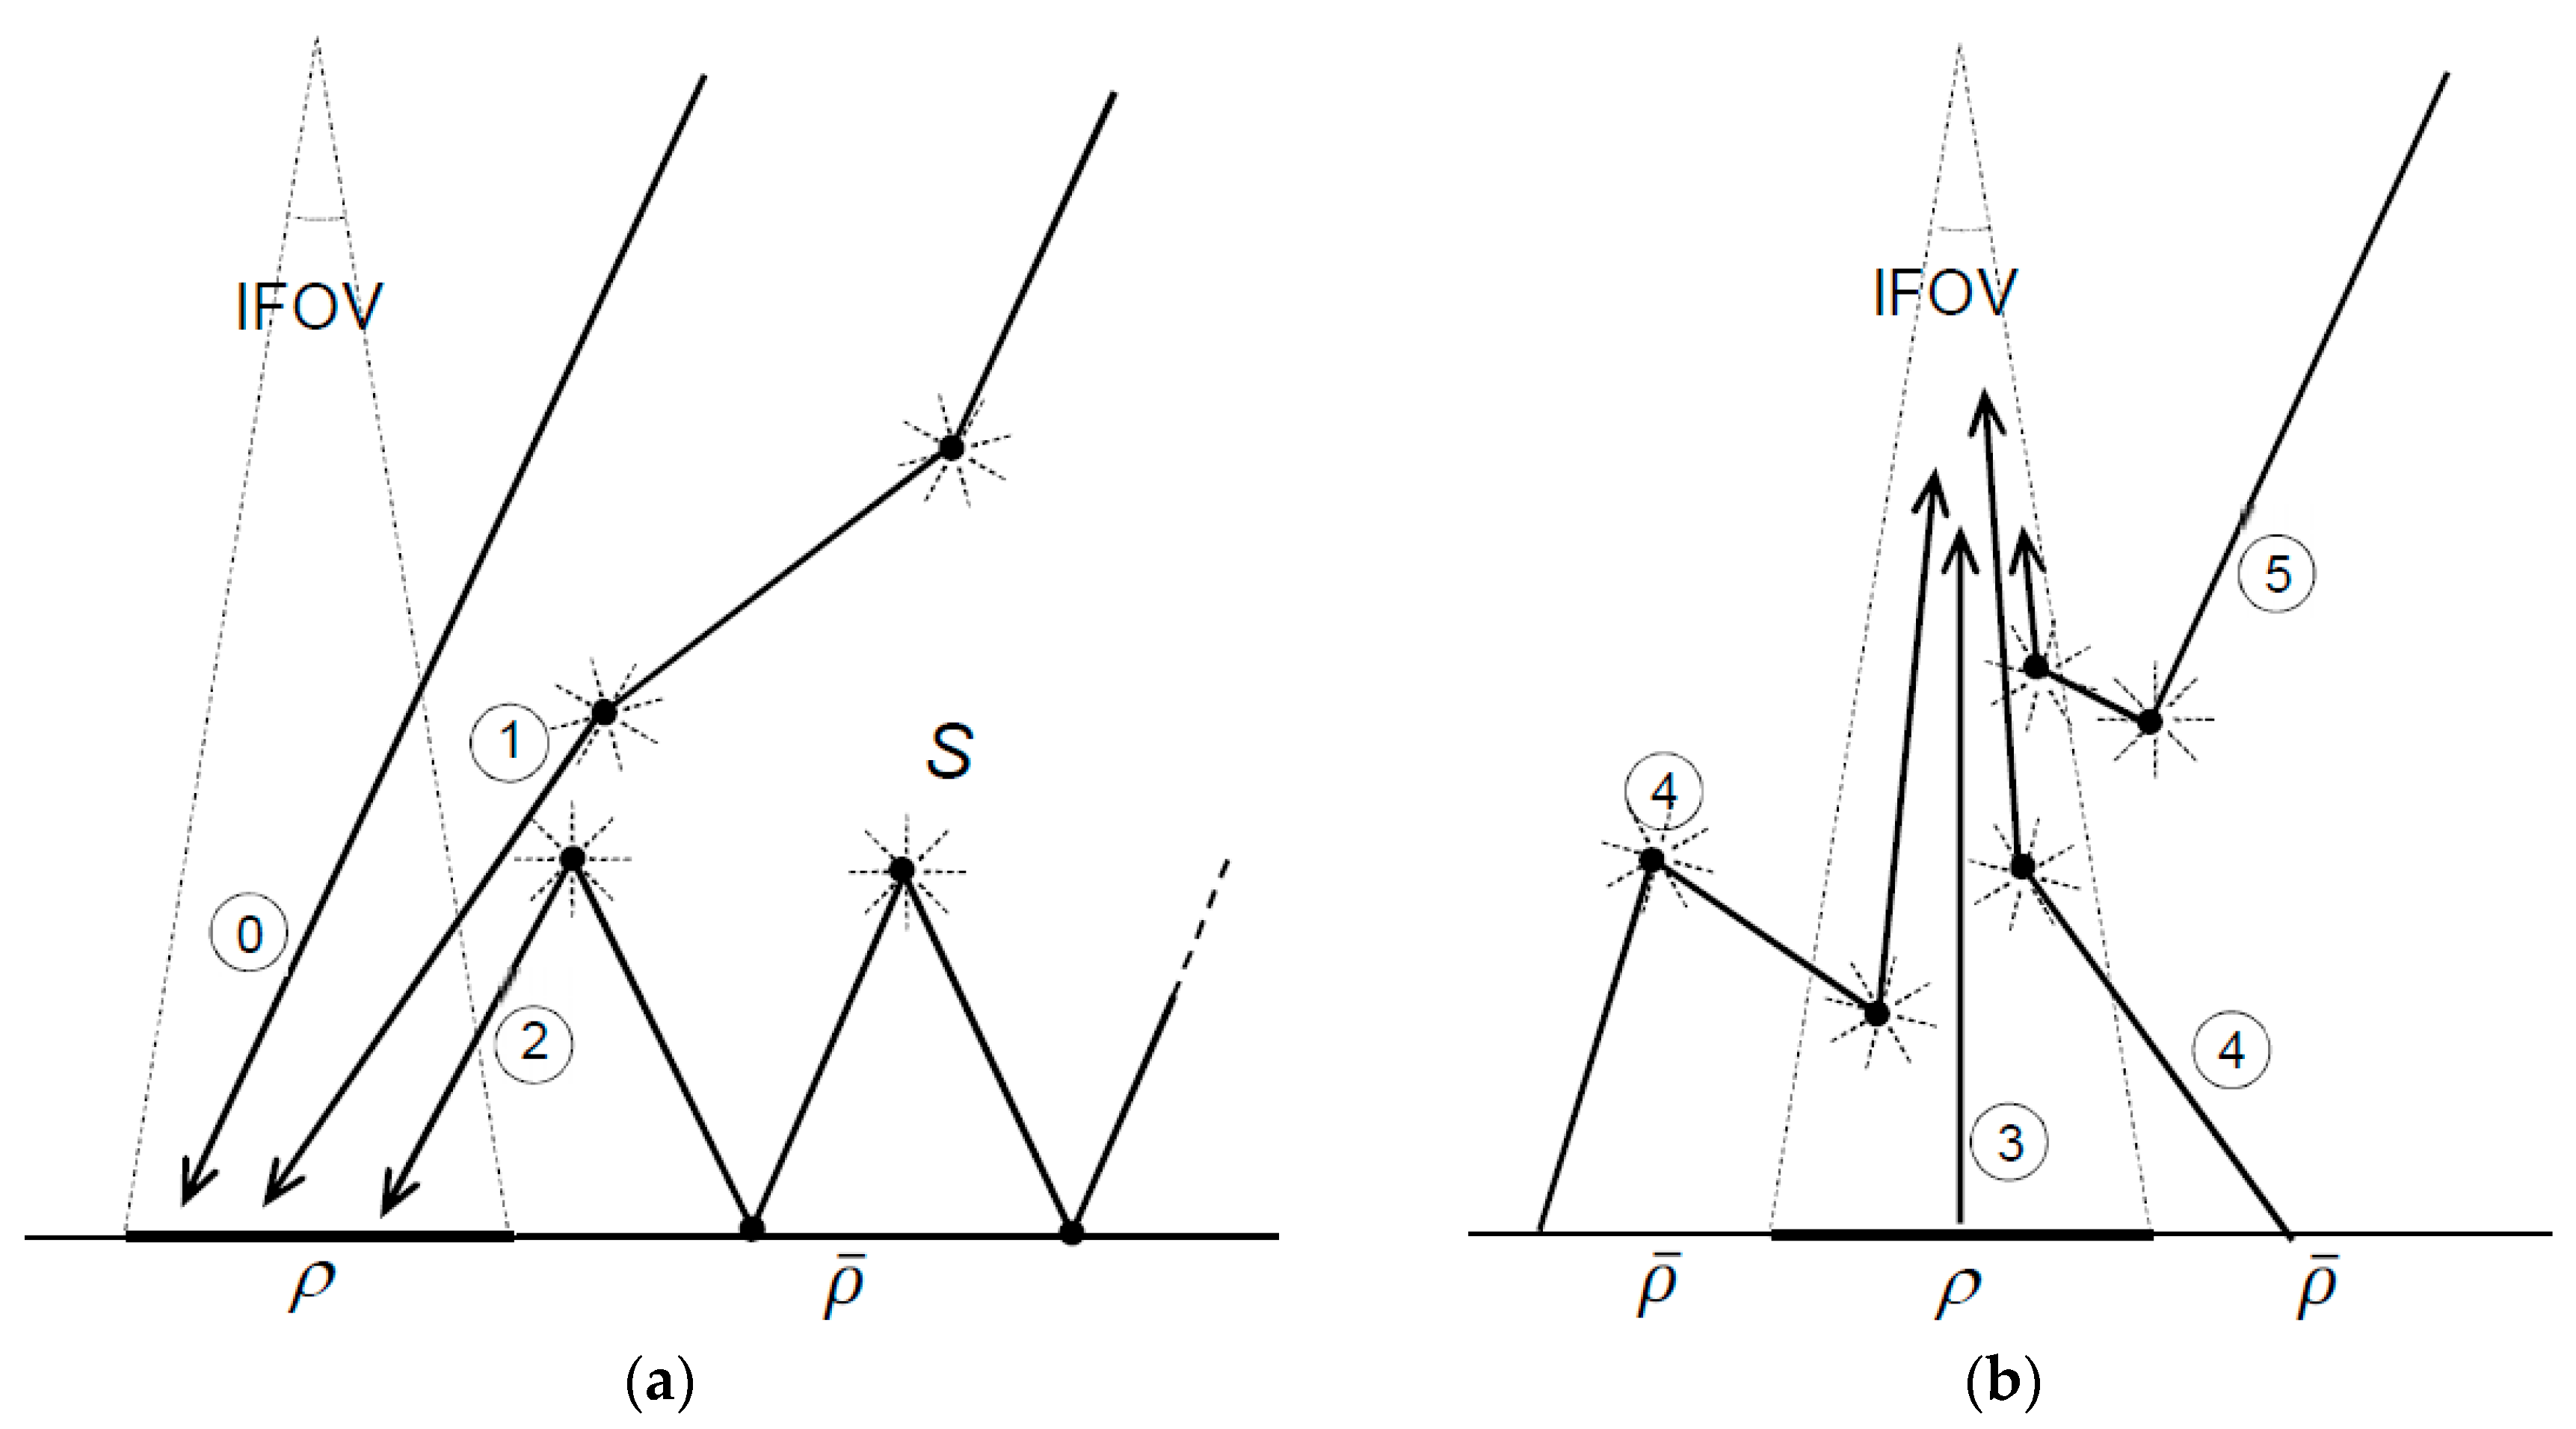
Following the nomenclature adopted by Verhoef [6,10], the spectral irradiance impinging on the generic ground pixel (with reflectance ) can be expressed as the sum of different contributions (Figure 1a): direct (modulated by atmospheric absorption and propagated along the Sun-to-ground-pixel line), diffuse (impinging on the pixel after one or more atmospheric scattering events) and diffuse after multiple interactions between the atmosphere (with albedo ) and the surrounding ground (with average reflectance ). As a consequence, the irradiance illuminating the generic ground pixel depends on the illumination/observation geometry, on the atmospheric medium, and on the contribution due to the reflectance (also called “hemispherical reflectance”) of the neighbouring terrain.
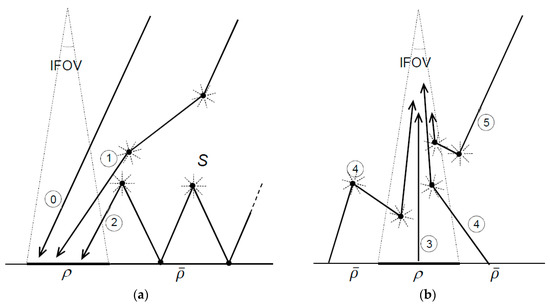
Figure 1.
(a) Contributions to the irradiance impinging on the generic ground pixel (with reflectance ) subtended by the IFOV of the corresponding image pixel: (0) direct Sun-to-pixel, (1) diffuse (impinging on the pixel after one or more scattering events, but without interaction with ground), (2) trapped between ground (with average reflectance ) and overlaying atmosphere (with albedo ). (b) Contributions to the radiation received into the generic IFOV: (3) directly from the corresponding ground pixel without scattering events, (4) from neighbouring pixels via diffuse radiation, and (5) path radiance non-interacting with ground.
The radiance reaching the sensor (function of the irradiance impinging on the ground pixel and its reflectance ) can further be divided into the following contributions (Figure 1b): the directly transmitted radiance modulated by the ground-pixel-to-sensor atmospheric transmittance, the atmosphere-backscattered radiation (with no ground interaction) and the diffuse radiance scattered into the IFOV after being reflected by adjacent ground pixels.
It is interesting to note that without contributions 2 (Figure 1a) and 4 (Figure 1b), the radiance acquired by each sensor pixel would be independent of the others. Pixel interdependence is caused by atmospheric scattering (either due to multiple ground reflections of contributions 2 (Figure 1a) or to adjacency contribution 4 (Figure 1b)).
For a generic wavelength and a Sun zenith angle , we consider as the total ground irradiance (direct plus diffuse, i.e., made up of the contribution 0 plus 1 of Figure 1a) impinging on a black ground (i.e., having zero reflectance). Therefore, the irradiance illuminating the generic ground pixel (having non-zero ground reflectance) can be written as the sum of the contribution 0, 1 and 2:
By substituting the corresponding limit of the series in (1), we get the total irradiance illuminating the pixel in the general case, considering for the contribution 2 an average reflectance .
Following the MODTRAN® notation as in [31] and defining and as the view zenith angle and the relative Sun-observer azimuth angle, the observed at-sensor radiance can be written as the sum of three terms: the path radiance , the radiance received directly from the ground pixel and modulated by the ground-to-sensor transmittance , and the radiance from its neighbouring pixels taking into account the reflectance of the spatially averaged value (Figure 1b):
where and are, respectively, the direct and diffuse transmittance of the atmosphere along the ground-to-sensor path, and is the contribution given by the path radiance. The terms , , , are determined by the MODTRAN® RTM output for a given atmospheric model, Sun position and observation geometry. The term depends on observation geometry; therefore, it varies according to the position of the pixels in the at-sensor radiance image. To calculate it, we hypothesize scene scanning along the sensor trajectory (common either in push-broom or whisk-broom acquisition), fixing the observation geometry for each column of the image. is provided by the RTM for three different values of and for, respectively, the leftmost, central and rightmost columns of the image. is then calculated by interpolation for each pixel of the image line.
Equation (2) can be expressed as apparent reflectance by normalizing for the lighting conditions, where is TOA solar irradiance:
Here and are, respectively, direct and diffuse transmittance by the atmosphere along the Sun-ground path and . Equation (3) is made up of three components: the first term never interacts with the ground; the second term takes into account the interaction of solar radiation with the observed pixel; and the third term considers the adjacency effects due to neighbouring pixels that have spatially averaged reflectance .
The apparent spectral reflectance must be integrated over the spectral width of the considered instrumental spectral channel. After making angular and spectral dependences implicit, Equation (3) can be re-written as
where the operator takes into account the integration over the channel spectral response, in which is the spectral interval and is the spectral response function integrally normalized to the unit.
It is an acceptable hypothesis that the spectral variation of the reflectance terms in the channel is modest; thus, the terms and (reflectance spectrally averaged in the channel) can be factored out of the spectral integration. Reintroducing the geometric series (as in [31]) and considering only the first two terms, Equation (4) can be rewritten as
This last formulation suggests that, for each spectral channel, the atmospheric albedo can be regarded as made of two contributions: , related to the pixel of interest, and , related to the surrounding pixels.
2.1. The Image Simulation Tool PRIMUS
The image simulation tool PRIMUS (PRISMA Realistic IMage Utility for Simulation) [32] takes into account the instrumental characteristics, the acquisition geometry and the major phenomena and interactions that affect the acquired hyperspectral images. In the simulation process the illumination and acquisition geometry, the spatial and spectral variability of the target, the atmosphere (aerosol and gas constituents) and its interaction with the soil are considered. PRIMUS uses the approach proposed by Verhoef and Bach [6] to take into account adjacency effects: the at-sensor radiance is calculated using the formula in Equation (3) assuming that the surrounding pixels are characterized by a spectral reflectance equal to their average value . Finally, the simulation process considers the main effects introduced by the instrument, such as sensor sampling, instrument optical characteristics, and noise. The image simulation tool is composed of three independent blocks:
- The scenario builder, which creates a reflectance ground map (associating combinations of spectra to the classes of thematic map);
- The atmospheric propagation calculator, which calculates the at-sensor radiance data cube using as input the reflectance map provided by the scenario builder. This step also simulates adjacency;
- The sensor simulator, which computes the synthetic images of the selected scenario considering instrumental effects (foreoptics transmittance, Modulation Transfer Function (MTF), detector sampling (spectral and spatial), and noise (e.g., photonic noise, and detector thermal noise).
PRIMUS is a powerful simulation tool that can be used to test and validate algorithms and procedures, thanks to the controlled flux of data and the presence of a verified “ground truth”.
In the framework of this paper, PRIMUS was used to generate synthetic images to test critical issues of the iterative procedure described in next section, in particular in the case of sharp spatial/spectral gradients inside the image when the contribution to the apparent reflectance given by adjacency effects is maximum. PRIMUS is an end-to-end simulator that gives the possibility of comparing retrieved data with input data (acting as ground truth). The simulation is performed at a high-spectral-resolution, which allows convolution with the sensor response for each spectral channel.
3. Iterative Atmospheric Correction Procedure
The proposed iterative method aimed at solving Equation (5) by assuming that, at the first iteration, the spectral reflectance of the surrounding pixels was almost equal to the one observed, i.e., . Following the iterative approach, the first run of the correction procedure evaluated the spectral reflectance of each pixel of the entire image on the assumption that . The reflectance retrieved in the first run was used in the following step to calculate the new value for the mean spectral reflectance of surrounding pixels . The new value of was used in a new evaluation of the reflectance image. The iteration process can be summarized as follows:
- STEP 0:
- Assuming , and from Equation (6) have an average as
- Under these assumptions, the apparent reflectance can be expressed asand the at-ground spectral reflectance at order 0 is
For each pixel of the processed image, the value of reflectance in (9) was used to determine the mean spectral reflectance averaged on the entire image. Therefore, then became the input for the next iteration.
- STEP 1:
Using the average as a mean value for the reflectance of the surrounding pixels, the spectral reflectance at the first order was expressed as
Then the average value was calculated by spatial averaging as in the previous step and used as input for the next iteration.
- STEP N:
At present, the number of iterations is set by the user. An alternative solution is offered by an iteration stopping as soon as the minimum of a user-defined suitable functional is reached. A candidate for the functional could be the global (i.e., calculated on the entire image or on the main regions of interest) relative variation of the reflectance image with respect to as calculated in the previous step.
The model proposed by Verhoef and Bach [6] and described in the previous section assumes, for the evaluation of the average value of Equation (1), an equal contribution by all the surrounding pixels in the image (i.e., a spatial average on the entire image). In principle, our approach can exploit the possibility of using, when available, a non-uniform distribution for spatially weighting the average reflectance to take into account the surrounding pixel contribution as a function of the distance from the target pixel. In the trivial case in which the weighting function is the uniform distribution, the value of is the reflectance spatially averaged over the entire image and spectrally averaged in the channel , as adopted by Verhoef and the present paper.
Implementation of the Procedure
The iterative procedure was implemented in a stand-alone software procedure using as input data the MODTRAN® 5.3.2 radiative transfer software output data. In this version of MODTRAN, the four-stream model [6] produced outputs useful for the calculation of the terms introduced in Equation (2). In particular, from the dedicated *.acd MODTRAN output file, the following five quantities were extracted and spectrally averaged by using a user-selected filter (Gaussian-triangular-rectangular) with the central wavelength and the Full-Width Half Maximum (FWHM) of each spectral band of the sensor and by implementing the calculation of Equations (7)–(11): Sun-to-ground diffuse transmittance of the atmosphere , Sun-to-ground direct transmittance , observer-to-ground embedded diffuse transmittance , observer (or sensor)-to-ground direct transmittance , and spherical albedo of the atmosphere . The value of was calculated from and and the Sun’s zenith angle was computed for user-selected geographic coordinates and time of the day.
Concerning the observation geometry, we assumed a pushbroom acquisition mode (across-track acquisition); that is, the sensor observed a spectrally resolved single line on the ground, orthogonal to the flight direction. In pushbroom geometry, observation angles are constant along the flight direction (along-track), i.e., for each column of the image. Differences in observation angles for each pixel in each row of the image are managed by interpolating three different MODTRAN run with proper and angles for, respectively, the left, central and right column of the image (with respect to the flight direction).
The spectrally averaged values for each parameter are angularly interpolated and the zero-order reflectance image is calculated. Further iterations allow for the calculation of the N-order reflectance , integrated over the spectral width of the considered band as in (11). The selection of input data and the settings for the output as well as the number of iterations can be customised.
The code is entirely developed in Java language and runs on every OS implementing a Java Virtual Machine able to run standard Java bitcode.
4. Results
The iterative algorithm was applied to two different images: a simulated image, produced with the in-house developed hyperspectral image simulator, PRIMUS (introduced in Section 2.1) on the PROBA-1 (Project for On-Board Autonomy-1) platform. The simulated image was used to test the algorithm’s performance on a supervised data set in which almost all the parameters involved in hyperspectral image acquisition can be controlled. The test on the CHRIS image was exploited to assess the performance of the algorithm when applied to a realistic case study.
4.1. Atmospheric Correction Procedure Applied to the Simulated Image
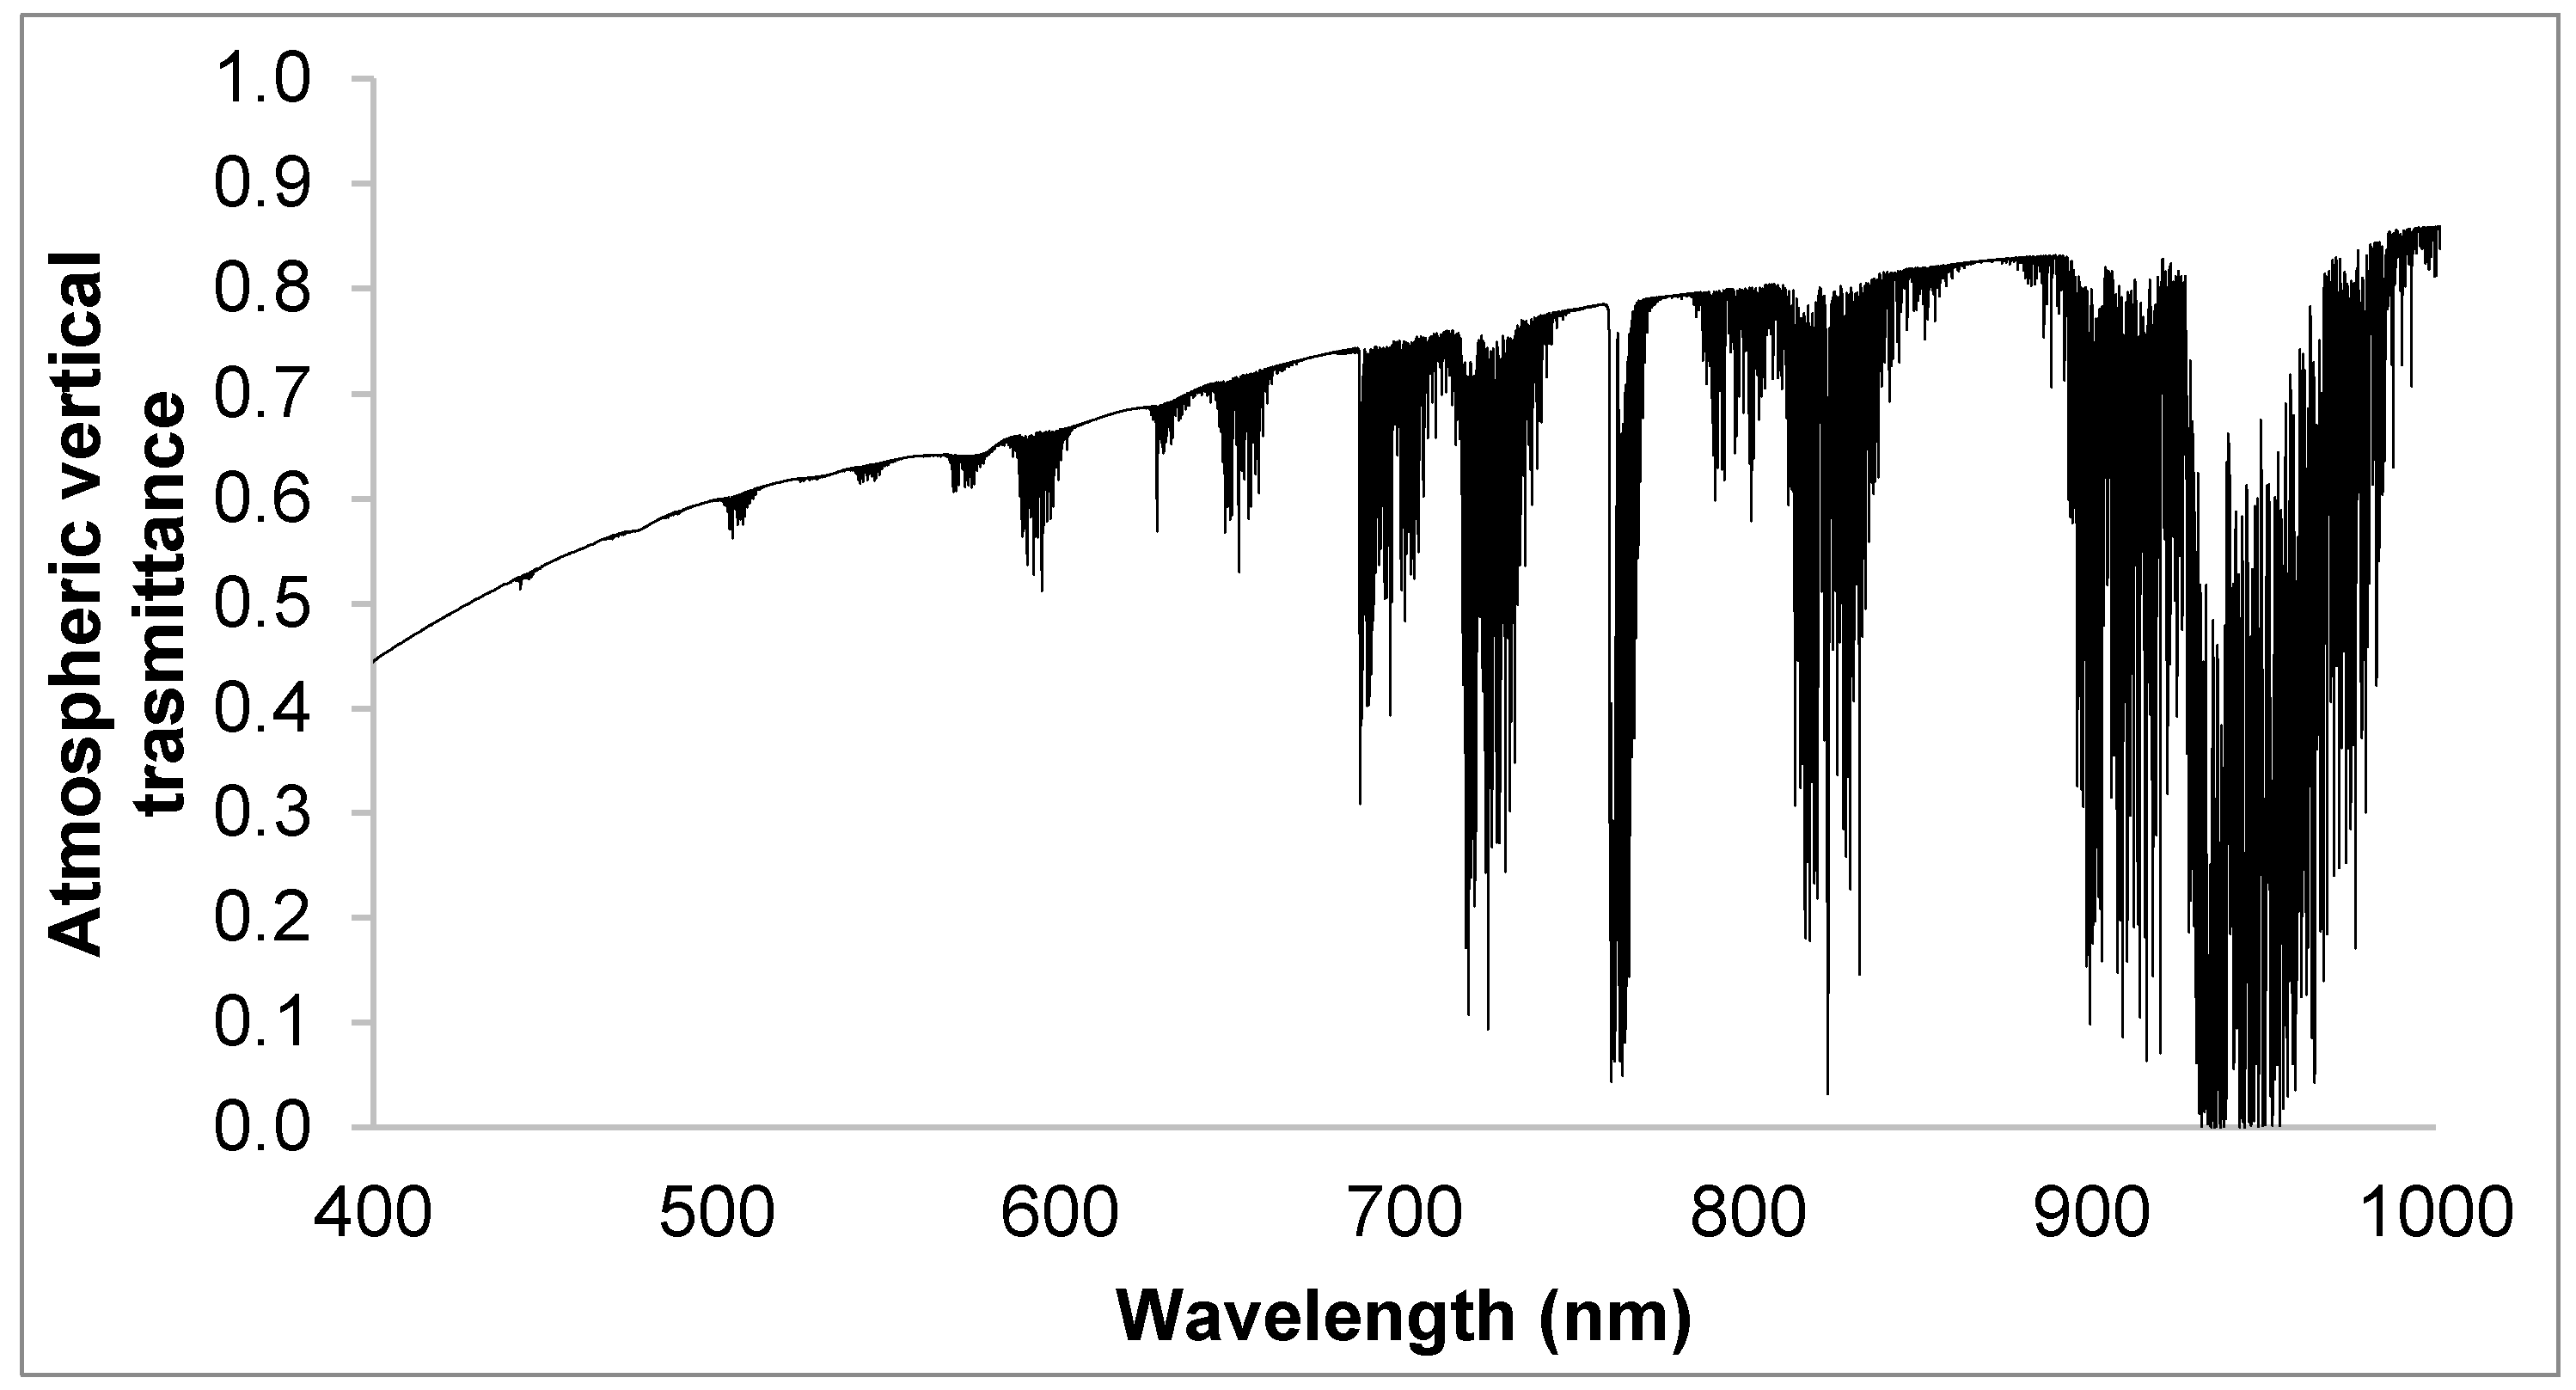
For the purposes of this paper, the simulation performed by PRIMUS was simplified by directly providing as input a high-spectral-resolution ground-reflectance datacube and neglecting the simulation of electronic noise or MTF (the effect of detector was given by the spectral convolution of the image in each spectral channel). The input for the simulation of the at-sensor-radiance image was provided by a synthetic, high-spectral-resolution, 30 × 20 pixel reflectance datacube with 601 spectral bands at a step of 1 nm in the range of 400 to 1000 nm. Such a ground reflectance image was generated to represent a principal case in which an adjacency contribution could influence pixel mixing, leading to an incorrect estimation of ground reflectance. The image was, consequently, non-representative of natural ground features; on the contrary, it presented a different combination of ground spatial and spectral patterns. This ground reflectance image was used as input to generate the corresponding at-sensor radiance image. The sensor simulated by PRIMUS has 64 channels having Gaussian spectral response, mirroring the characteristics of existing hyperspectral sensors in the same spectral range. The position of the channels and spectral widths are reported in Table 1. As a consequence of spectral convolution with the simulated sensor’s channels, the simulated at-sensor-radiance image maintained the original spatial dimension of 30 × 20 pixels but only on 64 spectral bands in the 400–1000 nm range. At this point, the PRIMUS tool provided the at-sensor-radiance input image to test our retrieval procedure. The atmospheric vertical profile used for the simulation is shown in Figure 2.

Table 1.
Characteristics of simulated bands. The channels’ central wavelength (λc) and FWHM were chosen to be representative of existing hyperspectral sensors; in this case, the simulation mirrored the ASI sensor PRISMA bands in the 400–1000 nm range. Values are reported in nanometers.
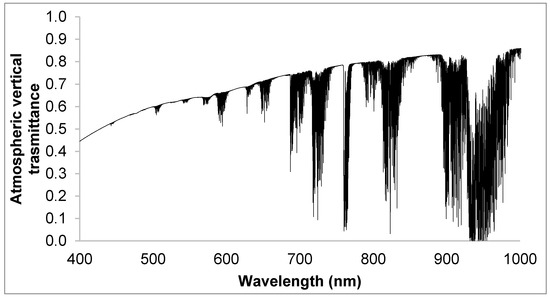
Figure 2.
Vertical transmittance of the atmosphere used for the simulation.
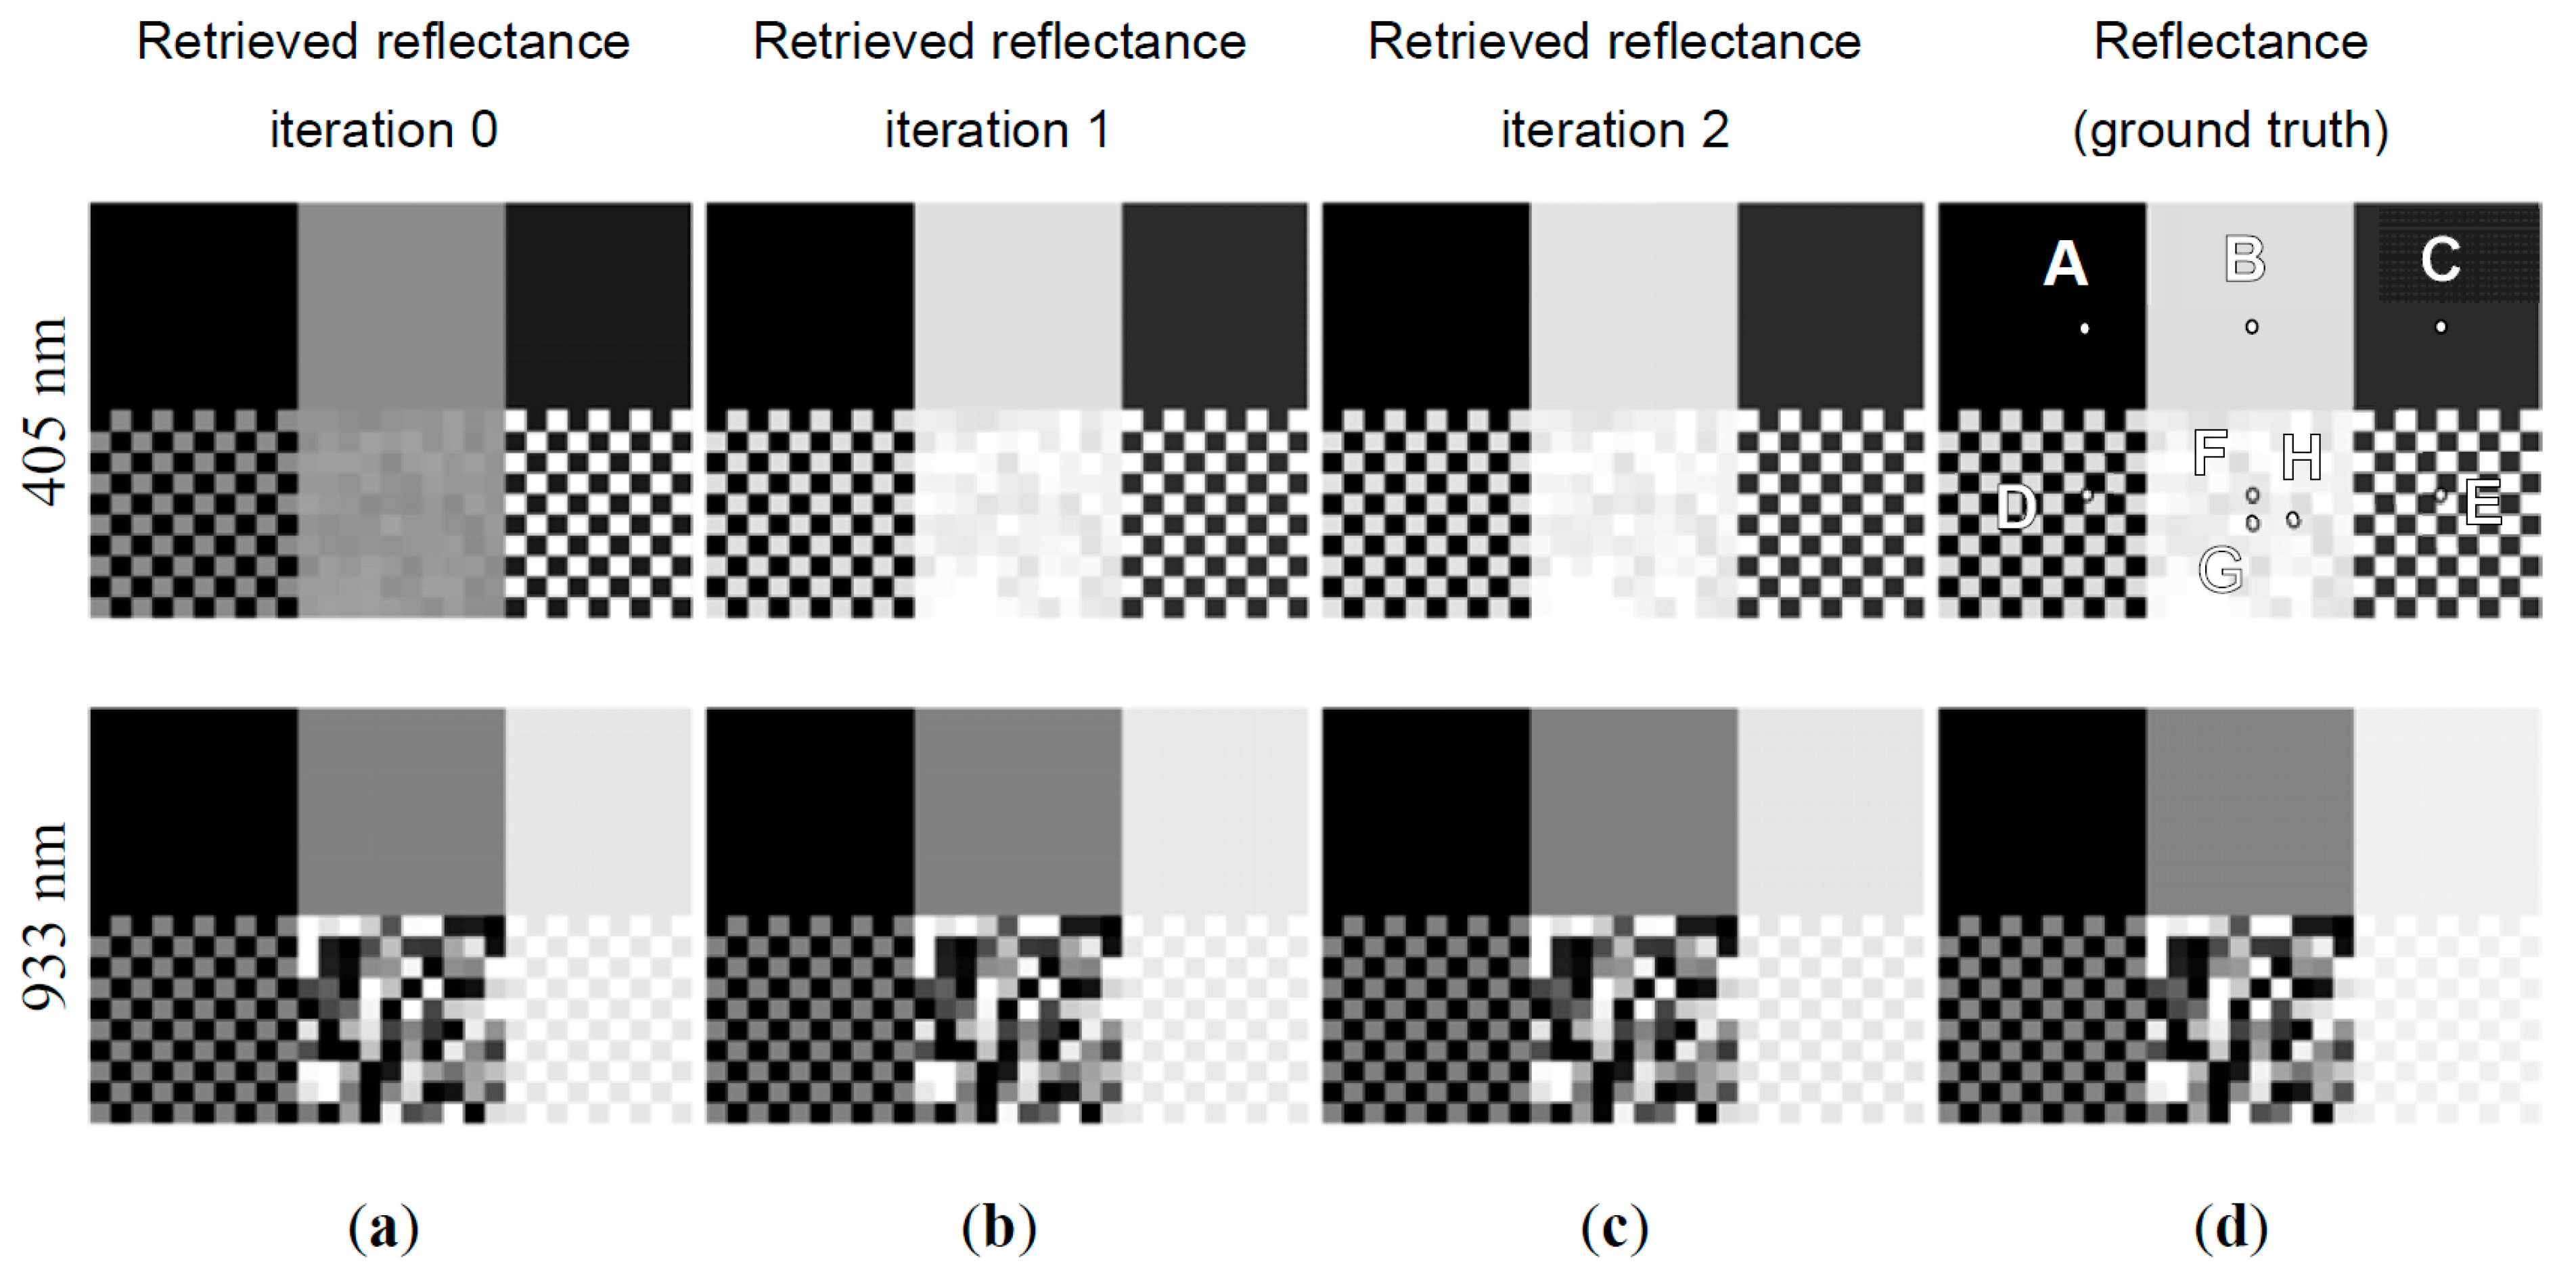
The image is made up of six different subimages, characterized by six different 10 × 10 pixel reflectance patterns. The dots in Figure 3 show the pixel position for which the reflectance was extracted. The pixels were chosen following the desiderata described in the following list.
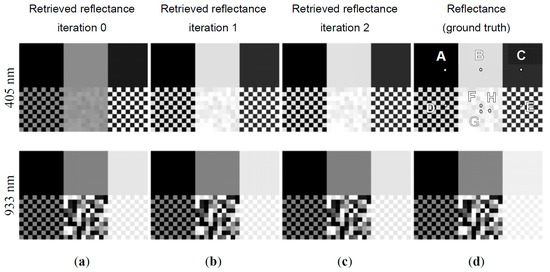
Figure 3.
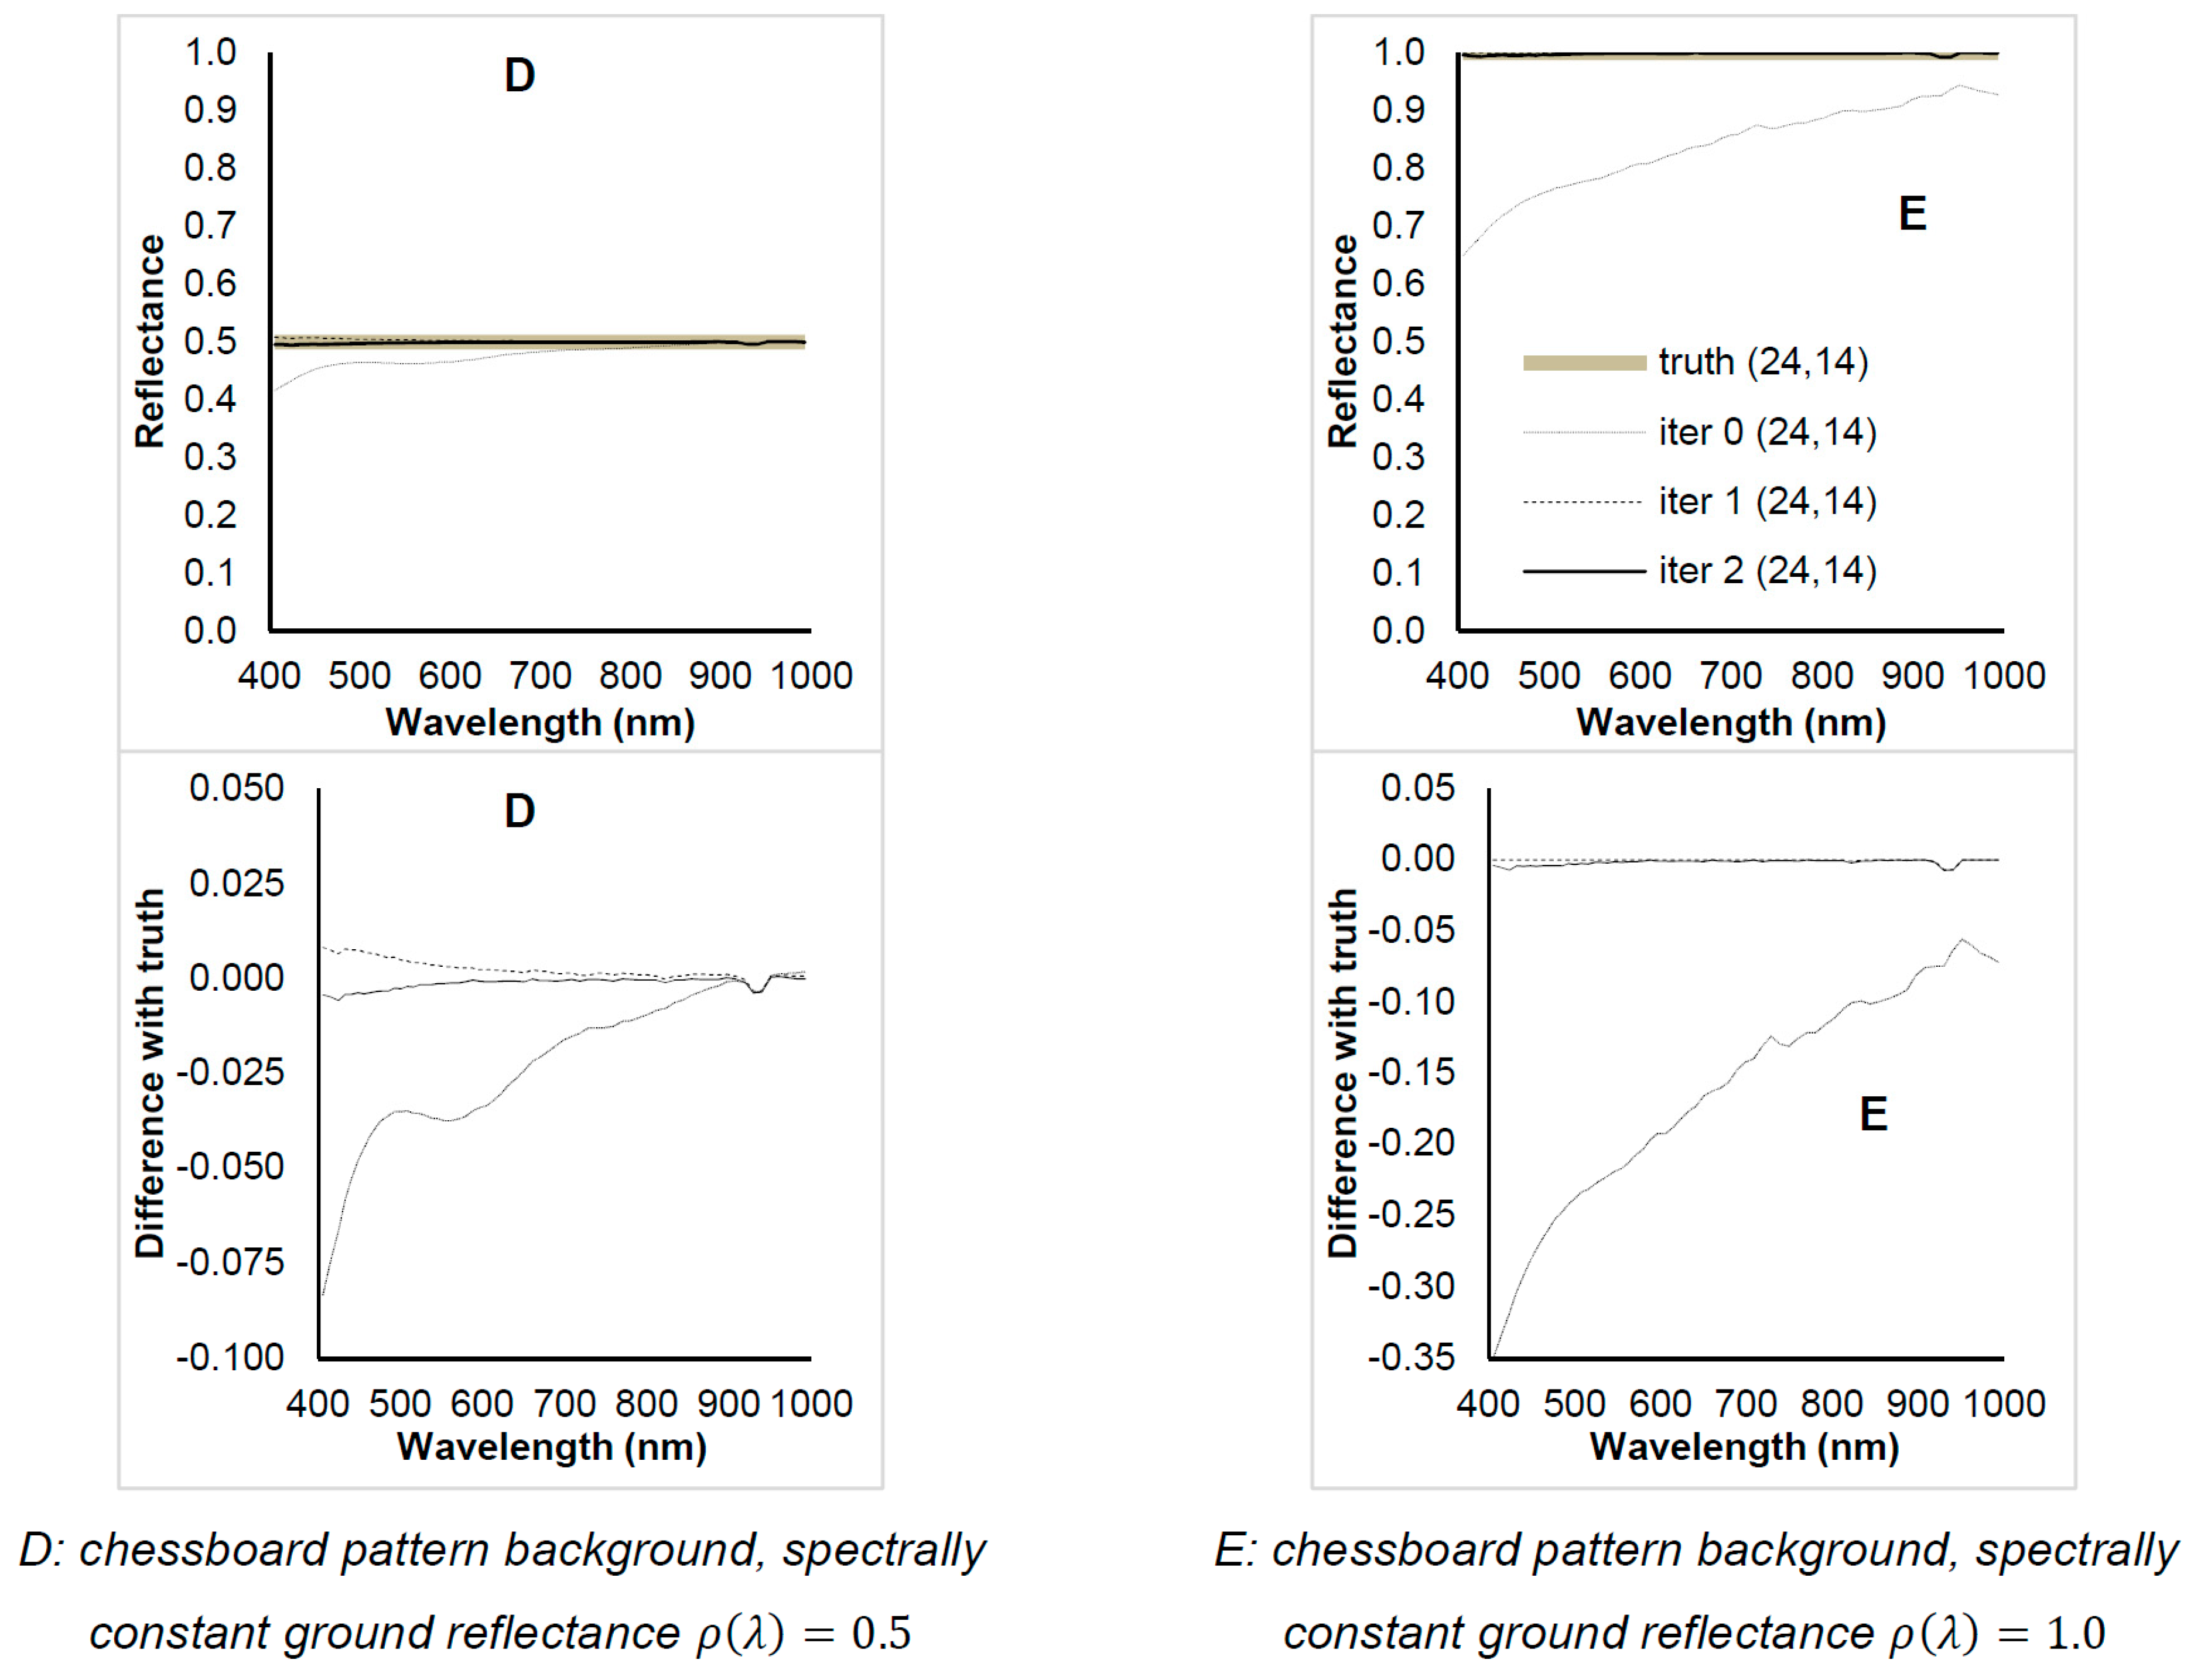
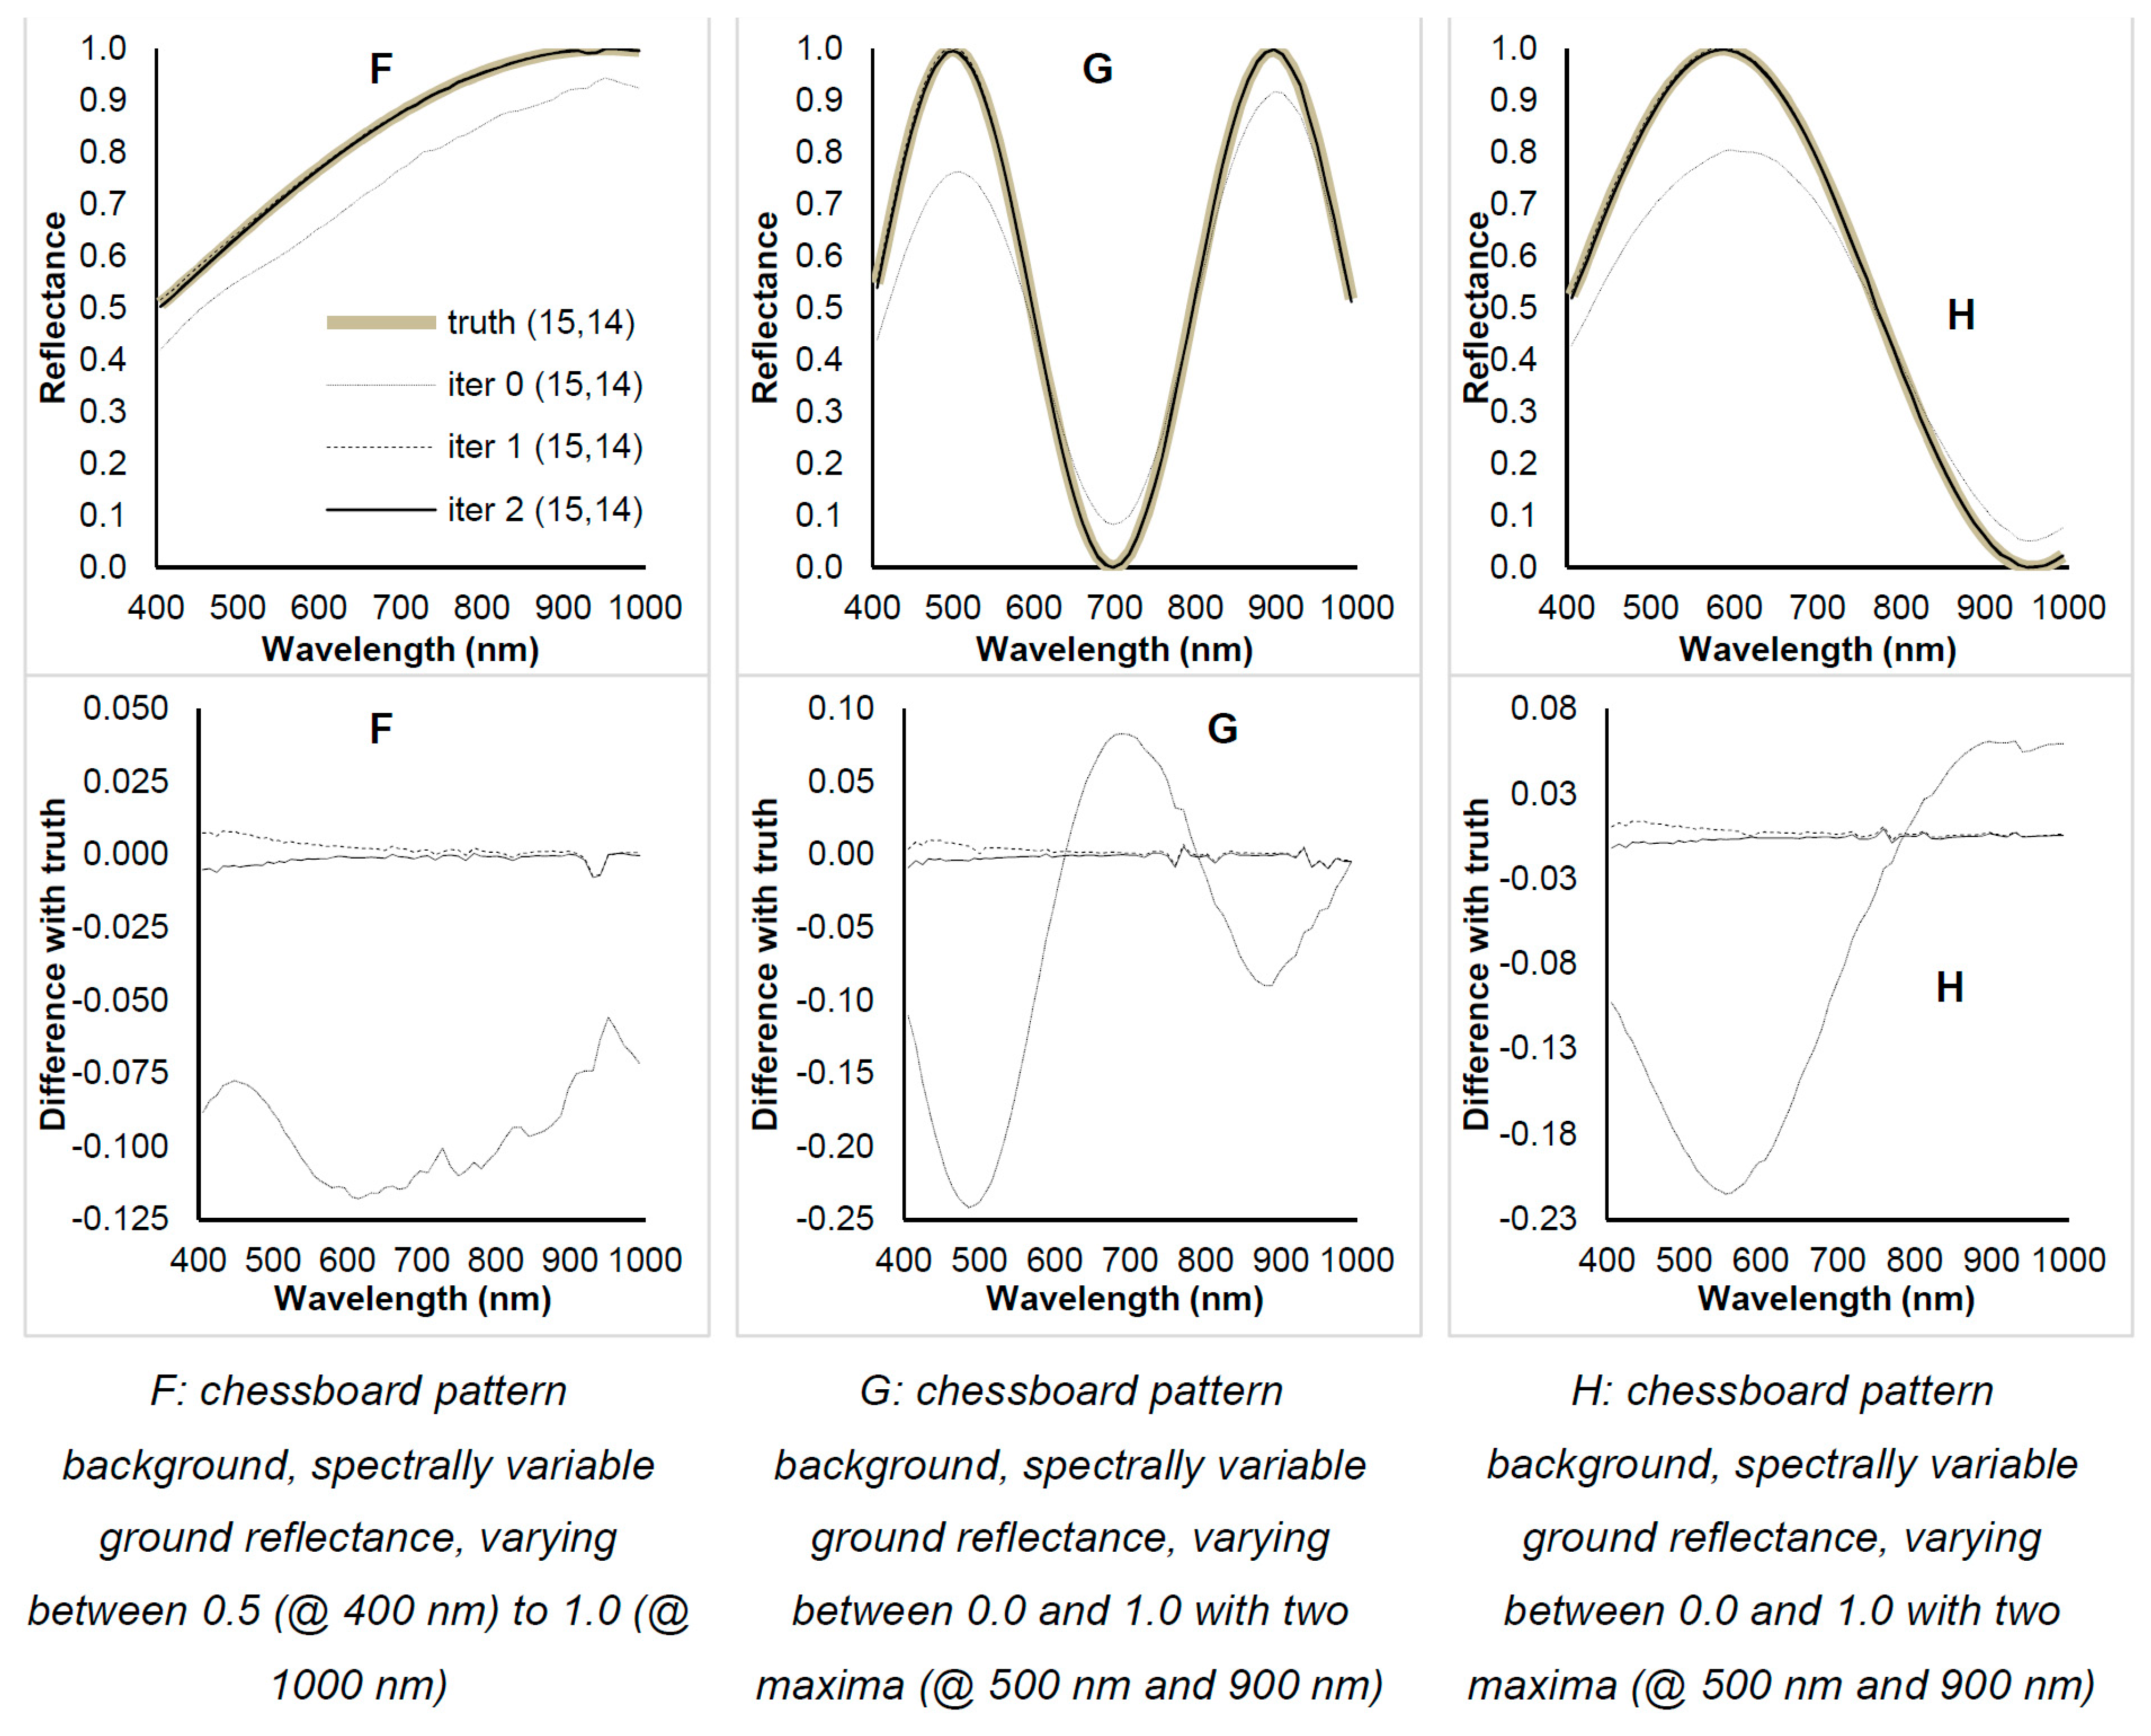
Retrieved reflectance after 0, 1 and 2 iterations (columns a–c) compared with the corresponding ground truth (d). The images show the first (405 nm) and the last (993 nm) channel of the simulated sensor. The ground truth (column d) represents the ground image normalized for illumination effects and observed without the presence of the atmosphere. Such ground truth is obtained by the convolution of the high-spectral-resolution reflectance image (used as input for the at-sensor radiance simulation) with the sensor spectral response. Eight spectra have been selected in positions corresponding to the dots in the top-right image. The selected reflectance spectra (shown in Figure 4, Figure 5 and Figure 6) are representative of different ground conditions: pixels surrounded by spatially uniform reflectance (A, B, C); pixels surrounded by the chessboard spatial pattern, spectrally constant (D, E); pixel surrounded by chessboard spatial pattern, spectrally variable (F, G, H).
Pixels surrounded by spatially uniform reflectance
- A:
- pixel with black reflectance (spectrally constant: ) surrounded by pixels with the same reflectance value;
- B:
- pixel with grey reflectance (spectrally constant: ) surrounded by pixels with the same reflectance value;
- C:
- pixel with spectral reflectance linearly increasing from 0.1 (at 400 nm) to 0.9 (at 1000 nm) surrounded by pixels with the same reflectance value;
Pixels surrounded by chessboard spatial pattern, spectrally constant
- D:
- pixel with grey reflectance (spectrally constant: ) surrounded by a chessboard spatial pattern of pixels with reflectance between 0.5 and 1.0;
- E:
- pixel with unitary reflectance (spectrally constant: ) surrounded by a chessboard spatial pattern of pixels with reflectance increasing from 0.0 (at 400 nm) and 0.5 (at 1000 nm);
Pixels surrounded by random spatial pattern, spectrally variable:
- F:
- pixel with ground reflectance varying between 0.5 (at 400 nm) to 1.0 (at 1000 nm) surrounded by a random spatial pattern, spectrally variable;
- G:
- pixel with ground reflectance varying between 0.0 and 1.0 with two maxima (@ 500 nm and 900 nm) surrounded by a random spatial pattern, spectrally variable;
- H:
- pixel with ground reflectance, varying between 0.0 and 1.0 with two maxima (@ 500 nm and 900 nm) surrounded by a random spatial pattern, spectrally variable.
The procedure for determining ground reflectance was run iteratively. The result after each iteration was compared with the ground truth to test the goodness of the reconstructed reflectance.
The retrieved reflectance spectrum was compared with the corresponding ground truth image, which is, by definition, the image observed by the sensor, normalized for illumination effects and observed without the presence of the atmosphere. As a consequence, the ground truth has the physical dimensions of a reflectance. It was obtained directly by the convolution of the high-spectral-resolution reflectance image (the same used as input for the at-sensor radiance simulation by PRIMUS) with the sensor spectral response for each channel (as in Table 1).
Figure 3 shows, for the first and last spectral channels, a change in the retrieved reflectance while the iteration number increased. The ground truth reflectance is also shown together with the position of the eight points, the spectra of which were individually analysed. Each point was representative of different ground conditions: pixels surrounded by spatially uniform reflectance (A, B, C); pixels surrounded by a chessboard spatial pattern, spectrally constant (D, E); pixel surrounded by a chessboard spatial pattern, spectrally variable (F, G, H).
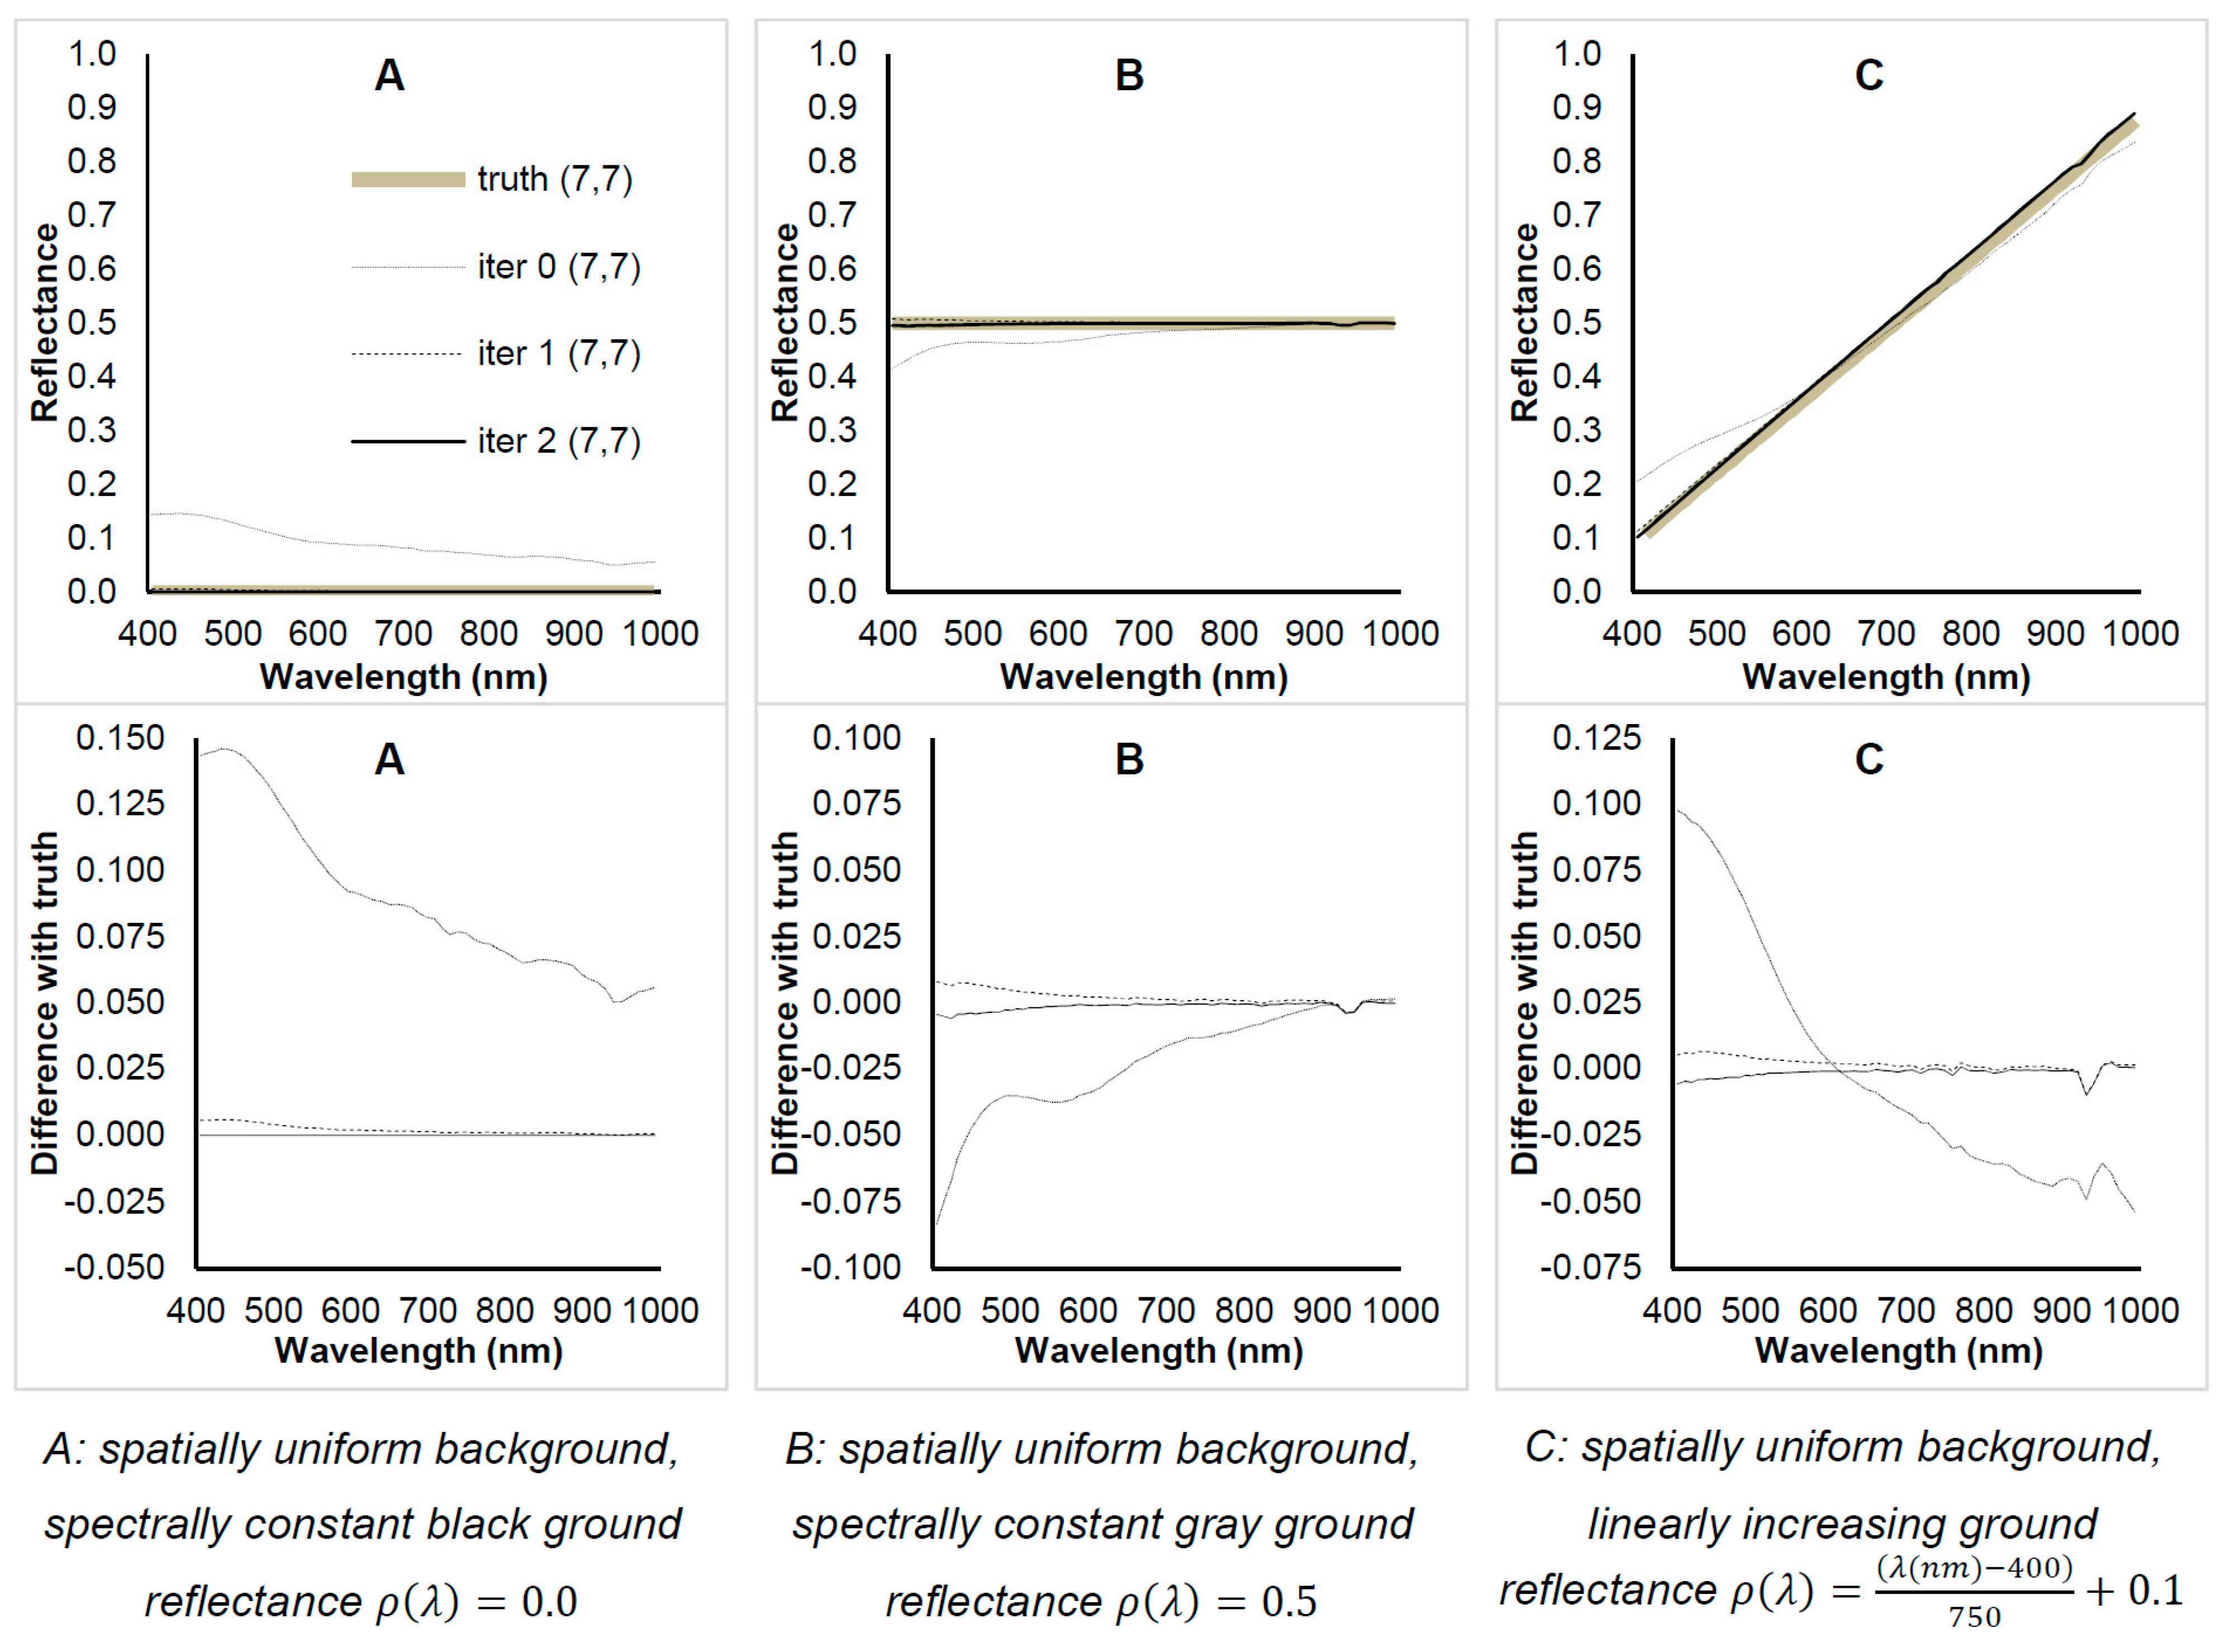
For points A to H, Figure 4, Figure 5 and Figure 6 illustrate the results of successive iterations compared with “ground truth” data. The Reflectance spectra and the difference from the ground truth were plotted for all the selected points. Note that the algorithm set to 1 all reflectance values greater than 1. We observed that the ground pattern affected the first retrieval of ground reflectance (iteration 0), given that it was a spectrum retrieved under the assumption of a spatially constant reflectance value. The retrieved values of reflectance converged to the ground truth (grey line) after the first iteration.
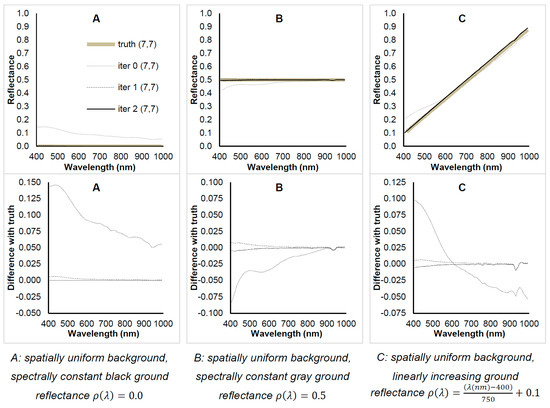
Figure 4.
Reflectance spectra for the pixels A to C as the number of iterations increases. The pattern of surrounding pixels affects the first retrieval (iteration 0). The retrieved reflectance converges to the real value after the subsequent iterations. Both the reflectance spectra (at the top) and their difference with the ground truth (at the bottom) are shown.
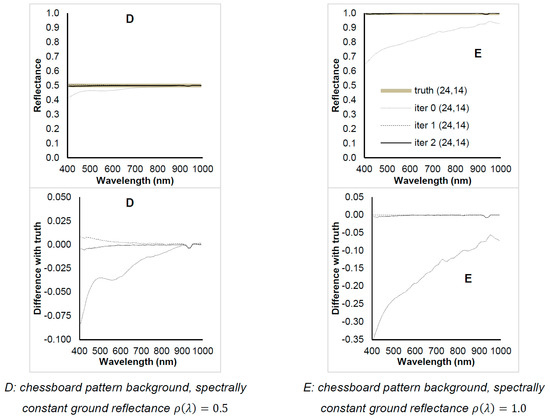
Figure 5.
Reflectance spectra of the pixels D and E as the number of iterations increases. The pattern of surrounding pixels affects the first retrieval (iteration 0). Both the reflectance spectra (at the top) and their difference with the ground truth (at the bottom) are shown.
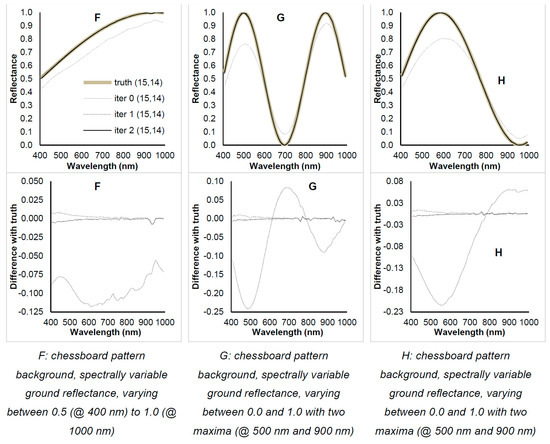
Figure 6.
Reflectance spectra of the pixels F, G and H as the number of iterations increases. The pattern of surrounding pixels affects the first retrieval (iteration 0). The retrieved reflectance converges to the real value after the subsequent iterations. Both the reflectance spectra (at the top) and their difference with the ground truth (at the bottom) are shown.
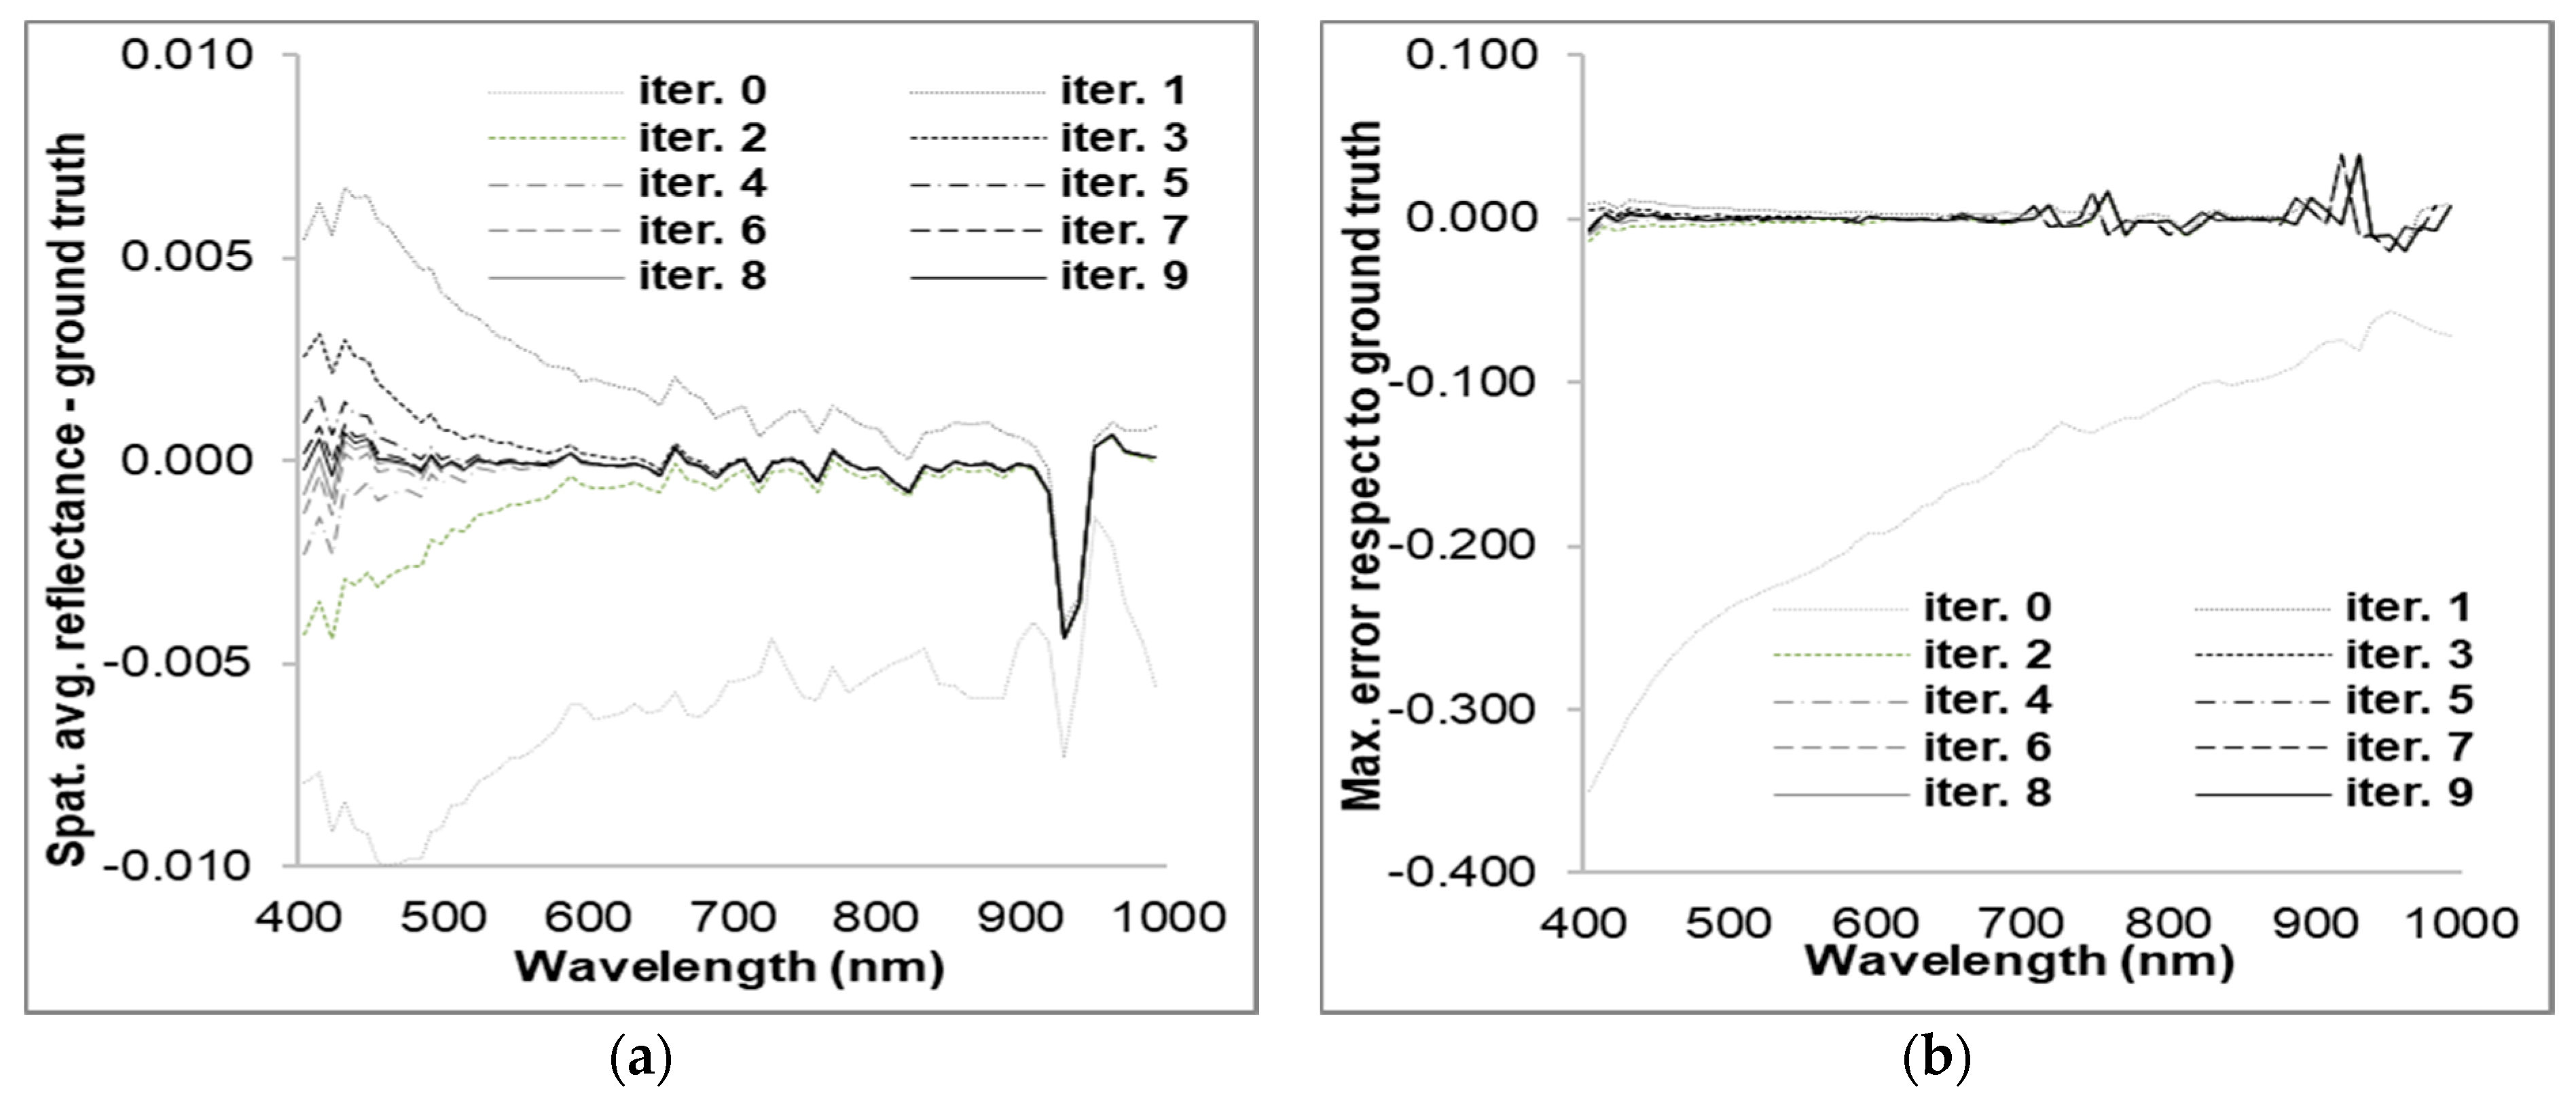
An analogous analysis was carried out for the entire image for each spectral channel: the difference between the entire retrieved reflectance image and the ground truth was evaluated as the iteration number increased. Figure 7 shows, as a function of the wavelength, the difference between the spatially averaged reflectance image and the spatially averaged ground truth (a) and the maximum error value between retrieved reflectance and ground truth (b) after each iteration.
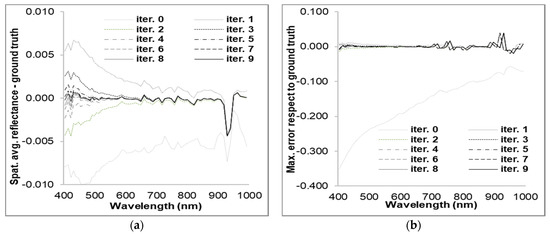
Figure 7.
Difference (a) between the spatially averaged reflectance image and the spatially averaged ground truth and maximum error (b) between retrieved reflectance and ground truth as a function of the wavelength after each iteration steps.
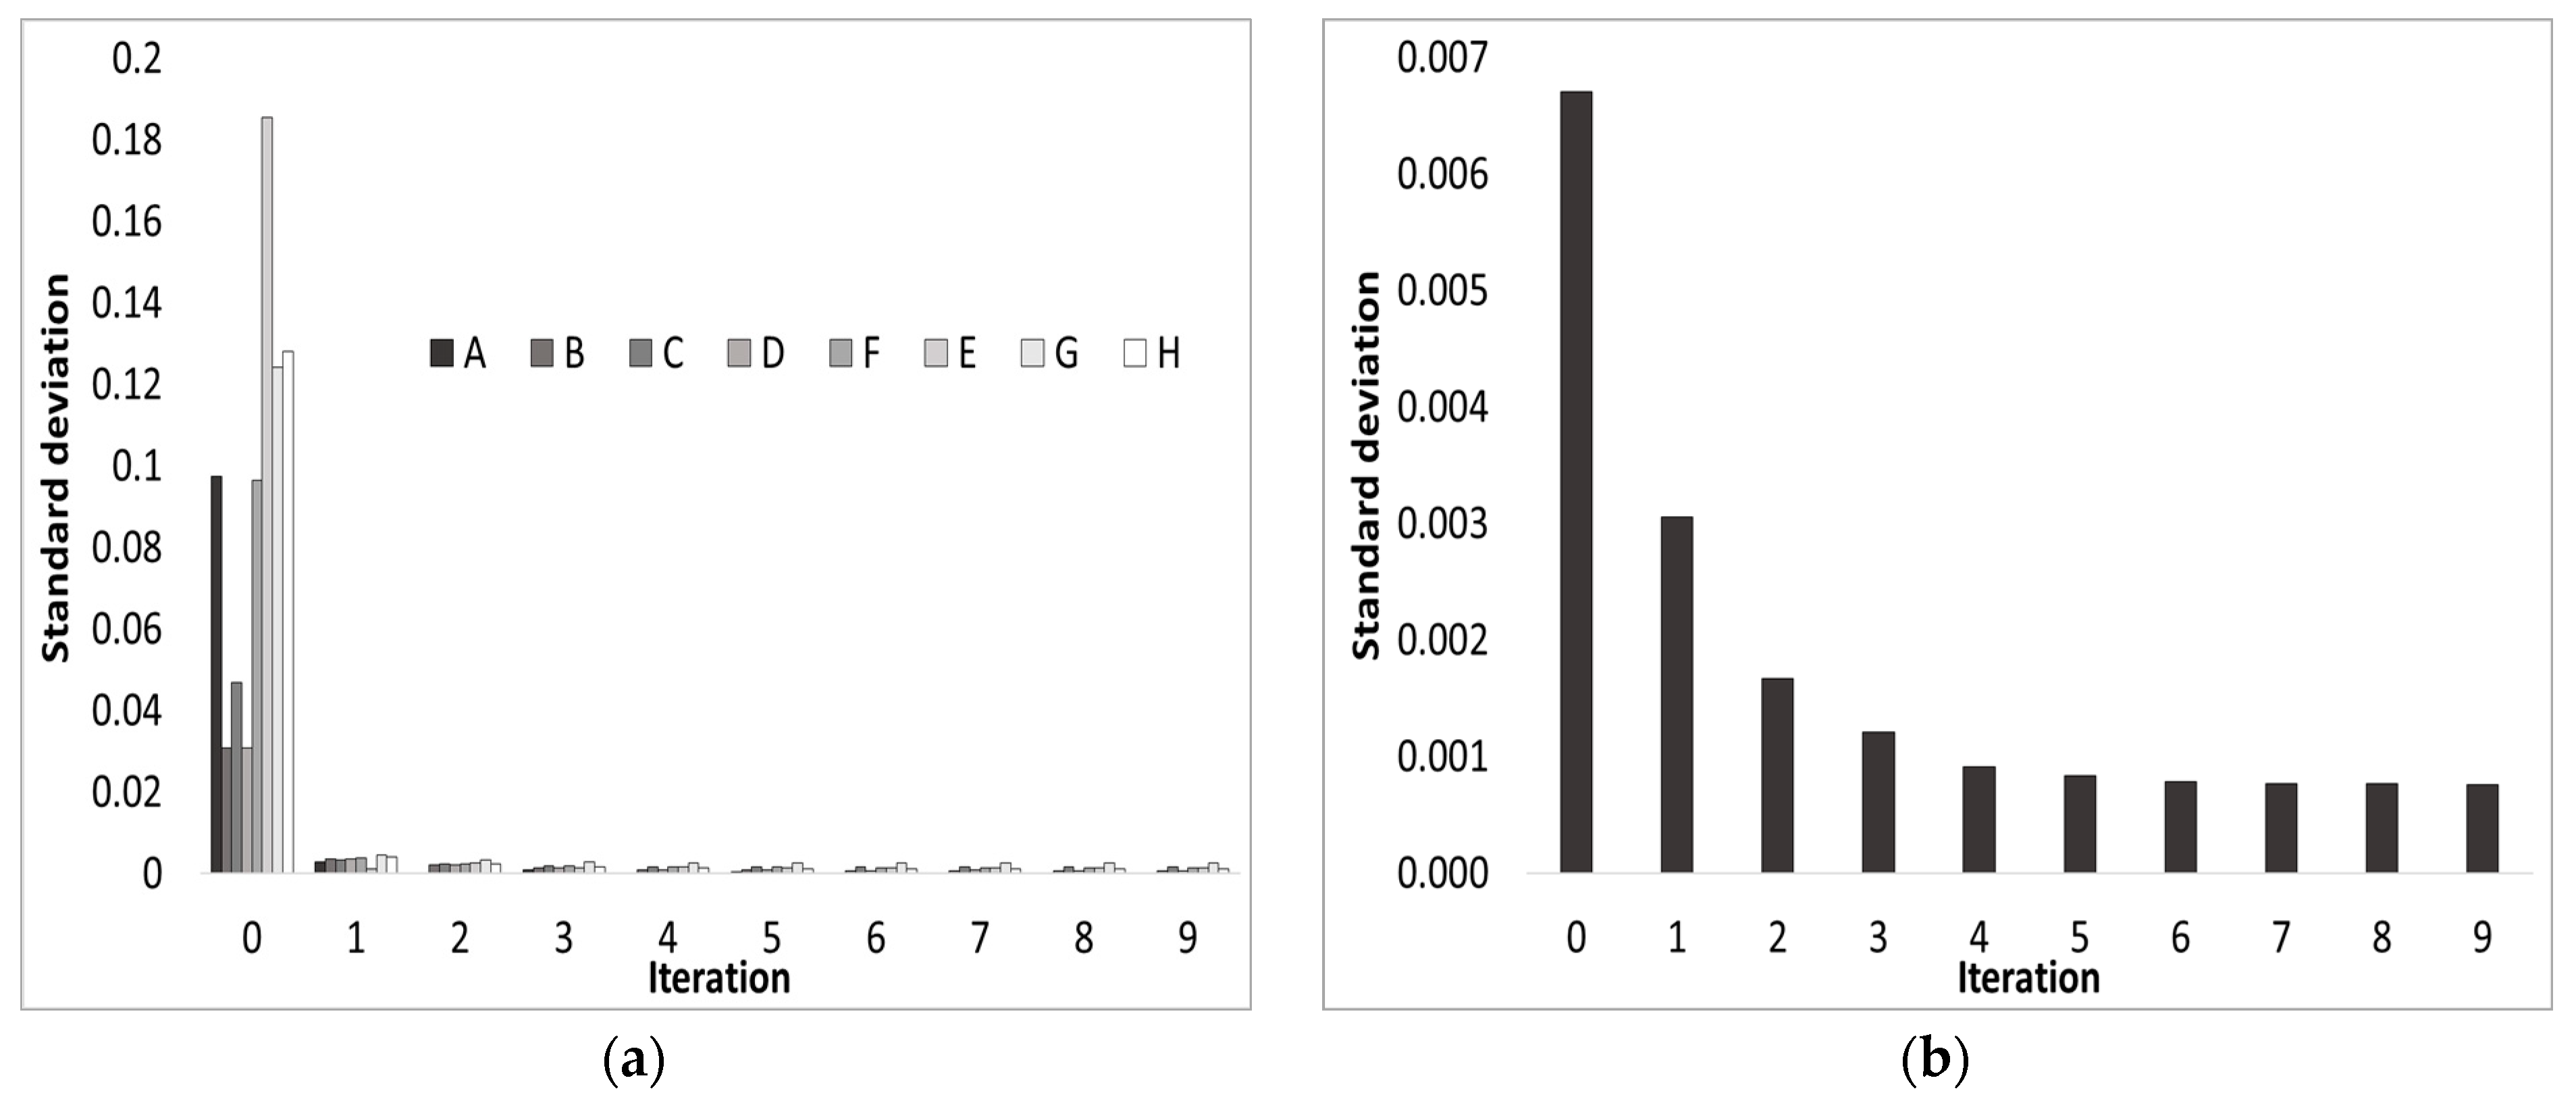
The analysis was extended to the root-mean-square (RMS) error as shown in Figure 8. The RMS was calculated, respectively: (a) as the root of squared difference between points A to H of the retrieved reflectance and the corresponding ground truth, averaging on each point of the spectrum; (b) as the root of squared difference between all the retrieved reflectance image pixels and the ground truth, averaged both spatially and spectrally.
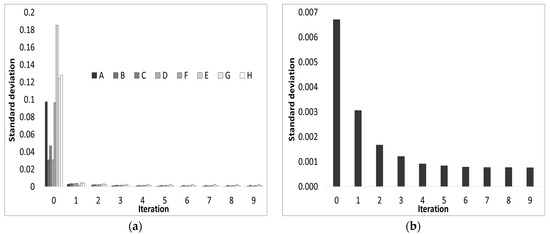
Figure 8.
(a) Standard deviation with respect to ground truth for the retrieved reflectance of each pixels from A to H as a function of the number of iterations. The standard deviation is calculated as the root of the squared difference between the retrieved reflectance spectrum and ground truth and averaged on all the values of the spectrum of each point. (b) Standard deviation with respect to ground truth for the retrieved reflectance of the entire image as a function of the number of iterations. Analogously to (a), the standard deviation is calculated as the root of the squared difference between retrieved reflectance image and ground truth but averaging both spectrally and spatially on each value of the entire datacube.
4.2. Atmospheric Correction on CHRIS-PROBA Image
CHRIS on PROBA-1 [32], developed by SIRA (UK) and mounted in the mini-satellite PROBA-1, was the first hyperspectral sensor capable of acquiring the same image at five different viewing angles (Viewing Zenith Angle equal to: 0°, ±36°, ±55°). In the framework of the ESA project EOPI cat. 1-LBR Project ID.2832 “Assimilation of biophysical and biochemical variables in biochemical and hydrological models at landscape scale”, the CHRIS sensor acquired a large number of images over the Cal/Val test site inside the Migliarino–San Rossore–Massaciuccoli Regional Park (Italy) and managed by our institution. CHRIS performed acquisitions over 18 spectral bands in the visible and near infrared with a spatial resolution of 18 m. Table 2 summarizes CHRIS instrumental characteristics.

Table 2.
Characteristics of CHRIS sensor on board of mini-satellite PROBA-1.
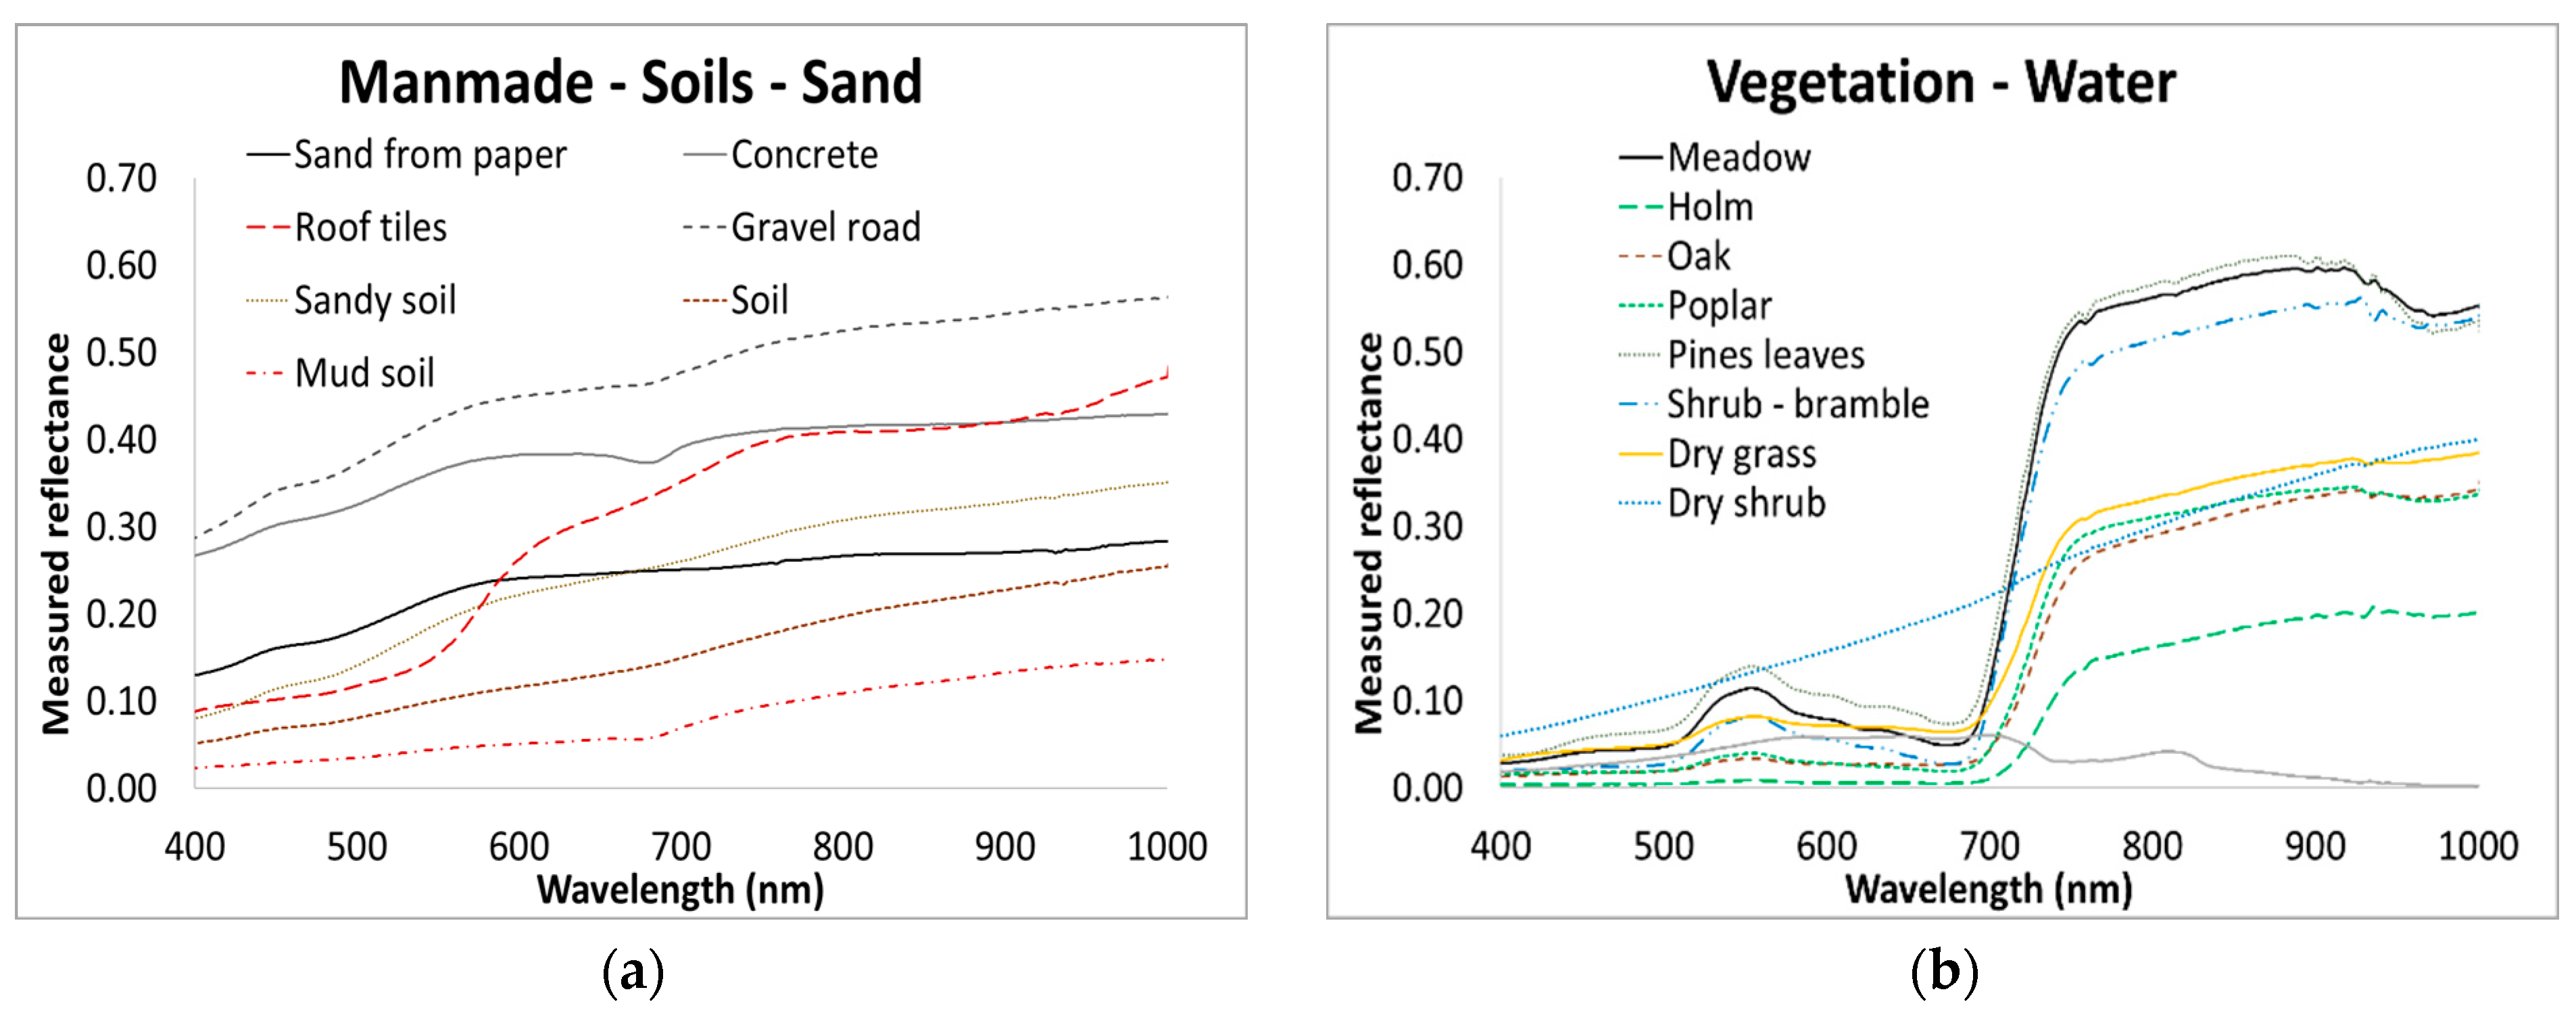
During CHRIS acquisition, an in-field campaign for data validation and assimilation was executed at San Rossore. A Fieldspec Spectroradiometer by ASD Inc. was used to acquire in situ spectral reflectance measurements of different materials belonging to three different classes: soil, vegetation and manmade materials. Measurements mainly consisted of the spectral reflectance of vegetation and soils, but also the spectra acquired on materials produced by man such as cement and tiles. Measurements of inland waters were also carried out, in particular on freshwater canals in the park. As far as vegetation was concerned, the reflectance spectra of grass, leaves (poplar, holm, oak and pine), shrubs (bramble), dry grass and dry shrubs were acquired. Spectral reflectance measurements of soils and sands were performed in different areas. During acquisitions, the change in solar illumination was measured by making reference measurements with a cadence of 1 measure of white every 10 min using a 25 × 25 cm Spectralon tablet. The spectrum of each material was obtained as the average of 10 measurements. Figure 9 shows different acquired natural and manmade spectra.
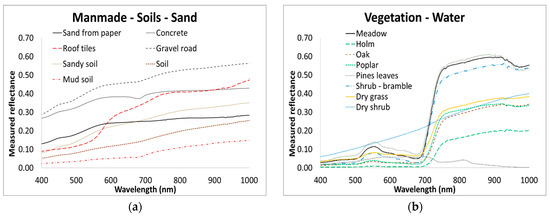
Figure 9.
Spectral reflectance measurements of different materials acquired during a field campaign in the Migliarino–San Rossore–Massaciuccoli Regional Park (Italy) using a Fieldspec Spectroradiometer. Reference measurements were performed using a Spectralon tablet. The spectrum of each material was obtained as an average of 10 measurements. The spectra of manmade materials and different type of soil are shown in (a). Vegetation and water spectra are shown in (b).
Samples of natural targets were also collected and their reflectance measured in a laboratory using the Spectroradiometer PERKIN ELMER LAMBDA 19. Both in-field and laboratory measurements were used to validate results from atmospheric correction procedures.
A selected CHRIS image, characterized by high radiometry and clear sky acquisition, as well as the acquisition of the corresponding ground truth for selected pixels made possible the test of our iterative procedure on a real dataset.
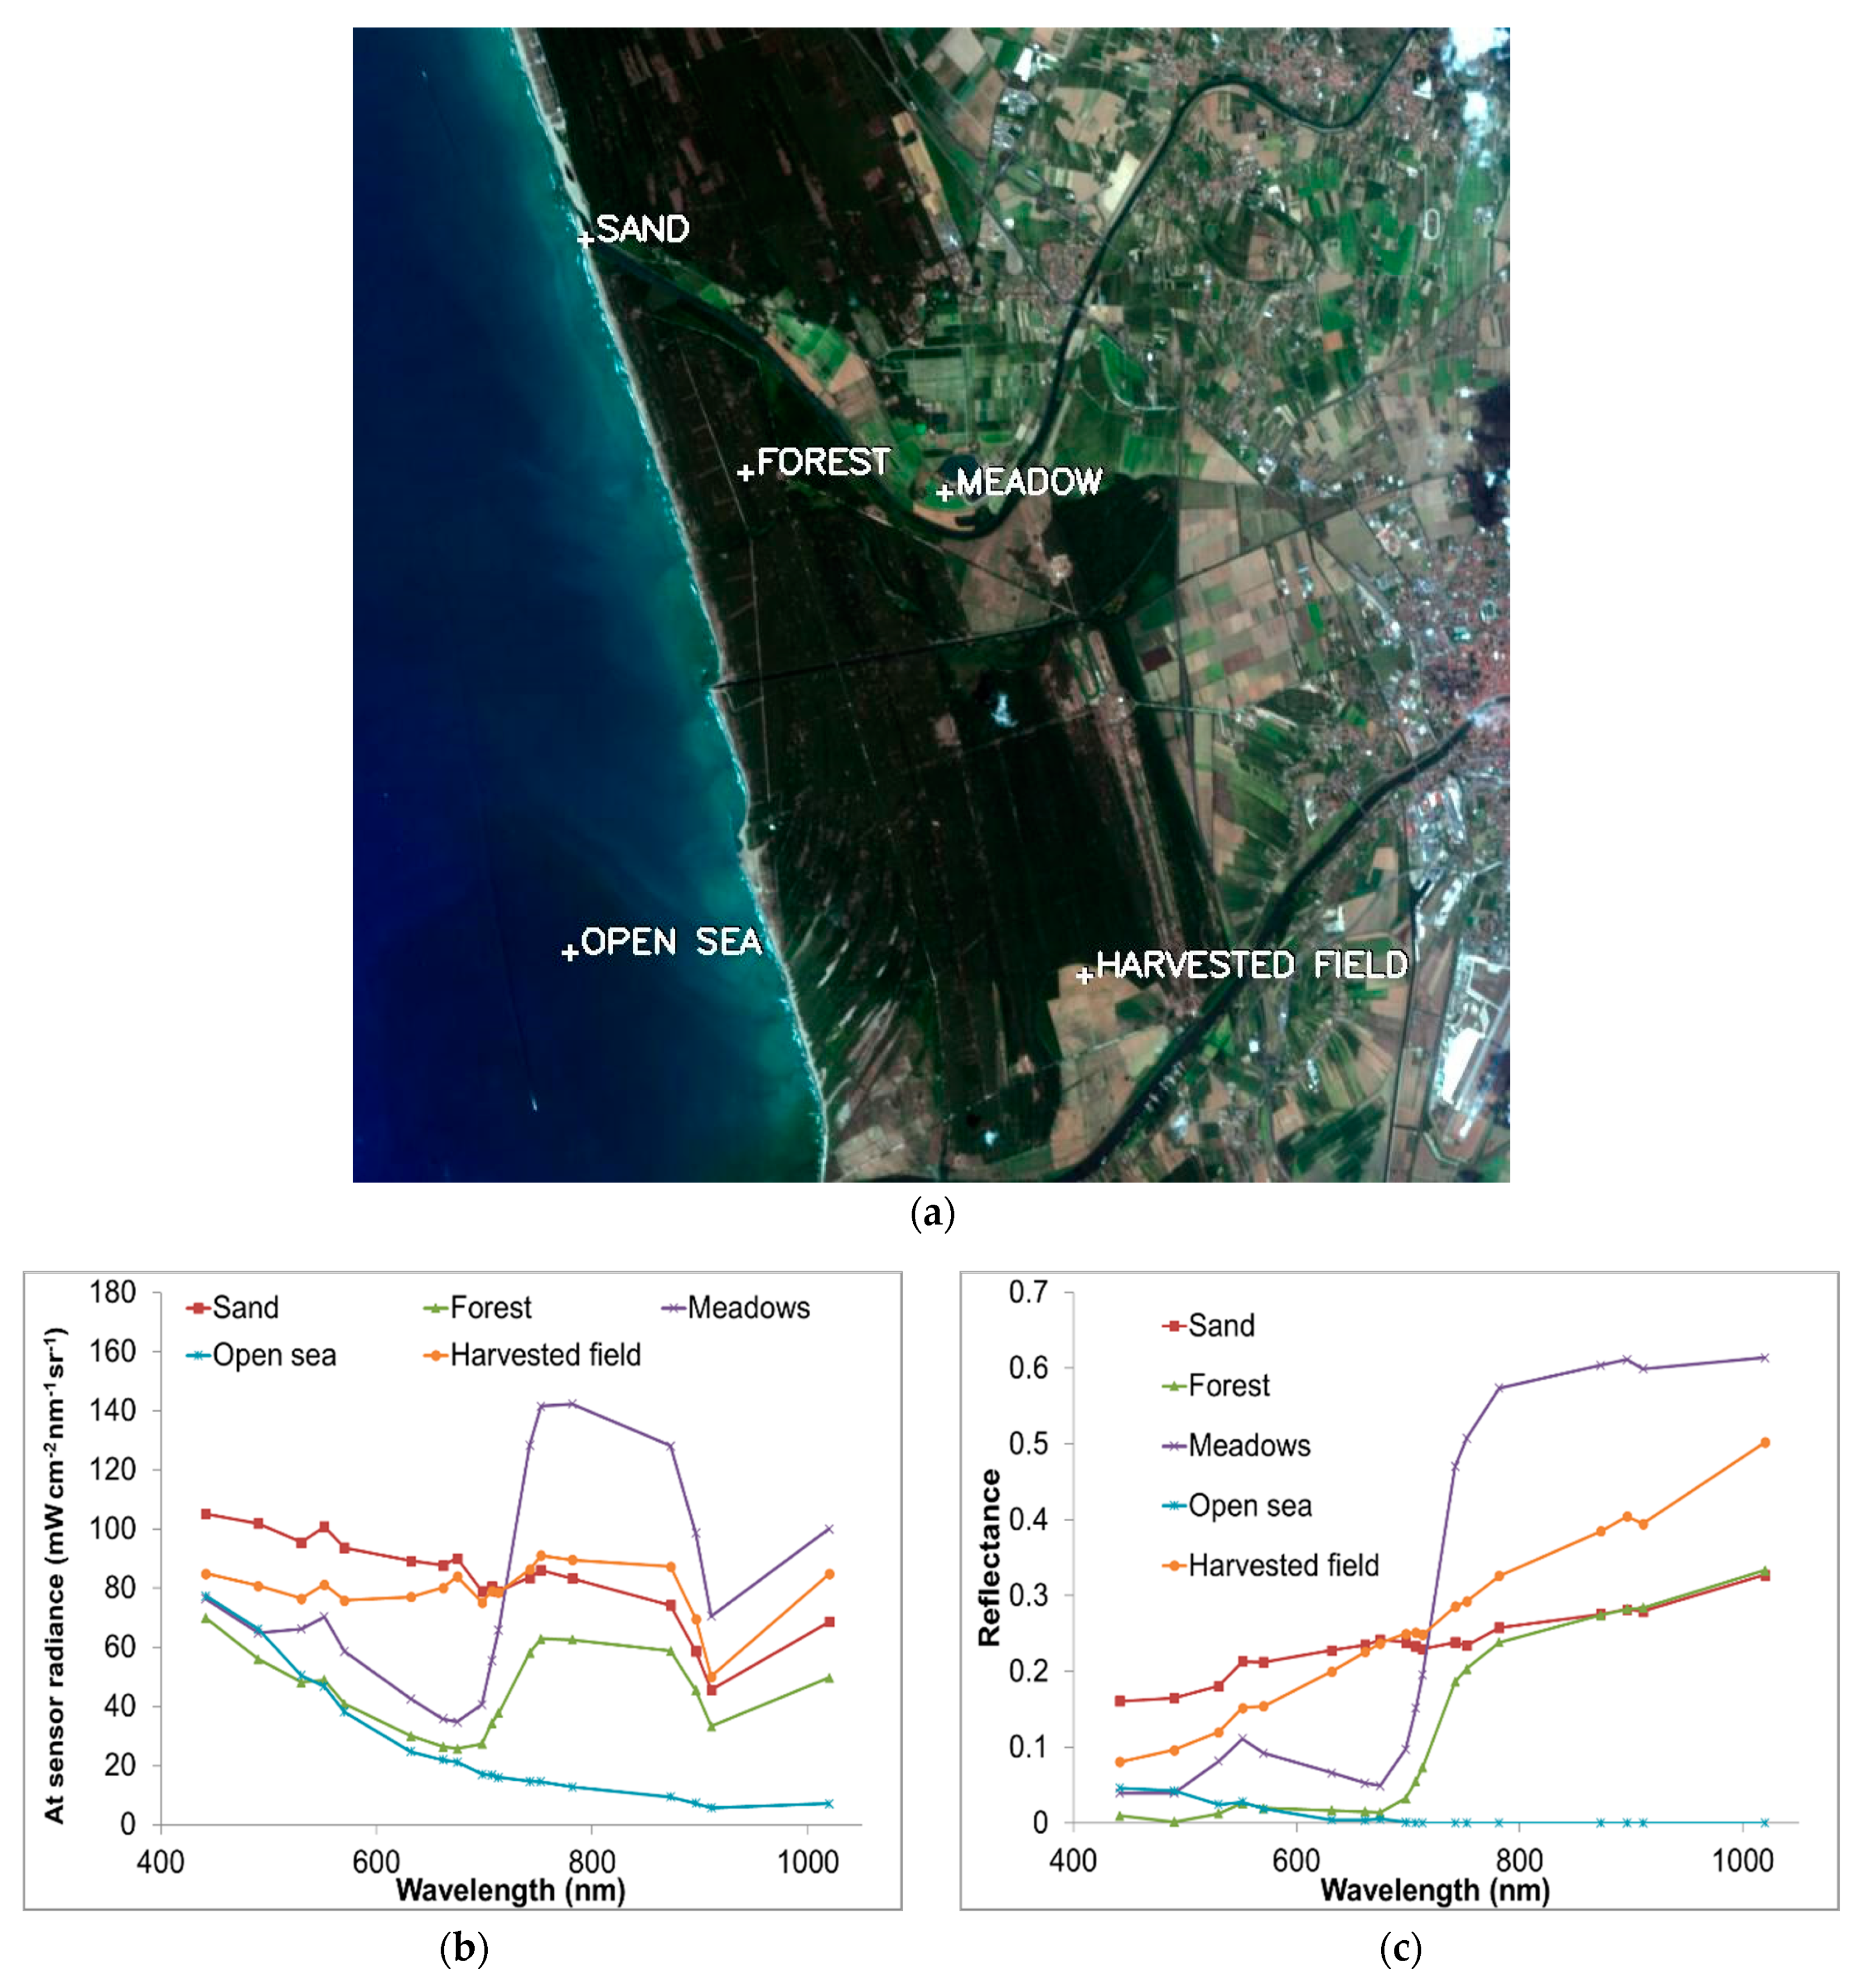
Figure 10a shows the at-sensor radiance image acquired with Viewing Zenith Angle (VZA) equal to 0° by CHRIS over San Rossore Park on 25 July 2003. Figure 10b shows the radiance spectra extracted from pixels containing natural or manmade targets, where the discontinuity at 551 nm introduced in the last release (Release 4.1) of CHRIS radiometrically calibrated data is evident. This release mitigated unexpected peaks (present in release 3.1) at 490 nm (close to O3 feature), 753 nm (close to O2 feature), and 911 nm (close to H2O feature), but introduced a new one at 551 nm [33]. The related reflectance spectra obtained by applying the iterative atmospheric correction procedure are shown in Figure 10c. As for the previous case with simulated data, the iterations were stopped at the tenth step after observing that the retrieved reflectance spectrum reached an asymptotic value. On the basis of the results obtained for the simulated data, we assumed at first that the asymptotic value found by the algorithm was the true reflectance spectrum. Then the asymptotic value was compared with the one directly measured in-field for selected pixels.
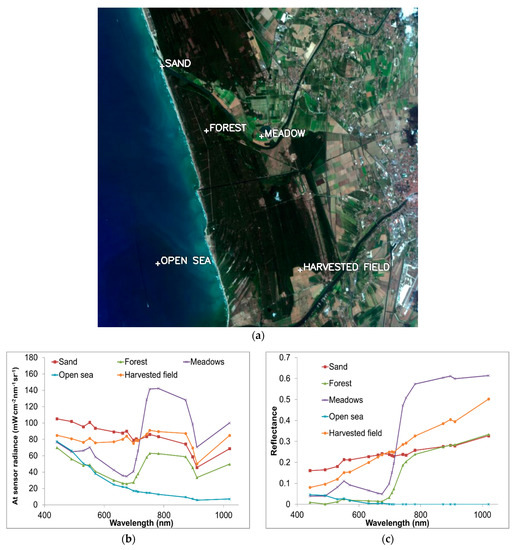
Figure 10.
At-sensor radiance image for VZA = 0° acquired over the San Rossore Park on 25 July 2003 (a). At-sensor radiance spectra and spectral reflectance for natural and manmade targets extracted form a set of reference targets are plotted respectively in (b,c).
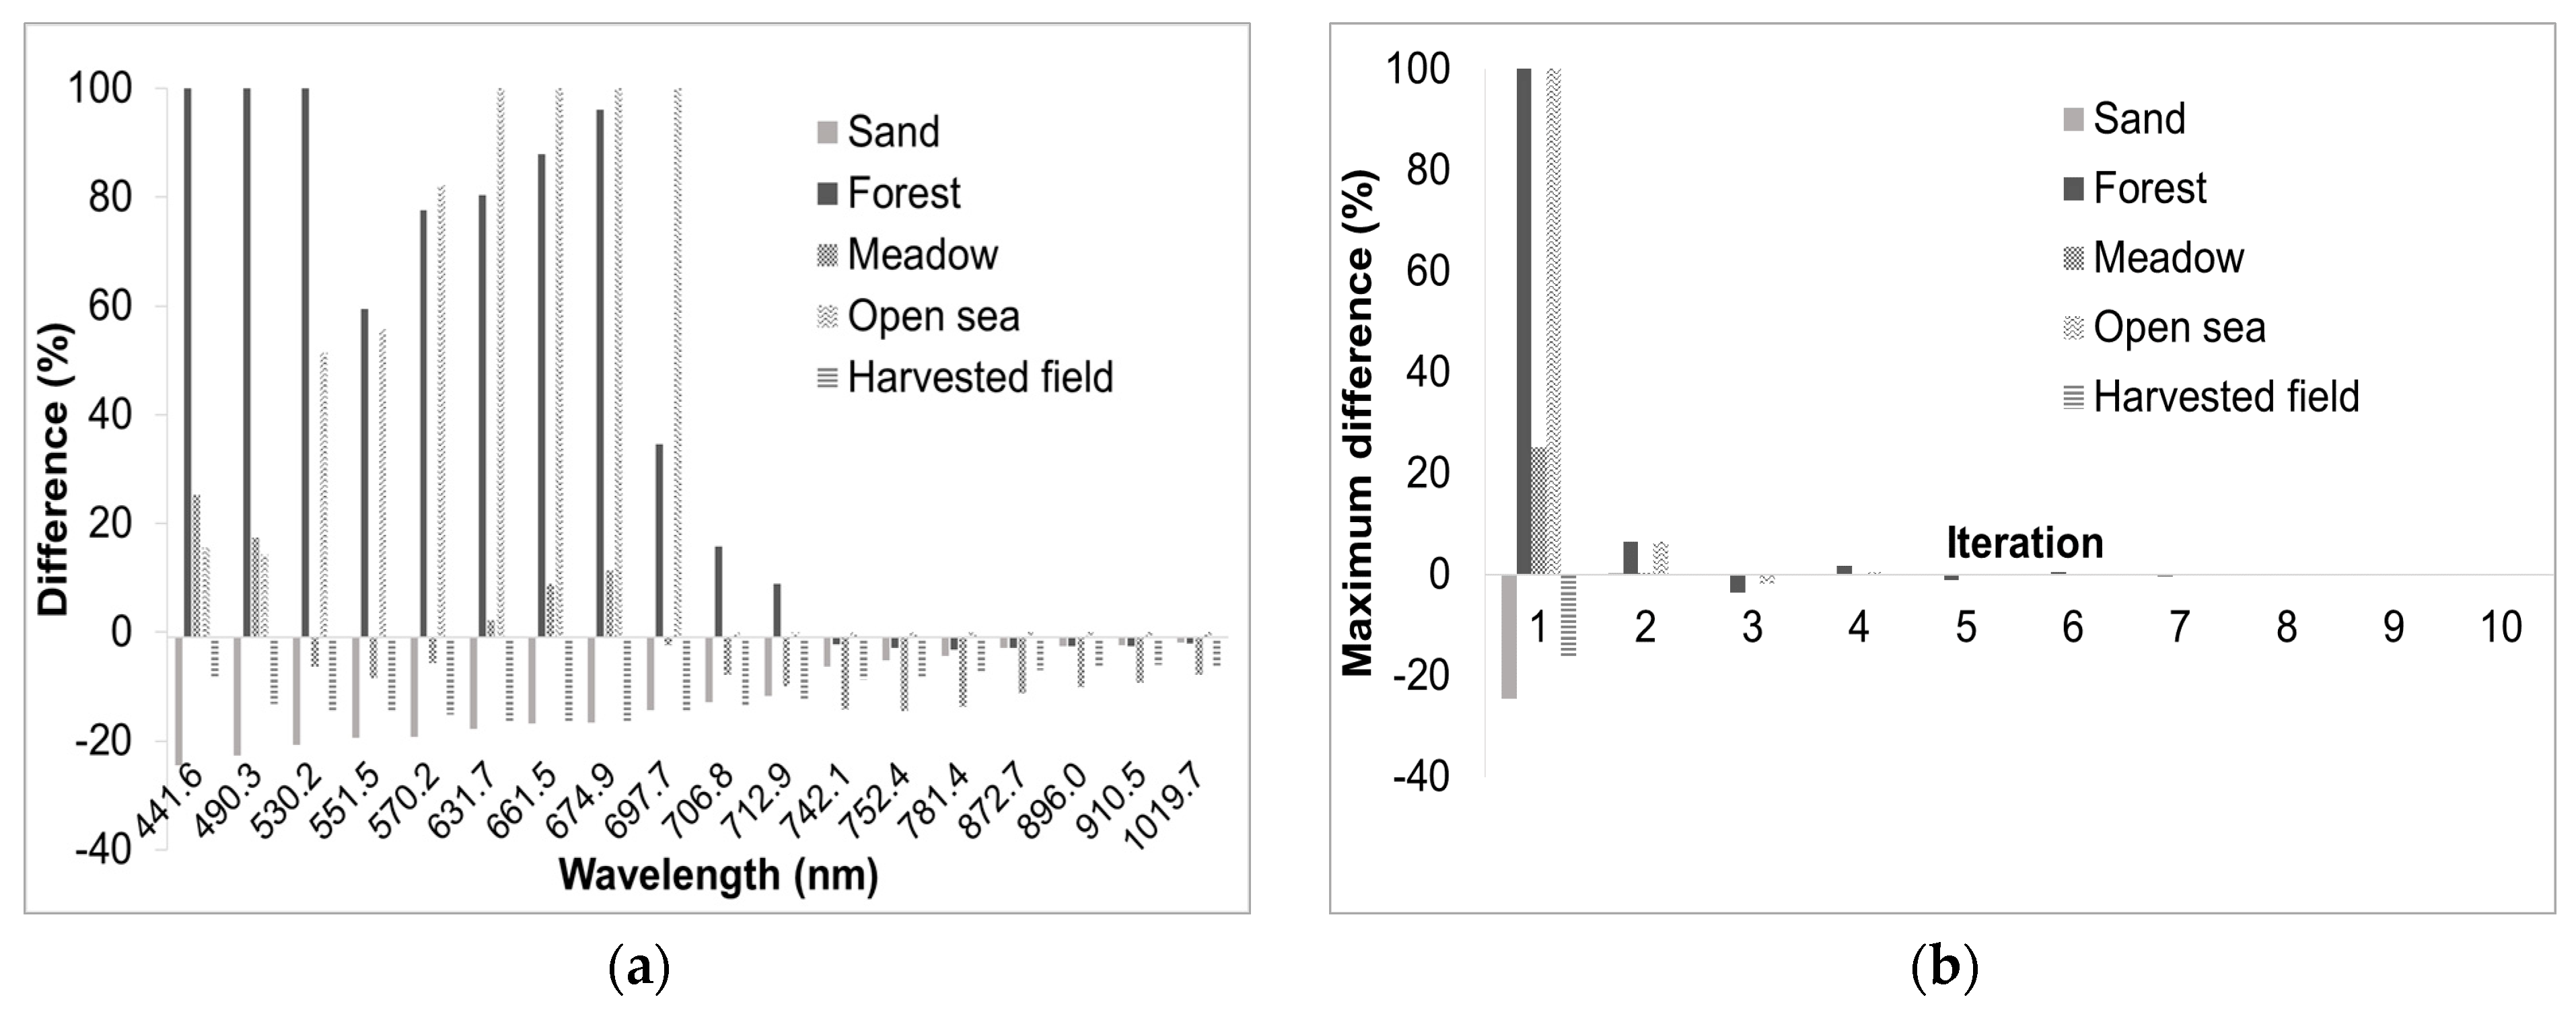
Following this approach, for each iteration the differences between the estimated reflectance value at the generic iteration step and the asymptotic one were evaluated. The difference between each reflectance retrieval and its asymptotic value was spectrally dependent as shown in Figure 11a. The value of this maximum as the iteration step increased is shown in Figure 11b, where it was evaluated for all the targets shown in Figure 10b,c.
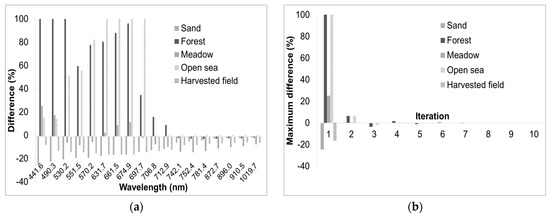
Figure 11.
Spectral dependence of the difference between the retrieved reflectance at first iteration and the asymptotic value reached at iteration n = 10 (a). Maximum value for the difference between the retrieved reflectance at iteration n and asymptotic value reached at iteration n = 10 (b). The difference was evaluated for different coverages.
Finally, spectral reflectance values were numerically compared with reflectance spectra measured in situ and used as ground truth data. The comparison was performed using data coming from selected areas within San Rossore Park. The selection criteria are listed below:
– areas should be accessible to easily perform the measurements during acquisition;
– areas should, as far as possible, be uniform within a spatial dimension of 54 × 54 m (equal to three times the CHRIS Ground Sampling Distance (GSD)) in order to avoid mixed pixels when comparing ground measurements with reflectance spectra retrieved from the CHRIS atmospherically corrected images.
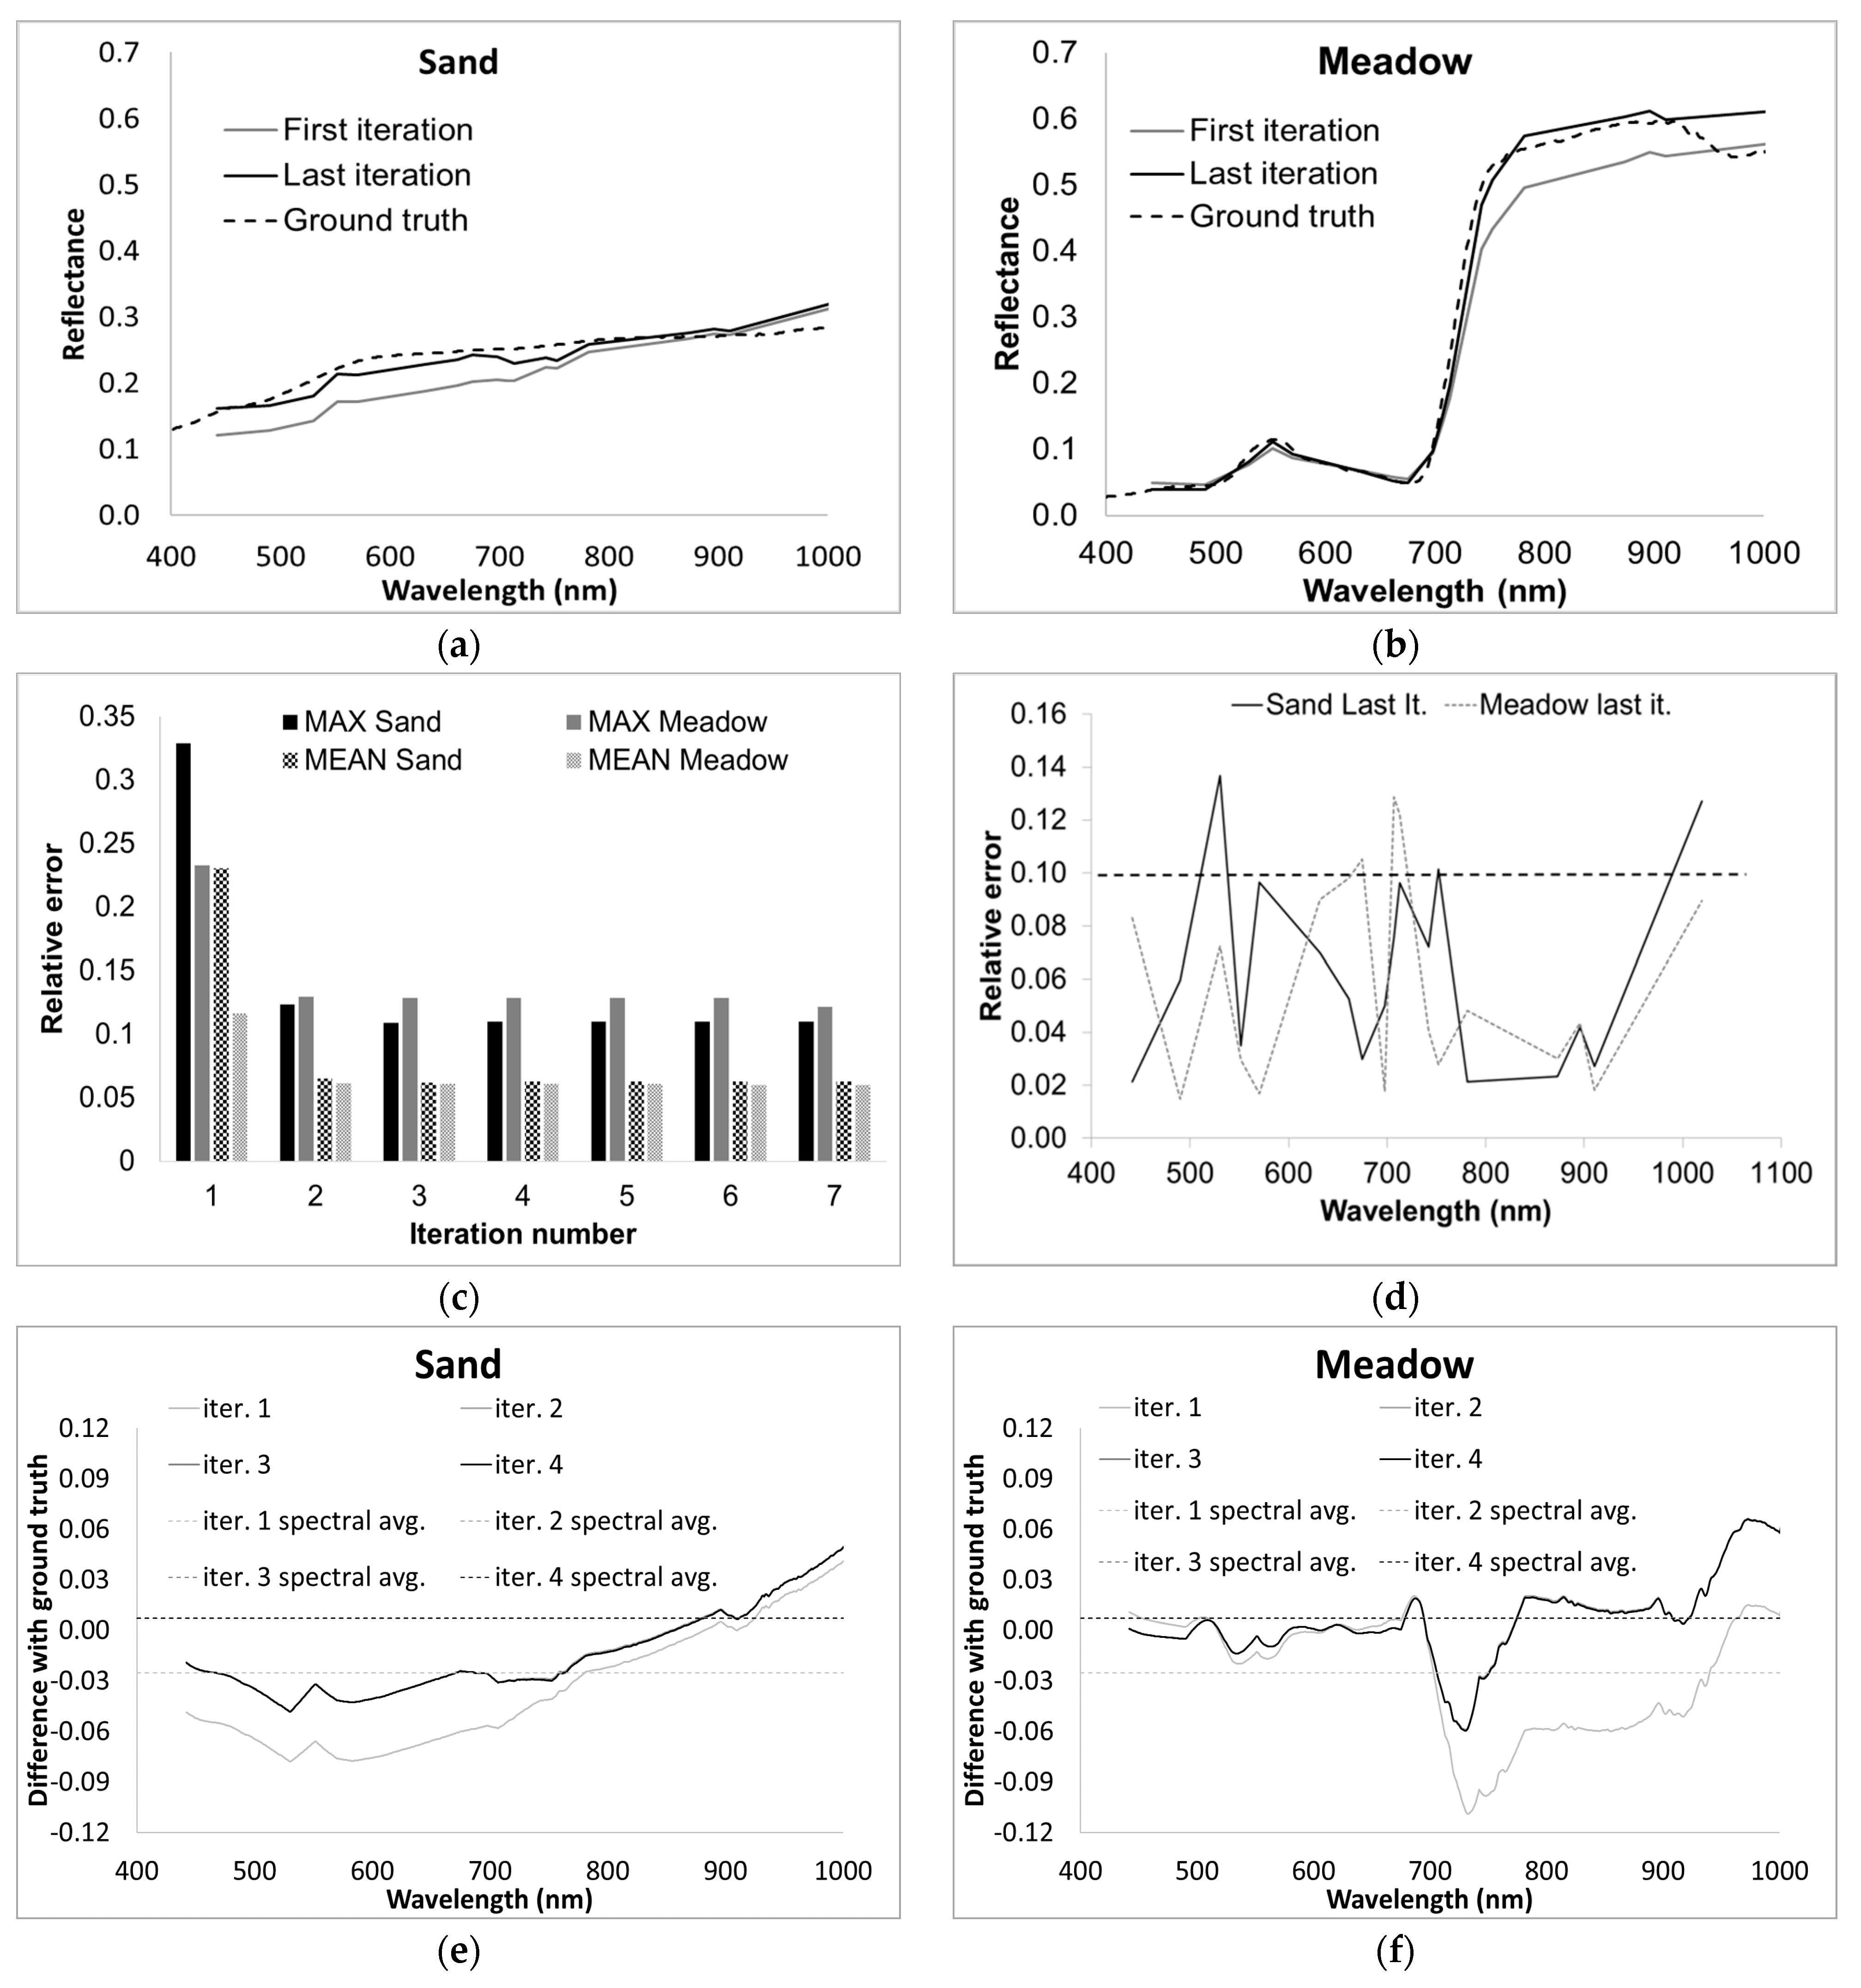
Taking into account the considerations listed above, a pixel relative to sand and another relative to vegetation were selected in the image. Their comparison is shown in Figure 12a,b, where the retrieved reflectance spectra at the first and last iteration together with the corresponding ground truth values were reported. The maximum and mean values for the relative error between the ground truth and the retrieved values as the iteration number increased are reported in Figure 12c. The graph stops at step 7 since an asymptotic value was reached. The relative error as a function of wavelength is shown in Figure 12d. The difference between the ground truth and the (interpolated) retrieved reflectance spectra for the first 4 iterations is reported in Figure 12e,f.
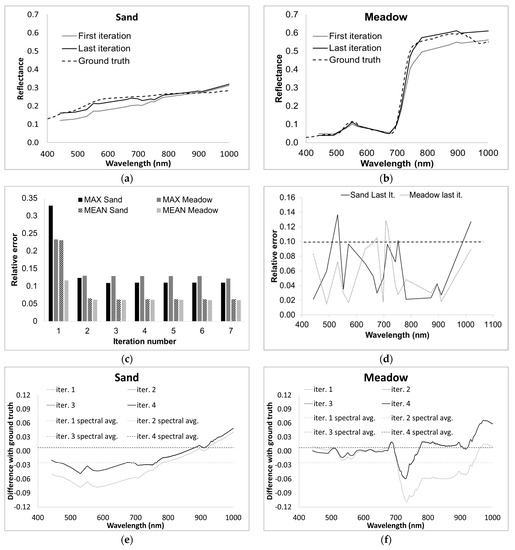
Figure 12.
Spectral reflectance retrieved by the atmospheric correction procedure at iteration step 0 (grey) and after reaching asymptotic value compared with measured (ground truth) data (dashed line) for the “sand” pixel (a) and for the “meadow” pixel (b). (c) Max and mean relative error as the iteration number increases. (d) Relative error as a function of the wavelength between asymptotic values and ground truth data. Difference between the measured ground truth and the retrieved reflectance for the “sand” (e) and the “meadow” (f) pixels for the first 4 iterations; after the second iteration the curves overlap.
5. Discussion
5.1. Atmospheric Correction Procedure Applied to the Simulated Image
As stated in the previous section, a simulated image was used to test and validate the iterative procedure, thanks to the controlled flux of data and the presence of a verified “ground truth”. Due to the use of synthetic data, any spatial effect of pixel mixing introduced by the sensor and optics was completely absent, and the goodness of the retrieval procedure could be tested in a controlled environment for different ground reflectance pattern.
The spectra relative to points A to H of Figure 4, Figure 5 and Figure 6 are representative of different scenarios and were selected for an analysis of the performances of the retrieval algorithm on a pixel with:
- spatially uniform background and constant or linearly variable reflectance spectrum (points A to C);
- background pixel characterized by a chessboard pattern and spectrally constant reflectance spectrum (points D, E);
- background pixel characterized by a chessboard pattern and spectrally variable (and non-linear) spectrum (points F, G, H).
For all the points, the contribution of surrounding pixels to retrieved reflectance was visible for iteration step 0, i.e., for the first-guess of the ground reflectance spectrum obtained by considering a spatially constant ground. Thereafter, the algorithm converged to the ground truth value with uncertainty already less than 1% at step 2. We noted that at each iteration step, both for points A to C (uniform background) and for points D to H (structured background), the retrieved spectrum “oscillated” around the true value (i.e., the difference between retrieved and true spectra was either overestimated or underestimated), converging to the ground truth when the number of iterations increased. Such behaviour appeared to be independent of the spectral structure of the reflectance, as it was observed for reflectance spectra having different spectral shapes (both in Figure 4 and in Figure 5 and Figure 6).
The cases having reflectance spectrum spectrally constant (points A, B, D and E in Figure 4 and Figure 5) or linearly variable (point C in in Figure 4) clearly showed that the error on retrieved reflectance at step 0 (i.e., considering constant ground reflectance) was greater for the leftmost shorter-wavelength (blue) region of the spectrum. This behaviour can be explained by considering that
- step 0 did not consider spatial differences between the generic pixel and its surroundings, and
- the atmospheric scattering was greater in this spectral region (due to the effects of Rayleigh scattering as clearly shown by the transmittance spectrum of Figure 2), thereby increasing the effects of the surrounding pixel reflectance on the retrieved spectrum. Subsequent iterations seem to correctly converge to the “ground truth” value of the reflectance spectrum.
A similar behaviour is observed considering the entire image, spatially averaged. Figure 7a shows the spectrum of the difference between the spatial average of the retrieved reflectance image (for different steps) and the spatial average of the ground truth. Figure 7b displays the trend of the maximum error in reflectance retrieval calculated for all the pixels of the image with respect to the ground truth for different iteration steps. Again, the uncertainty at the first steps is greater for the shortest wavelengths. We also noted the effects of absorption bands (mainly of water between 900 and 1000 nm) deteriorating the quality of the retrieval.
A more qualitative result is offered by Figure 8, showing the RMS between the retrieved reflectance spectrum and ground truth, where it is clear that after iteration step 3 the retrieval uncertainty was approximately an order of magnitude smaller than step 0 (i.e., considering spatially constant reflectance values for all the pixels), at, respectively, less than 0.01 for Figure 8a and less than 0.001 for Figure 8b. It is worth noting that the results of Figure 8a,b are not intercomparable because the RMS is performed on the spectrum of each selected point for (a) and on all the points of the datacube for (b).
5.2. Atmospheric Correction on CHRIS-PROBA Image
Section 4.2 showed the results obtained by applying the iterative procedure on real data, i.e., on the CHRIS acquisition shown in Figure 10a. Even in this case, the retrieved reflectance spectra reach an asymptotic value after few iterations. Such an asymptotic value was considered the “true reflectance spectrum”, and it was used to evaluate the differences in the estimated reflectance value obtained at the generic iteration . These differences were spectrally dependent as the position and the value of the maximum changed with the target as shown in Figure 11a. This behaviour could be ascribed to the fact that the first iteration did not consider spectral differences between the generic pixel and its surroundings: the greater the spectral difference between spectra, the greater the error in the retrieved spectral reflectance at first iteration.
This effect quickly disappeared as the iteration number increased. Figure 11b shows that the value of the maximum of the differences plotted in Figure 11a fell starting from iteration 2 with a reduction of at least 80% with respect to step 0. After iteration 3, the estimated spectral reflectance reached a stable value. Furthermore, in Figure 11a, the differences in the visible spectral range were greater than the ones obtained in the near infrared. Such behaviour had also been observed for the simulated image. In this case also, atmospheric scattering increased the effects of the surrounding pixels’ reflectance on the retrieved reflectance. The test on the real image confirmed what was noticed on the simulated dataset: the retrieved spectral reflectance rapidly converged for all the selected coverages.
Retrieved spectral reflectance was numerically compared with the “ground truth” reflectance spectra measured during the CHRIS acquisition. Specific areas within San Rossore Park were selected to avoid mixed pixels. The selection criteria listed in Section 4.2 aimed to guarantee that the selected area had a spatial variability at least greater than three times the CHRIS GSD. It is worth mentioning that some portions of the San Rossore test site (such as sea shores, and urban areas) showed a spatial variability that could be less than the desired value. Such areas were not selected for the comparison experiment. The results derived by the iterative procedure were compared with the ground truth for two different coverage: sand and vegetation. The maximum and the mean values for the relative error reported in Figure 12c showed that for the “sand” pixel (Figure 12a) the error in the retrieved spectral reflectance decreased from an average value of 23% obtained at iteration 0 to an average value of 6% for the asymptotic value. For the “vegetation” pixel (Figure 12b), the average relative error was equal to 11% for the iteration 0 and 6% of the asymptotic value. The same behaviour was observed for the maximum error: the value decreased from 33 to 11% for sand, while for vegetation the value fell from 23 to 13%. The mean error reached an asymptotic value equal to 6% for both kind of coverage. Such a residual error can be mainly ascribed to the uncertainty in the atmospheric model: due to the lack of knowledge about some atmospheric parameters, a standard MODTRAN® MID LATITUDE SUMMER atmosphere was used for atmospheric correction. Figure 12d shows that the spectral behaviour of the asymptotic value of relative error for both pixels (a) and (b) was greater at wavelengths close to the absorption bands and in the visible region, proving that the uncertainty in the atmospheric model was the main source of error in the retrieval of spectral reflectance. Figure 12e,f provide an absolute estimate for the difference between the measured and the retrieved spectral reflectance. We noted that after the second iteration the curves in practice overlapped. The asymptotic value of the difference was greater in proximity to the atmospheric absorption bands, confirming that an important source of error was the atmospheric model and its parametrization.
6. Conclusions
The paper presented an atmospheric correction procedure based on the direct model implemented on the widely known radiative transfer model MODTRAN® and made direct use of the output of the MODTRAN software package starting from version 5.2.3.
The procedure demonstrated the ability to invert the direct model simulated by MODTRAN, thereby determining iteratively the ground reflectance of each pixel of the image separating the contribution of surrounding pixels. The procedure was tested on both synthetic images (for taking advantage of a simulated, i.e., controlled, environment and a fully known ground truth) and on real hyperspectral images and ground reflectance measurements. The proposed iterative procedure converged rapidly after step 2 for both simulated and real cases and for different ground reflectance spectra and patterns.
In the considered case of a real CHRIS image, the mean relative error in retrieved reflectance after the second iteration remained under 6%, with peaks of approximately 10%. A major source of error can be attributed to the RTM parametrization, in particular to the molecular absorption model, having a greater error around the atmospheric absorption bands. As a consequence, a better a priori knowledge of the gaseous components of the atmosphere could improve retrieval accuracy.
The procedure can exploit the possibility of using, whenever available, alternative models to evaluate the surrounding pixels’ contribution (i.e., an analytical relation as a function of the distance from the target pixel), thus allowing the use of different radiative transfer models.
The algorithm can be also implemented in more sophisticated atmospheric correction procedures, aiming to autonomously tune both the abundances of selected main atmospheric components (gases and aerosol) and the ground spectral reflectance map.
Author Contributions
Conceptualization, V.N., D.G., C.L.; methodology, V.N., D.G.; software, V.N.; validation, V.N., D.G.; formal analysis, V.N., D.G., C.L.; investigation, V.N., D.G.; resources, V.R.; data curation, V.N., D.G.; writing—original draft preparation, V.N., D.G., C.L.; writing—review and editing, V.N., D.G., V.R., C.L.; visualization, V.N., D.G.; supervision, V.R.; project administration, V.R.; funding acquisition, V.R. V.N. and D.G. contributed equally to this work.All authors have read and agreed to the published version of the manuscript.
Funding
This research received no external funding.
Institutional Review Board Statement
Not applicable.
Informed Consent Statement
Not applicable.
Data Availability Statement
The data presented in this study are available on request from the corresponding author.
Conflicts of Interest
The authors declare no conflict of interest.
References
- Goody, R.M.; Yung, Y.L. Atmospheric Radiation: Theoretical Basis; Oxford University Press: New York, NY, USA, 1989. [Google Scholar]
- Shettle, E.P. Models of Aerosols, Clouds, and Precipitation for Atmospheric Propagation Studies. In AGARD, Atmospheric Propagation in the UV, Visible, IR, and MM-Wave Region and Related Systems Aspects 14 p, March 1990. SEE N90-21907 15-32. Available online: https://apps.dtic.mil/dtic/tr/fulltext/u2/a221594.pdf (accessed on 30 April 2021).
- Stamnes, K.; Tsay, S.-C.; Wiscombe, W.; Jayaweera, K. Numerically stable algorithm for discrete-ordinate-method radiative transfer in multiple scattering and emitting layered media. Appl. Opt. 1988, 27, 2502–2509. [Google Scholar] [CrossRef]
- Verhoef, W. Earth observation modeling based on layer scattering matrices. Remot. Sens. Environ. 1985, 17, 165–178. [Google Scholar] [CrossRef]
- Barducci, A.; Guzzi, D.; Marcoionni, P.; Pippi, I. Atmospheric effects on hyperspectral data acquired with aerospace imaging spectrometers. In Proceedings of the Optics in Atmospheric Propagation and Adaptive Systems V (9th International Symposium on Remote Sensing), Aghia Pelagia, Greece, 22–27 September 2003; Volume 4884, pp. 1–9. [Google Scholar]
- Verhoef, W.; Bach, H. Simulation of hyperspectral and directional radiance images using coupled biophysical and atmospheric radiative transfer models. Remote Sens. Environ. 2003, 87, 23–41. [Google Scholar] [CrossRef]
- Gao, B.C.; Montes, M.J.; Davis, C.O.; Goetz, A.F.H. Atmospheric correction algorithms for hyperspectral remote sensing data of land and ocean. Remote Sens. Environ. 2009, 113, S17–S24. [Google Scholar] [CrossRef]
- Lu, D.; Weng, Q. A survey of image classification methods and techniques for improving classification performance. Int. J. Remote Sens. 2007, 28, 823–870. [Google Scholar] [CrossRef]
- Vermote, E.; Tanre´, D.; Deuzé, J.L.; Herman, M.; Morcrette, J.J. Second Simulation of the Satellite Signal in the Solar Spectrum (6S); 6S user guide version 1; NASA Goddard Space Flight Center: Greenbelt, MD, USA, 1997.
- Mousivand, A.; Verhoef, W.; Menenti, M.; Gorte, B. Modeling Top of Atmosphere Radiance over Heterogeneous Non-Lambertian Rugged Terrain. Remote Sens. 2015, 7, 8019–8044. [Google Scholar] [CrossRef]
- Kale, K.V.; Solankar, M.M.; Nalawade, D.B.; Dhumal, R.K.; Gite, H.R. A research review on hyperspectral data processing and analysis algorithms. Proc. Natl. Acad. Sci. India Sect. A 2017, 87, 541–555. [Google Scholar] [CrossRef]
- Cooley, T.; Anderson, G.P.; Felde, G.W.; Hoke, M.L.; Ratkowski, A.J.; Chetwynd, J.H.; Gardner, J.A.; Adler-Golden, S.M.; Matthew, M.W.; Berk, A.; et al. Flaash, a Modtran4-based atmospheric correction algorithm, its application and validation. In Proceedings of the IEEE International Geoscience and Remote Sensing Symposium, Toronto, ON, Canada, 24–28 June 2002; pp. 1414–1418. [Google Scholar]
- Richter, R. Atmospheric correction of satellite data with haze removal including a haze/clear transition region. Comput. Geosci. 1996, 22, 675–681. [Google Scholar] [CrossRef]
- Richter, R.; Schläpfer, D. Atmospheric/Topographic Correction for Satellite Imagery, Theoretical Background Document. 2017. Available online: www.atcor.com (accessed on 30 March 2021).
- Adler-Golden, S.M.; Mattchew, M.W.; Bemstein, S.; Levine, R.Y.; Berk, A.; Richtsmeier, S.C. Atmospheric correction for short-wave spectral imagery based on MODTRAN4. In Proceedings of the SPIE 3753, Imaging Spectrometry V, Denver, CO, USA, 27 October 1999. [Google Scholar] [CrossRef]
- Berk, A.; Conforti, P.; Kennett, R.; Perkins, T.; Hawes, F.; Van den Bosch, J. MODTRAN6: A major upgrade of the MODTRAN radiative transfer code. In Proceedings of the SPIE 9088, Algorithms and Technologies for Multispectral, Hyperspectral, and Ultraspectral Imagery XX, 90880H, Baltimore, MD, USA, 13 June 2014. [Google Scholar] [CrossRef]
- Richter, R.; Schläpfer, D.; Müller, A. An automatic atmospheric correction algorithm for visible/NIR imagery. Int. J. Remot. Sens. 2006, 27, 2077–2085. [Google Scholar] [CrossRef]
- Diegel, D.A.; Wang, M.; Maritorena, S.; Robinson, W. Atmospheric correction of satellite ocean color imagery: The black pixel assumption. Appl. Opt. 2000, 39, 3582–3591. [Google Scholar] [CrossRef]
- Wang, M.; Shi, W.; Jiang, L. Atmospheric correction using near-infrared bands for satellite ocean color data processing in the turbid western Pacific region. Opt. Express 2012, 20, 741–753. [Google Scholar] [CrossRef]
- Tanre, D.; Herman, M.; Deschamps, P.Y. Influence of the background contribution upon space measurements of ground reflectance. Appl. Opt. 1981, 20, 3676–3684. [Google Scholar] [CrossRef] [PubMed]
- Tanré, D.; Deschamps, P.Y.; Duhaut, P.; Herman, M. Adjacency effect produced by the atmospheric scattering in thematic mapper data. J. Geophys. Res. 1987, 92, 12000–12006. [Google Scholar] [CrossRef]
- Tanré, D.; DeRoo, C.; Duhaut, P.; Herman, M.; Morcrette, J.J.; Perbos, J.; Deschamps, P.Y. Technical note Description of a computer code to simulate the satellite signal in the solar spectrum: The 5S code. Int. J. Remot. Sens. 1990, 11, 659–668. [Google Scholar] [CrossRef]
- Holben, B.; Vermote, E.; Kaufman, Y.J.; Tanre, D.; Kalb, V. Aerosol retrieval over land from AVHRR data-application for atmospheric correction. IEEE Trans. Geosci. Remote Sens. 1992, 30, 212–222. [Google Scholar] [CrossRef]
- Kaufman, Y.J. Aerosol Optical Thickness and Atmospheric Path Radiance. J. Geophys. Res. 1993, 98, 2677–2692. [Google Scholar] [CrossRef]
- Minomura, M.; Kuze, H.; Takeuchi, N. Adjacency Effect in the Atmospheric Correction of Satellite Remote Sensing Data: Evaluation of the Influence of Aerosol Extinction Profiles. Opt. Rev. 2001, 8, 133–141. [Google Scholar] [CrossRef]
- Richter, R. A fast atmospheric correction algorithm applied to Landsat TM images. Int. J. Remote Sens. 1990, 11, 159–166. [Google Scholar] [CrossRef]
- Sanders, L.C.; Schott, J.R.; Raqueno, R. A VNIR/SWIR atmospheric correction algorithm for hyperspectral imagery with adjacency effect. Remote Sens. Environ. 2001, 78, 252–263. [Google Scholar] [CrossRef]
- Lyapustin, A.; Kaufman, Y.J. Role of adjacency effect in the remote sensing of aerosol. J. Geophys. Res. Space Phys. 2001, 106, 11909–11916. [Google Scholar] [CrossRef]
- Schläpfer, D.; Richter, R.; Hueni, A. Recent Developments in Operational Atmospheric and Radiometric Correction of Hyperspectral Imagery. In Proceedings of the 6th EARSeL SIG IS Workshop, Tel Aviv, Israel, 16–19 March 2009. [Google Scholar]
- Sterckx, S.; Knaeps, E.; Ruddick, K. Detection and correction of adjacency effects in hyperspectral airborne data of coastal and inland waters: The use of the near infrared similarity spectrum. Int. J. Remote Sens. 2011, 32, 6479–6505. [Google Scholar] [CrossRef]
- Berk, A.; Anderson, G.P.; Acharya, P.K. MODTRAN®5.3.2 USER’S MANUAL; Spectral Sciences, Inc.: Burlington, MA, USA; Air Force Research Laboratory, Space Vehicles Directorate: Kirtland AFB, NM, USA, May 2013. [Google Scholar]
- Guzzi, D.; Lastri, C.; Nardino, V.; Palombi, L.; Pippi, I.; Raimondi, V.; Di Ninni, P.; Barducci, A.; Lo Pinto, E. PRIMUS: A tool for the simulation of images acquired by the optical payloads on board of PRISMA mission. In Proceedings of the 2014 Conference on Big Data from Space (BiDS’14), Frascati, Italy, 12–14 November 2014; pp. 279–282. [Google Scholar]
- Cutter, M.A.; Johns, L.S.; Lobb, D.R.; Williams, T.L.; Settle, J.J. Flight Experience of the Compact High Resolution Imaging Spectrometer (CHRIS). In Proceeding of the SPIE Conference 5159 Imaging Spectrometry IX, San Diego, CA, USA, 3–8 August 2003. [Google Scholar]
Publisher’s Note: MDPI stays neutral with regard to jurisdictional claims in published maps and institutional affiliations. |
© 2021 by the authors. Licensee MDPI, Basel, Switzerland. This article is an open access article distributed under the terms and conditions of the Creative Commons Attribution (CC BY) license (https://creativecommons.org/licenses/by/4.0/).

