Abstract
This study investigates the characteristics of space-borne Lightning Mapping Imager (LMI) lightning products and their relationships with cloud properties using ground-based total lightning observations from the Beijing Broadband Lightning Network (BLNET) and cloud information from S-band Doppler radar data. LMI showed generally consistent lightning spatial distributions with those of BLNET, and yielded a considerable lightning detection capability over regions with complex terrain. The ratios between the LMI events, groups and flashes were approximately 9:3:1, and the number of LMI-detected flashes was roughly one order of magnitude smaller than the number of BLNET-detected flashes. However, in different convective episodes, the LMI detection capability was likely to be affected by cloud properties, especially in strongly electrified convective episodes associated with frequent lightning discharging and thick cloud depth. As a result, LMI tended to detect lightning flashes located in weaker and shallower cloud portions associated with fewer cloud shielding effects. With reference to the BLNET total lightning data as the ground truth of observation (both intra-cloud lightning and cloud-to-ground lightning flashes), the LMI event-based detection efficiency (DE) was estimated to reach 28% under rational spatiotemporal matching criteria (1.5 s and 65 km) over Beijing. In terms of LMI flash-based DE, it was much reduced compared with event-based DE. The LMI flash-based ranged between 1.5% and 3.5% with 1.5 s and 35–65 km matching scales. For 330 ms and 35 km, the spatiotemporal matching criteria used to evaluate Geostationary Lightning Mapper (GLM), the LMI flash-based DE was smaller (<1%).
1. Introduction
Lightning imagers in geostationary orbits offer a good approach to continuously detect and locate lightning flashes produced by thunderstorms over continents and oceans with storm-scale resolution (i.e., ~10 km) [1]. Compared with their predecessors working in low Earth orbits, lightning imagers aboard geostationary satellites are able to provide more detailed information on the spatial propagation and discharge frequency of lightning with improved detection efficiency over their coverage [2,3,4]. More specifically, instead of taking a snapshot of thunderstorms, lightning imagers in geostationary orbits are capable of monitoring electrified storms as they develop and evolve continuously with a near-uniform spatial resolution, and hence provide total lightning observations with improved quality over data-sparse areas. Built on the heritage of space-based lightning detection instruments, such as the Lightning Imaging Sensor (LIS) and the Optical Transient Detector (OTD) mounted on low Earth-orbiting satellites, the Geostationary Lightning Mapper (GLM) onboard the Geostationary Operational Environmental Satellites (GOES)-16 and 17 present a technical breakthrough for lightning detection over broad regions [5]. Shortly after GOES-16, a similar instrument, the experimental Lightning Mapping Imager (LMI), was developed and deployed onboard the Fengyun-4A (FY-4A) Geostationary Satellite-launched in 2016 [6], aiming to improve total lightning observations over East Asia. In addition to these two instruments, another geostationary lightning imager will be deployed on the Meteosat Third Generation (MTG) satellite of the European Organization for the Exploitation of Meteorological Satellites (EUMETSAT) scheduled for launch at the end of 2022 (https://www.esa.int/Applications/Observing_the_Earth/Meteorological_missions/meteosat_third_generation/Lightning_Imager; accessed on 30 April 2021). As a result, a full global coverage of lightning detection and the continuous monitoring capability of electrically active storms will be possible then.
As the first space-borne lightning imager developed in China, the LMI is designed to continuously detect lightning flashes over China and its neighboring regions. Several studies have preliminarily analyzed lightning activities based on the LMI detection over China [7] as well as spatiotemporal characteristics of lightning in a landing super typhoon [8] and in local thunderstorms [9]. They compared the LMI lightning products with observations from ground-based lightning location systems (LLSs), such as the World Wide Lightning Location Network (WWLLN) and the Advanced Direction and Time-of-arrival Detecting (ADTD), and showed that the LMI performed reasonably well in terms of the spatial distribution and temporal evolution of cloud-to-ground (CG) lightning activities. Given the encouraging results, some attempts have been made to assimilate LMI lightning observations into numerical weather prediction (NWP) models with the aim to improve severe weather forecasting [10,11,12]. While these studies were promising, the overall performance and detection efficiency of LMI have not been thoroughly investigated in comparison with the existed lightning observations.
It is worth noting the main differences between space-borne lightning imagers and traditional ground-based LLSs. First, unlike the traditional ground-based LLSs that accurately pinpoint electromagnetic pulses, the LMI captures the optical signals produced by lightning flashes with a spatial resolution of 7.8 km at nadir. Additionally, there is no discrimination between intracloud (IC) and CG lightning flashes in the LMI; as a result, the LMI is naturally able to provide total lightning observations (IC+CG) over broad regions. While IC lightning flashes significantly outnumber CG lightning flashes in thunderstorms [13], the capability of IC lightning detection over broad regions via ground-based networks is quite challenging, and hence, some LLSs, such as the WWLLN or ADTD, are designed mainly for CG lightning detection. These factors could result in a poorer estimation of LMI lightning detection efficiency (DE), especially when only ground-based CG lightning observations serving as the baseline are available. In order to gain a better insight into the LMI lightning detection performance, comparisons with more accurate total lightning data provided by ground-based LLS under a series of convective scenarios are required.
The LMI switched into the operational mode in 2018 after a one-year on-orbit calibration. In this study, the LMI lightning products are investigated and compared with the total lightning observations from a regional ground-based broadband LLS, Beijing Broadband Lightning Network (BLNET) [14]. The spatiotemporal characteristics of lightning flashes and their relationships with cloud properties based on the LMI data are analyzed during multiple convective episodes (CEs) that occurred in the summers of 2018 and 2019 over Beijing. The study intends to answer the following questions:
(1) What are the temporal and spatial distributions of LMI lightning products compared with BLNET over Beijing?
(2) Does the lightning detection capability of the LMI vary in different thunderstorm processes? If so, what are the characteristics of LMI-detected lightning flashes and their relationships with cloud properties in different thunderstorm processes?
(3) What is the LMI DE of total lightning flashes relative to that of a ground-based total lightning detection system with high detection efficiency?
By addressing the performance and characteristics of the LMI, this study is intended to move one step closer toward the future operational applications such as data assimilation and severe weather monitoring and warning concerning the space-borne LMI lightning observations.
2. Data and Method
2.1. Space-Borne LMI Lightning Data
The LMI onboard the FY-4A geostationary meteorological satellite is the first space-borne lightning detector in China. To effectively track optical signals, a 400 × 600 charge-coupled device (CCD) array plane is adopted in the LMI at a rate of 500 frames per second. The field of view of the LMI covers China and its adjacent oceanic regions with a spatial resolution of 7.8 km at nadir [6,7,15]. By means of real-time event processors, the LMI calculates dynamic background average optical radiances and separates sudden increases in brightness that exceed the background radiances. During each 2-ms frame, those pixels exceeding the threshold optical radiances are collected as events, constituting the elementary data product of LMI and depicting the illuminated cloud top due to lightning occurrences. As a result that LMI does not discriminate between events illuminated by IC or CG lightning, it provides total lightning flash measurements. The events can be further clustered into groups and flashes. Simultaneous adjacent illuminated pixels in each 2-ms frame are combined into groups. Using a lightning clustering algorithm with specific spatial-temporal criteria [2,3,5], the groups are further clustered into flashes. The spatial-temporal criteria applied in the clustering algorithm can have a large impact on the flash parameter [16], and they should be compatible with the approximate pixel size of lightning imagers and typical lightning strike interval [17]. LMI defines a flash as a set of groups that occur within 330 ms with a spatial range of 16.5 km in its clustering algorithm [15], which is the same as GLM [18]. As a comparison, the LIS, a low Earth orbit lightning imager, clusters groups that occur within 330 ms with a spatial range of only 4.5 km.
The LMI Level 2 products that include events, groups and flashes provided by the National Satellite Meteorological Center of the China Meteorological Administration are used in this study. Given the bright background illumination produced by sunlight reflecting from the tops of clouds, a combined spectral, spatial and temporal filtering technique was used to maximize the lightning signal based on the significant differences in the characteristics between the lightning signal and the background noise. After a combined spectral, spatial and temporal filtering technique was used to filter false optical signals, the products were projected onto Earth coordinates (latitude and longitude) and hence provided necessary information including timing, geolocation, optical radiance energy and areal coverage of the detected lightning flash.
2.2. Ground-Based Total Lightning Data of BLNET and Radar Data
Reliable total lightning observations are necessary to effectively evaluate the lightning detection capability and performance of the LMI. In this study, the total lightning data from BLNET are used as the ground truth. The BLNET consists of 16 stations distributed over Beijing metropolitan region, which is capable of detecting three-dimensional (3D) lightning locations [14]. The 16 stations are integrated with fast/slow antennas, a magnetic antenna and a very-high-frequency (VHF) antenna to detect lightning electromagnetic signals at broad frequency bands. At each station, the waveform features of lightning pulses are analyzed, and the information on the lightning type and arrival time of each pulse at each station is transferred to the central station for the 3D lightning mapping [19]. For a detailed description of the BLNET location techniques, the reader is referred to Wang et al. [20]. Srivastava et al. [21] evaluated the performance of BLNET in terms of total lightning DE and location accuracy during thunderstorm days in 2015–2016. The results show that the average DE of BLNET for total lightning flashes is 93.2%. With reference to tower-initiated lightning flashes, the horizontal location error of the BLNET data is less than 250 m. The aforementioned analyses on a statistical basis confirm the high detection efficiency and location accuracy of BLNET and hence, give more confidence to the systematic evaluation of the performance of the LMI using BLNET location results as the ground truth.
Since BLNET detects lightning electromagnetic signals of individual fast discharges and identifies the waveform signatures characteristic of IC and CG discharges, it is necessary to cluster these electromagnetic pulses into flashes. To effectively improve the data accuracy of lightning flash location, a two-step strategy is applied in the BLNET clustering algorithm [22]. First of all, the original electromagnetic pulse data satisfying the required number of triggered sensors (>4) are collected, which are further quality controlled by deleting those single and scattered signals in order to reduce noise. Then the time and distance parameters (400 ms and 15 km, respectively) are applied to cluster the neighboring quality-controlled electromagnetic pulses into flashes, and the maximum flash duration is set to 1.5 s. As a result that the IC and CG flashes are clustered jointly, when dealing with lightning types, those flashes only consisting of IC signals are defined as IC lightning flashes. For flashes containing ground strikes, they are defined as CG lightning flashes and assigned with the timing, location and polarity information of the first lightning strike.
The radar reflectivity data used in this paper are collected by the Beijing S-band Doppler radar (Figure 1). The radar scanning period is 6 min and the reflectivity data are interpolated with a spatial resolution of 1 km × 1 km × 1 km.
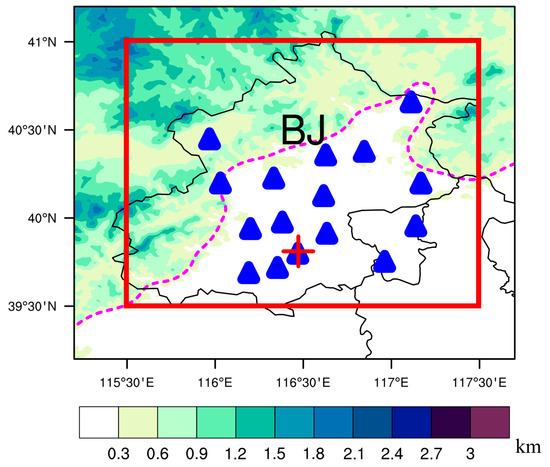
Figure 1.
Spatial distributions of BLNET 16 stations (blue triangle) and the Beijing S-band Doppler radar station (red cross). The red rectangular represent the observation area (39.5°N–41°N and 115.5°E–117.5°E) and the shaded colors represent the topography around Beijing (unit: km). The plain and mountainous regions in Beijing are simply discriminated by the 400-m terrain height (dashed magenta line).
2.3. Analysis Method
After a one-year-long on-orbit calibration, the LMI has been in operational mode since 2018. This study compares the total lightning observations derived from the LMI and BLNET during multiple convective episodes that occurred in the summers of 2018 and 2019 over Beijing. The main observation area was limited to 39.5°N–41°N and 115.5°E–117.5°E (Figure 1), similar to that used in Srivastava et al. [21] for BLNET evaluation. The timing and geolocation (latitude and longitude) as well as the optical radiance energy and areal extension were extracted from the LMI lightning dataset. The BLNET-detected lightning flashes clustered from the quality-controlled electromagnetic pulses were used as the observation truth datasets given the high DE and location accuracy of BLNET. The distributions and variations of the LMI event, group and flash products were compared with the BLNET-detected flashes over the chosen observation area.
The LMI tracks the optical changes of lightning flashes in geostationary orbit with a pixel resolution of 7.8 km at nadir; therefore, it is necessary to properly match the lightning flashes from space-borne and ground-based lightning detection instruments. Hence, a set of spatial and temporal criteria are used to match lightning detection results from the LMI and BLNET. Hui et al. [7] calculated the coincidence between LMI groups and lightning strikes provided by the WWLLN over East Asia and found that the DE of the LMI was 10.2% relative to WWLLN with a time/space coincidence window of 2.1 s/40 km. Liu et al. [9] evaluated the LMI group DE against the ADTD-derived lightning data over the Jiangsu Province, China using a 60-s temporal searching window and spatial searching ranges increasing from 0.2° to 2° (20 km–200 km), resulting in LMI DE values ranging from 43.6% to 86.1%, respectively. However, the applied temporal matching criteria in the above studies are significantly larger, compared with the time of photons travelling from the Earth’s cloud top to the geostationary orbit (approximately 125 ms) and even with the maximum flash duration used in BLNET clustering algorithm (1.5 s). Despite a parallax error of 20–30 km of lightning imagers at geostationary orbit [23], smaller spatial and temporal criteria should be applied to evaluate the lightning imager DE. For example, Marchand et al. [24] matched GLM event products with the ground-based Earth Networks Total Lightning Network (ENL) within 330 ms and 35 km to calculate GLM DE. Hence, to gain better insight into the LMI lightning detection capability, a set of reduced spatial and temporal criteria were applied in this study to match the LMI and BLNET lightning observations. The minimum temporal matching window was set to 100 ms, which is approximately the travel time of photons from the Earth to the geostationary orbit. The upper limit for the temporal matching window was set to 1.5 s, just the same as the maximum flash duration in the BLNET clustering algorithm, and the interval of granularity was set to 100 ms. The spatial matching criteria range from 5 km (approximately half-pixel size) to 80 km (approximately 10-pixel size) with an interval of 5 km. In each pair of spatial-temporal criteria, the LMI product of events/flashes was compared with BLNET-detected flashes assuming the BLNET detection is the ground truth to evaluate the LMI DE. Since the LMI flash is a combination of illuminated pixels generated by the clustering algorithm, the LMI DE was not only applied to flashes but also extended to events to access the practical capability of LMI for lightning detection.
3. LMI Performance Compared with BLNET
3.1. Overview of LMI and BLNET Detection during the Main Convective Episodes
The selected convective episodes over Beijing in the summers of 2018 and 2019 for the LMI DE evaluation consist of a broad spectrum of storm types including single isolated thunderstorm, quasi-linear convection, meso-scale convective systems (MCS) and squall lines. Additionally, in a study on the electrical behaviors of different thunderstorms that occurred over Beijing, Wang et al. [25] found that thunderstorms could be categorized into three types in terms of their total lightning flash production based on the BLNET observations. The thunderstorms are considered to be “weak” if their lightning flash production is less than 1000 during the life span. The thunderstorms are categorized as “moderate’’ if their lightning flash production ranges between 1000 and 10,000. Thunderstorms with lightning flash production exceeding 10,000 are classified as “strong”. Table 1 gives a quantitative overview of the number of lightning detections from the LMI and BLNET within the observation area (39.5°N–41°N and 115.5°E–117.5°E) in each CE. We divided the CEs into different categories according to their total lightning production from BLNET, and found a potential inconsistency between the number of LMI-detected lightning observations and the storm category. For example, in the “strong” thunderstorm during CE1 on 05 August 2018, the number of LMI lightning observations was largest among the studied CE samples as expected; however, in the weak-to-moderate thunderstorms, the LMI-detected lightning production was less consistent with that of BLNET-detected lightning production, suggesting the complicated impacts of storm intensity and/or cloud structure on the optical detection capability of the LMI. Recent studies using the VHF Lightning Mapping Array (LMA) observations showed that strong to severe storms tend to produce many small-size flashes [26,27,28]. As a result, LMI is prone to miss some compact lightning flashes produced during the vigorous phase of thunderstorms. A more detailed analysis on the impacts of thunderstorm cloud thickness and lightning flash extents on LMI detection is provided in next section. Even though the detection capability of the LMI varied in different thunderstorm categories, the ratios between LMI events, groups and flashes were rather stable (approximately 9:3:1).

Table 1.
Number of lightning observations provided by the LMI and BLNET during multiple convective episodes in the summers of 2018 and 2019.
The spatial distributions of the LMI lightning observations for the study cases were also compared with those of BLNET, as shown in Figure 2. Despite significant quantitative differences in each category of the LMI lightning products, the spatial distribution pattern of the LMI lightning products is similar to that of the BLNET lightning products over Beijing, where high lightning density regions are both noticed between 116.5–117.5°E. Lightning flash rate is much higher in the southeastern plain regions than in the northwestern mountainous regions in Beijing. As a result that the BLNET is a regional lightning network mainly located in Beijing (Figure 1), beyond the coverage of the BLNET, LMI also shows considerably improved lightning detection over regions such as in mountainous areas with complex terrain and in the far southern regions of Beijing. As mentioned earlier, the ratios between the LMI events, groups and flashes were approximately 9:3:1. Although the number of LMI-detected events was comparable to the number of BLNET-detected lightning flashes, the number of LMI-detected flashes was roughly one order of magnitude smaller than the BLNET-detected flash value. The LMI events represent all the lightning-illuminated pixels, and the flash and group products are collections of lightning events satisfying some prespecified temporal and spatial thresholds. From this perspective, the LMI event products offer more information on the lightning spatial propagation and the storm location and coverage, which are more suitable for convective-scale data assimilation concerning space-borne total lightning observations [11].
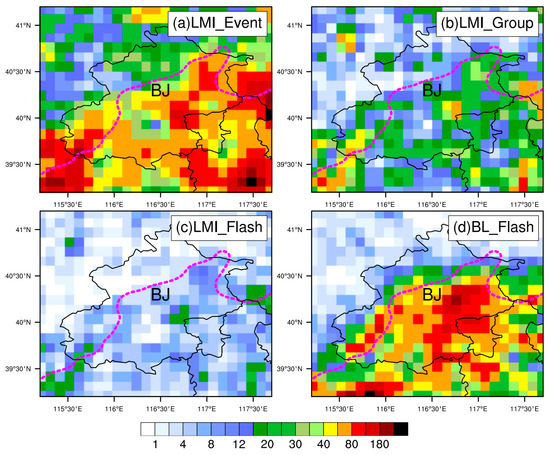
Figure 2.
Spatial distributions of the LMI (a) events, (b) groups, (c) flashes and (d) BLNET-detected lightning flashes in Beijing (unit: number/0.1° × 0.1°) for the convective episodes used in this study in the summers of 2018 and 2019.
3.2. Characteristics of LMI Lightning Detection in Different Thunderstorm Categories
Given the evolving nature of thunderstorms during their life spans, for example, from the genesis to maturation and decay stages over time, the evolution of lightning production was further investigated at a finer temporal scale. In addition to the overall amount of lightning flash production used as a criterion for categorizing thunderstorms in Wang et al. [25], the hourly flash rate was taken into account because it resolves the electrification severity of thunderstorms and hence offers a true sense of the actual strength of the storm (Figure 3). For example, CE6 and CE8 were deemed weakly electrified thunderstorms due to their smaller flash rates as evidenced by the maximum hourly BLNET-detected flash rates <500 (flashes h−1). For the more electrically active CEs, both the lightning production value and the hourly flash rate were used as metrics of electrification intensity. Here, we further divided each CE into moderate and strong categories. The moderately electrified CEs were CE2, CE3, CE5 and CE7, with maximum BLNET-detected lightning flash rates exceeding 1000 (flashes h−1). CE1 and CE4 were regarded as strongly electrified thunderstorms with maximum hourly BLNET-detected flash rates exceeding 2000 (flashes h−1).
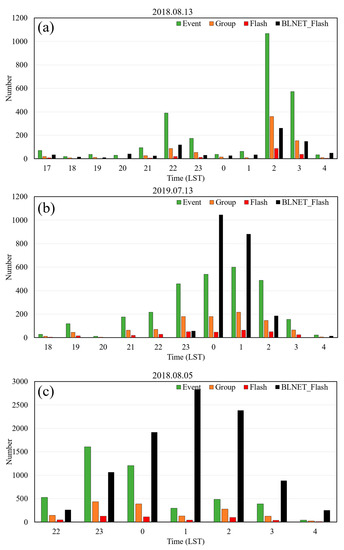
Figure 3.
Hourly evolution of lightning data provided by the LMI and BLNET during the chosen convective cases (a–c) (unit: number h−1).
With reference to the BLNET hourly flash rate, the capability of the LMI to resolve the electrical evolution tendency varied among the different thunderstorm categories. For example, in weak-to-moderate thunderstorms, the evolution tendency of the LMI hourly lightning rate was roughly consistent with that of BLNET (e.g., Figure 3a,b), suggesting that the LMI may capture the electrical evolution of thunderstorms. The LMI-detected flashes were mainly located in regions with large radar reflectivity (>40 dBZ) and dense BLNET-detected lightning flashes (Figure 4a,b). As thunderstorms developed vertically and produced more ice particles within the mixed-phase regions, the dynamical and microphysical conditions were more conducive to charge generation; as a result, the number of detected lightning flashes increased, as seen in both the LMI-detected and BLNET-detected lightning products. The accumulative LMI optical radiance energy also increased due to the intensified electrification that produced more illuminated cloud top regions associated with lightning flashes (Figure 4c,d).
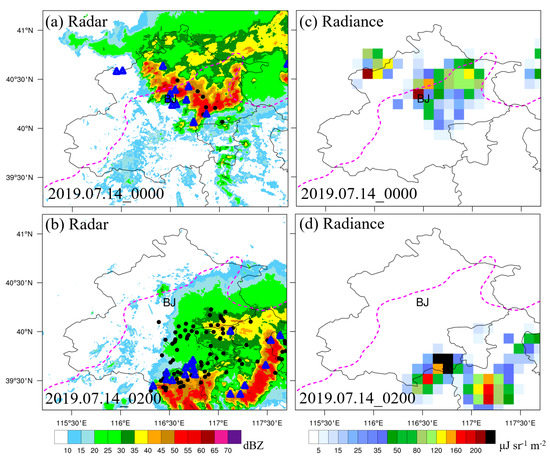
Figure 4.
Composite radar reflectivity (unit: dBZ) at (a) 0000 LST and (b) 0200 LST on 14 July 2019. The blue triangles represent the LMI-detected lightning flashes, and the black dots represent the BLNET-detected lightning flashes during the 6-min radar scanning period. In the right column, the accumulative optical radiance energy values (c,d) are calculated by summing the 30-min event optical radiance values (unit: μJ st−1 m−2).
Along with the vertical development and intensification of thunderstorms facilitating cloud non-inductive charging and discharging [29,30,31,32], lightning flashes are likely to sufficiently concentrate in space and time and hence increase the estimates of background optical radiance [16]. On the other hand, photons associated with lightning flashes are also more likely to suffer cloud shielding over the optically thick cloud portion. This dilemma eventually generates an increased optical threshold for lightning detection in space-borne lightning imagers. In other words, affected by very frequent cloud illuminations and thick cloud depth, the LMI could fail to detect a portion of lightning flashes, especially when lightning flashes occur at lower levels because light is obscured from the cloud top and thus regarded as noise being filtered. Figure 3c shows the temporal evolution of a strongly electrified CE that occurred on 5 August 2018. At the initial stage when the thunderstorm was developing toward maturity, the BLNET-detected lightning flashes increased steadily. The intensifying electrical processes inferred from the LMI-detected lightning observations were generally consistent with the BLNET data. As the thunderstorm entered the mature stage, producing very frequent lightning discharges; however, the number of LMI lightning detections decreased significantly. By referring to the radar data, it can be found that the LMI-detected flashes were mainly concentrated in the southern portion of the thunderstorm (Figure 5a–c). The optical signals of lightning flashes were missed in the LMI data over the northern portion of the thunderstorm, while dense lightning flashes were detected in this region by BLNET (Figure 5d–f). Table 2 gives a quantitative comparison of the averaged maximum radar reflectivity at the LMI-detected and BLNET-detected lightning flash locations as well as the optical radiance energy of the LMI lightning products during different development stages in this strongly electrified CE. Compared with those of BLNET, the LMI-detected lightning flashes were concentrated in weaker and shallower parts of the thunderstorm. As the thunderstorm intensified, the overall radar reflectivity of the regions associated with LMI-detected lightning flashes increased but was still smaller than that of BLNET. The average optical radiance energy of the LMI lightning flashes also increased as the thunderstorm intensified. Under such circumstances, lightning discharging processes with optical radiance values smaller than the LMI threshold, either due to compact and frequent cloud illuminations by lightning flashes or cloud shielding, were regarded as noise and were hence discarded, resulting in downgraded lightning detection capability of the LMI. The results were consistent with those of Yoshida et al. [32], who found that clouds of extreme depth were associated with reduced lightning flash rates in the LIS data.

Figure 5.
Same as Figure 4, but for 2300 LST on 5 August 2018 and 0000 LST and 0100 LST on 6 August 2018.
Table 2.
Average radar composite reflectivity and optical radiance values of the LMI lightning products during the different development stages of the strongly electrified convective scenario on 5 August 2018.
To provide a better understanding of how LMI detection capability is affected by cloud properties, the cumulative distribution functions (CDFs) of convection intensity and cloud thickness over regions associated with LMI-detected lightning flashes were calculated and compared with those of BLNET during the CEs used in this study (Figure 6). Consistent with the findings for the strong CE shown above, the LMI-detected lightning flashes were systematically located over regions with smaller radar reflectivity values and thinner cloud depth. The CDFs of maximum radar reflectivity (Figure 6a) in the ensemble CE samples revealed that 50% of the LMI-detected lightning flashes were located over regions with maximum radar reflectivity values less than 28 dBZ. Since the electromagnetic wave propagation is not affected by cloud shielding, the BLNET-detected lightning flashes were found to be concentrated in the more convective parts of thunderstorms, 50% of which occurred over regions with maximum radar reflectivity values less than 35 dBZ. In terms of cloud thickness (Figure 6b), large portions of LMI-detected lightning flashes tended to be distributed in shallower clouds that posed weaker cloud shielding effects on lightning illumination compared with those of BLNET. As the 5-dBZ echo top height increases due to the vertical vigorous development of thunderstorms, it is rather clear that the CDFs of LMI grows slowly that those of BLNET. Hence it can be included that the amount of LMI detected flashes is a compromise between the growing of lightning strokes and their dimming by clouds.
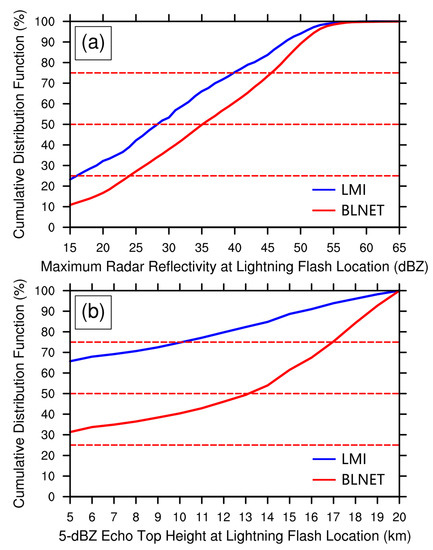
Figure 6.
Cumulative distribution functions of (a) maximum radar reflectivity and (b) 5-dBZ radar echo top height in regions associated with LMI-detected (blue line) and BLNET-detected (red line) lightning flashes.
Given the impacts of cloud properties on space-borne lightning imagers, the lightning characteristics of the LMI, such as flash areal coverage and optical radiance in different thunderstorm categories, were also investigated. Figure 7 shows the percentages of LMI-detected lightning flashes in each pair of flash footprint sizes and optical radiance energies for weakly, moderately and strongly electrified CEs. In each category of CE, there were generally diagonal distribution patterns between the flash footprint sizes and optical radiance energies. However, the percentage of lightning flashes associated with larger flash sizes and higher optical radiance energies increased to some extent in the moderately and strongly electrified CEs due to more favorable conditions for charge generation. In strongly electrified CEs characterized by very high flash rates, the LMI detected more lightning flashes associated with small flash sizes and great flash optical energies (red arrow in Figure 7c) compared with those detected in moderately electrified CEs. Such different lightning characteristics could be partially explained by the combined effects of thunderstorm electrification and cloud shielding. Bruning and MacGorman [27] also demonstrated that the flash size is inversely proportional to flash rate, and hence, lightning flashes became very compact in strongly electrified CEs. On the other hand, frequent lightning discharging (illuminations) and thicker optical depth increase the background radiance levels; as a result, lightning flashes with strong optical energy were more likely to be detected by the lightning imagers such as LMI [16].
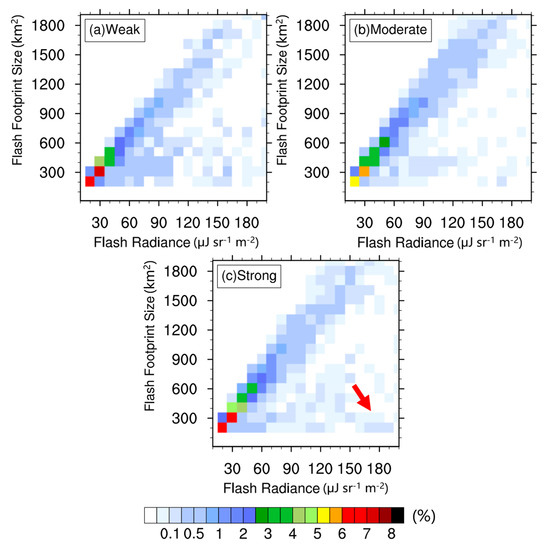
Figure 7.
Percentages of LMI-detected lightning flashes with different flash footprint sizes and optical radiance energies for (a) weak, (b) moderate and (c) strong convective scenarios.
3.3. LMI Detection Efficiency Relative to BLNET
Several studies have reported the preliminary performance of LMI lightning detection relative to ground-based lightning location systems such as WWLLN [7,8] or ADTD [9]. However, these results mainly focused on CG lightning stroke and detailed investigation of the total lightning detection performance of LMI are required yet. Given the total lightning detection capability and high DE of BLNET [21], the BLNET flashes were used as observation truth in this study to quantitively evaluate the detection capability of the LMI. The space-borne LMI tracks the optical signals of lightning at cloud tops with a pixel-resolution of several kilometers, while the ground-based BLNET accurately pinpoints the electromagnetic pulses. Considering the different spatial resolution of the two sources of lightning data, direct point-to-point comparisons between these two lightning detection systems are not possible. Hence, a set of spatiotemporal criteria was applied to reasonably match the BLNET flash and LMI lightning products. Assuming each lightning flash is detected by BLNET, then the BLNET-detected flashes are checked whether they are accompanied by the LMI lightning products (flashes and events) under specific spatial-temporal matching criteria. If a BLNET-detected flash has its corresponding LMI lightning products, we hold that LMI successfully capture the signals of this lightning occurrence. Figure 8 shows the LMI DE relative to BLNET flashes under different spatial and temporal criteria. When applying restrictive matching criteria such as 35 km and 330 ms, which were used in the GLM DE evaluation by Marchand et al. [24], the LMI flash-based DE can be less than 1% relative to the total lightning data from BLNET. However, such a relative DE is quite dependent on the specified spatial and temporal matching criteria. For example, the relative DE of LMI increases rapidly when less strict spatiotemporal matching criteria were used, and the LMI flash-based DE ranged between 1.5% and 3.5% with 1.5 s and 35–65 km matching scales (Figure 8a). Since the LMI flash is the algorithmic representative of illuminated pixels detected by the lightning imager, the elemental LMI events can better reveal whether LMI captures any optical signals in each lightning occurrence and avoid the impacts of flash clustering algorithm on the calculated flash-based DE. To gain a true insight into the LMI lightning detection capability, the BLNET-detected lightning flashes were matched with LMI events if they both occurred within the matching criteria. Results show that LMI event-based DE is approximately 2.5% within 330 ms and 35 km and increases to 28% within 1.5 s and 65 km during all CEs occurred in the summers of 2018 and 2019 (Figure 8b).
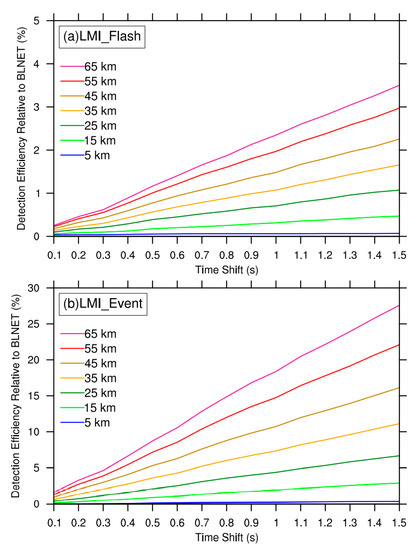
Figure 8.
LMI detection efficiency relative to BLNET flashes using (a) LMI flash and (b) event products under different matching spatiotemporal criteria during multiple convective episodes in the summers of 2018 and 2019.
4. Conclusions
Based on the total lightning observations from the BLNET and S-band Doppler radar data, the characteristics of LMI lightning products and their relationships with cloud properties are investigated in this study. The LMI and BLNET lightning observations during the convective episodes in the summers of 2018 and 2019 over Beijing were compared to evaluate the lightning detection capability of the LMI. When the CEs were categorized into three classes, namely, weakly, moderately and strongly electrified thunderstorms, there was a potential inconsistency between the number of LMI lightning observations (detection capability) and the storm intensity categories. In other words, the lightning detection capability of the LMI was likely to be affected by the cloud properties associated with different thunderstorm categories. In terms of the lightning spatial distributions, the LMI showed patterns consistent with those of BLNET during the CEs used in this study over Beijing and also yielded a considerable lightning detection capability over regions beyond the coverage of BLNET, such as in the mountainous areas with complex terrain and in the far southeastern regions of Beijing. The ratios between the LMI events, groups and flashes were approximately 9:3:1 and the LMI-detected flashes were roughly one order of magnitude smaller than the BLNET-detected flashes.
To gain a better insight into the lightning detection capability of the LMI, especially when capturing the evolving thunderstorms, the evolution of the LMI lightning products was analyzed at a finer temporal scale. The results showed that the LMI principally captures the electrical variations of weak-to-moderate thunderstorms. However, for strongly electrified episodes associated with frequent lightning discharges and thick cloud depth, the lightning detection capability of the LMI was downgraded. The cumulative distribution functions of the maximum radar reflectivity and 5-dBZ echo top heights over regions of LMI-detected lightning flashes revealed that the LMI tended to detect lightning flashes located in weaker and shallower cloud portions with fewer cloud shielding effects. The amount of LMI detected flashes is the competition of the intensifying cloud electrification with thickening cloud depth.
With reference to the total lightning data from BLNET as the ground truth of observations, the DE of the LMI relative to BLNET (percentages of BLNET flashes that match the LMI flashes/events under specific spatiotemporal criteria) was calculated. Under the restrictive matching criteria applied by Marchand et al. [24] to evaluate the GLM (330 ms and 35 km), the LMI flash-based DE was small (<1%) and the LMI event-based DE was 2.5%. However, given that lightning imagers in the geostationary orbit have parallax errors of 20 to 30 km [23], the DE of the LMI increased with relaxed but rational matching criteria and the LMI event-based could reach 28% under the criteria of 1.5 s and 65 km relative to BLNET during the CEs in the summers of 2018 and 2019.
Currently, the LMI is the only space-borne lightning imager in the geostationary orbit that continuously detects and locates total lightning flashes over East Asia and the neighboring regions. The application of space-borne LMI lightning data to the severe weather monitoring and forecasting is expected to grow given the overall encouraging lightning detection capability of the LMI. However, instead of simply adopting the existing lightning data applications concerning the traditional ground-based LLSs, systematical analyses and evaluations of space-borne lightning data and combinations of lightning data from multiple detection systems are necessary in the future. For example, given the impacts of cloud shielding on the optical detections applied by lightning imagers, a fusion of space-borne and ground-based lightning observations can improve the quality of total lightning flash data over broad regions. Another feasible way to improve LMI data accuracy is introducing cloud information provided by the Advanced Geosynchronous Radiation Imager (AGRI) aboard on FY-4A satellite. Therefore, LMI could improve background radiance estimation and more accurately track the lightning-illuminated cloud tops. In the convective-scale data assimilation context, determining how to match the different scales of space-borne lightning data and the nowcasting models is important for effectively extracting convective information from lightning data. In addition, combining traditional meteorological observations such as radar data with lightning data would allow us to better resolve the evolving nature of thunderstorms and hence improve severe weather nowcasting and suppress the spurious convection. In future work, evaluations of LMI lightning products and their applications in severe weather forecasting will be conducted by combining multisource observational data over a longer period of time.
Author Contributions
Conceptualization, Z.C., X.Q. and J.S.; Data curation, X.X. and D.C.; Formal analysis, Z.C., X.Q., J.S. and Y.Z.; Funding acquisition, X.Q., J.Y. and X.X.; Methodology, Z.C., X.Q. and J.S.; Resources, X.Q., X.X. and J.Y.; Visualization, Z.C. and Y.Z.; Writing—original draft, Z.C.; Writing—review and editing, X.Q. and J.S. All authors have read and agreed to the published version of the manuscript.
Funding
This research was funded by “Key Program for International Science and Technology Innovation Cooperation Projects of China (2018YFE0101200)”, “National Natural Science Foundation of China (41630425) and (41761144074)”, and “Beijing Natural Science Foundation (8212026)”.
Acknowledgments
The computing resources used in this study were provided by Fujian Normal University High Performance Computation Center (FNU-HPCC). The Lightning Mapping Imager lightning data were provided by National Satellite Meteorological Center (NSMC), China Meteorological Administration (CMA). The ground-based total lightning data from Beijing Broadband Lightning Network (BLNET) were collected by Key Laboratory of Middle Atmosphere and Global Environment Observation (LAGEO), Institute of Atmospheric Physics (IAP) of Chinese Academy of Sciences (CAS), and contact Xiushu Qie (qiex@mail.iap.ac.cn) for more detailed data. The meteorological observations were provided by the Beijing Meteorology Bureau of CMA. We also express our sincere thanks to Gaopeng Lu of University of Science and Technology of China, for his valuable contributions to this paper. The authors would also like to acknowledge the three anonymous reviewers whose comments helped strengthen the content of this manuscript.
Conflicts of Interest
The authors declare no conflict of interest.
References
- Christian, H.J.; Blakeslee, R.J.; Goodman, S.J. The detection of lightning from geostationary orbit. J. Geophys. Res. 1989, 94, 13329–13337. [Google Scholar] [CrossRef]
- Christian, H.J.; Blakeslee, R.J.; Goodman, S.J.; Mach, M.D. Algorithm Theoretical Basis Document (ATBD) for the Lightning Imaging Sensor (LIS); NASA Technical Report; NASA: Washington, DC, USA, 2000. [Google Scholar]
- Mach, D.M.; Christian, H.J.; Blakeslee, R.J.; Boccipio, D.J.; Goodman, S.J.; Boeck, W.L. Performance assessment of the Optical Transient Detector and Lightning Imaging Sensor. J. Geophys. Res. 2007, 112, D09210. [Google Scholar] [CrossRef]
- Goodman, S.J.; Mach, D.M.; Koshak, W.J.; Blakeslee, R.J. Algorithm Theoretical Basis Document (ATBD) for the GLM Lightning Cluster-Filter Algorithm; NOAA/NESDIS Center for Satellite Applications and Research v2.0.; NOAA: Washington, DC, USA, 2010. [Google Scholar]
- Goodman, S.J.; Blakeslee, R.J.; Koshak, W.J.; Mach, D.; Bailey, J.; Buechler, D.; Carey, L.; Schultz, C.; Bateman, M.; McCaul, E., Jr.; et al. The GOES-R Geostationary Lightning Mapper (GLM). Atmos. Res. 2013, 125, 34–49. [Google Scholar] [CrossRef]
- Yang, J.; Zhang, Z.; Wei, Z.C.; Lu, F.; Guo, Q. Introducing the new generation of Chinese geostationary weather satellites, Fengyun-4. Bull. Am. Meteorol. Soc. 2017, 98, 1637–1658. [Google Scholar] [CrossRef]
- Hui, W.; Zhang, W.; Lyu, W.; Li, P. Preliminary Observations from the China Fengyun-4A Lightning Mapping Imager and Its Optical Radiation Characteristics. Remote Sens. 2020, 12, 2622. [Google Scholar] [CrossRef]
- Zhang, W.; Hui, W.; Lyu, W.; Cao, D.; Li, P.; Zheng, D.; Fang, X.; Zhang, Y. FY-4A LMI observed lightning activity in super Typhoon Mangkhut (2018) in comparison with WWLLN data. J. Meteorol. Res. 2020, 34, 336–352. [Google Scholar] [CrossRef]
- Liu, Y.; Wang, H.; Zheng, L.; Wang, Z. A verification of the lightning detection data from FY-4A LMI as compared with ADTD-2. Atmos. Res. 2021, 248, 105163. [Google Scholar] [CrossRef]
- Chen, Y.; Yu, Z.; Han, W.; He, J.; Chen, M. Case study of a retrieval method of 3D proxy reflectivity from FY-4A lightning data and its impact on the assimilation and forecasting for severe rainfall storms. Remote Sens. 2020, 12, 1165. [Google Scholar] [CrossRef]
- Chen, Z.; Sun, J.; Qie, X.; Zhang, Y.; Zhu, M.; Xiao, X.; Cao, D. A method to update model kinematic states by assimilating satellite-observed total lightning data to improve convective analysis and forecasting. J. Geophys. Res. Atmos. 2020, 125, e2020JD033330. [Google Scholar] [CrossRef]
- Liu, R.; Liu, T.; Pessi, A.; Hui, W.; Cheng, W.; Huang, F. Preliminary study on the influence of FY-4 lightning data assimilation on precipitation predictions. J. Trop. Meteorol. 2019, 25, 528–541. [Google Scholar]
- Boccippio, D.J.; Cummins, K.L.; Christian, H.J.; Good-man, S.J. Combined satellite- and surface-based estimation of the intracloud–cloud-to-ground lightning ratio over the continental United States. Mon. Weather. Rev. 2001, 129, 108–122. [Google Scholar] [CrossRef]
- Qie, X.; Yuan, S.; Chen, Z.; Wang, D.; Liu, D.; Sun, M.; Sun, Z.; Srivastava, A.; Zhang, H.; Lu, J.; et al. Understanding the dynamical-microphysical-electrical processes associated with severe thunderstorms over the Beijing metropolitan region. Sci. China Earth Sci. 2020. [Google Scholar] [CrossRef]
- Cao, D.; Lu, F.; Zhang, X.; Zhang, Z.; Liu, Q. Lightning rate and its relationship with intensity of typhoons over the Northwest Pacific. In Proceedings of the XVI International Conference on Atmospheric Electricity, Nara, Japan, 17–22 June 2018. [Google Scholar]
- Peterson, M. Research applications for the geostationary lightning mapper operational lightning flash data product. J. Geophys. Res. Atmos. 2019, 124, 10205–10231. [Google Scholar] [CrossRef] [PubMed]
- Mach, D.M. Geostationary Lightning Mapper clustering algorithm stability. J. Geophys. Res. Atmos. 2020, 125, e2019JD031900. [Google Scholar] [CrossRef]
- Rudlosky, S.D.; Goodman, S.; Virts, S.; Bruning, C. Initial geostationary lightning mapper observations. Geophys. Res. Lett. 2019, 46, 1097–1104. [Google Scholar] [CrossRef]
- Yuan, S.; Qie, X.; Jiang, R.; Wang, D.; Sun, Z.; Srivastava, A.; Williams, E. Origin of an uncommon multiple-stroke positive cloud-to-ground lightning flash with different terminations. J. Geophys. Res. Atmos. 2020, 125, 32098. [Google Scholar] [CrossRef]
- Wang, Y.; Qie, X.; Wang, D.; Liu, M.; Su, D.; Wang, Z.; Liu, D.; Wu, Z.; Sun, Z.; Tian, Y. Beijing Lightning Network (BLNET) and the observation on preliminary breakdown processes. Atmos. Res. 2016, 171, 121–132. [Google Scholar] [CrossRef]
- Srivastava, A.; Tian, Y.; Qie, X.; Wang, D.; Sun, Z.; Yuan, S.; Wang, Y.; Chen, Z.; Xu, W.; Zhang, H.; et al. Performance assessment of Beijing Lightning Network (BLNET) and comparison with other lightning location networks across Beijing. Atmos. Res. 2017, 197, 76–83. [Google Scholar] [CrossRef]
- Chen, Z.; Qie, X.; Yair, Y.; Liu, D.; Xiao, X.; Wang, D.; Yuan, S. Electrical evolution of a rapidly developing MCS during its vigorous vertical growth phase. Atmos. Res. 2020, 246, 105201. [Google Scholar] [CrossRef]
- Virts, S.; Koshak, J. Mitigation of Geostationary Lightning Mapper geolocation errors. J. Atmos. Ocean. Technol. 2020, 37, 1725–1736. [Google Scholar] [CrossRef]
- Marchand, M.; Hilburn, K.; Miller, S.D. Geostationary Lightning Mapper and Earth Networks lightning detection over the contiguous United States and dependence on flash characteristics. J. Geophys. Res. Atmos. 2019, 124, 11552–11567. [Google Scholar] [CrossRef]
- Wang, D.; Qie, X.; Yuan, S.; Sun, Z.; Chen, Z.; Li, J.; Zang, H.; Liu, M.; Srivastava, A.; Liu, D. Spatial and temporal distribution of lightning activity and contribution of thunderstorms with different lightning-producing capabilities in Beijing Metropolitan Region. Chin. J. Atmos. Sci. 2020, 44, 225–238. [Google Scholar]
- Weiss, S.A.; MacGorman, D.R.; Calhoun, K.M. Lightning in the anvils of supercell thunderstorms. Mon. Weather. Rev. 2012, 140, 2064–2079. [Google Scholar] [CrossRef]
- Bruning, E.C.; MacGorman, D.R. Theory and observations of controls of lightning flash size spectra. J. Atmos. Res. 2013, 70, 4012–4029. [Google Scholar] [CrossRef]
- Zheng, D.; Wang, D.; Zhang, Y.; Wu, T.; Takaqi, N. Charge regions indicated by LMA lightning flashes in Hokuriku’s winter thunderstorms. J. Geophys. Res. Atmos. 2019, 124, 7179–7206. [Google Scholar] [CrossRef]
- Dye, J.E.; Jones, J.J.; Winn, W.P.; Cerni, T.A.; Gardiner, B.; Lamb, D.; Pitter, R.L.; Hallett, J.; Saunders, C.P. Early electrification and precipitation development in a small, isolated Montana cumulonimbus. J. Geophys. Res. 1986, 91, 1231–1247. [Google Scholar] [CrossRef]
- Carey, L.D.; Rutledge, S.A. A multiparameter radar case study of the microphysical and kinematic evolution of a lightning producing storm. Theor. Appl. Clim. 1996, 59, 33–64. [Google Scholar] [CrossRef]
- Deierling, W.; Petersen, W.A. Total lightning activity as an indicator of updraft characteristics. J. Geophys. Res. 2008, 113, D16210. [Google Scholar] [CrossRef]
- Yoshida, S.; Morimoto, T.; Ushio, T.; Kawasaki, Z. A fifth-power relationship for lightning activity from the Tropical Rainfall Measuring Mission satellite observations. J. Geophys. Res. Atmos. 2009, 114, D09104. [Google Scholar] [CrossRef]


Publisher’s Note: MDPI stays neutral with regard to jurisdictional claims in published maps and institutional affiliations. |
© 2021 by the authors. Licensee MDPI, Basel, Switzerland. This article is an open access article distributed under the terms and conditions of the Creative Commons Attribution (CC BY) license (https://creativecommons.org/licenses/by/4.0/).