Abstract
Alluvial (torrential) fans, especially those created from debris-flow activity, often endanger built environments and human life. It is well known that these kinds of territories where human activities are favored are characterized by increasing instability and related hydrological risk; therefore, treating the problem of its assessment and management is becoming strongly relevant. The aim of this study was to analyze and model the geomorphological aspects and the physical processes of alluvial fans in relation to the environmental characteristics of the territory for classification and prediction purposes. The main geomorphometric parameters capable of describing complex properties, such as relative fan position depending on the neighborhood, which can affect their formation or shape, or properties delineating specific parts of fans, were identified and evaluated through digital elevation model (DEM) data. Five machine learning (ML) methods, including a hybrid Euler graph ML method, were compared to analyze the geomorphometric parameters and physical characteristics of alluvial fans. The results obtained in 14 case studies of Slovenian torrential fans, validated with data of the empirical model proposed by Bertrand et al. (2013), confirm the validity of the developed method and the possibility to identify alluvial fans that can be considered as debris-flow prone.
1. Introduction
Alluvial (torrential) fans are a typical form of sedimentary deposits growing at the outlets of steeper drainage areas such as torrential watersheds [1]. Considering the geological feature, it is essential to illustrate torrential fans as built by a sequence of sediment-laden events (torrential floods, debris floods, debris flows), a mixture of water and sediments (debris). Torrential fans are a sediment body of intermixing layers of coarse and poorly sorted debris (rocks, stones, gravel, or sand), generally having a cone-like shape. A fan’s conical shape is formed due to the rapid decrease in flow velocity and, consequently, due to the lower transport capacity to transfer debris material. According to their formation, we can distinguish between the debris flows resulting from torrential outbreaks (torrential debris flows) and those that are developed on slopes from landslides (slope debris flows).
It should be noted that from the natural hazard point of view, the classification of torrential fans is of interest with regard to debris-flow activity. As is known, debris flows are, besides rock falls, among the most destructive types of slope processes [2], as they cannot be easily predicted in terms of time of triggering, the location, their extent (magnitude), flow velocities and depths, and their capability to move over large distances. Torrential fans have relatively gentle surface slopes in comparison to steep mountainous environments and, therefore, often exhibit noticeable damage potential, as humans tend to settle in these areas because of fertile soils being agriculturally used. As alluvial fans are morphologically active, it is enough clear that human presence on them is endangered by torrents and slope mass movement. The main characteristics of alluvial fans can be categorized as composition, morphology, and location. These geomorphometric and geomorphological characteristics can be extracted from digital land surface models, also known as digital elevation models (DEMs). DEMs, indeed, provide surface parameters (morphometric, hydrological, climatic, etc.) and land object information (watersheds, stream networks, landforms, etc.).
In recent years, many researchers have focused their attention on the threats of climate change in terms of precipitation variability [3] and the growth processes of river deltas [4]. In their study, [4] developed the first laboratory delta built through the successive deposition of lobes with a constant size for the sustainable management of deltas. Performing scaled physical experiments to grow a delta, they observed its dynamics under conditions of subcritical flow and multiple floods. The results of their study show applications for decoding their stratigraphic record on Earth and Mars. Other authors [5] have instead considered another important aspect of the impact of precipitation as sustainable groundwater resource management and control can be.
The usage of computer-based spatial modeling as the procedure for understanding and recognition of patterns, trends, or relationships among data in the geographic space meets engaging challenges for the classification of geographical dynamic phenomena as alluvial fans.
The main aim of the present research study was the modeling and automatic classification of torrential fans for the recognition of debris-flow-prone fans in order to produce hazard maps as a preventive tool for spatial planning on torrential fans or to protect existing structures on them. Deriving geomorphometric parameters of fan surfaces from effective DEMs, it is possible to distinguish between the debris-prone torrential fans formed by pronounced debris-flow activity and the remaining that are profoundly formed by torrential processes such as torrential floods and debris flows. In the performed research study, not all the information that can be gained from DEM parameters was used; however, it was not necessary to take into account some geomorphological aspects (hydrological, climatic, etc.). A complete and in-depth analysis of geomorphometric and geomorphological DEM parameters was illustrated by Lu and Weng [6], Sofia [7], and Trzcinska and Janowski et al. [8].
The use of remote sensing tools, and specifically image processing and geomorphometry tools (while using terrain and surface models), allows classifying different types of fans, especially due to our good experience with their determination on Mars [9], where our knowledge of field conditions is obviously very limited. In a more recent study on the geological history of Mars’ river runoff, [10], which has revealed the unknown mechanism that causes wet climates on Mars, a globally distributed survey was carried out thanks to a global database of Mars’ alluvial fans and deltas and including reported sites. Likewise, alluvial fans have also been detected on Titan’s surface. In [11], thanks to the observation of alluvial fan distribution, the influential role of extreme precipitation in shaping Titan’s surface was demonstrated. From this study, it arises that, differently from Mars and similarly to Earth, active geomorphic work may be ongoing in the present climate on Titan, despite the uncertainties on the role of Titan’s unconstrained surface composition and processes in sedimentary transport and deposition and the extent to which surface material properties are tied to local hydroclimate.
The automatic identification of fans, as well as the classification of their shapes using geomorphometric analysis, is a step further from procedures such as the Melton number, which is calculated based on the characteristics of the catchment area. This approach includes the development of several innovative methods of using DEMs, as well as remote sensing techniques. Recently, the authors of [12] used remote sensing techniques to map the siltation of recharge dams found in an arid region to increase the yield of groundwater for sustainability. The authors underlined the relevance of using satellite images obtained from remote sensing techniques as a suitable technique to map and assess the silt deposits in alternative to expensive and time-consuming methods, with the aim of removing or protecting the deposits of the recharge dams. In their study, specifically, the use of Advanced Spaceborne Thermal Emission and Reflection Radiometer (ASTER) Global Digital Elevation Model (GDEM)) data by the decorrelated stretching image classification method to map the siltation of the Al-Khod Dam constructed at the lower reaches of the Samail catchment area in the Sultanate of Oman was demonstrated.
In this perspective, it is assumed that although the classical (visual) analysis of surface characteristics will remain important in the future, adequately collected and prepared databases consisting of high-quality spatial data allow, for the highest possible degree of fast and automated techniques for numerical spatial analyses, pinpointing the most problematic torrential fan areas in a fast and reliable manner.
In the present research study, the main geomorphometric parameters of fan surface were derived by DEMs and were evaluated with the ML method and a new hybrid Euler graph method for classification and prediction purposes. The new hybrid Euler graph method connected four methods, random forest (RF) [13], genetic programming (GP), support vector machine (SVM) [14], and neural network (NN), of intelligent systems into one [15,16,17,18]. In order to outline the advantages of the proposed method, as illustrated afterward in this article, two theoretical concepts that have oriented the methodological setup of the study can be briefly highlighted as follows: machine learning and graph theory.
Machine learning [19] is an artificial intelligence technology that allows computers to learn without having been explicitly programmed for that purpose. To learn and develop models, however, computers need data to analyze and train on. In fact, Big Data is the essence of machine learning, and it is the technology that makes the most of Big Data’s potential. Machine learning is very effective in situations where insights must be discovered from large and diverse data sets. For the analysis of such data, it is much more efficient than traditional methods in terms of accuracy and speed. For example, based on information associated with a transaction such as amount and location, as well as historical and social data, machine learning can detect potential fraud in a millisecond. Thus, this method is much more efficient than traditional methods to analyze transactional data, data from social networks or CRM platforms. The problem we faced was that we do not have Big Data available on debris-flow-prone torrential fans in Slovenia for use to develop a robust automatic recognition model.
Graph theory [20] is a section of discrete mathematics that studies the properties of graphs. In a general sense, a graph is represented as a set of vertices (nodes) connected by edges. In a strict definition, a graph is a pair of sets G = (V, E), where V is a subset of any countable set, and E is a subset of V × V. Graph theory is used, for example, in geographic information systems (GISs). Existing or newly designed houses, structures, neighborhoods, etc., are considered as vertices, and the roads connecting them, engineering networks, power lines, etc., are considered as edges. The use of various calculations performed on this graph allows, for example, to find the shortest detour or the nearest grocery store, to plan the optimal route. The Eulerian circuit or the Eulerian cycle is a Eulerian trail that starts and ends on the same vertex. The term Eulerian graph has two common meanings in graph theory. One meaning is a graph with a Eulerian circuit, and the other is a graph with every vertex of even degree. These definitions coincide for connected graphs. The realization of hybrid systems [21] is a common approach that combines the strengths of each approach and thus obtains higher performance or a wider scope. Another important aspect of the development of intelligent hybrid systems is their ability to acquire new knowledge from many different sources and to evolve them.
The problem analyzed in this research was the possibility of a rapid and reliable classification of alluvial (torrential) fans through DEM data from satellites and geological maps. Seven main morphometric parameters obtained from these DEM data were identified as the most significant to characterize alluvial fans.
The hypothesis to be tested was to find a mathematical model, which, through effective and fast analysis of the seven (or possibly some of them) above-mentioned morphometric parameters, allows automatic classification of the alluvial fan areas. For this purpose, five ML methods, including a hybrid Euler graph ML method, were applied to different combinations of the seven selected morphometric parameters, finding the best mathematical model that garantees an automatic classification and hazard prediction of alluvial fans. Figure 1 shows a schematic workflow of the study.
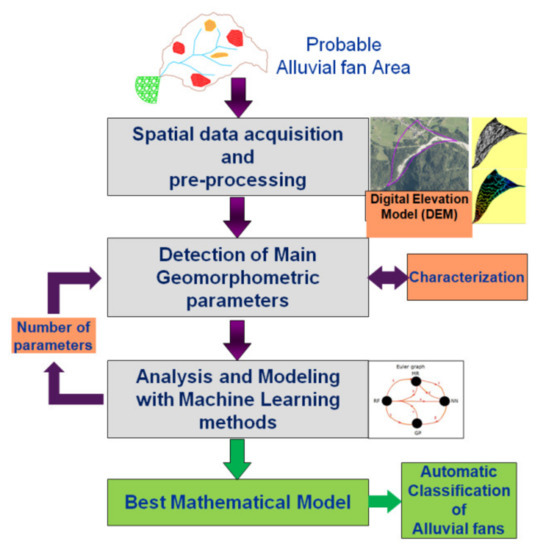
Figure 1.
Schematic workflow of the study.
The main challenge of the present study was the determination of the best combinations of geomorphometric parameters used in the effective ML model that enable the automatic classification of the alluvial fan areas.
Summing up the present study proposed a replicable procedure based on DEM and ML methods to analyze morphological parameters and physical characteristics of alluvial fans and predict hazardous (debris-flow prone) torrential fans. The case study of Slovenian torrential fans offered tangible results to support the methodology by validating it with experimental data.
The paper is divided into four sections, with Section 1 being the introduction. Section 2 is devoted to the state of the art and related works concerning the case study of Slovenian torrential fans. Section 3 deals with the materials and methods adopted. In Section 4, the main results are discussed. Final considerations and conclusions are drawn in Section 5.
2. Case Study of Slovenian Torrential Fans: State of the Art and Related Works
Since the large debris-flow event at the village of Log pod Mangartom (Slovenia) in November 2000, claiming seven fatalities and causing large damage in the devastated area, Slovenia has devoted more attention to debris-flow initiation and hazards in general. The emphasis was mainly given to their dynamics and triggering mechanisms. Modeling and risk assessment for the case of the Log pod Mangartom debris flow were carried out by [22] and for the 2002 debris flow at Koseč above Kobarid [23]. Possible mechanisms for triggering debris flow and estimating possible debris flows magnitudes at selected torrential watersheds in Slovenia were described by [24]. The analysis was based on the use of empirical methods, which often consider particular morphometric parameters of torrential watersheds, torrential fans, and hydrological characteristics, while geological parameters are directly considered only in a few models. The study of the phenomenon of old debris flows in Slovenia is limited primarily to the area of the Upper Soča Valley [25], where one of the methodologies for predicting the “hot spots” of such phenomena was developed [26]. For the area of the western part of the Karavanke mountain chain, the sediments of four torrential fans were investigated, and their catchment area was assessed geologically [27]. The authors of [28] studied in detail the geological composition of the catchment area of the Koroška Bela Torrent and its torrential fan in the lower-laying Sava Dolinka valley. The original areas of material from research excavations on the fan were identified. The authors of [29] studied the landslide of the Potoška planina with photogrammetry and tachymetric measurements. The appearance of debris flows in the Zgornjesavska Valley (Sava Dolinka valley) was also conditioned by the relatively complex geological composition of the western part of the Karavanke mountain chain [30]. In this respect, tectonically deformed clastic sedimentary rocks, which are quite frequent in the area, are especially suitable as the original areas of gravitational mass movements. The influence of the clay fraction on the formation of debris flows can be found in previous studies [31,32], which confirm that the quantity of interstitial water presence at both boundaries of consistency depends on the amount of clay fraction and its mineral composition. In clay fractions of debris flows, mica or illite is also present. That is why we used the computer modeling of filosilicates on targeted samples by [33] in this study of debris flows. For the territory of Slovenia, a model of debris flow susceptibility was developed on a scale of 1:250,000 [34]. The model was intended for spatial prediction of areas where debris flows and debris streams can be generated/triggered. It represents a general overview of risk areas in Slovenia. It also serves as a basis for further detailed investigations and analyses. According to the model, approximately 4% of Slovenia’s area is extremely susceptible, and approximately 11% of Slovenia’s area of susceptibility to debris flow is high. As expected, these areas are related to the mountainous terrain in the NW and N of Slovenia.
3. Materials and Methods
As mentioned, several studies present developed methods based on the automatic determination of the shapes of alluvial (torrential) fans using remote sensing techniques and satellite images. In the present study, the main geomorphometric parameters of fan surfaces were derived by DEMs and were evaluated with ML methods for classification and prediction purposes.
3.1. Digital Elevation Modeling
DEM is a quantitative representation of the terrain surface, providing information about relief and its attributes (slope, aspect, drainage area and network, curvature, topographic index, etc.). Only a few studies use DEMs in combination with satellite images as a basis for alluvial fan classification [35,36,37]. In particular, among these studies, the work of Millaresis et al. (2000) adopts low-resolution DEM to control the size of fans to classify them. Another relevant study is that of [38], which used a high-resolution Lidar DEM to acquire selected geomorphometric parameters of fans for 3D rockfall modeling. Using the two most important open-source DEMs, ASTER GDEM and SRTM, integrated with a direct survey, orthophoto from “Surveying and Mapping Authority of the Republic of Slovenia” and stereo satellite imagery (GeoEye Ikonos, WorldView, ALOS, and SPOT Image), we analyzed 14 different torrential fans occurring in a stretch of 35 km × 5 km in the upper part of the Sava river valley in NW Slovenia. In Figure 2, these torrential fans are shown on a General map of Slovenia (1:250,000) (© Surveying and Mapping Authority of the Republic of Slovenia).
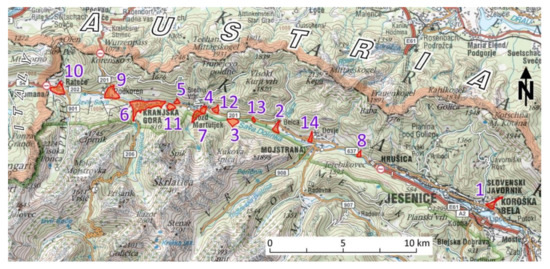
Figure 2.
Location of 14 alluvial (torrential) fans (red areas) occurring in the upper part of the Sava river valley in NW Slovenia (courtesy of © Surveying and Mapping Authority of the Republic of Slovenia).
The study area is highly rugged, and a significant variation of relief is observable. Geomorphologically, the area is characterized by hills and valleys. The lower middle part of the delimited area is mainly dominated by hills. Due to the pressure of the steep slope, the area is dissected by a certain number of small rivers characterized by scattered vegetation. The type of forest is mixed, and its density varies from medium to scattered. The accuracy of these data sets is therefore unknown and is nonuniform within each torrential fan. The direct survey was carried out using the Topcon FC-100 GPS system, and its rover was placed on a 2.5 m high telescopic rod (Figure 3). Geolocalized points were acquired, and the slopes of the terrain were indirectly evaluated using these points.
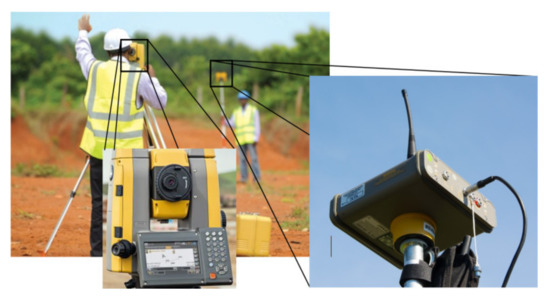
Figure 3.
Survey experimental setup.
For each torrential fan, the ASTER GDEM and SRTM data were compared with 10 ÷ 35 derived ground control points (DGCPs) acquired with the Differential Global Navigation Satellite System (SDGNS). The GPS system provided elevation reference to the WGS84 surface, while ASTER GDEM and SRTM were referenced to the EGM96 surface. Hence, using “Geoid Height Model-UNAVCO,” the GPS-based ellipsoid height was converted into the EGM96 geoid reference surface and compared with the ASTER GDEM and SRTM height. Table 1 shows the comparison results in torrential fans No. 7 “Martuljek“(Figure 4).

Table 1.
Error in ASTER GDEM and SRTM with respect to the GCP-derived height in torrential fans No. 7.
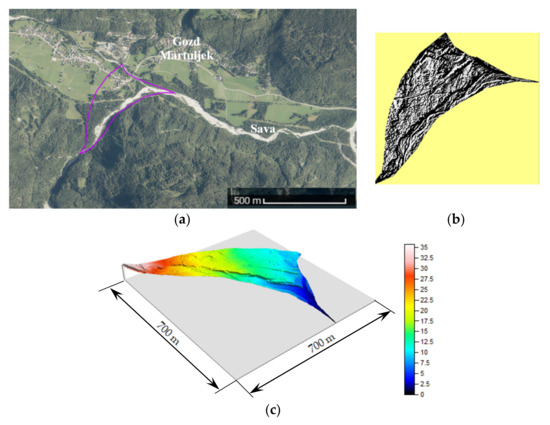
Figure 4.
Alluvial fan area No. 7: (a) contour of the area in the cartography map (Maxar Technologies data cartograph, 2021); (b) ASTER GDEM; (c) DEM 3D perspective view.
The root mean square (RMS) errors calculated for the ASTER GDEM and SRTM are 2.38 and 4.61 m with a mean error of −2.53 and −4.29 m, respectively. These values indicate that the set of measurements underestimates the real values of surface terrain elevations (probably because of open land or land cover).
Furthermore, ASTER GDEM provides each elevation data (pixel) for a 30 m × 30 m area (30 m grid spacing), and the representation often becomes smooth. A little less precise is SRTM (30 m grid spacing).
In order to obtain a finer resolution, high-resolution imagery provided by ALOS (10 m grid spacing), GeoEye Ikonos (5 m grid spacing), WorldView satellites (2 m grid spacing), and orthophoto from the “Surveying and Mapping Authority of the Republic of Slovenia” were used. In particular, the imagery with the widest grid spacing ensuring an Hav error of less than 5% were used. The Hav errors were valuated as explained in Section 3.1. These data integrated with the direct survey allowed adopting a grid spacing of 5 and 10 m for the 14 different torrential fans. In this way, details and small undulation characteristics closing to the real terrain surface of the torrential fans could be taken into consideration (Figure 5).
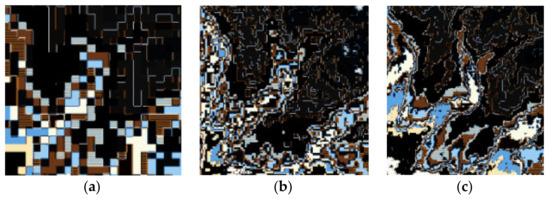
Figure 5.
Different DEM resolution of alluvial fan area No. 2: (a) SRTM 90 m grid spacing; (b) ASTER GDEM DEM 30 m grid spacing; (c) WorldView satellites 5 m grid spacing.
In order to establish the most effective value of the grid sizes (posting) of the DEMs, the effects of the grid spacing on the surfaces’ smoothing were evaluated.
3.2. DEM Grid Size Selection
The analysis of smoothening effects when the grid size changed was performed by evaluating the variation of average elevation height with the formula:
where Hav (m) is the average value of elevation heights, n is the number of control points (CP) considered along a slope line from the top to the base proportional to the grid size, and Hi (m) is the elevation height in the generic control point I along the slope line. By evaluating Hav along the maximum slope line (dashed red line in Figure 6a) and along two directions close to ± 7° (dashed black line in Figure 6a), we could choose the value of the grid size that guaranteed the desired smooth effect.
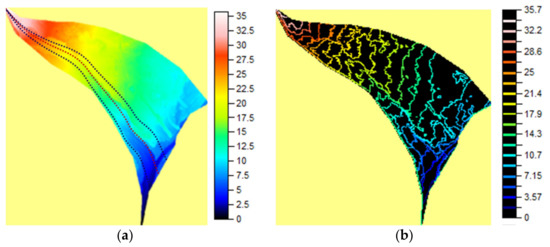
Figure 6.
DEM of alluvial fan area No. 7 with a 5 m grid spacing: (a) maximum slope line; (b) drainage network.
By way of example for the alluvial fan area No. 7, 150 CP ensured an Hav error of less than 5% and therefore a negligible smoothening effect and a realistic representation of the terrain cross profile (Figure 7). Because the maximum slope line is 765 m long, 150 CP is equivalent to a grid size acquisition of 5 m. The grid size acquisition of 5 m also allows obtaining an excellent delineation of drainage networks (Figure 6b).
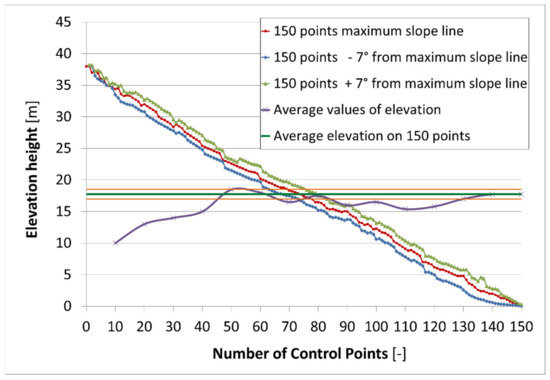
Figure 7.
Average values of elevation heights in alluvial fan area No. 7.
This grid spacing ensured a Hav error always less than 5% in all 14 torrential fans. Furthermore, by using such grid spacing, DEMs of all alluvial fan areas, with the exception of No. 6 (with 30,000 points), constituted fewer than 10,000 elevation points. In Table 2, the number of DGCPs, the adopted grid size, the Hav error, the RMS error, and mean error in the 14 torrential fans DEMs are shown.
Table 2.
Derived ground control points, grid size selection, and DEM accuracy.
Referring to all 14 torrential fans, the overall maximum RMS error was 6.2 m with a mean error of −2.86 m. In both cases, the error was less than the official error specification given by ASTER GDEM and SRTM (8.86 and 16 m, respectively).
3.3. Analysis of Geomorphometric Parameters
From the literature cited in the previous sections, seven main geomorphometric parameters were selected as the relevant parameters to classify alluvial (torrential) fans with regard to debris-flow hazards:
− P1 (HLSlope_avg): the average slope of the hinterland in degrees.
− P2 (TORRSlope_avg): the average slope of the torrent in degrees.
− P3 (Melton_HL): the Melton ruggedness number of the torrential catchment upstream of the fan (hinterland).
− P4: the Relief ratio (Err).
− P5 (Av/A): the relationship between the fan and its hinterland surface.
− P6 (Melton_fan): the Melton number of the alluvial (torrential) fan—defined in the same manner as for the catchment area: using the fan area and the height difference of the fan between its apex and foot (Melton fan numbers are typically lower as catchment Melton numbers).
− P7 (FANSlope_avg): the average slope of the fan following the flow direction in degrees.
To their benefit, these gathered parameters were capable of describing more complex properties, such as relative fan position depending on the neighborhood that could affect their formation or shape, or properties describing a specific part of a fan in a special way.
For the 14 Slovenian torrential fans, these geomorphometric parameters were evaluated through the DEM data, acquired experimentally and via satellite.
The Melton ruggedness number (MNR) is a simple flow accumulation-related index, calculated as the difference between the maximum and minimum elevation in a catchment area divided by the square root of the catchment area size [39]. The Melton ruggedness number was calculated by Equation (2).
where A is the catchment surface area (km2), and H is the difference between heights (km).
Mel = H * A−0.5
A good indicator of hazardous alluvial (torrential) fans is the Bertrand number (Y). Bertrand et al. (2013) used a data set from 620 torrential watersheds from around the world and developed for their classification the following multivariate statistical model (logistic regression):
where S is fan slope (degree) and M is Melton ruggedness number (−). If P > 0.5, then the torrential fan is considered to be a debris-flow-prone area.
Y = (e−0.65 × M1.66 × S2.00)/(1 + e−0.65 × M1.66 × S2.00)
For the analysis, we also used a hybrid system, where the four methods mentioned above were connected, namely RF [40], SVM [41], GP [42], and NN [43] of the intelligent system, into one Euler graph method of machine learning (Figure 8).
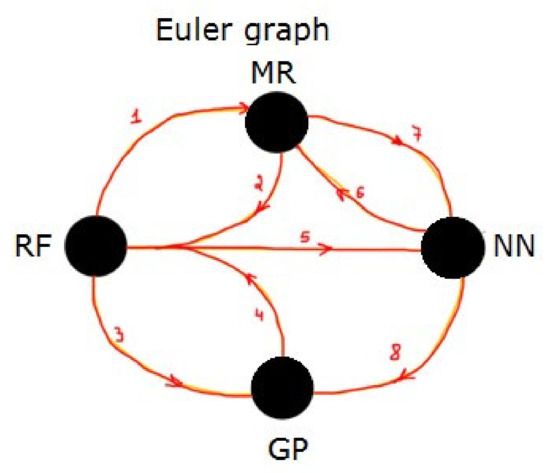
Figure 8.
Euler graph method of machine learning.
Ensemble methods are learning algorithms that build a series of classifiers and then classify new data points, summarizing the results of their predictions. An RF method (Figure 9) uses many decision trees to create a classification. The number of signs and the number of trees are used as parameters. It is a ready-to-use classifier, and, most of the time, the user does not need to define these parameters. Generally, if the user understands the concept of decision trees, its use of this method is rather simple. We used attributes of the RF (number of trees: 16, fixed seed for random generator: 32) and did not split a subset smaller than 5.
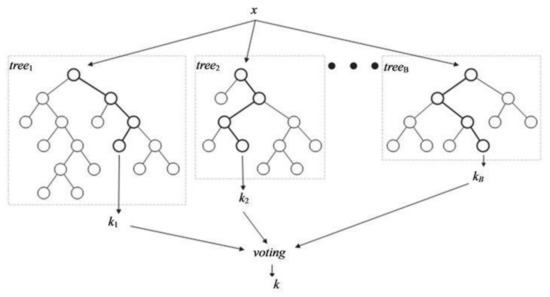
Figure 9.
Random forest method.
The challenge of computer synthesis of programs has become one of the areas of artificial intelligence around the end of the 1950s. The interest of researchers in this issue has increased dramatically due to GP (Figure 10) and aimed at solving problems of automatic synthesis of programs based on learning data by inductive inference. Chromosomes or mathematical expressions that are automatically generated using genetic operators are computer programs of various sizes and complexity. Programs consist of functions, variables, and constants. The initial population P(0) of chromosomes in the GP is formed stochastically and consists of programs that include elements of a multitude of problem-oriented elementary functions (function set as well as any other function from the problem domain), problem-oriented variables, and constants. We used the following attributes of the GP: size of the population of organisms: 1000; maximum number of generations: 100; reproduction probability: 0.4; crossover probability: 0.6; maximum permissible depth in the creation of the population: 6; maximum permissible depth after the operation of crossover of two organisms: 10; smallest permissible depth of organisms in generating new organisms: 2. Genetic operations of reproduction and crossover were used. For the selection of organisms, the tournament method with tournament size 7 was used. The AutoLISP-based in-house GP system was run 100 times in order to develop 100 independent civilizations. Each run lasted from 2 to 10 min on an Intel i7 processor and 8 GB of RAM.
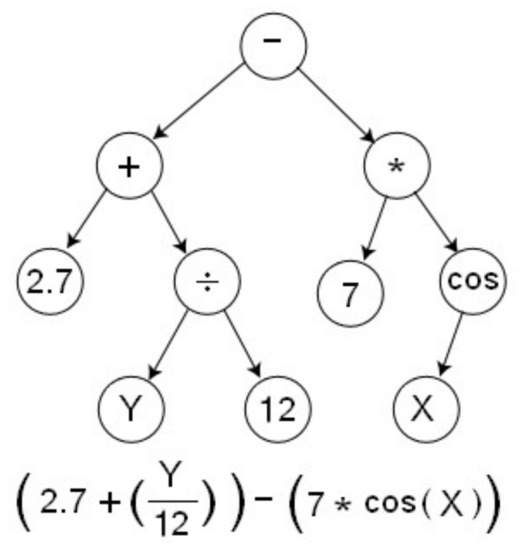
Figure 10.
Tree structure of genetic programming.
Neural networks (Figure 11) are among the research areas in the field of artificial intelligence, based on attempts to reproduce the human cerebral nervous system with the goal of learning and correcting errors, which should allow simulating, although quite roughly, the work of the human brain. A NN is not just a mathematical model but an artificial NN that consists of a set of elements called neurons or processors, imitating the biological NN that consists of nerve cells. By imitating the activities of the human brain, it acts not only according to a strict algorithm and formulas but also accumulates and uses past experience. Consequently, the artificial NN neurons or processors are capable of learning, based on the previous results. We used the following attributes of the NN learning speed: 0.6; inertial coefficient: 0.5; test mass tolerance: 0.02; tolerance of the learning set: 0.03; number of layers: 4.
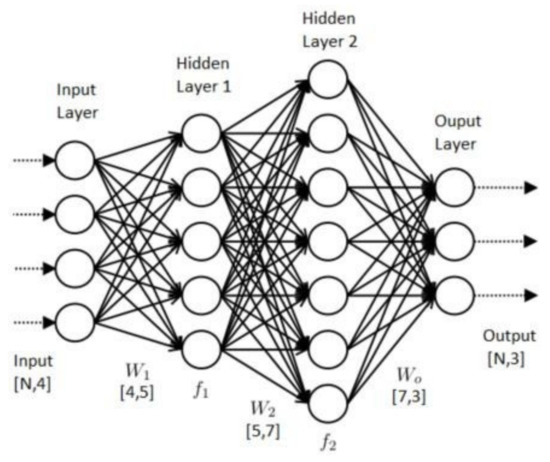
Figure 11.
Artificial neural network.
4. Results and Discussion
The results of the empirical model proposed by Bertrand were implemented in five machine learning methods, including the hybrid method of machine learning. In this regard, the data set used for the Bertrand [44] method was treated as “big data”. Data from 620 upland catchments in various mountain ranges of the world under temperate climate were used in order to test the performance of geomorphometric parameters for the identification of catchments prone to debris flow. Finally, it can be concluded that the GP method provides the best result for the classification of torrential fans into two classes: hazardous (debris-flow prone) alluvial (torrential) fans and nonhazardous fans. The values of the geomorphometric parameters and Bertrand number (Y) are reported in Table 3. Table 4 reports the Bertrand number (Y), the prediction data obtained by RF, the prediction data obtained by multiple regression (MR), the prediction data obtained by GP, the prediction data obtained by NN, and the prediction data obtained by the hybrid method (HM), namely the Euler graph method of hybrid machine learning.
Table 3.
Parameters of all alluvial (torrential) fans.
Table 4.
Experimental (Y) and prediction data.
In Table 4, values of the square ”r2” Pearson product–moment correlation coefficient of experimental (Y) and prediction data (RF, MR, GP, NN, and HM) are given for the 14 models. The debris-flow-prone torrential fans are those with a value of Y above 0.5 (highlighted in gray).
Figure 12 shows the results of the derived Bertrand number for each of the torrential fans using the above-mentioned methods. The hypothetical value of 0.5 represents the threshold above which the torrential fans are most probably the result of the debris-flow events. On the x-axis is presented experimental (Y) and prediction data (RF, MR, GP, NN, and HM), on the y-axis is presented the Bertrand number for each of the torrential fans. Table 5 summarizes the comparison of the five machine learning models in relation to the experimental Bertrand value (Y).
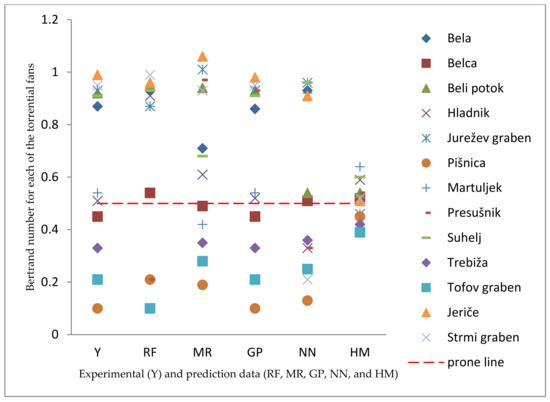
Figure 12.
Experimental (Y) and prediction data (RF, MR, GP, NN, and HM).
Table 5.
Comparison of the successfulness of the 5 machine learning models in relation to the experimental Bertrand value (Y).
The model of Bertand as GP is presented in Equation (4).
The multiple regression model is expressed with the following equation (the number of significant digits for the coefficients in the model was limited to two digits), according to the precision of the input data):
Y = 0.51 − 0.01 × P1 − 0.02 × P2 + 1.21 × P3 − 0.37 × P4 − 1.44 × P5 − 1.98 × P6 + 0.17 × P7
We used the GP method for modeling the best results with combinations of two parameters from Table 3 that describe the properties of the torrential fans or the properties of their hinterland. Table 6 presents the results. The best results were derived from the model that used Parameters P3 and P7, the Melton ruggedness number of the torrential catchment upstream of the fan (hinterland) (Melton_HL), and the average slope of the fan (following the flow direction) in degrees (FAN Slope_avg).
Table 6.
Successfulness of the models, derived from the GP method, where we combined two parameters from Table 1 that describe the properties of the torrential fans or the properties of their hinterland. The best model is highlighted in gray and was derived using Parameters P3 and P7.
Equation (6) presents the best model derived using the GP from the two-parameter approach.
The RF model resulted in a precision value of 64 (the higher the value, the higher the precision of the model), the GP method resulted in a precision value of 99, the multiple regression model resulted in a precision value of 82, the method of NN resulted in a precision value of 72, and the hybrid model resulted in a precision value of 36 (Table 4). The GP model with only two parameters (P3 and P7) resulted in a precision value of 99.6.
Based on the analyses, all torrential fans in Table 4 with a Bertrand parameter above 0.5 should be classified as debris-prone fans. The modeling, determination, and other analysis of fans were limited to relatively basic methods that can be performed within the GIS software using the digital elevation models of torrential fans and their hinterlands. Traditionally, comparable methods are related to the analysis of satellite or aerial photos [45]. Spatial analyses are used to build models divided into descriptive, explanatory, predictive, and normative [46]. An important predictive modeling process is one by which a model is created or chosen to predict the likelihood of an outcome in the best possible way. This modeling includes different spatial analyses according to the decision-making process [47].
The experimental results obtained in the case studies of Slovenian torrential fans show the efficacy of the illustrated procedure for the identification of the best model capable of classifying alluvial fans as debris-flow prone in a fast and reliable manner. The developed method can be extended to the study of other territories so that hazard maps can be created in advance with high values of accuracy and used for spatial planning on torrential fans or for the protection of structures already built in areas where debris flows and debris streams can be generated/triggered. In future research, the presented procedure can be ameliorated by enlarging the data set for further detailed investigations and the advancement of predictive modeling and successful applications in the field.
5. Conclusions
A new procedure to model and to classify alluvial (torrential) fans based on DEM data and the ML method was developed. The latter allowed the understanding and recognition of patterns, trends, and relationships among data coming from DEMs. The new method was applied to 14 case studies of Slovenian torrential fans. After identifying the Bertrand number as a good indicator of hazardous alluvial fans, seven main morphological parameters were chosen and evaluated with the ML and hybrid Euler graph method in the 14 case studies.
Among these morphological parameters, we evaluated which and how many at the same time were capable of carefully describing more complex properties, such as relative fan position depending on the neighborhood, which can affect their formation or shape, or properties describing a specific part of a fan in a special way.
The proposed method provided excellent results for the classification of torrential fans into two classes: hazardous (debris-flow prone) alluvial (torrential) fans and nonhazardous fans. Considering the validity of the theoretical assumptions of the study, in future research, the proposed methods that were validated should be further tested on a larger data set for other significant improvements in the field.
Author Contributions
M.B.: conceptualization, methodology, software, validation, formal analysis, investigation, data curation, resources, writing—original draft, writing—review and editing, supervision, project administration, funding acquisition. D.P.: methodology, software, validation, formal analysis, investigation, data curation, resources, writing—original draft, writing—review and editing. J.S.: methodology, software, validation, formal analysis, investigation, data curation, resources, writing—original draft, writing—review and editing. B.S.: software, validation, formal analysis. M.K. (Marko Komac): methodology, software, validation, formal analysis, investigation, data curation, resources, writing—original draft, writing—review and editing. O.C.: software, validation, formal analysis. M.K. (Miha Kovačič): genetic programming model. M.M.: methodology, software, validation, formal analysis, investigation, data curation, resources, writing—original draft, writing—review and editing. M.C.: conceptualization, methodology, software, validation, formal analysis, investigation, data curation, resources, writing—original draft, writing—review and editing, supervision, funding acquisition. All authors have read and agreed to the published version of the manuscript.
Funding
Open access funding provided by Università degli Studi di Catania within the CRUI-CARE Agreement (Research Path PIA.CE.RI. 2020-2022 Linea 4). This study was partially financially supported by the Slovenian Research Agency (ARRS) through project J7-8273 “Recognition of potentially hazardous torrential fans using geomorphometric methods and simulating fan formation”.
Data Availability Statement
The corresponding authors will be happy to provide data not directly available in the article.
Acknowledgments
The project was approved by the International Programme on Landslides (IPL) as the IPL-225 Project. This paper belongs also to a research path funded by Università degli Studi di Catania (Starting Grant 2020-2022 Linea 3—Progetto NASCAR—Prot. 308811).
Conflicts of Interest
The authors declare no potential conflicts of interest with respect to the research, authorship, and publication of this article.
References
- French, R.H. Hydraulic Processes on Alluvial Fans; Elsevier Science Publishers: Amsterdam, The Netherlands, 1987; Volume 24. [Google Scholar]
- Hungr, O.; Leroueil, S.; Picarelli, L. The Varnes classification of landslide types, an update. Landslides 2014, 11, 167–194. [Google Scholar] [CrossRef]
- Wang, Y.; Lu, H.; Wang, K.; Wang, Y.; Li, Y.; Clemens, S.; Lv, H.; Huang, Z.; Wang, H.; Hu, X.; et al. Combined high-and low-latitude forcing of East Asian monsoon precipitation variability in the Pliocene warm period. Sci. Adv. 2020, 6, eabc2414. [Google Scholar] [CrossRef] [PubMed]
- Ganti, V.; Chadwick, A.J.; Hassenruck-Gudipati, H.J.; Fuller, B.M.; Lamb, M.P. Experimental river delta size set by multiple floods and backwater hydrodynamics. Sci. Adv. 2016, 2, e1501768. [Google Scholar] [CrossRef]
- Mu, E.L.; Yan, L.; Ding, A.Z.; Deng, W.; Wang, Y. Determination of controlled limit value of groundwater level depth and management practice in Xi’an, china. Sci. Rep. 2020, 10, 1–8. [Google Scholar] [CrossRef]
- Lu, D.; Weng, Q. A survey of image classification methods and techniques for improving classification performance. Int. J. Remote Sens. 2007, 28, 823–870. [Google Scholar] [CrossRef]
- Sofia, G. Combining geomorphometry, feature extraction techniques and Earth-surface processes research: The way forward. Geomorphology 2020, 355, 107055. [Google Scholar] [CrossRef]
- Trzcinska, K.; Janowski, L.; Nowak, J.; Rucinska-Zjadacz, M.; Kruss, A.; Schneider von Deimling, J.; Pocwiardowski, P.; Tegowski, J. Spectral features of dual-frequency multibeam echosounder data for benthic habitat mapping. Mar. Geol. 2020, 427, 106239. [Google Scholar] [CrossRef]
- Podobnikar, T.; Székely, B. Towards the automated geomorphometric extraction of talus slopes in Martian landscapes. Planet Space Sci. 2015, 105, 148–158. [Google Scholar] [CrossRef]
- Kite, E.S.; Mayer, D.P.; Wilson, S.A.; Davis, J.M.; Lucas, A.S.; de Quay, G.S. Persistence of intense, climate-driven runoff late in Mars history. Sci. Adv. 2019, 5, eaav7710. [Google Scholar] [CrossRef]
- Faulk, S.P.; Mitchell, J.L.; Moon, S.; Lora, J.M. Regional patterns of extreme precipitation on Titan consistent with observed alluvial fan distribution. Nat. Geosci. 2017, 10, 827–831. [Google Scholar] [CrossRef]
- Sankaran, R.; Sobhi, N.; Al Jabri, K. Mapping and accuracy assessment of siltation of recharge dams using remote sensing technique. Sci. Rep. 2020, 10, 10364. [Google Scholar]
- Breiman, L. Random Forests. Mach. Learn. 2001, 45, 5–32. [Google Scholar] [CrossRef]
- Cortes, C.; Vapnik, V. Support-vector networks. Mach. Learn. 1995, 20, 273–297. [Google Scholar] [CrossRef]
- Babič, M.; Mihelič, J.; Calì, M. Complex network characterization using graph theory and fractal geometry: The case study of lung cancer DNA sequences. Appl. Sci. 2020, 10, 3037. [Google Scholar] [CrossRef]
- Babič, M.; Marina, N.; Mrvar, A.; Dookhitram, K.; Cali, M. A New Method for Biostatistical miRNA Pattern Recognition with Topological Properties of Visibility Graphs in 3D Space. J. Healthc. Eng. 2019, 2019, 1–10. [Google Scholar] [CrossRef] [PubMed]
- Babič, M.; Calì, M.; Nazarenko, I.; Fragassa, C.; Ekinovic, S.; Mihaliková, M.; Janjic, M.; Belič, I. Surface roughness evaluation in hardened materials by pattern recognition using network theory. Int. J. Interact. Des. Manuf. (IJIDeM) 2019, 13, 211–219. [Google Scholar] [CrossRef]
- Babič, M.; Miliaresis, G.; Sodnik, J.; Mikoš, M.; Ambu, R.; Calì, M. New method for estimating fractal dimension in 3D space and its application to complex surfaces. Int. J. Adv. Sci. Eng. Inf. Technol. 2019, 9, 2154–2159. [Google Scholar] [CrossRef]
- Char, D.S.; Shah, N.H.; Magnus, D. Implementing Machine Learning in Health Care—Addressing Ethical Challenges. N. Engl. J. Med. 2018, 378, 981–983. [Google Scholar] [CrossRef]
- Tutte, W.T. Graph Theory; Cambridge University Press: Cambridge, UK, 2001; 333p. [Google Scholar]
- Ravi, V.; Naveen, N.; Pandey, M. Hybrid classification and regression models via particle swarm optimization auto associative neural network based nonlinear PCA. Int. J. Hybrid Intell. Syst. 2013, 10, 137–149. [Google Scholar] [CrossRef]
- Četina, M.; Rajar, R.; Hojnik, T.; Zakrajšek, M.; Krzyk, M.; Mikoš, M. Case study: Numerical simulations of debris flow below Stože, Slovenia. J. Hydraul. Eng. 2006, 132, 121–130. [Google Scholar] [CrossRef]
- Mikoš, M.; Fazarinc, R.; Majes, B.; Rajar, R.; Žagar, D.; Krzyk, M.; Hojnik, T.; Četina, M. Numerical Simulation of Debris Flows Triggered from the Strug Rock Fall Source Area, W Slovenia. Nat. Hazards Earth Syst. 2006, 6, 261–270. [Google Scholar] [CrossRef]
- Sodnik, J.; Mikoš, M. Estimation of magnitudes of debris flows in selected torrential watersheds in Slovenia = Ocena magnitud drobirskih tokov v izbranih hudourniških območjih v Sloveniji. Acta Geogr. Slov. 2006, 46, 93–123. [Google Scholar] [CrossRef]
- Bavec, M.; Tulaczyk, S.M.; Mahan, S.A.; Stock, G.M. Late Quaternary glaciation of the Upper Soča River Region (Southern Julian Alps, NW Slovenia). Sediment Geol. 2004, 165, 265–283. [Google Scholar] [CrossRef]
- Bavec, M.; Budkovič, T.; Komac, M. Geohazard—Geološko pogojena navarnost zaradi procesov pobočnega premikanja. Primer občine Bovec = Estimation of geohazard included by mass movement processes. The Bovec municipality case study. Geologija 2005, 48, 303–310. [Google Scholar] [CrossRef]
- Mikoš, M.; Bavec, M.; Budkovič, T.; Durjava, D.; Hribernik, K.; Jež, J.; Klabus, A.; Komac, M.; Krivic, M.; Kumelj, Š.; et al. Ocena Ogroženosti Zaradi Delovanja Drobirskih Tokov: Končno Poročilo; UL FGG, Ljubljana & Geološki Zavod Slovenije: Ljubljana, Slovenia, 2008; Available online: http://www.sos112.si/slo/tdocs/naloga_76.pdf (accessed on 20 December 2019).
- Jež, J.; Mikoš, M.; Trajanova, M.; Kumelj, Š.; Budkovič, T.; Bavec, M. Vršaj Koroška Bela—Rezultat katastrofičnih pobočnih dogodkov = Koroška Bela alluvial fan—The result of the catastrophic slope events (Karavanke Mountains, NW Slovenia). Geologija 2008, 51/2, 219–227. [Google Scholar] [CrossRef]
- Peternel, T.; Kumelj, Š.; Oštir, K.; Komac, M. Monitoring the Potoška planina landslide (NW Slovenia) using UAV photogrammetry and tachymetric measurements. Landslides 2016, 14, 395–406. [Google Scholar] [CrossRef]
- Jelen, B.; Marton, E.; Fodor, L.; Baldi, M.; Čar, J.; Rifelj, H.; Skaberne, D.; Vrabec, M. Paleomagnetic, Tectonic and Stratigraphic Correlation of Tertiary Formations in Slovenia and Hungary along the Periadriatic and Mid-Hungarian Tectonic Zone (Preliminary Communication). Geologija 1997, 40, 325–331. [Google Scholar] [CrossRef]
- Trauner, L.; Dolinar, B.; Mišič, M. Relationship between the undrained shear strength, water content, and mineralogical properties of fine-grained soils. Int. J. Geomech. 2005, 5, 350–355. [Google Scholar] [CrossRef]
- Dolinar, B.; Mišič, M.; Trauner, L. Correlation between surface area and Atterberg Limits of fine-grained soils. Clay Clay Miner 2007, 55, 519–523. [Google Scholar] [CrossRef]
- Mišič, M. Atlas Izračunanih Difraktogramov, SLJUDE, Lojevec, Pirofilit = Atlas of Calculated Diffractograms, Micas, Pyrophyllite, Talc; Geological Survey of Slovenia & ZRC Publishing: Ljubljana, Slovenia, 2009; 105p, ISBN 978-961-254-173-6. [Google Scholar]
- Komac, M.; Kumelj, Š.; Ribičič, M. Model dovzetnosti za pojavljanje drobirskih tokov v Sloveniji v merilu 1:250.000. Geologija 2009, 52, 87–104. [Google Scholar] [CrossRef]
- Millaresis, G.C.; Argialas, D.P. Extraction and Delineation of Alluvial Fans from Digital Elevation Models and Landsat Thematic Mapper Images. Photogramm. Eng. Remote Sens. 2000, 66, 1093–1101. [Google Scholar]
- Argialas, D.P.; Tzotsos, A. Automatic Extraction of Aluvial Fans from Aster L1 Satellite Data and a Digital Elevation Model using Object-Oriented Image. ISPRS Congr. 2004, 35, 6. [Google Scholar]
- Zhang, H.; Lü, Y. Geomorphometric Features of the Alluvial Fans around the Chaka-Qinghai Lake in the Northeastern Tibetan Plateau. J. Earth Sci. 2014, 25, 109–116. [Google Scholar] [CrossRef]
- Frattini, P.; Crosta, G.B.; Agliardi, F.; Imposimanto, S. Challenging Calibration in 3D Rockfall Modelling. In Landslide Science and Practice: Volume 3: Spatial Analysis and Modelling; Margottini, C., Canuti, P., Sassa, K., Eds.; Springer: Berlin/Heidelberg, Germany, 2013; pp. 169–176. [Google Scholar] [CrossRef]
- Marchi, L.; Fontana, G.D. GIS morphometric indicators for the analysis of sediment dynamics in mountain basins. Environ. Geol. 2005, 48, 218–228. [Google Scholar] [CrossRef]
- Painsky, A.; Rosset, S. Lossless Compression of Random Forests. J. Comput. Sci. Technol. 2019, 34, 494–506. [Google Scholar] [CrossRef]
- Wenzel, F.; Galy-Fajou, T.; Deutsch, M.; Kloft, M. Bayesian Nonlinear Support Vector Machines for Big Data. In Machine Learning and Knowledge Discovery in Databases, (ECML PKDD); Ceci, M., Hollmén, J., Todorovski, L., Vens, C., Džeroski, S., Eds.; Springer International Publishing: New York, NY, USA, 2017. [Google Scholar] [CrossRef]
- Kovačič, M.; Dolenc, F. Prediction of the natural gas consumption in chemical processing facilities with genetic programming. Genet. Program. Evol. Mach. 2016, 17, 231–249. [Google Scholar] [CrossRef]
- Ojha, V.K.; Abraham, A.; Snášel, V. Metaheuristic design of feedforward neural networks: A review of two decades of research. Eng. Appl. Artif. Intel. 2017, 60, 97–116. [Google Scholar] [CrossRef]
- Bertrand, M.; Liébault, F.; Piégay, H. Debris-flow susceptibility of small upland catchments. Nat. Hazards 2013, 67, 497–511. [Google Scholar] [CrossRef]
- Bolch, T.; Buchroithner, M.F.; Kunert, A.; Kamp, U. Automated delineation of debris-covered glaciers based on ASTER data. In GeoInformation in Europe: Proceedings of the 27th Symposium of the European Association of Remote Sensing Laboratories (EARSeL), Bolzano/Bozen, Italy, 4–7 June 2007; Gomarasca, M.A., Ed.; Millpress: Amsterdam, The Netherlands, 2007; pp. 403–410. [Google Scholar]
- Chou, Y.H. Exploring Spatial Analysis in Geographic Information Systems; On-Word Press: Santa Fe, NM, USA, 1997; 478p. [Google Scholar]
- Kanevski, M.; Maignan, M. Analysis and Modelling of Spatial Environmental Data; EPFL Press: Lausanne, Switzerland, 2004; 288p. [Google Scholar]


Publisher’s Note: MDPI stays neutral with regard to jurisdictional claims in published maps and institutional affiliations. |
© 2021 by the authors. Licensee MDPI, Basel, Switzerland. This article is an open access article distributed under the terms and conditions of the Creative Commons Attribution (CC BY) license (https://creativecommons.org/licenses/by/4.0/).