Article

Forest 3D Reconstruction and Individual Tree Parameter Extraction Combining Close-Range Photo Enhancement and Feature Matching

1
Beijing Key Laboratory of Precision Forestry, Forestry College, Beijing Forestry University, Beijing 100083, China
2
Key Laboratory of Forest Cultivation and Protection, Ministry of Education, Beijing Forestry University, Beijing 100083, China
3
China Centre for Resources Satellite Data and Application, Beijing 100083, China
*
Author to whom correspondence should be addressed.
Ruoning Zhu and Zhengqi Guo contribute the same.
Remote Sens. 2021, 13(9), 1633; https://doi.org/10.3390/rs13091633
Submission received: 14 March 2021 / Revised: 18 April 2021 / Accepted: 20 April 2021 / Published: 22 April 2021
(This article belongs to the Special Issue Advances in Remote Sensing for 3D Plant Modelling)

Abstract

:
An efficient and accurate forest sample plot survey is of great significance to understand the current status of forest resources at the stand or regional scale and the basis of scientific forest management. Close-range photogrammetry (CRP) technology can easily and quickly collect sequence images with high overlapping to reconstruct the 3D model of forest scenes and extract the individual tree parameters automatically and, therefore, can greatly improve the efficiency of forest investigation and has great application potential in forestry visualization management. However, it has some issues in practical forestry applications. First, the imaging quality is affected by the illumination in the forest, resulting in difficulty in feature matching and low accuracy of parameter extraction. Second, the efficiency of 3D forest model reconstruction is limited under complex understory vegetation or the topographic situation in the forest. In addition, the density of point clouds by dense matching directly affects the accuracy of individual tree parameter extraction. This research collected the sequence images of sample plots of four tree species by smartphones in Gaofeng Forest Farm in Guangxi and Wangyedian Forest Farm in Mongolia to analyze the effects of image enhancement, feature detection and dense point cloud algorithms on the efficiency of 3D forest reconstruction and accuracy of individual tree parameter extraction, then proposed a strategy of 3D reconstruction and parameter extraction suitable for different forest scenes. First, we compared the image enhancement effects of median–Gaussian (MG) filtering, single-scale retinex (SSR) and multi-scale retinex (MSR) filtering algorithms. Then, an improved algorithm combining Harris corner detection with speeded-up robust features (SURF) feature detection (Harris+SURF) is proposed, and the feature matching effect is compared with that of a scale invariant feature transform (SIFT) operator. Third, according to the morphological characteristics of the trees in the sequence images, we used the iterative interpolation algorithm of a planar triangulation network based on geometric constraints (GC-based IIPTN) to increase the density of point clouds and reconstruct the 3D forest model, and then extract the position and DBH of the individual trees. The results show that MSR image enhancement can significantly increase the number of matched point pairs. The improved Harris+SURF method can reduce the reconstruction time of the 3D forest model, and the GC-based IIPTN algorithm can improve the accuracy of individual tree parameter extraction. The extracted position of the individual tree is the same as the measured position with the bias within 0.2 m. The accuracy of extracted DBH of Eucalyptus grandis, Taxus chinensis, Larix gmelinii and Pinus tabuliformis is 94%, 95%, 96% and 90%, respectively, which proves that the proposed 3D model reconstruction method based on image enhancement has great potential for tree position and DBH extraction, and also provides effective support for forest resource investigation and visualization management in the future.

Graphical Abstract

1. Introduction

The forest ecosystem affects the global and regional carbon–water cycle and the stability of the climate system. Accurate investigation of forest resources is essential for forest protection as well as scientific planning and management [1]. A sample plot survey is the basis of a forest resource inventory and management planning survey. The measurement quality of the individual tree parameters directly determines the efficiency and precision of the sample plot survey and then determines the overall quality and timeliness of regional forest resource investigation. Therefore, automatic, accurate and fast acquisition of individual tree parameters can provide technical support for forest resource monitoring and scientific forest management [2]. The traditional method of acquiring individual tree parameters is measuring the parameters of each tree in the sample plot manually, and digitally recording the measurement results [3]. This method is time-consuming and laborious, and it is difficult to acquire a large quantity of data from a lot of plots in a short time. The total station is usually used for acquiring the location of trees. However, it is expensive and inconvenient to carry in the forest, which increases the difficulty of forest investigations.
Automatic individual tree parameter extraction based on the three-dimensional (3D) forest model can overcome the limitation of traditional investigation methods by transforming a lot of fieldwork into computer data processing, to improve the investigation efficiency. Additionally, it can collect sample plot data in a complex forest environment and avoids the influence of subjective human factors, and makes a permanent record of the forest available. Meanwhile, it is beneficial to realize forest management visualization and provide important technical support for forest resource dynamic monitoring and scientific management.
The technology of 3D forest model reconstruction has been developed in recent years. For example, using laser range finders and altimeters to acquire the tree position and height. However, it is inefficient and difficult to show the actual trees. Light detection and ranging (LiDAR), such as airborne laser scanning (ALS) and terrestrial laser scanning (TLS), can obtain the high-density 3D point clouds of forest scenes and build an accurate 3D model [4,5]. In particular, ALS can acquire the point clout data for large regions in a short time. However, these types of equipment are expensive and have many requirements in terms of the professional techniques of data collectors. For example, thousands of dollars are needed to lease ALS or TLS equipment. In addition, the equipment is heavy and requires more than two skilled operators, and the data acquired by ALS will miss the information under the canopy.
Close-range photogrammetry (CRP) is an approach for obtaining the 3D point cloud data from sequence images based on the principle of multi-view geometry and spatial transformation matrices [6,7,8]. CRP has the ability to match a set of images automatically, and images become a new data source of 3D point clouds [9]. At the present stage, the mainstream method of 3D reconstruction is structure from motion (SFM) [10,11], which has been exploited in many fields, such as industry, precision agriculture, geographic surveying and archeology [12]. CRP has become an emerging topic in forestry in recent years, with similar products and low cost compared with TLS [13,14]. Additionally, CRP has the ability of fast field measurement and processing data with high efficiency, and has good potential in the field of precision forestry [15,16,17]. More research has proposed methods for tree mapping and parameter extraction based on CRP, which have achieved a reasonable result [18,19,20,21].
In recent years, a wide variety of image-taking devices has been developed, and smartphones have achieved a similar ability to acquire high-quality images like digital cameras. The sequence images acquired by smartphones can perform the image-based 3D reconstruction of the scene [22,23,24,25]. Compared with TLS, smartphones are relatively inexpensive, small and portable, which can greatly improve the efficiency of data collection. In addition, compared with an industrial camera, the aperture and focal length of a smartphone camera can be set automatically, and the pixel resolution of the camera of the smartphone is higher, which provide higher efficiency in data collection using smartphones. Furthermore, smartphones have been widely used around the world and make it possible for ordinary people to acquire 3D point data. However, the following issues restrict their application in complex terrain. On one hand, the sample plots are located in the subtropical zone, with a large amount of understory vegetation which results in occlusion in the forest, which affects the image quality, and therefore affects the accuracy of feature matching and parameter extraction. On the other hand, the slope in the sample plot is high, and the complex topographies result in a decrease in the efficiency of 3D reconstruction. The accuracy and density of point clouds dictate the accuracy of parameter extraction. Therefore, there is a need to increase the accuracy of point cloud data.
In light of these critical issues, this study used sequence images taken by a smartphone as the main data source, combined with image enhancement algorithms and feature matching optimization algorithms to generate dense point clouds and extract parameters of an individual tree. The key research aims (1) to deal with the problems of low image quality caused by non-uniform distribution of light, compare median–Gaussian (MG) filtering, single-scale retinex (SSR) enhancement algorithms and multi-scale retinex (MSR) enhancement algorithms and then find suitable image enhancement algorithms for 3D reconstruction; (2) propose the Harris+SURF operator to reduce the total reconstruction time; (3) propose the GC-based IIPTN algorithm to increase the density of point clouds, then extract the position and diameter at breast height (DBH) of the individual trees according to the 3D reconstruction model.

2. Materials and Methods

2.1. Study Area

Four typical sample plots of different plant species in southern and northern China were selected (Figure 1). The sample plots were set as a square, with a size of 25 m × 25 m. Two of the plots are located in Gaofeng Forest Farm in Nanning City, Guangxi Province (108°31′ E, 22°58′ N) with terrain of hills and low mountains and elevation ranging from 400 to 750 m. The main tree species are Eucalyptus grandis and Taxus chinensis. The other two plots are located in Wangyedian Forest Farm in Chifeng City, Mongolia (118°09′ E, 41°21′ N) with mountainous terrain and elevation ranging from 800 to 1890 m. The main tree species are Larix gmelinii and Pinus tabuliformis.
Data collection was conducted from 2017 to 2018. The information of the sample plots is shown in Table 1. The position of each tree was measured by a total station and DBH was measured with a diameter tape, which was used for the accuracy verification of the extracted parameters.
The sequence images were acquired by a smartphone with autofocus capabilities. The camera resolution was 12 megapixels and the aperture size of the camera was 1.8. The sequence images were taken between 10:00 a.m. and 2:00 p.m. on a sunny and uncloudy day. The images were taken from a fixed point, with a distance of 0.5 m between adjacent points and 1 m away from the boundary of the sample plot. Then, we walked around the periphery of the sample plot and took three photos continuously in the perpendicular direction at each fixed point, with the overlap ratio of each image pair being over 60%. Three hundred and ninety-two photos of the Eucalyptus grandis plot and 258 photos of the Taxus chinensis plot were acquired at Gaofeng Forest Farm in late January 2018; 141 photos of the Larix gmelinii plot and 109 photos of the Pinus tabuliformis plot were acquired at Wangyedian Forest Farm in late September 2017.

2.2. Methods

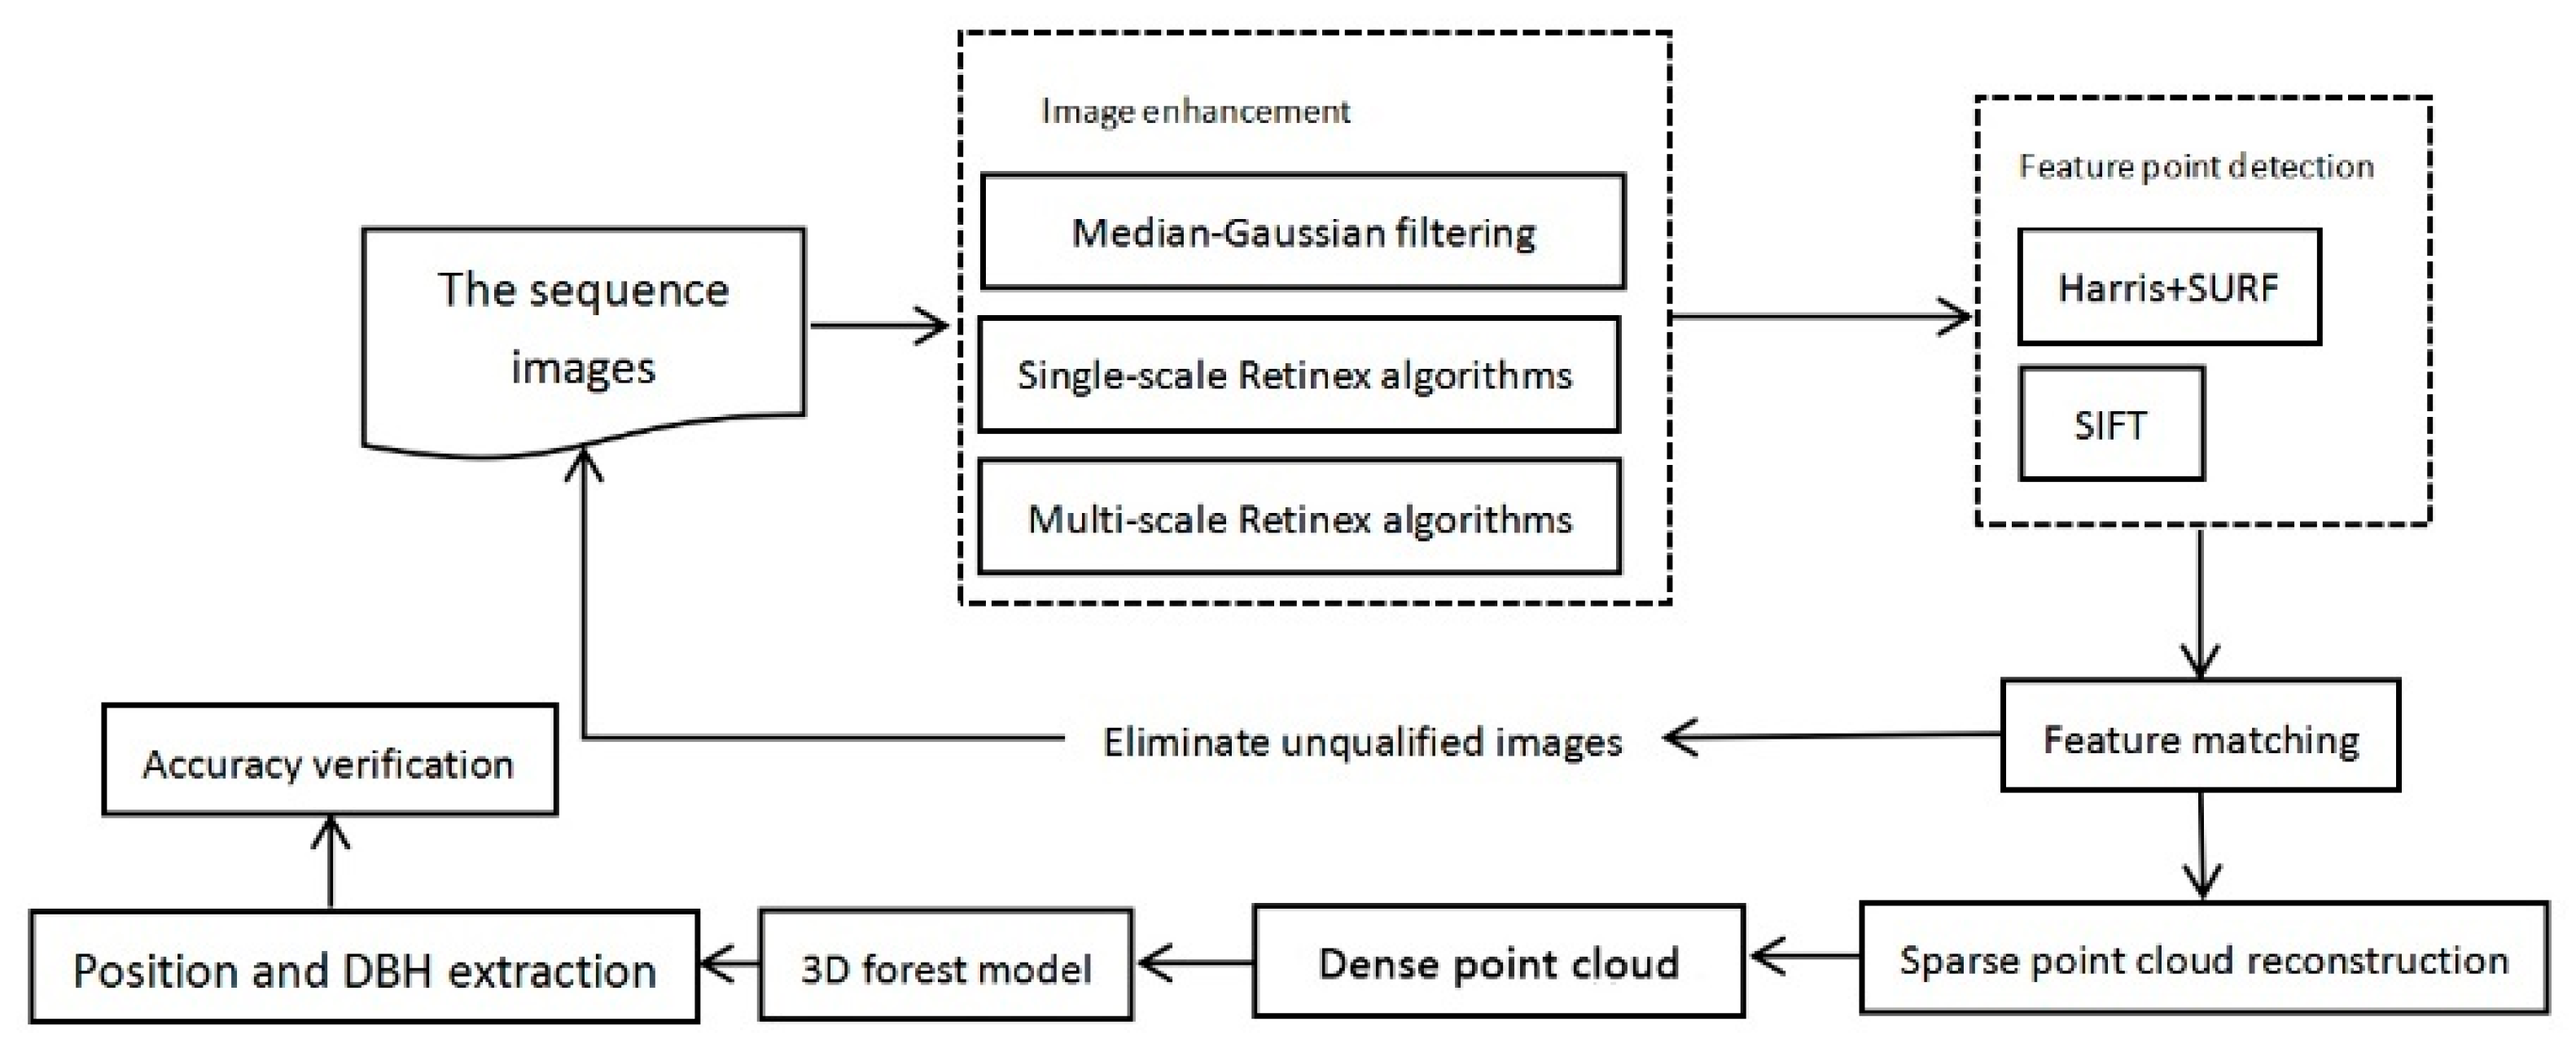
The overall method framework includes the following aspects: sequence image enhancement, feature point extraction and matching, sparse point cloud generation, dense point cloud generation, three-dimensional (3D) forest model reconstruction and individual tree parameter extraction (shown in Figure 2).

2.2.1. Image Enhancement

The occlusion and shadow in the forest results in uneven illumination of images, which then affects the image quality and reduces the accuracy of relevant information extraction. Specific findings were the localized region’s low gray value and that the objects were unclear [26]. In images, the boundary is blurred because of strong light, while weak light results in a low gray value in the local area, meaning detailed information is hidden [27,28,29]. Therefore, it is necessary to enhance the acquired sequence images before feature detection to improve the image quality. Concerning the characteristics and objectives of the features detection, we compared median filter, Gaussian filter and retinex enhancement algorithms, and identified the appropriate image enhancement method for tree feature detection in the forest scene.
1. median–Gaussian (MG) filtering
For spatial enhancement algorithms, the gray value of each pixel of the images was processed according to the pixel position [30,31,32]. As a simple and fast spatial filter, the median filter can reduce image noise and retain edge information within an image. In addition, the image details are important for accurate 3D reconstruction of the forest scene, especially if the features identified at the edge of a trunk and ground are the focus. The low branches and cluttered shrubs are the dominant sources of noise, which affect the accuracy of the reconstructed model. A Gaussian high-pass filter has the ability to enhance the edge of the trunk by highlighting the edge information and details of images, which contributes to the DBH extraction. We adapted an MG filter with a window size of 3×3, which conducted two filters (median filter and Gaussian high-pass filter) successively for removing the noise and enhancing the edge information and details of the images at the same time. We compared the results of feature detection between the enhanced image and the original image to verify the effects of different enhancement methods in 3D reconstruction.
2. Retinex algorithms
The retinex image enhancement method estimates the brightness information (L(x,y)) of the original images with a Gaussian smoothing function and then compensates uneven illumination of images [33,34,35]. The main algorithms are single-scale retinex (SSR) [36] and multi-scale retinex (MSR) [37,38,39].
Retinex is a combination of retina and cortex. The grayscale value of image I (x,y) is divided into brightness information L (x,y) and reflection information R (x,y), and is defined as:
I ( x , y ) = L ( x , y ) × R ( x , y )
This algorithm flow is shown in Figure 3.
(1) SSR model
The SSR model converted the value of each pixel from integer to logpolar domain in each color channel. The formula is:
R ( x , y ) = l o g L ( x , y ) l o g [ F ( x , y ) × I ( x , y ) ]
(2) F ( x , y ) is a surround function, which is, in general, a Gaussian function
F ( x , y ) = λ × ( x 2 + y 2 2 c 2 )
λ is the normalization constant; c is the Gaussian-scale coefficient. The greater the c and the smaller the neighbors affecting the center pixel, the smoother the image and the less detail.
(3) MSR model
The SSR model cannot achieve smoothing of the image while strengthening details. The MSR model, proposed by Jobson and Rahman [40], assigns different weights to images with different scales by scale transformation, and the final image R ( x , y ) is obtained by weighting. The formula is:
R i ( x , y ) = k = 1 k W k { l o g I i ( x , y ) l o g [ F k ( x , y ) × I i ( x , y ) ] }
k is the number of scales, F k ( x , y )   is a surround function. W k is the weight of each step which satisfies the condition k = 1 k W k = 1 .

2.2.2. 3D Model Reconstruction

1. Feature point detection
The intrinsic camera parameters were obtained from Zhang’s camera calibration algorithm [41]. The calibration algorithm can solve the problem of lens distortions by adjusting the camera’s internal parameters and external parameters, which include focal length lens, principal point, skew and distortion. The accuracy of camera calibration was assessed through checkerboard corner detection and pixel error minimization. Harris (proposed by Harris and Stephens [42]), speeded-up robust features (SURF) (proposed by Bay [43]) and scale invariant feature transform (SIFT) (proposed by Lowe [44]) were used to detect the feature points, and a combined Harris+SURF algorithm was proposed.
SIFT is an algorithm for detecting, describing and matching features. The algorithm includes scale-space construction, scale-space extrema detection and feature point descriptors. The obvious advantages are a large number of detected features, accurate description of features and a small number of mismatched points. However, the algorithm is complex and time-consuming. The SURF algorithm with the Hessian matrix on top of the SIFT algorithm, which improves the space-scale construction, has superior performance in judging the direction of features and greatly enhances the efficiency of the procedure.
The Harris algorithm uses a window with a fixed size for sliding from the center point to the neighborhood with a step of 1 pixel, then constructs an autocorrelation matrix and determines the type of region (edge, plane and corner) by comparing the eigenvalues of the Hessian matrix at each pixel. The algorithm is simple, efficient and has a reasonable number of good feature points.
In consideration of the accuracy and efficiency of the three methods discussed above, this study proposes a Harris+SURF feature detection algorithm, which first used the Harris algorithm to detect the corner points in the image, then used the SURF algorithm to extract the feature points and compared the results with the SIFT algorithm. The essence matrix was then obtained from the camera’s internal parameters and detected features. Additionally, the RANSAC algorithm was used for eliminating the matching errors and improving the matching accuracy [45,46].
2. 3D model reconstruction
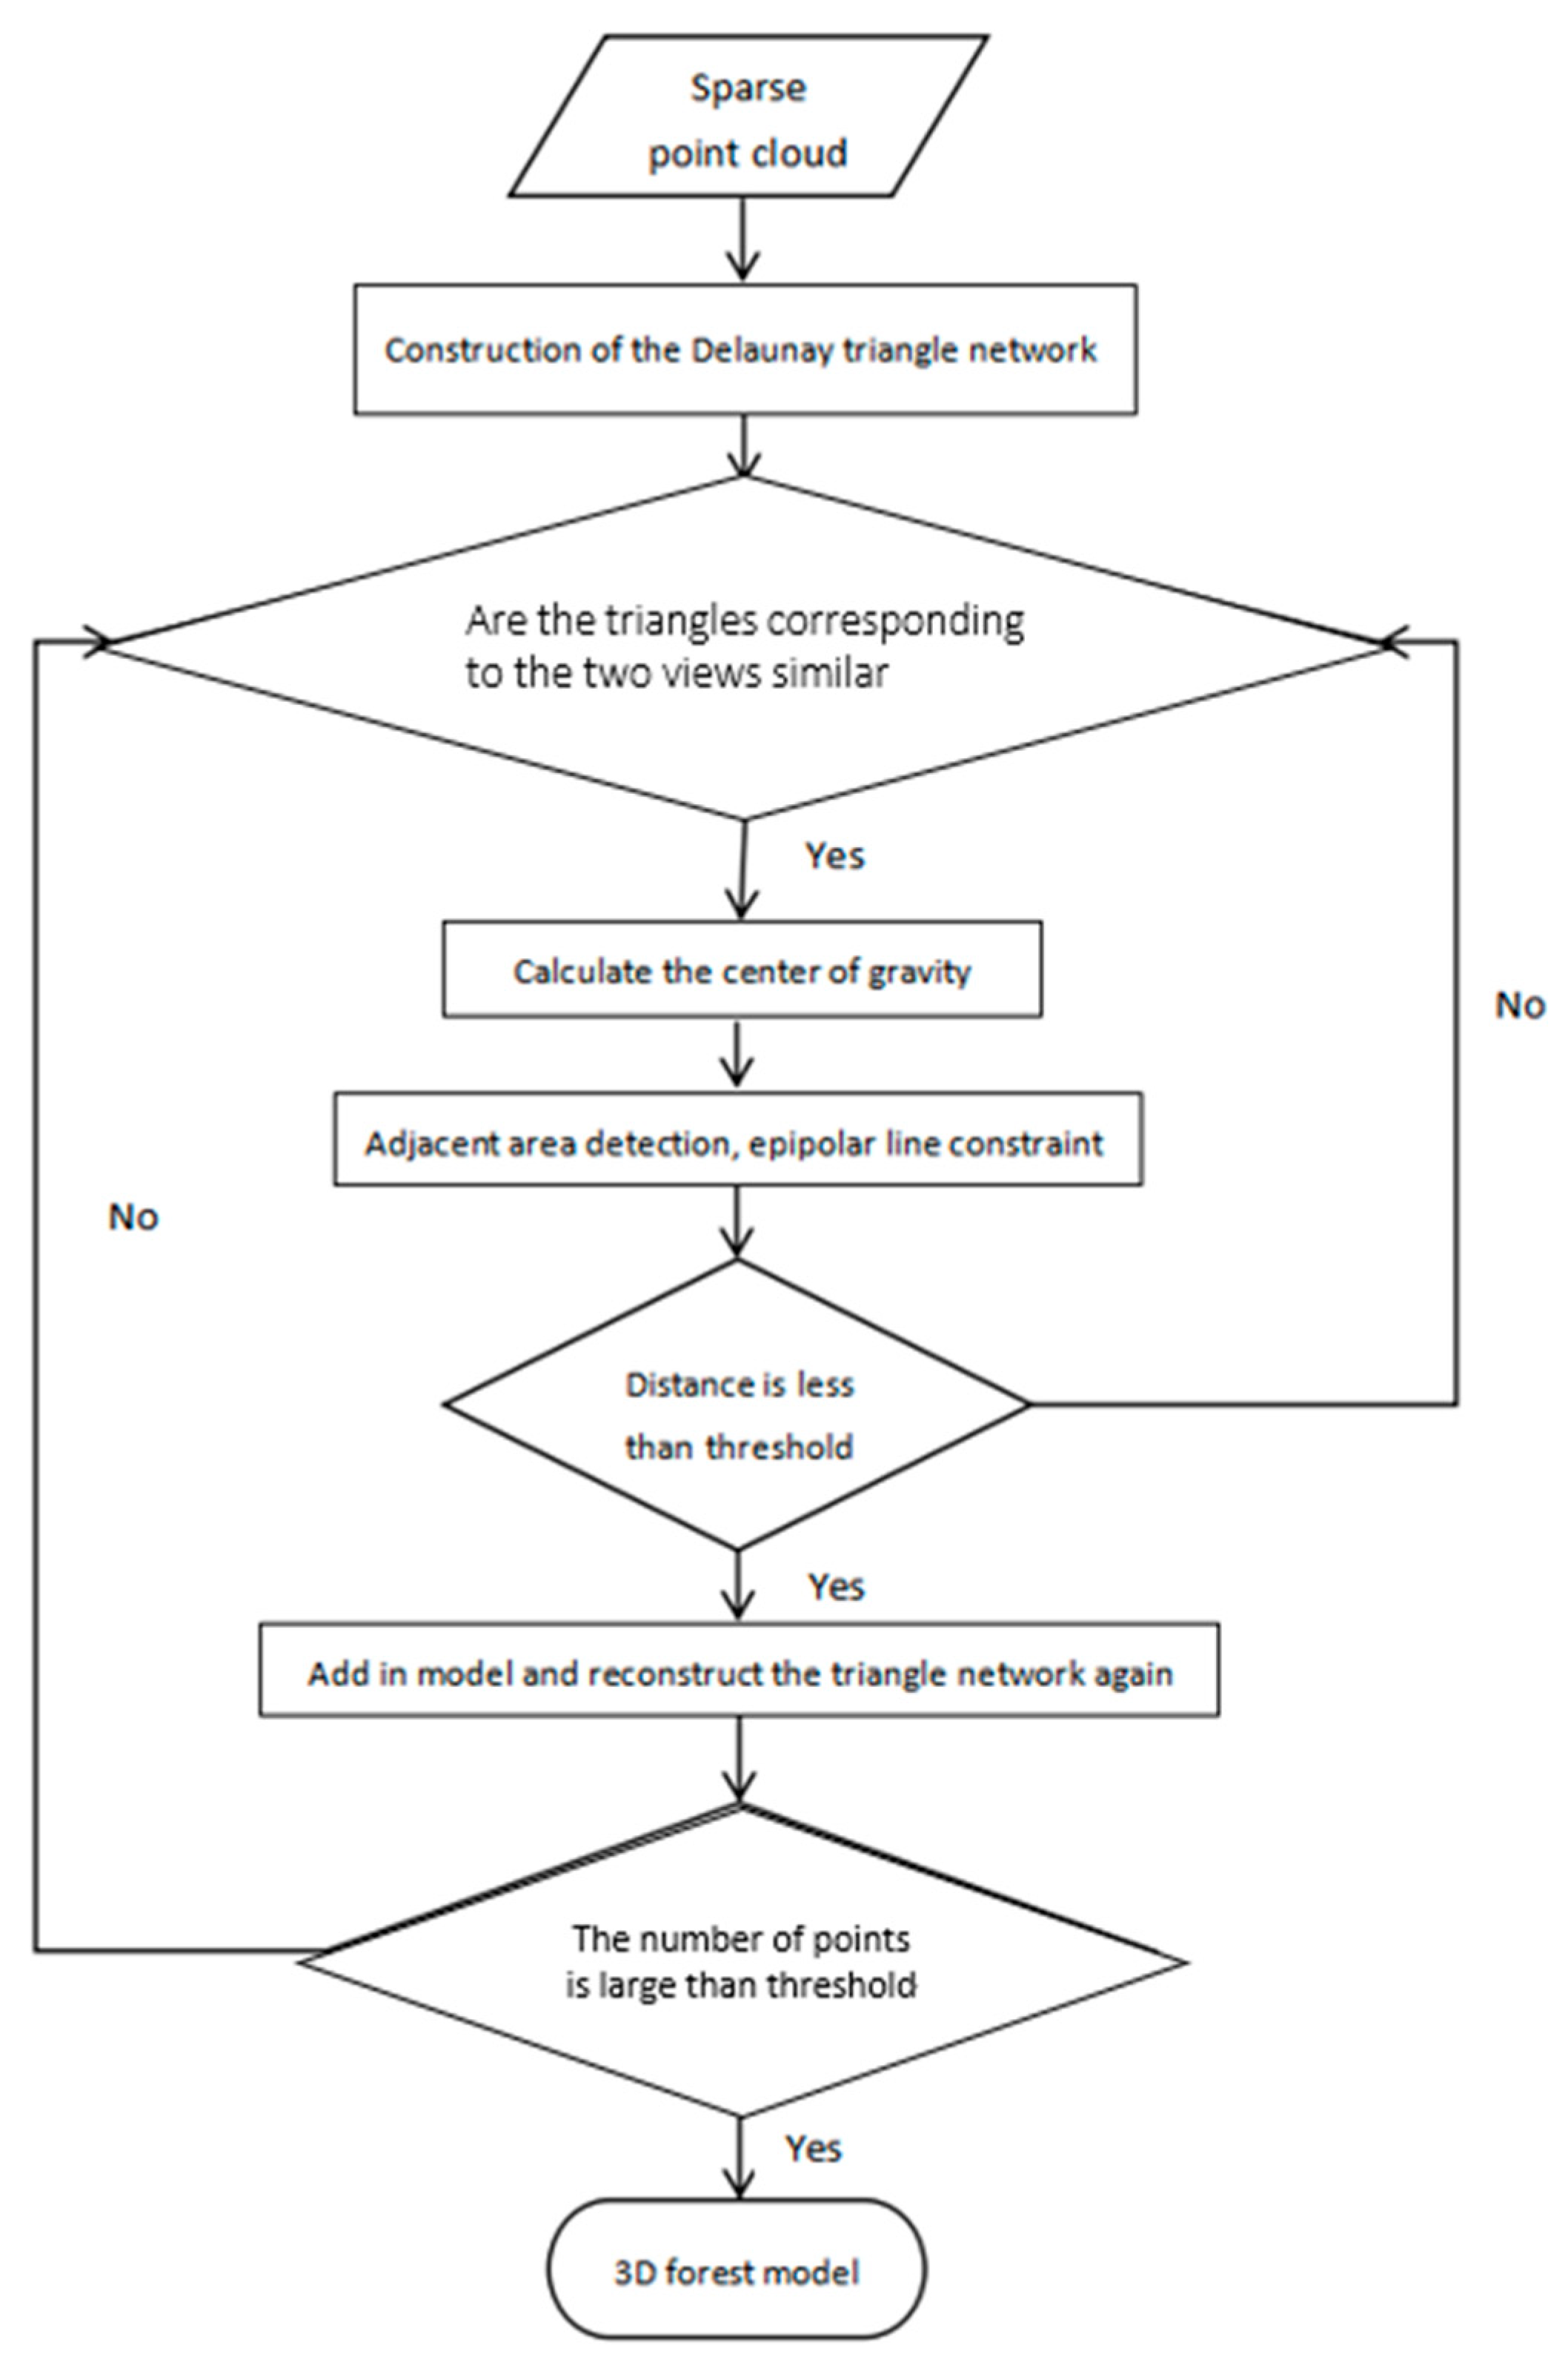
After feature point extraction and matching, the SFM algorithm is used for sparse point cloud reconstruction according to the feature points. We implement the iterative interpolation algorithm of a planar triangulation network based on geometric constraints (GC-based IIPTN algorithm) for the specific characteristics of the forest. The GC-based IIPTN algorithm can improve the density of point clouds by rescreening and adding the removed points, which is achieved by constructing Delaunay triangulations [47,48]. In this case, the center of gravity of each triangle is always inside the triangle. The feature point centered within a 5 × 5 neighborhood with an epipolar constraint principle is rescreened. This process is repeated until all triangles have been traversed. The algorithm flow is shown in Figure 4.

2.2.3. Parameter Extraction Based on 3D Forest Model

Based on the reconstructed point cloud, a normalized tree model was constructed by morphological filtering and a point-to-plane surface-fitting algorithm. The remaining non-ground points were trunk and noise. In the normalized tree model, the nonlinear least-squares method was used to obtain the center coordinates and radius of the circle at a height of 1.3 m. The center coordinates of the circle are the position of the individual tree and the DBH can be derived from the radius. The method can remove the noise while segmenting the tree accurately.

2.2.4. Accuracy Verification

The measured values acquired by the total station and diameter tape were used as reference data. The accuracy was evaluated with reconstruction rate (r), absolute precision (   P R E ) and relative error (RE). The formula is as follows:
r = n M  
where n is the number of reconstructed trees, and M is the number of trees in the plot.
R E = i = 1 n   | T e x t r a c t i o n   T t r u t h | T t r u t h n
P R E = 1 i = 1 n   | T e x t r a c t i o n   T t r u t h | T t r u t h n × 100 %
where n is the number of reconstructed trees, T e x t r a c t i o n . is the value of extracted DBH and T t r u t h is the value of measured DBH.

3. Results

3.1. Results of Different Image Enhancement Methods

The results of image enhancement by median–Gaussian (MG) filtering, single-scale retinex (SSR) and multi-scale retinex (MSR) algorithms are shown in Figure 5. The yellow line connects a pair of feature points from image pairs, the red point is the detected feature points in the left image and the green point is the corresponding points in the right image. It can be seen that the distribution of matching points is concentrated on the ground and trunks. The edges of the trunks were enhanced after MG filtering but the number of total matching points decreased while slightly increasing in the dark areas and decreasing in the bright areas with significant false matching. For the SSR algorithm, the amount of noise decreased while the number of feature points increased and was distributed more evenly and concentrated on the edges of the trunks. MSR achieved a better result that there are more feature points on the upper parts of trees in the enhanced images. Experiments were repeated using four different tree species with three methods and achieved similar results.

3.2. Results of Feature Matching

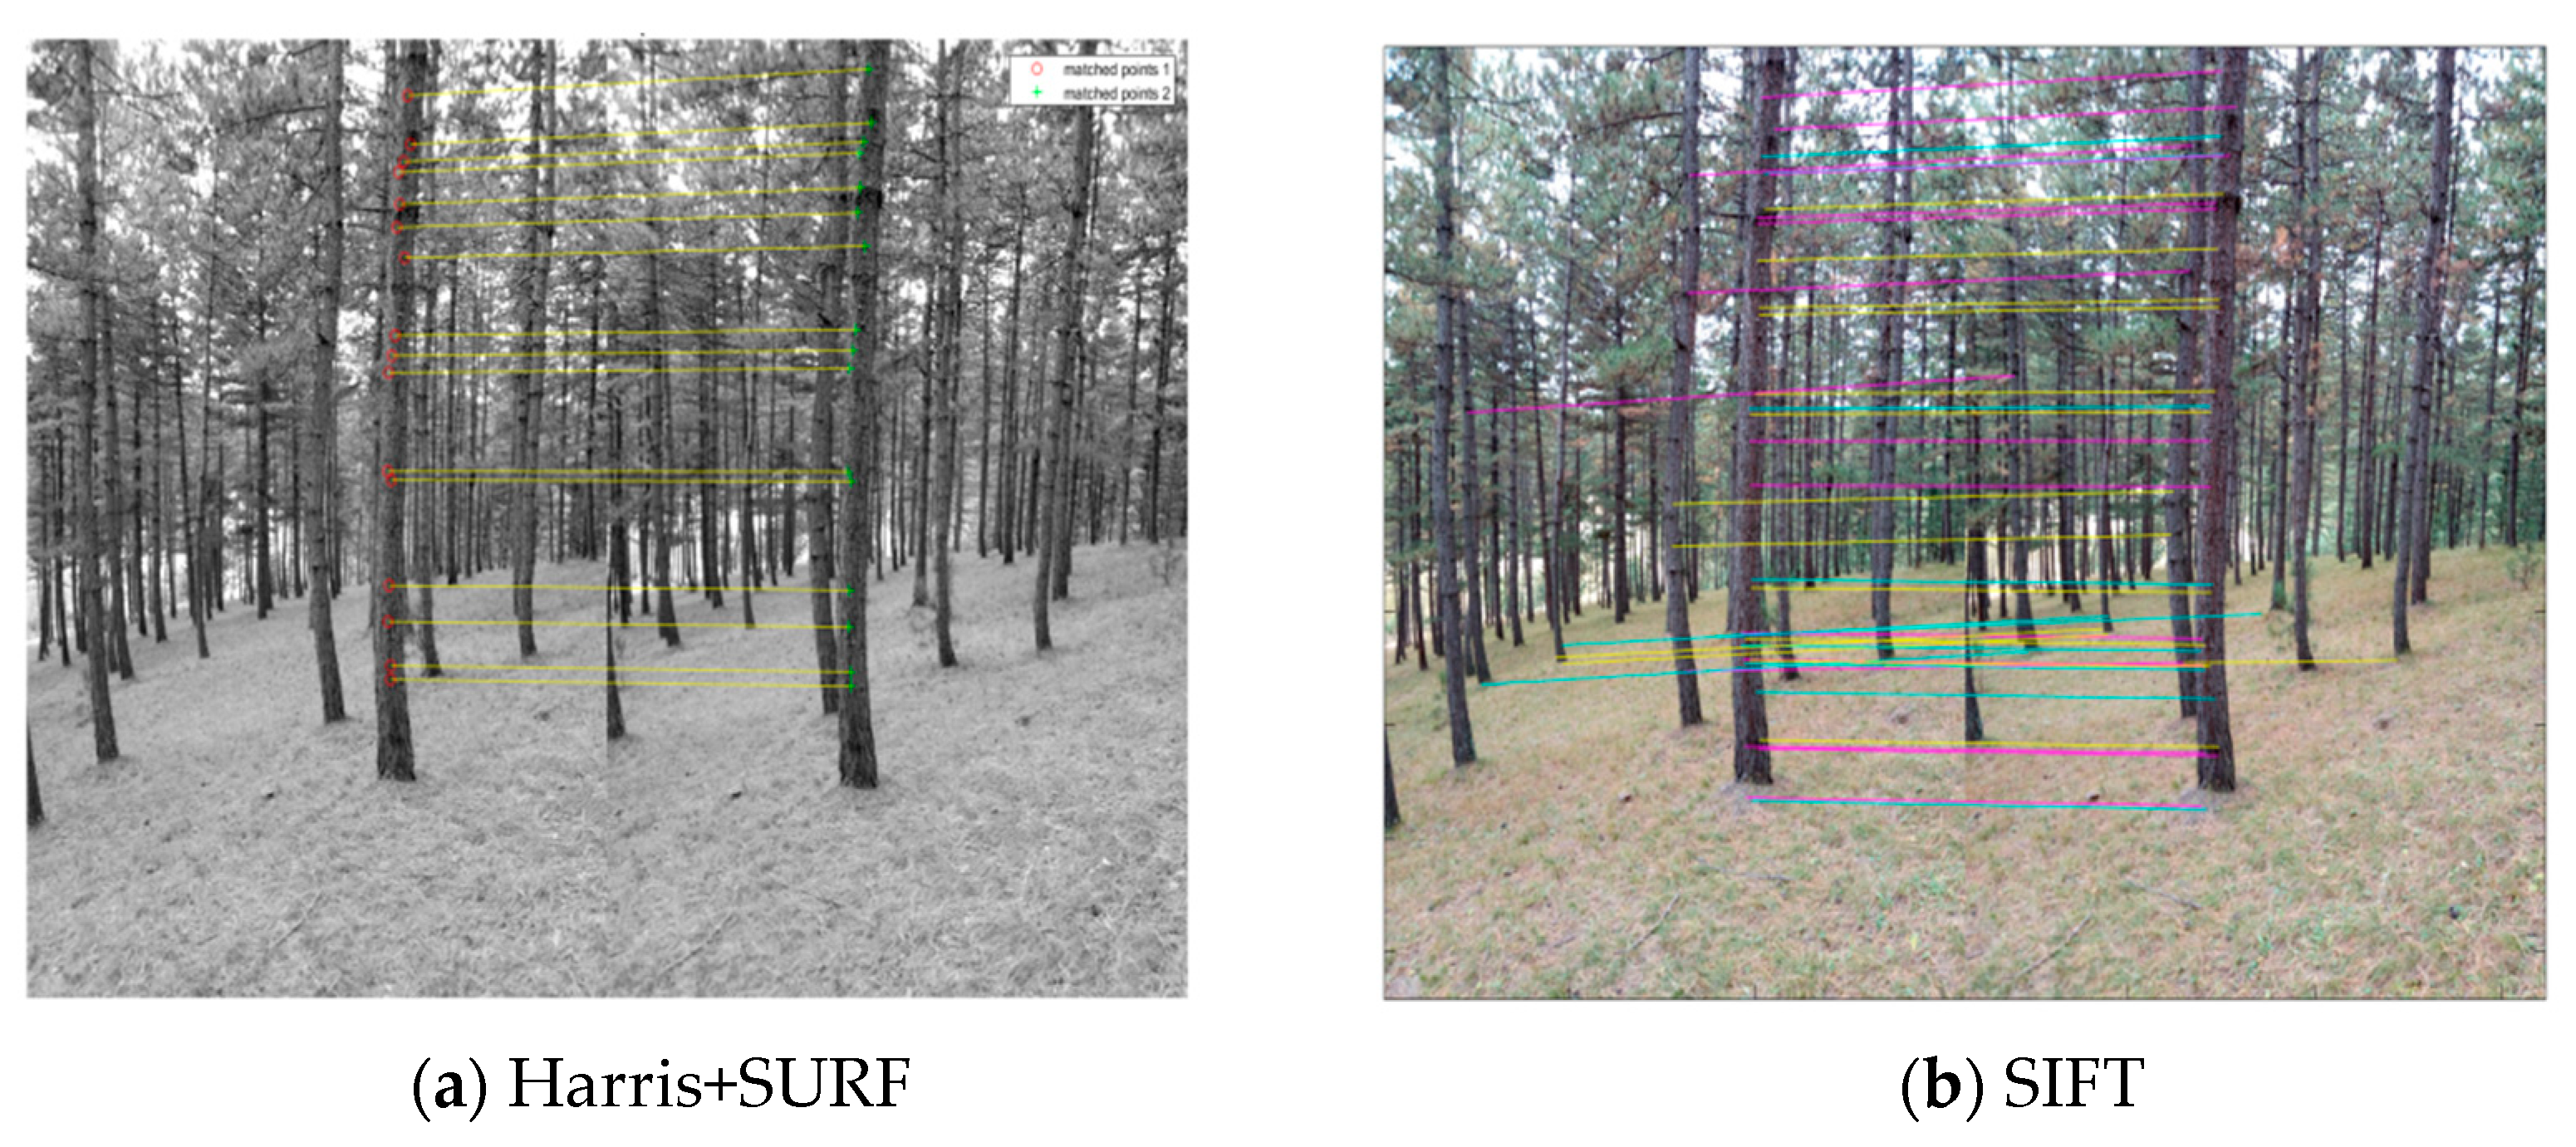
A pair of enhanced images by MSR of the Pinus tabuliformis plot was used for comparing the matching point number and processing time of different matching algorithms using MATLAB. The result is shown in Figure 6, in which the line connects a pair of feature points from image pairs, the red point and the green point are the pair of feature points. There are more feature points in Figure 6b. The different colored lines show different feature points more clearly. There are more feature points detected by the SIFT algorithm, which are mainly distributed on the trunks. However, in terms of time, the Harris+SURF algorithm takes 7 s while the algorithm takes 272 s. Therefore, the SIFT algorithm can detect more features but is time-consuming. In addition, the Harris+SURF algorithm detected less number of feature points, but the added feature points distribution concentrated at the trunks, this meets the needs of the DBH extraction. As a result, the Harris+SURF algorithm has a better fit in practical applications and can be used in reconstructing the 3D forest model.

3.3. 3D Forest Model Reconstruction Results

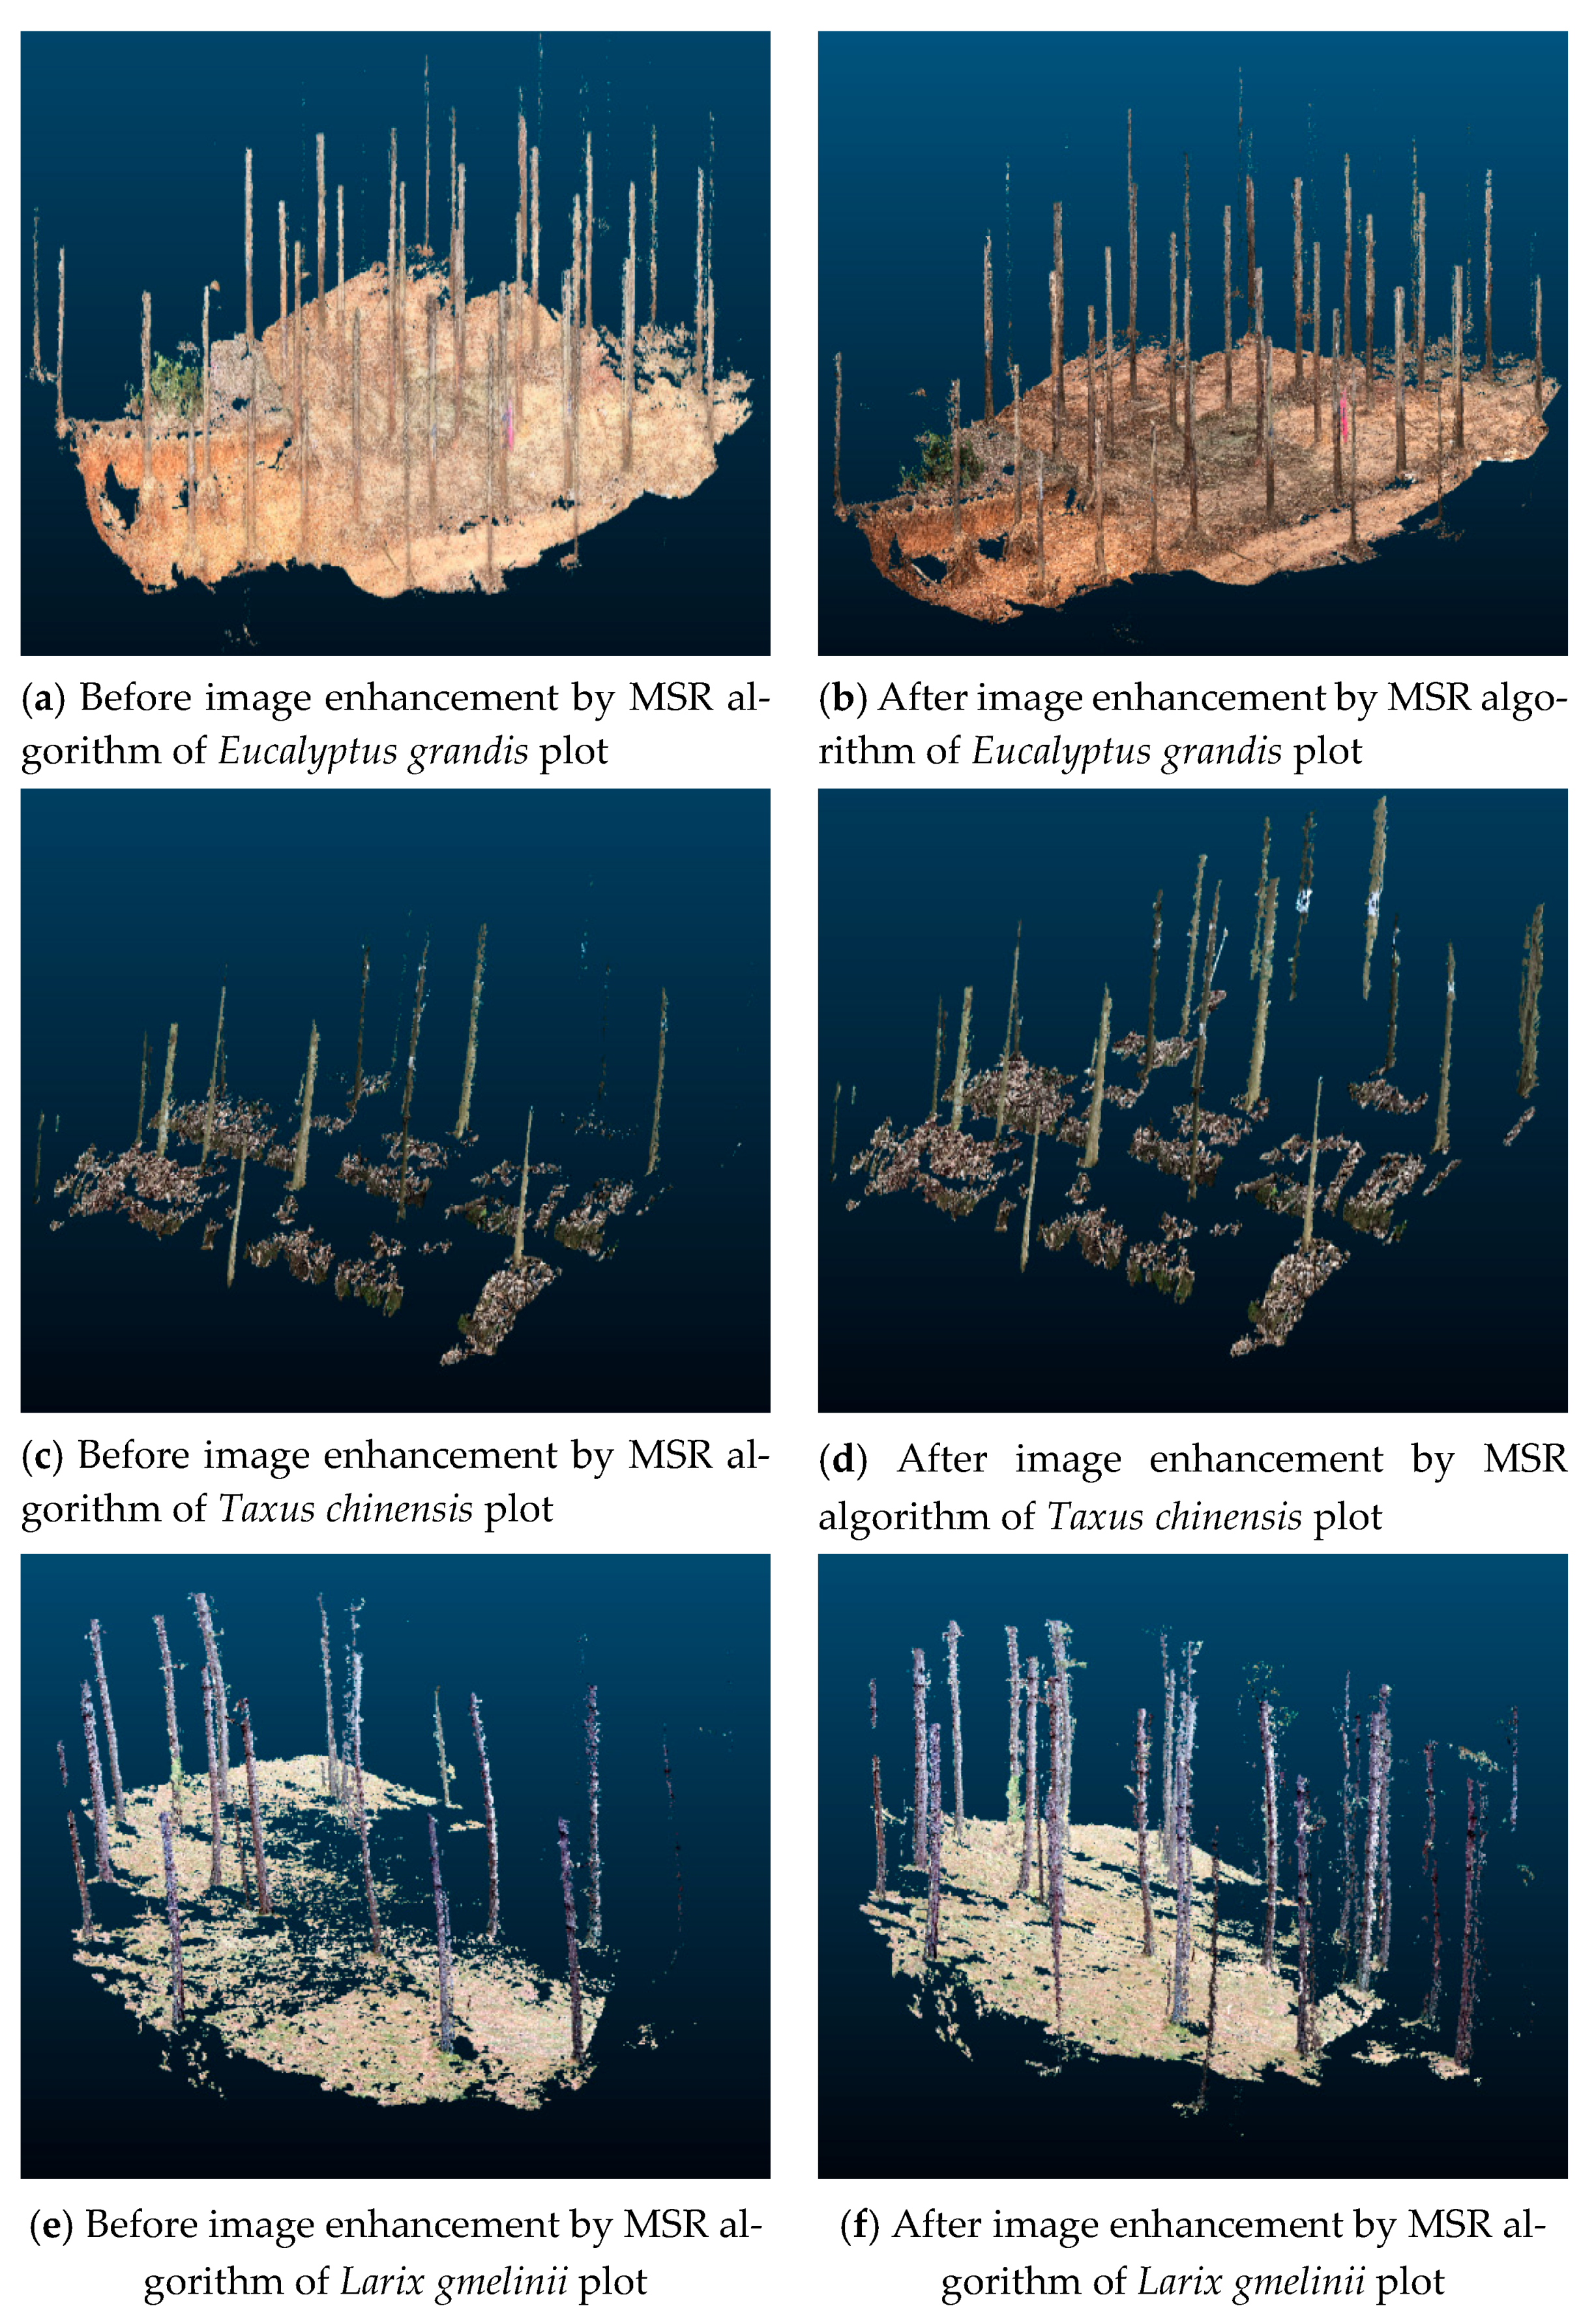
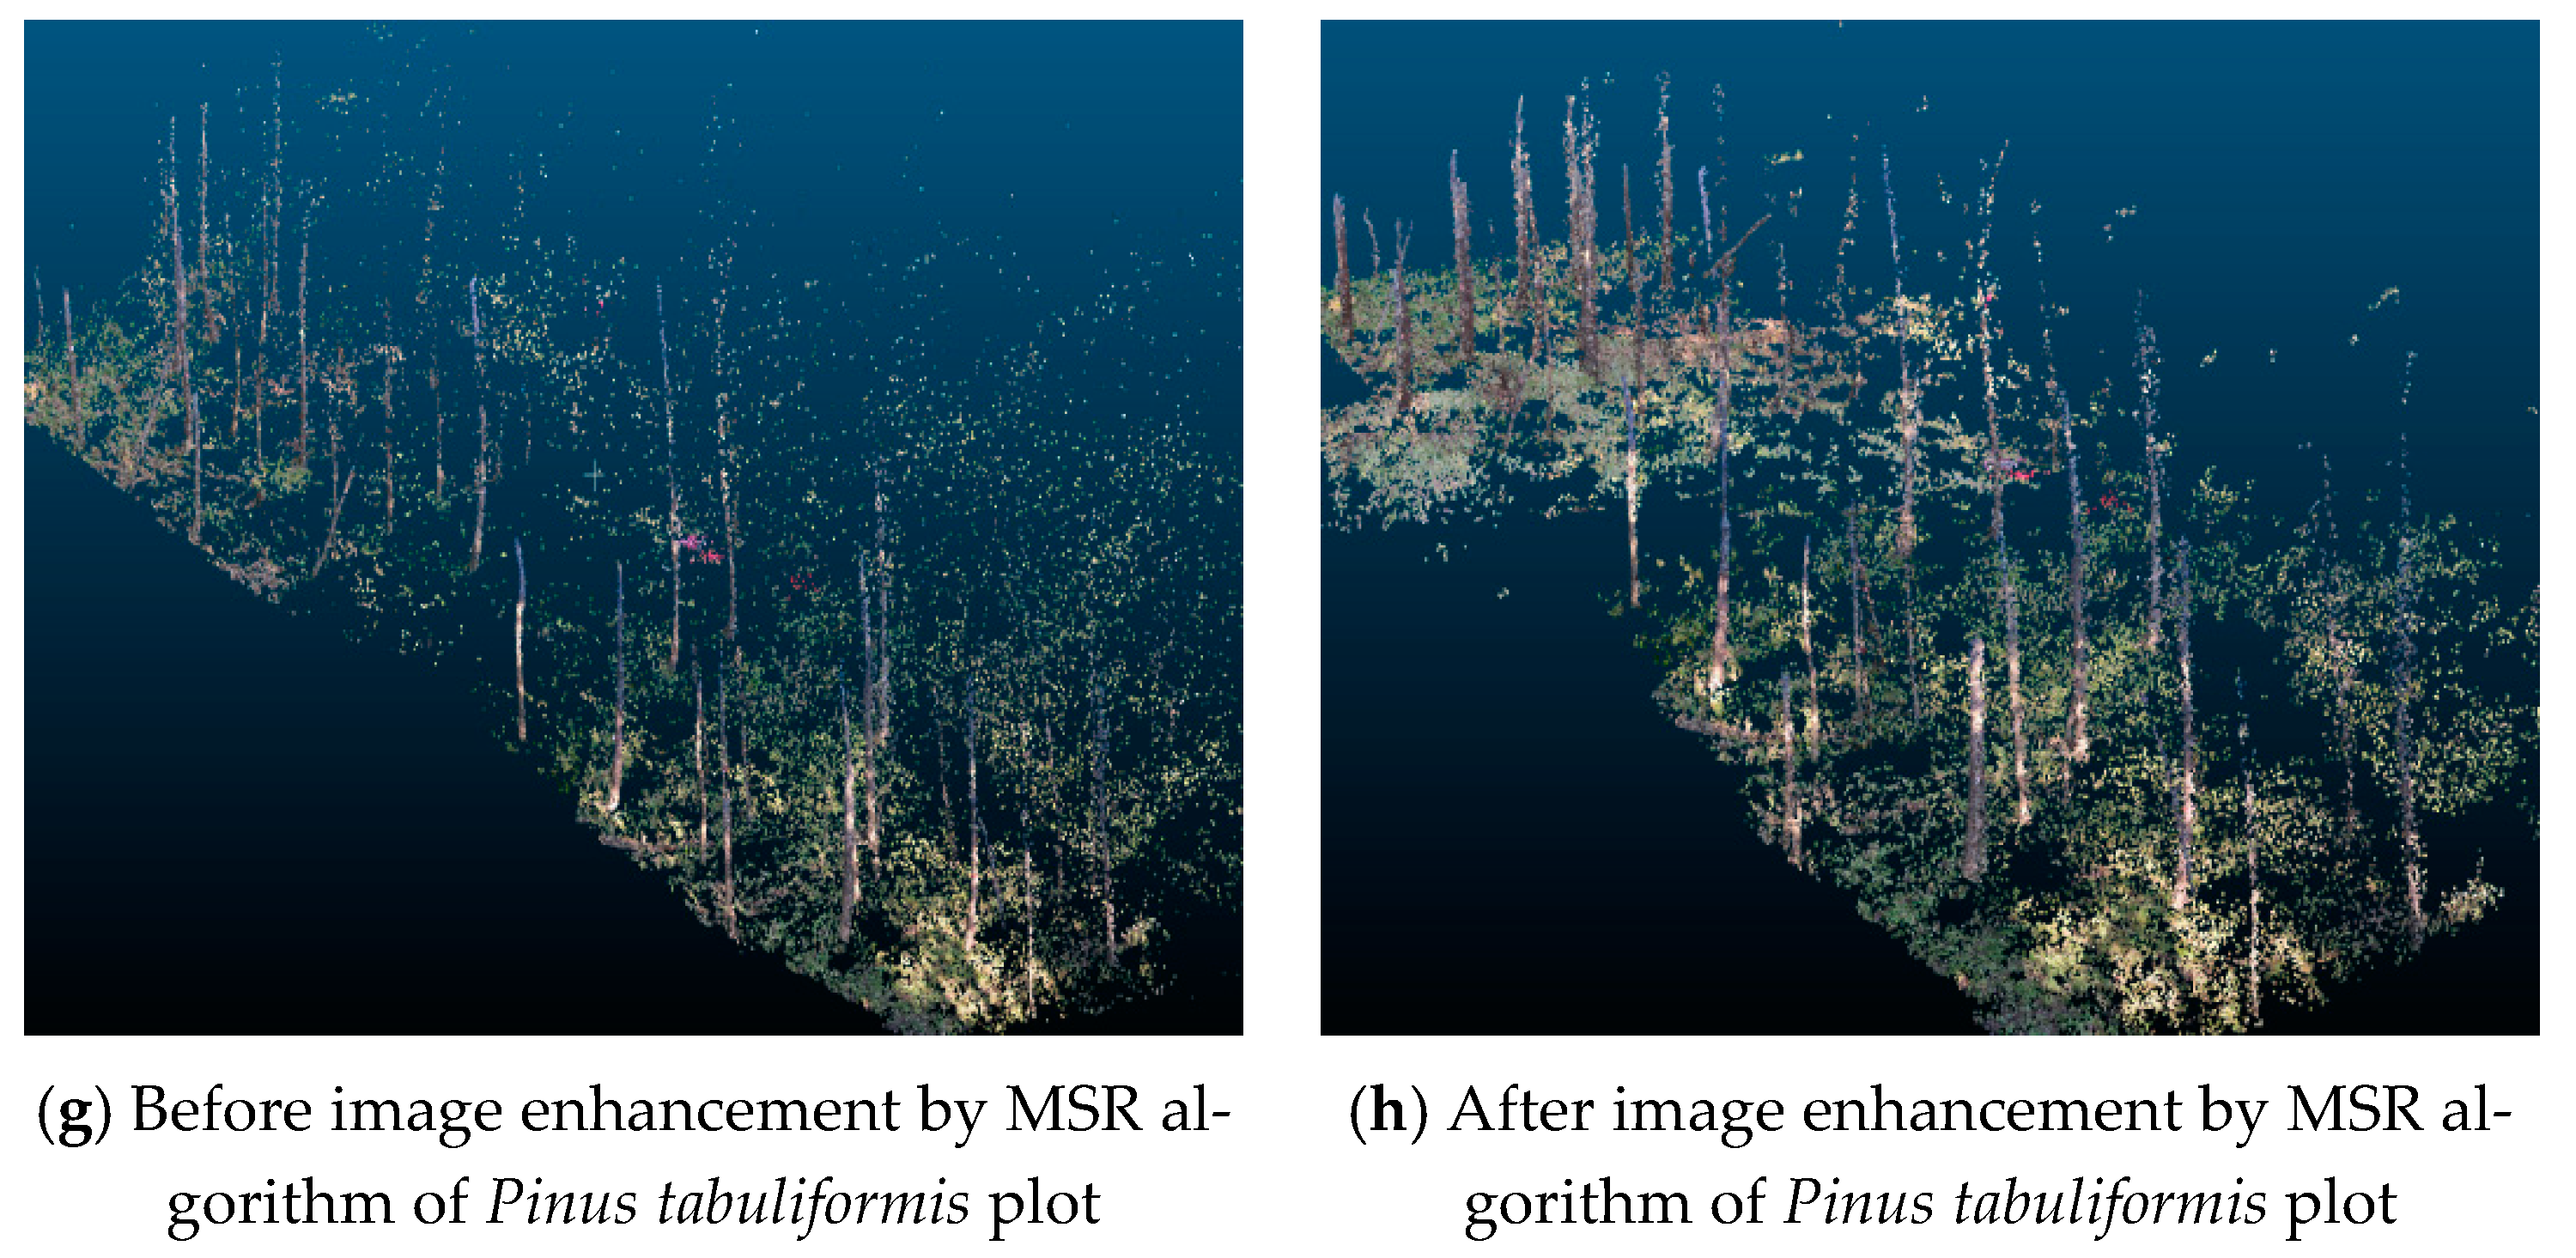
The results of 3D reconstruction using Harris+SURF feature matching and GC-based IIPTN dense point cloud algorithms with images enhanced by MSR in four plots of different tree species are shown in Figure 7 and Table 2. They show that the model has greater accuracy after image enhancement. As seen from Table 2, the accuracy improvement is not obvious before and after image enhancement in the Eucalyptus grandis plot with a flat slope, which is only 0.54%. The Taxus chinensis plot has a steeper slope, resulting in a small number of point clouds reconstruction from the original images. As a result, the number of point clouds increased by 18.47% after image enhancement. Image enhancement has a better effect on the Larix gmelinii plot and the Pinus tabuliformis plot, in which the number of point clouds increased by 25.20% and 22.85%, respectively. Therefore, the MSR algorithm has a great effect on the 3D reconstruction of Larix gmelinii and Pinus tabuliformis.

3.4. Individual Tree DBH Extraction

The extracted DBH and position of an individual tree are shown in Table 3. We can see from Table 3 that the slope is flat in the sample plot of Eucalyptus grandis and Larix gmelinii, with a good reconstruction rate of 80% and 78%, respectively. The slope is steeper in the Taxus chinensis and Pinus tabuliformis plots and the reconstruction rates are 64% and 62%, respectively. Therefore, the trees in the sample plot of Eucalyptus grandis grew tall and straight and have a high reconstruction rate. The steep slope in the sample plot of Pinus tabuliformis results in a lower reconstruction rate.
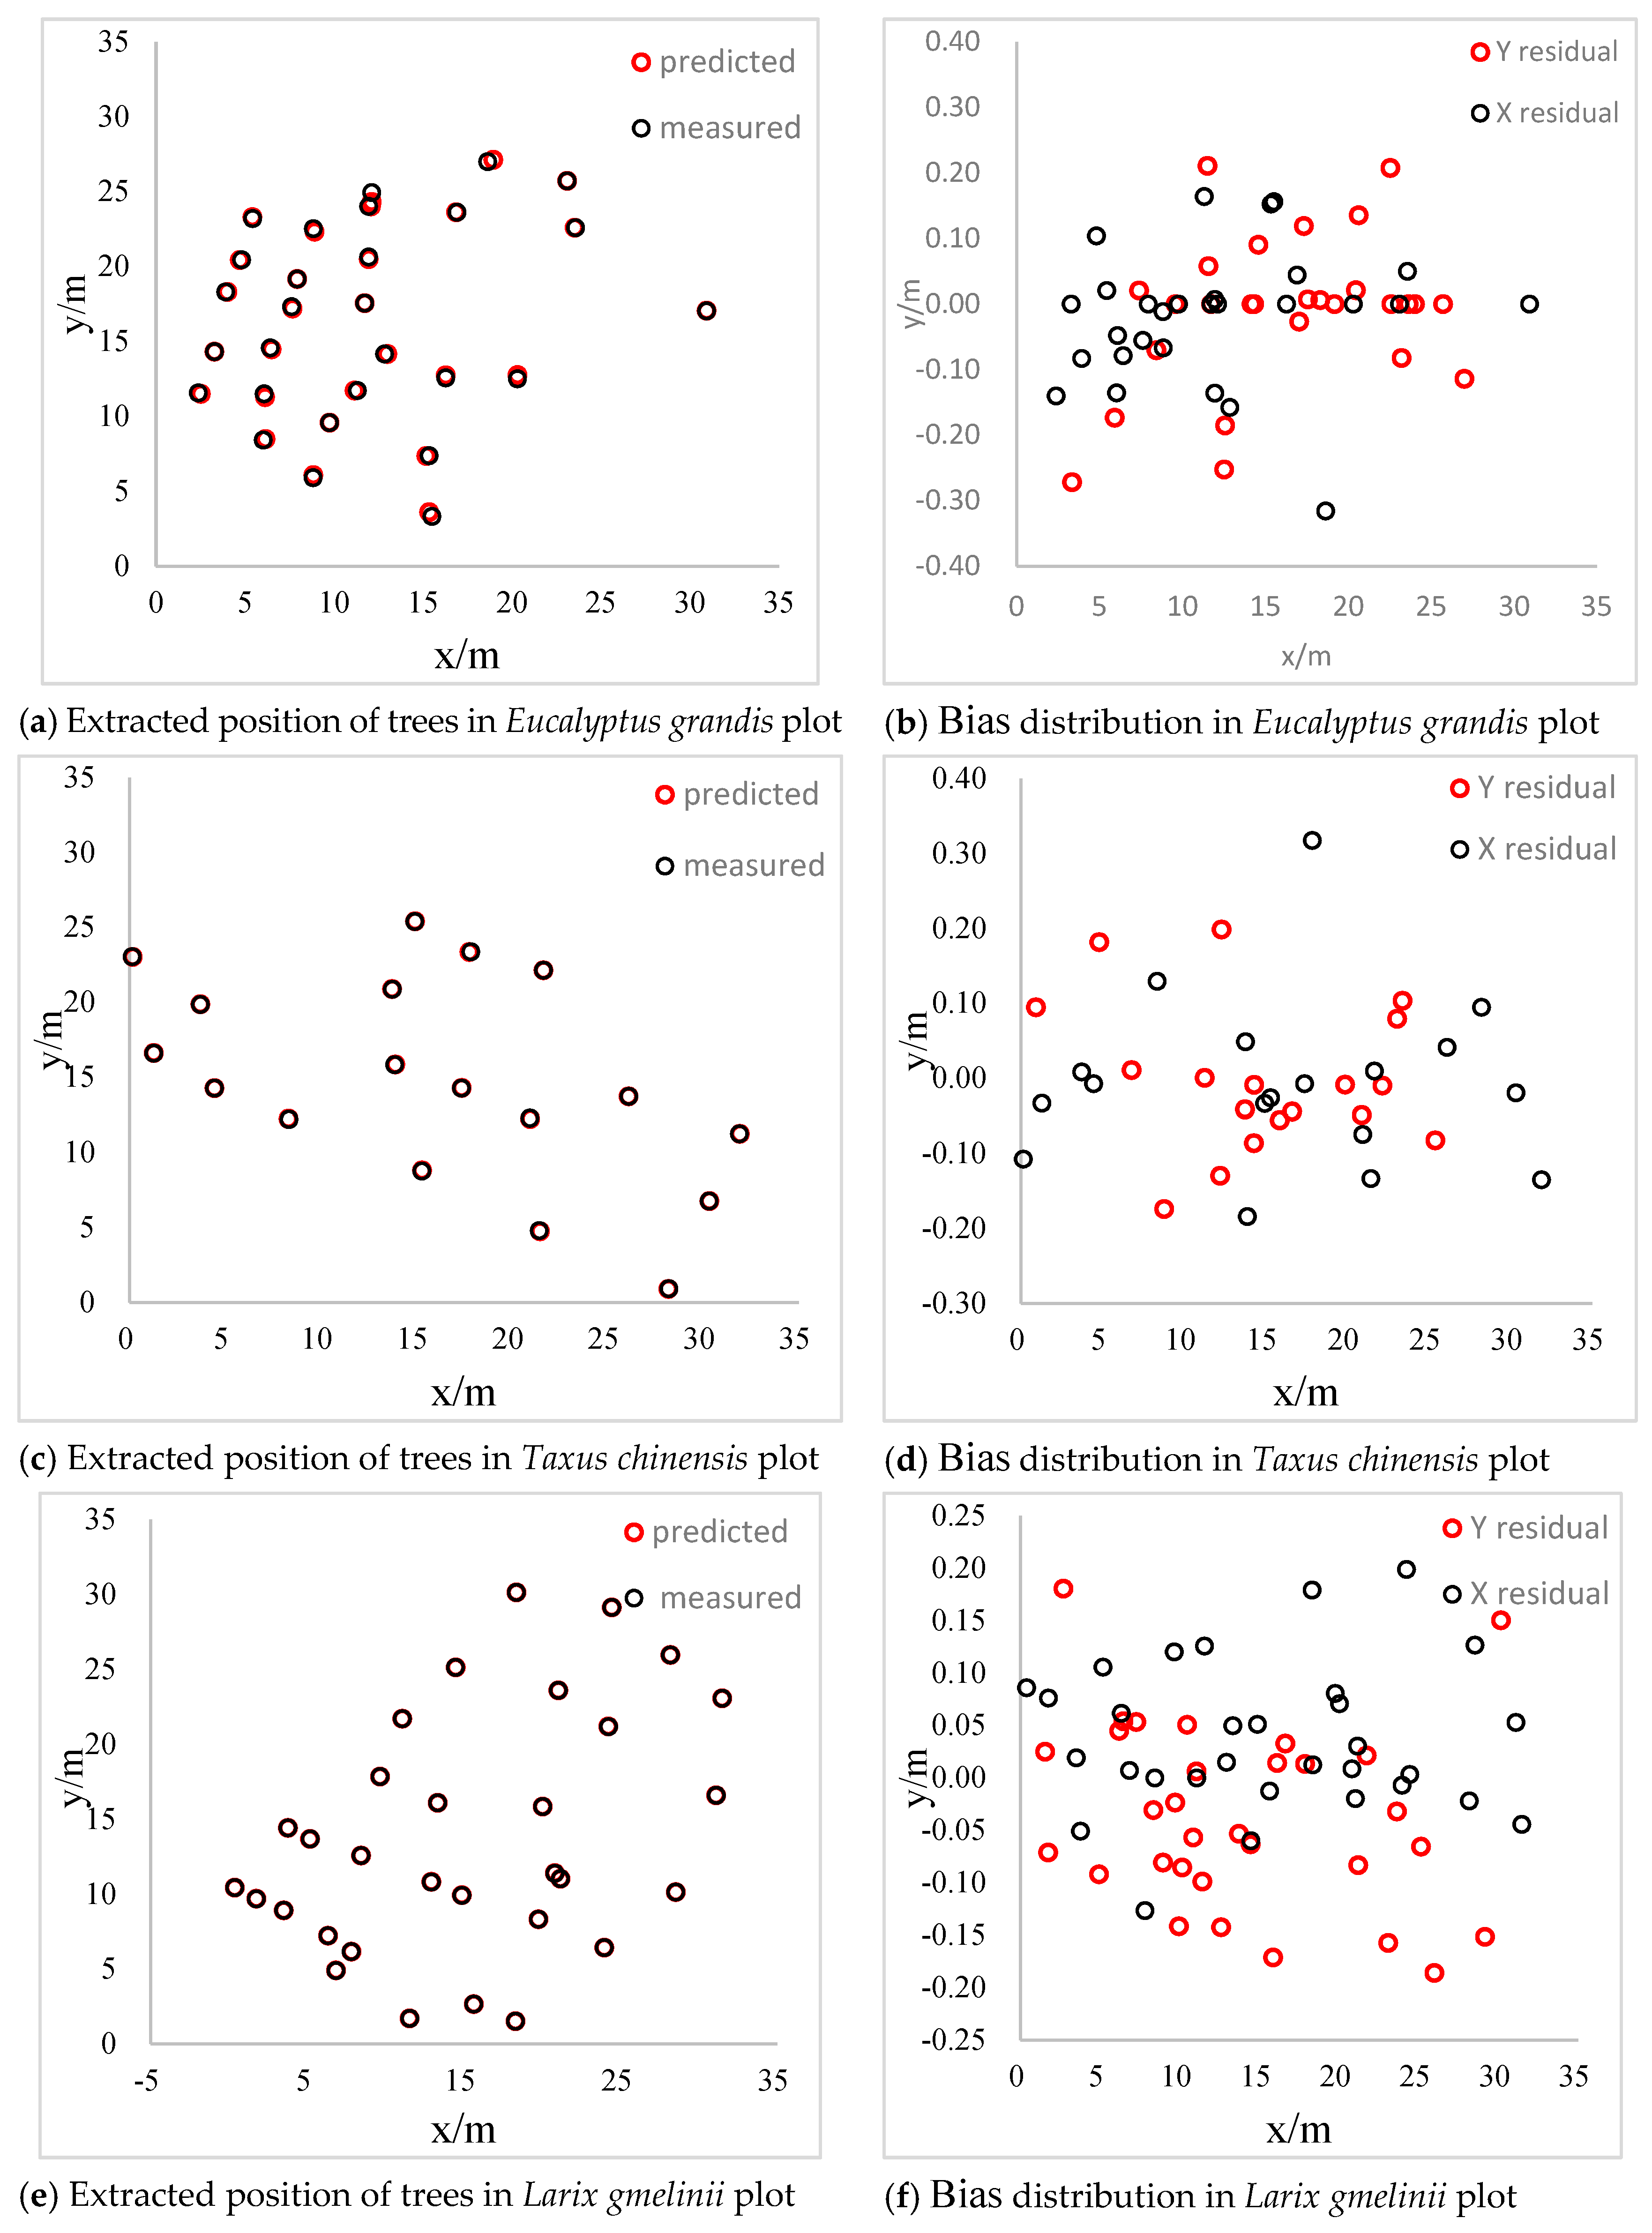
The distribution diagrams of bias between extracted values and measured values of four sample plots are shown in Figure 8. The bias converges within 0.2 m and the bias concentrates around 0 in the Eucalyptus grandis plot. The distribution of the bias is more uniform and is positive on the x-axis while negative on the y-axis, which results from the different ways of collecting data. The slope is steeper in the Taxus chinensis and Pinus tabuliformis plots and the reconstruction rates are 64% and 62%, respectively. The distribution of the bias is discrete and within 0.2 m in the Taxus chinensis plot. Furthermore, the bias converges within 0.15 m and the distribution is uniform in the Pinus tabuliformis plot. Therefore, we can conclude that the slope of sample plots will affect the reconstruction rate of individual trees, but has little influence on the accuracy of individual tree positions.
Table 4 shows the results of the extracted DBH and the measured DBH in four sample plots. The PRE values of extracted DBH in the Eucalyptus grandis and Larix gmelinii sample plots are 94.66% and 96.88%, respectively, which indicates that the proposed method in the study performs better in the plots with few branches and leaves and clear trunks. The accuracy of extracted DBH in the Taxus chinensis sample plot is 95.04%, which indicates that although the steep slope affects the reconstruction rate of the individual trees, the extracted DBH of the reconstructed trees has high accuracy. The accuracy of extracted DBH in the Pinus tabuliformis sample plot is 91.52%, which is a worse result than the other three plots. There is a lot of understory vegetation in the Pinus tabuliformis plot and there is much noise. The point cloud of the trunks was influenced by the denoising process, which resulted in lower accuracy.

4. Discussion

In this paper, we explored the method of 3D forest scene reconstruction and parameter extraction by combining image enhancement and a feature matching algorithm based on close-range photogrammetry (CRP) technology. The method has the ability to solve the problems of low-quality images caused by poor light conditions and complex terrain. We used the MSR image enhancement algorithm to strengthen the features of trees and then used the Harris+SURF algorithm for feature detection to improve the efficiency of feature detection and matching.

4.1. The Effects of Different Image Enhancement Algorithms on 3D Reconstruction

From Figure 5, it is evident that the edge of the trunk can be highlighted by image enhancement, which increased the number of feature points on the trunk. Median–Gaussian (MG) filtering, single-scale retinex (SSR) and multi-scale retinex (MSR) achieved a better result. The number of feature points decreased when using the MG filter. The reason is that there are a lot of similar points generated from the processed images, which results in many mismatched points. The feature points increased in the dark and the distribution was concentrated on the trunk and the ground after SSR algorithms, but decreased slightly in bright conditions [49,50]. Meanwhile, when using the MSR algorithm, the feature points increased significantly and were distributed on the trunk and ground evenly. Furthermore, it does not lose the feature points in bright conditions. Therefore, compared with other image enhancement methods, the detail information in the images was enhanced after MSR filtering and the detection of feature points was concentrated on the edge of the trunk, which can improve the rate of tree reconstruction and make the reconstructed model more precise. The result shows an accuracy greater than 90% for DBH extraction, which meets the accuracy requirements of the forestry resource survey. Additionally, the number of feature points increased slightly compared with the original image in the eucalyptus plot, which results from a flat and simple terrain in the forest. This showed that image enhancement has more effects on low-quality images.

4.2. The Effects of Different Tree Species and Terrain on 3D Reconstruction and Parameter Extraction

The efficiencies of the 3D model reconstructed from MSR enhanced images of four plots with different tree species and terrain conditions were compared. The results showed a distinctive effect in coniferous plots (Taxus chinensis and Pinus tabuliformis) with complex terrain and a poor reconstruction rate of the original image. Additionally, the part of trees observed using the total station is the bottom part, while the parts extracted by the model are located 1.3 m from the bottom point. Therefore, the accuracy of the extracted position will be decreased when the slope is steep.
The acquired sequence images are of low quality in the Taxus chinensis plot with a steep slope, which results from the difficulty in keeping the horizontal direction constant when collecting data and results in a low reconstruction rate. Therefore, the number of point clouds significantly increased and the trunks are clearer after image enhancement. However, the Eucalyptus grandis plot and Larix gmelinii plot have flat terrain, and the model obtained from the original images has good accuracy, resulting in less number of point clouds increased after enhancement. The accuracy of DBH extraction in the four sample plots is over 90%. The complex terrain generated lots of noise, resulting in the lower accuracy in the Pinus tabuliformis plot.
The image acquisition process was directly affected by terrain and then affected the image quality and the number of reconstructed trees [51,52]. However, the extracted positions of the individual trees could be obtained from trees that had been reconstructed and were not directly associated with the slope. Therefore, the frequency of data acquisition and the shooting angle should be appropriately improved in sample plots with complex terrain to decrease the interference of the slope. Meanwhile, direct light should be avoided when collecting data to reduce the influence of illumination in an image.

4.3. Research Limitations

The sequence images were acquired with a smartphone and achieved a good accuracy for position and DBH extraction. However, the quality of sequence images is affected by the illumination and terrain, resulting from the unstable overlapping rate between images and inaccurate localization. Therefore, on one hand, we will acquire the sequence images using a binocular camera carrying an accurate GPS receiver in future studies to improve the accuracy of 3D reconstruction and parameter extraction based on CRP. On the other hand, a new data collection method needs to be experimented with and verified in sample plots with a large area, which involves dividing the large sample plot into small parts and splicing images of the region after shooting to solve the problem of low reconstruction rate.

5. Conclusions

In response to the issues of low image quality and low efficiency caused by unstable illumination and complex terrain, MG filtering and SSR and MSR image enhancement algorithms are compared. The results show that the number of feature points increased and was distributed evenly by the MSR algorithm, which compensates for the low exposure of the original images and improves the image quality. Meanwhile, a Harris+SURF method is proposed to reduce the time of 3D model reconstruction and a GC-based IIPTN dense point cloud algorithm is used for improving the reconstruction accuracy from the enhanced images. The parameters were then extracted from the 3D forest model. The accuracy of extracted DBH is above 90% in four plots, which shows a better effect of 3D reconstruction. The feasibility of the proposed method was verified in four typical types of plantation in China. The results show it can achieve accurate parameter extraction and meet the need for forest precision surveys and visualization management.

Author Contributions

R.Z. and Z.G. collected field data, completed the paper and wrote the paper, and X.Z. edited the paper. All authors have read and agreed to the published version of the manuscript.

Funding

This work was supported by the National Key Research and Development Program of China, Ministry of Science and Technology (grant number 2017YFD0600900).

Acknowledgments

We thank Erxue Chen and Lei Zhao from the Chinese Academy of Forestry who organized the data acquisition and tests, and Zhengqi Guo et al. from the Precision Forestry Key Laboratory of Beijing Forestry College, Beijing Forestry University, for helping in field experiments.

Conflicts of Interest

The authors have no conflicts of interest to declare.

References

  1. Chirico, G.B.; Bonavolontà, F. Metrology for Agriculture and Forestry 2019. Sensors 2020, 20, 3498. [Google Scholar] [CrossRef]
  2. Holopainen, M.; Vastaranta, M.; Hyyppä, J. Outlook for the Next Generation’s Precision Forestry in Finland. Forests 2014, 5, 1682–1694. [Google Scholar] [CrossRef] [Green Version]
  3. You, L.; Tang, S.; Song, X.; Lei, Y.; Zang, H.; Lou, M.; Zhuang, C. Precise Measurement of Stem Diameter by Simulating the Path of Diameter Tape from Terrestrial Laser Scanning Data. Remote Sens. 2016, 8, 717. [Google Scholar] [CrossRef] [Green Version]
  4. Pitkänen, T.P.; Raumonen, P.; Kangas, A. Measuring stem diameters with TLS in boreal forests by complementary fitting procedure. ISPRS J. Photogramm. Remote Sens. 2019, 147, 294–306. [Google Scholar] [CrossRef]
  5. Akay, A.E.; Oğuz, H.; Karas, I.R.; Aruga, K. Using LiDAR technology in forestry activities. Environ. Monit. Assess. 2008, 151, 117–125. [Google Scholar] [CrossRef] [PubMed]
  6. Faugeras, O.D.; Faugeras, O.D.; Luong, Q.-T.; Luong, Q.-T.; Maybank, S.J.; Maybank, S.J. Camera self-calibration: Theory and experiments. In Computer Vision—ECCV’92; Springer: Berlin/Heidelberg, Germany, 1992; pp. 321–334. [Google Scholar]
  7. Alex, M.A. Multiple View Geometry in Computer Vision. Kybernetes 2001, 30, 1333–1341. [Google Scholar]
  8. Petschko, H.; Goetz, J.; Böttner, M.; Firla, M.; Schmidt, S. Erosion Processes and Mass Movements in Sinkholes Assessed by Terrestrial Structure from Motion Photogrammetry. Available online: https://link.springer.com/chapter/10.1007/978-3-319-53498-5_26 (accessed on 20 April 2021).
  9. Liang, X.; Wang, Y.; Jaakkola, A.; Kukko, A.; Kaartinen, H.; Hyyppa, J.; Honkavaara, E.; Liu, J. Forest Data Collection Using Terrestrial Image-Based Point Clouds from a Handheld Camera Compared to Terrestrial and Personal Laser Scanning. IEEE Trans. Geosci. Remote Sens. 2015, 53, 5117–5132. [Google Scholar] [CrossRef]
  10. Ullman, S. The Interpretation of Structure from Motion. Proc. R. Soc. Lond. B Biol. Sci. 1979, 203, 405–426. [Google Scholar] [CrossRef] [PubMed] [Green Version]
  11. Schonberger, J.L.; Frahm, J.M. Structure-From-Motion Revisited. In Proceedings of the IEEE Conference on Computer Vision and Pattern Recognition (CVPR), Las Vegas, NV, USA, 27–30 June 2016; pp. 4104–4113. [Google Scholar]
  12. Luhmann, T. Close range photogrammetry for industrial applications. ISPRS J. Photogramm. Remote Sens. 2010, 65, 558–569. [Google Scholar] [CrossRef]
  13. Martin, M. Evaluation of Close-Range Photogrammetry Image Collection Methods for Estimating Tree Diameters. Int. J. Geo-Inf. 2018, 7, 93. [Google Scholar]
  14. Forsman, M.; Holmgren, J.; Olofsson, K. Tree Stem Diameter Estimation from Mobile Laser Scanning Using Line-Wise Intensity-Based Clustering. Forests 2016, 7, 206. [Google Scholar] [CrossRef] [Green Version]
  15. Mikita, T.; Janata, P.; Surový, P. Forest Stand Inventory Based on Combined Aerial and Terrestrial Close-Range Photogrammetry. Forests 2016, 7, 165. [Google Scholar] [CrossRef] [Green Version]
  16. Zhang, Z.; Yun, T.; Liang, F.; Li, W.; Zhang, T.; Sun, Y. Study of Obtain of Key Parameters of Forest Stand Based on Close Range Photogrammetry. Sci. Technol. Eng. 2017, 17, 85–92. [Google Scholar]
  17. Hua, Y.; Xianyu, M.; Yan, L.; Jun, C. Measurement and Calculation Methods of a Stem Image Information. Front. For. China 2006, 1, 59–63. [Google Scholar]
  18. Hapca, A.I.; Mothe, F.; Leban, J.M. A digital photographic method for 3D reconstruction of standing tree shape. Ann. For. Sci. 2007, 64, 631–637. [Google Scholar] [CrossRef] [Green Version]
  19. Liang, X.; Jaakkola, A.; Wang, Y.; Hyyppä, J.; Honkavaara, E.; Liu, J.; Kaartinen, H. The Use of a Hand-Held Camera for Individual Tree 3D Mapping in Forest Sample Plots. Remote Sens. 2014, 6, 6587–6603. [Google Scholar] [CrossRef] [Green Version]
  20. Dick, A.R.; Kershaw, J.A.; MacLean, D.A. Spatial Tree Mapping Using Photography. North. J. Appl. For. 2010, 27, 68–74. [Google Scholar] [CrossRef] [Green Version]
  21. Surový, P.; Yoshimoto, A.; Panagiotidis, D. Accuracy of Reconstruction of the Tree Stem Surface Using Terrestrial Close-Range Photogrammetry. Remote Sens. 2016, 8, 123. [Google Scholar] [CrossRef] [Green Version]
  22. Goesele, M.; Curless, B.; Seitz, S.M. Multi-View Stereo Revisited. In Proceedings of the 2006 IEEE Computer Society Conference on Computer Vision and Pattern Recognition (CVPR’06), New York, NY, USA, 17–22 June 2006. [Google Scholar]
  23. Goesele, M.; Snavely, N.; Curless, B.; Hoppe, H.; Seitz, S.M. Multi-View Stereo for Community Photo Collections. In Proceedings of the 2007 IEEE 11th International Conference on Computer Vision 2007, Rio de Janeiro, Brazil, 14–20 October 2007; pp. 1–8. [Google Scholar]
  24. Liu, L. Automated Registration of 2D Images with 3D Range Data in a Photorealistic Modeling System of Urban Scenes. Ph.D. Thesis, City University of New York, New York, NY, USA, 2007. [Google Scholar]
  25. Pollefeys, M.; Koch, R.; Van Gool, L. Self-calibration and metric reconstruction in spite of varying and unknown internal camera parameters. In Proceedings of the International Conference on Computer Vision, Copenhagen, Denmark, 28–31 May 2002. [Google Scholar]
  26. Voicu, L.I.; Myler, H.R.; Weeks, A.R. Practical considerations on color image enhancement using homomorphic filtering. J. Electron. Imaging 1997, 6, 108–113. [Google Scholar] [CrossRef]
  27. Fattal, R.; Lischinski, D.; Werman, M. Gradient domain high dynamic range compression. In Proceedings of the 29th Annual Conference on Computer Graphics and Interactive Techniques, San Antonio, TX, USA, 23–26 July 2002. [Google Scholar]
  28. Hua, B.; Gruson, A.; Petitjean, V.; Zwicker, M.; Nowrouzezahrai, D.; Eisemann, E.; Hachisuka, T. A Survey on Gradient-Domain Rendering. Available online: https://onlinelibrary.wiley.com/doi/abs/10.1111/cgf.13652 (accessed on 20 April 2021).
  29. Prada, F.; Kazhdan, M.; Chuang, M.; Hoppe, H. Gradient-domain processing within a texture atlas. ACM Trans. Graph. 2018, 37, 1–14. [Google Scholar] [CrossRef]
  30. Yin, W.; Lin, X.; Sun, Y. A novel framework for low-light colour image enhancement and denoising. In Proceedings of the 2011 3rd International Conference on Awareness Science and Technology, iCAST 2011, Dalian, China, 27–30 September 2011. [Google Scholar]
  31. Pitas, I.; Venetsanopoulos, A.N. Nonlinear Digital Filters: Principles and Applications. Available online: https://www.springer.com/gp/book/9780792390497 (accessed on 20 April 2021).
  32. Lo, W.Y.; Puchalski, S.M. Digital image processing. Veter Radiol. Ultrasound 2008, 49 (Suppl. 1), S42–S47. [Google Scholar] [CrossRef]
  33. Land, E.H. Recent advances in retinex theory and some implications for cortical computations: Color vision and the natural image. Proc. Natl. Acad. Sci. USA 1983, 80, 5163–5169. [Google Scholar] [CrossRef] [Green Version]
  34. Wang, S.; Zheng, J.; Hu, H.; Li, B. Naturalness preserved enhancement algorithm for non-uniform illumination images. IEEE Trans. Image Proc. 2013, 22, 3538–3548. [Google Scholar] [CrossRef] [PubMed]
  35. Hao, P.; Wang, S.; Li, S.; Yang, M. Low-Light Image Enhancement Based on Retinex and Saliency Theories. In Proceedings of the 2019 Chinese Automation Congress (CAC), Hangzhou, China, 22–24 November 2019. [Google Scholar]
  36. Choi, D.H.; Jang, I.H.; Kim, M.H.; Kim, N.C. Color image enhancement using single-scale retinex based on an improved image formation model. In Proceedings of the European Signal Processing Conference, Lausanne, Switzerland, 25–29 August 2008. [Google Scholar]
  37. Wang, W.; Li, B.; Zheng, J.; Xian, S.; Wang, J. A fast Multi-Scale Retinex algorithm for color image enhancement. In Proceedings of the International Conference on Wavelet Analysis & Pattern Recognition, Hong Kong, China, 30–31 August 2008. [Google Scholar]
  38. Uliyan, D.M.; Alshammari, M.T. Investigation of image forgery based on multiscale retinex under illumination variations. J. Intell. Fuzzy Syst. 2020, 21, 1–12. [Google Scholar] [CrossRef]
  39. Zotin, A. Fast algorithm of image enhancement based on multi-scale retinex. Int. J. Reason. Based Intell. Syst. 2020, 12, 106. [Google Scholar] [CrossRef]
  40. Jobson, D.; Rahman, Z.; Woodell, G. A multiscale retinex for bridging the gap between color images and the human observation of scenes. IEEE Trans. Image Process. 1997, 6, 965–976. [Google Scholar] [CrossRef] [PubMed] [Green Version]
  41. Sizintsev, M.; Wildes, R.P. Spacetime Stereo and 3D Flow via Binocular Spatiotemporal Orientation Analysis. IEEE Trans. Pattern Anal. Mach. Intell. 2014, 36, 2241–2254. [Google Scholar] [CrossRef] [PubMed]
  42. Harris, C.; Stephens, M. A Combined Corner and Edge Detector. In Proceedings of the 4th Alvey Vision Conference, Manchester, UK, 31 August–2 September 1988; pp. 147–151. [Google Scholar]
  43. Bay, H. SURF: Speeded Up Robust Features. Comput. Vis. Image Underst. 2006, 110, 404–417. [Google Scholar]
  44. Lowe, D.G. Object Recognition from Scale-Invariant Keypoints; Iccv: Vancouver, BC, Canada, 1999. [Google Scholar]
  45. Schnabel, R.; Wahl, R.; Klein, R. Efficient RANSAC for Point-Cloud Shape Detection. Comput. Graph. Forum 2007, 26, 214–226. [Google Scholar] [CrossRef]
  46. Schnabel, R.; Wahl, R.; Klein, R. RANSAC Based Out-of-Core Point-Cloud Shape Detection for City-Modeling. Proc. Terr. Laserscanning 2007, 26, 214–226. [Google Scholar]
  47. Cheng, S.W.; Dey, T.K.; Shewchuk, J. Delaunay Mesh Generation. Comput. Math. Math. Phys. 2013, 50, 38–53. [Google Scholar]
  48. Zhou, D.; Xu, Y.; Zhang, Q.; Wei, X. A new triangulation algorithm from 3D unorganized dense point cloud. In Proceedings of the Tencon IEEE Region 10 Conference, Macao, China, 1–4 November 2015; pp. 1–6. [Google Scholar]
  49. Choi, D.H.; Jang, I.H.; Kim, M.H.; Kim, N.C. Color Image Enhancement Based on Single-Scale Retinex with a JND-Based Nonlinear Filter. In Proceedings of the International Symposium on Circuits and Systems (ISCAS 2007), New Orleans, LA, USA, 20–27 May 2007. [Google Scholar]
  50. Wang, C.; Peng, M.; Xu, L.; Chen, T. A single scale retinex based method for palm vein extraction. In Proceedings of the 2016 IEEE Information Technology, Networking, Electronic and Automation Control Conference, Chongqing, China, 20–22 May 2016; pp. 75–78. [Google Scholar]
  51. Wang, D.; Bei, J.; Gu, S.; Nie, R. Operating Mode and Method on Information Collection Systems of GPS Close-range Photogrammetry. In Proceedings of the 3rd China Satellite Navigation Academic Annual Conference—S01 Beidou/GNSS Navigation Application, Chengdu, China, 23–25 May 2012. [Google Scholar]
  52. Zeng, W.; Zhong, S.D.; Yao, Y.; Shao, Z.F. 3D Model Reconstruction Based on Close-Range Photogrammetry. Appl. Mech. Mater. 2012, 263-266, 2393–2398. [Google Scholar] [CrossRef]
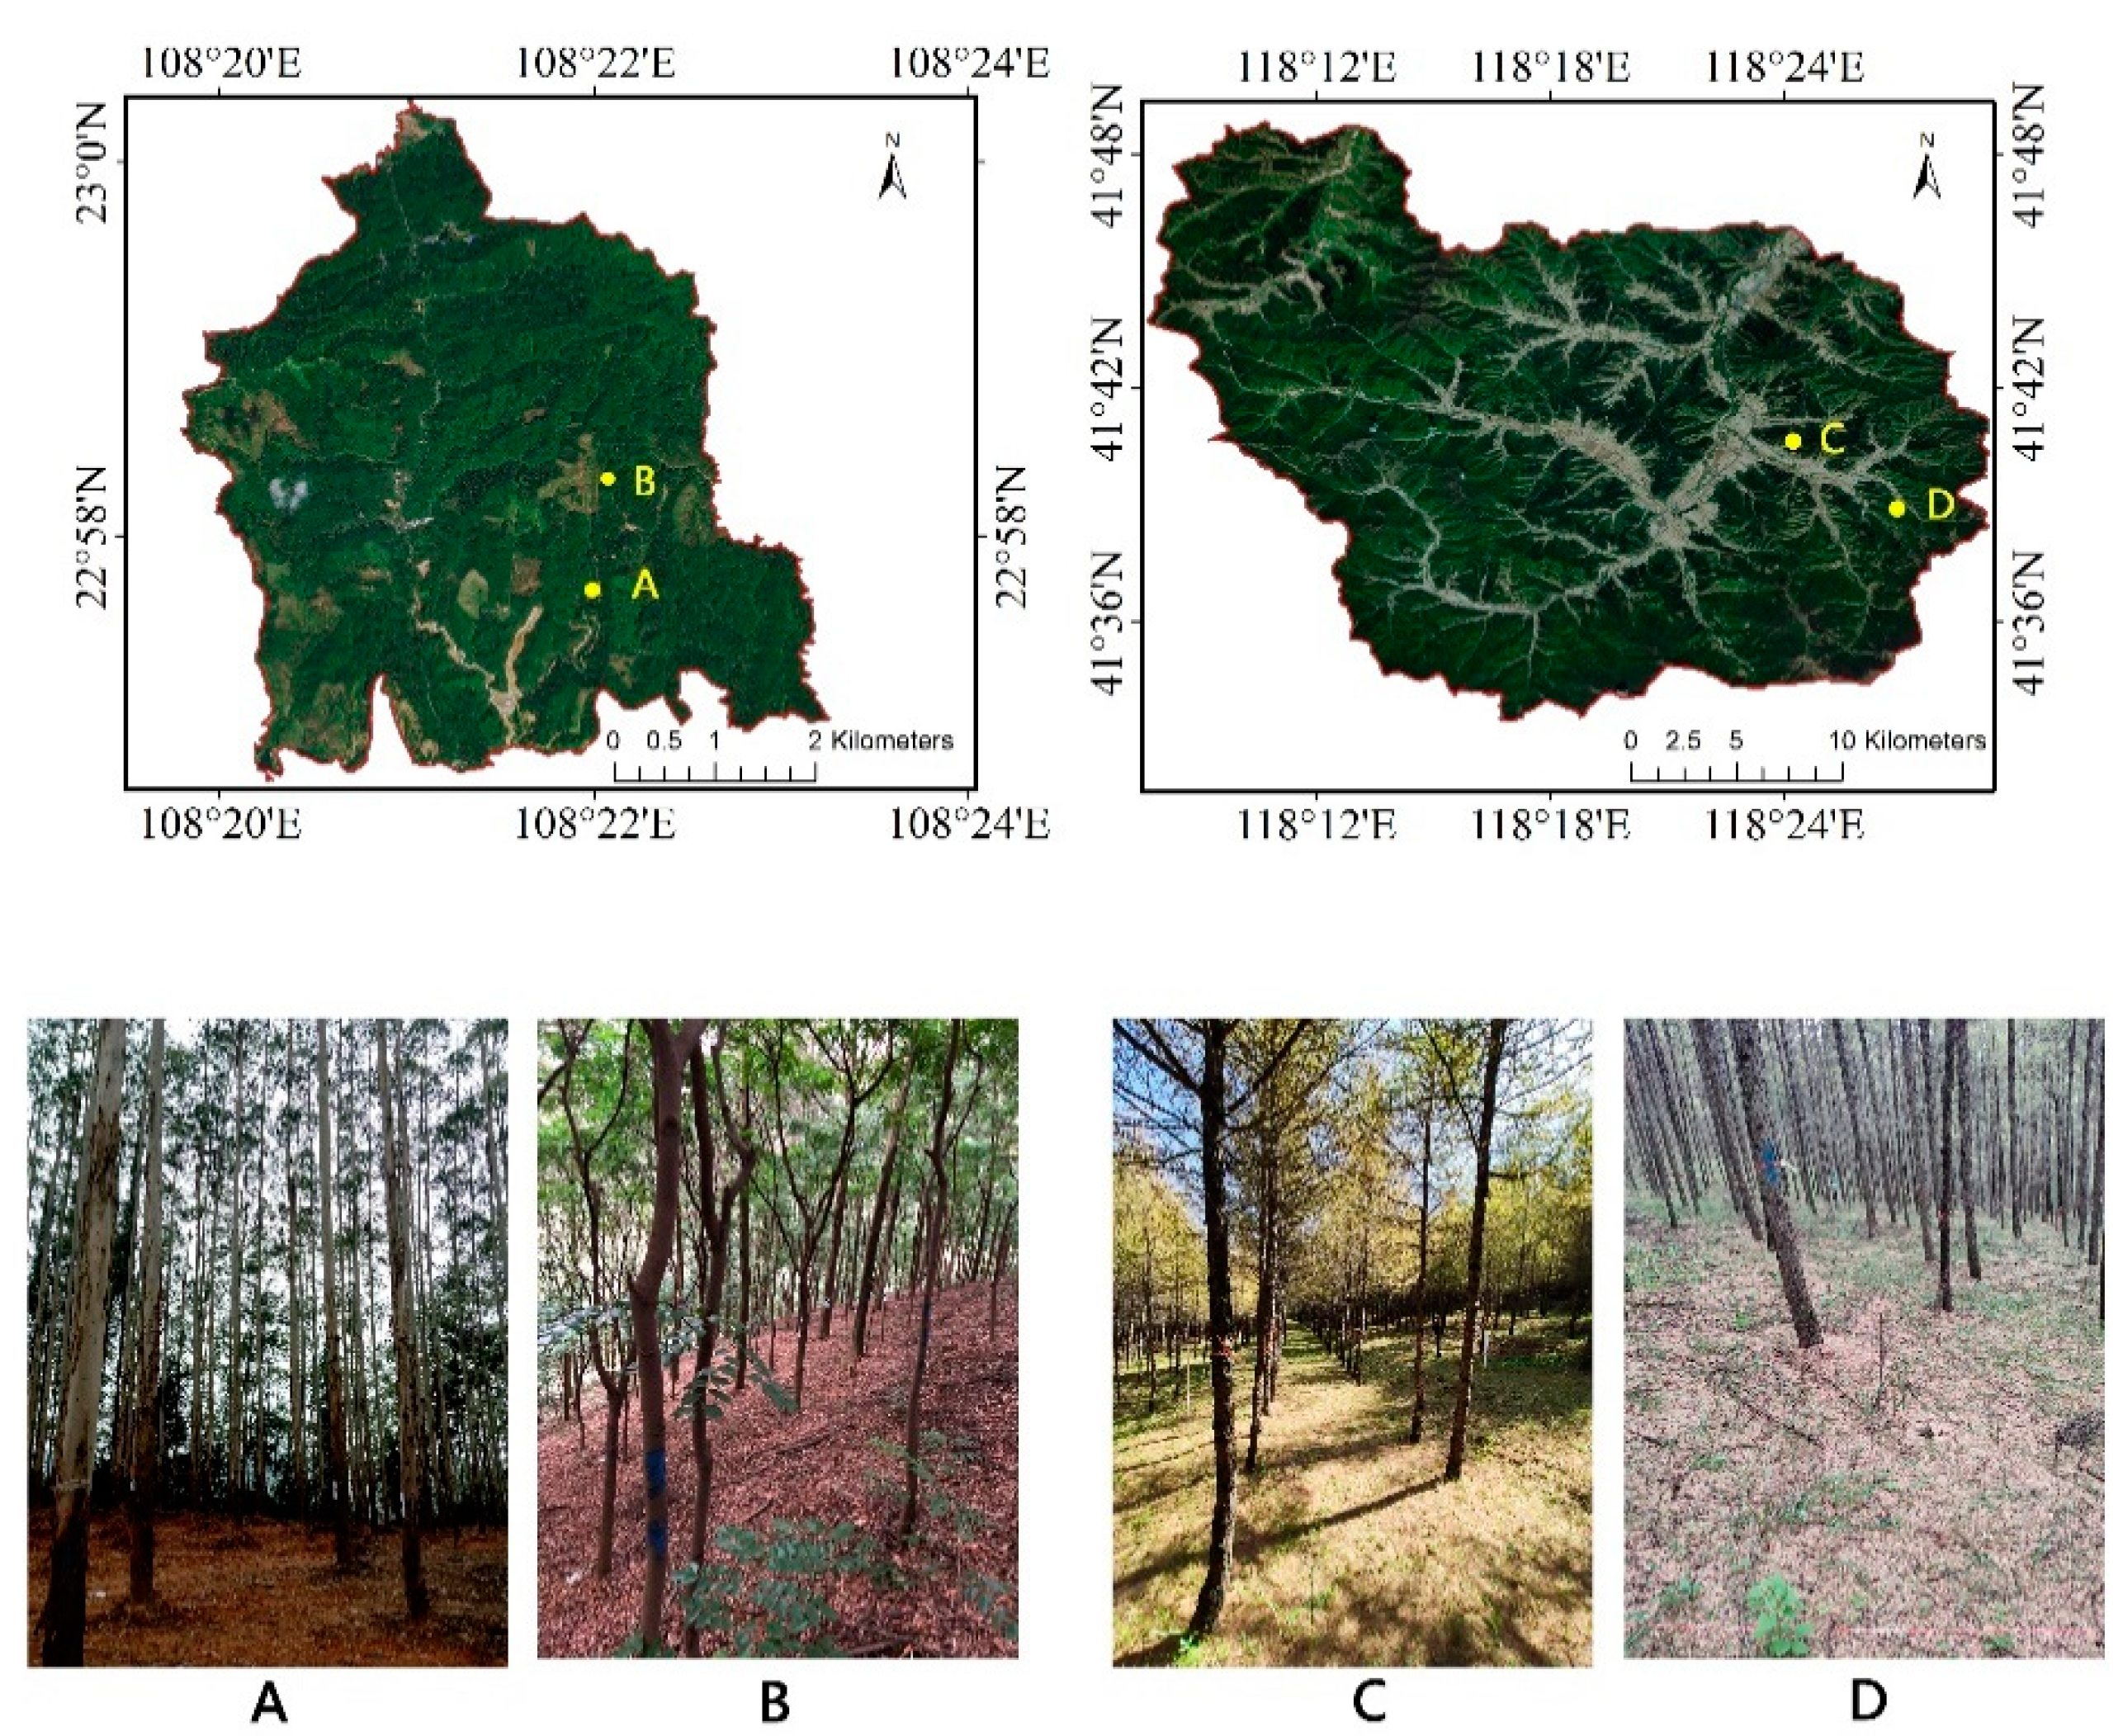
Figure 1. (A) Plot_1 (sessile oak); (B) Plot_2 (sessile oak); (C) Plot_3 (sessile oak); (D) Plot_4 (larch).
Remotesensing 13 01633 g001
Figure 2. The technical framework.
Remotesensing 13 01633 g002
Figure 3. Retinex algorithm flowchart.
Remotesensing 13 01633 g003
Figure 4. Algorithm flow of GC-based IIPTN dense point cloud.
Remotesensing 13 01633 g004
Figure 5. Feature point matching results of different Pinus tabuliformis image enhancement algorithms. (a) Eucalyptus grandis; (b) Taxus chinensis; (c) Larix gmelinii; (d) Pinus tabuliformis; 1: original image; 2: images after MG filtering; 3: images after SSR algorithm; 4: images after MSR algorithm.
Remotesensing 13 01633 g005aRemotesensing 13 01633 g005b
Figure 6. Comparison between Harris+SURF and SIFT feature detection algorithms. (a) Harris+SURF, (b) SIFT.
Remotesensing 13 01633 g006
Figure 7. 3D reconstruction models before and after image enhancement by MSR algorithm in four different plots.
Remotesensing 13 01633 g007aRemotesensing 13 01633 g007b
Figure 8. Results of 3D reconstruction.
Remotesensing 13 01633 g008aRemotesensing 13 01633 g008b
Table 1. Sample plot information.
Sample PlotStand TypeSlope (°)Main Tree SpeciesNumber of Trees
1Evergreen broadleaf forest13Eucalyptus grandis35
2Evergreen broadleaf forest27Taxus chinensis28
3Coniferous forest15Larix gmelinii40
4Coniferous forest25Pinus tabuliformis47
Table 2. Comparison of the number of point clouds before and after image enhancement by MSR algorithm in four different plots.
Tree SpeciesPoint Cloud Number of the Original IMAGES (104)Point cloud Number after Enhancement (104)The Increased Number of Point Cloud (104)The Proportion of Increased Number of the Point Cloud (%)
Eucalyptus grandis311.67313.361.6910.54
Taxus chinensis12.1314.372.2418.47
Larix gmelinii177.39222.1044.7125.20
Pinus tabuliformis22.8928.125.2322.85
Table 3. The results of individual tree reconstruction of different tree species.
Tree SpeciesNumber of Investigated TreesNumber of Reconstructed TreesReconstruction Rate (r)
Eucalyptus grandis352880%
Taxus chinensis281864%
Larix gmelinii403178%
Pinus tabuliformis472962%
Table 4. The accuracy of extracted DBH of different tree species.
Tree SpeciesAverage of Extracted DBH (cm)Average of Measured DBH (cm)RE (%)PRE (%)
Eucalyptus grandis24.3024.305.3494.66
Taxus chinensis17.3117.314.9695.04
Larix gmelinii17.9017.903.1296.88
Pinus tabuliformis16.4215.498.4891.52
Publisher’s Note: MDPI stays neutral with regard to jurisdictional claims in published maps and institutional affiliations.