Article

Morphodynamic Controls for Growth and Evolution of a Rubble Coral Island

1
Earth Sciences Department, University of Cádiz, 11519 Puerto Real, Spain
2
Geocoastal Research Group, School of Geosciences, University of Sydney, Sydney, NSW 2006, Australia
3
TropWater, College of Science and Engineering, James Cook University, Bebegu Yumba Campus, Townsville, QLD 4811, Australia
4
School of Earth and Environmental Sciences, Faculty of Science, University of Queensland, Brisbane, QLD 4067, Australia
5
Department of Environment and Geography, University of York, York YO10 5NG, UK
6
School of Life and Environmental Sciences, University of Sydney, Sydney, NSW 2006, Australia
7
ARA—Airborne Research Australia, Parafield Airport, Parafield, SA 5106, Australia
8
College of Science and Engineering, Flinders University, Adelaide, SA 5001, Australia
*
Author to whom correspondence should be addressed.
Remote Sens. 2021, 13(8), 1582; https://doi.org/10.3390/rs13081582
Submission received: 30 March 2021 / Revised: 16 April 2021 / Accepted: 17 April 2021 / Published: 19 April 2021
(This article belongs to the Special Issue UAV Application for Monitoring Coastal Morphology)

Abstract

:
Rubble islands are dynamic sedimentary features present on reef platforms that evolve under a variety of morphodynamic processes and controlling mechanisms. They provide valuable inhabitable land for small island nations, critical habitat for numerous species, and are threatened by climate change. Aiming to investigate the controlling mechanisms dictating the evolution of One Tree Island (OTI), a rubble island in the Southern Great Barrier Reef, we combined different remotely-sensed data across varying timescales with wave data extracted from satellite altimetry and cyclone activity. Our findings show that (1) OTI had expanded by 7% between 1978 and 2019, (2) significant gross planform decadal adjustments were governed by the amount, intensity, proximity, and relative position of cyclones as well as El Niño Southern Oscillation (ENSO) phases, and (3) the mechanisms of island growth involve rubble spits delivering and redistributing rubble to the island through alongshore sediment transport and wave overtopping. Frequent short-term monitoring of the island and further research coupling variations in the different factors driving island change (i.e., sediment availability, reef-wave interactions, and extreme events) are needed to shed light on the future trajectory of OTI and other rubble islands under a climate change scenario.

1. Introduction

Remote sensing techniques represent some of the most widely used tools to investigate reef platforms because geomorphological features such as reef flats, sand aprons, rubble ridges and spits, rubble islands, and island shorelines are easily identifiable in aerial photos or satellite imagery. These traditional techniques have allowed the monitoring of these geomorphological landforms providing valuable information about their changes in area, shape, and/or position and thus help to build an overall picture of their past evolution. In fact, reports in the literature have extensively relied on the use of these methods, the majority to investigate island planform changes (e.g., [1,2,3]), shoreline changes (e.g., [4,5,6]), the progradation of sand aprons (e.g., [7,8]), or the evolution of coral rubble deposits on a reef platform (e.g., [9]), among many others. Despite being effective methods in covering substantial spatial and temporal island changes in remote places, aerial photos and satellite imagery offer records that are typically scarce and not regular enough to fully understand mechanisms causing short-term geomorphic changes in coral reefs.
Ground-based monitoring techniques offer datasets characterized by higher precision and/or temporal resolution. Instruments such as Real-Time Kinematic Differential Global Positioning Systems (RTK-DGPS) and/or total stations have been used for mapping historical shoreline changes (e.g., [10]) and changes in different parameters such as reef, beach and vegetated areas, island length, width and ellipticity (e.g., [11]), or to build high-resolution Digital Elevation Models (DEM) (e.g., [12]). However, these ground-based instruments sometimes lack sufficient spatial coverage. Other methods, such as Kite Aerial Photography (KAP) or drones, overcome previous limitations by offering operational flexibility and versatility over large areas (e.g., 100–1000 m2); and an easy, fast, and low-cost way to obtain high-quality topographic data. Examples of the use of kites to monitor reef landforms include the works [13] and [14]. Drones are being increasingly used for many different purposes in reef platforms [15,16]. They have been used to map ramparts, mangroves, reef flat, and a sandy cay [17], to monitor and quantify changes in algal canopy cover and fine-scale geomorphological attributes across intertidal reef flats [18], to estimate multi-temporal changes in the extent of different substrate types in a Magoodhoo Island (Republic of Maldives) [19], and to generate multispectral and bathymetric data on a shallow-water coral reef [20], among others. Understanding past evolution is key to predict the future evolution of sedimentary features in coral reefs. Thus, it is important to note that all the methods described above complement each other, linking different temporal and spatial scales between historical long-term island changes and the short-term controlling mechanisms responsible.
In this paper, we analyzed several remote sensing datasets with different spatiotemporal resolutions coupled with wave data extracted from satellite altimetry to understand the dynamics of rubble islands, with special attention to cyclonic activity. Our study site was One Tree Island (OTI), a rubble cay located on the Southern Great Barrier Reef, Australia, that has been the subject of many previous investigations and therefore has extensive datasets available. Our results suggest that OTI has expanded during the last decades and that the mechanisms of island growth involve the presence of active rubble spits on the rubble flat. On the other hand, we found that OTI has experienced considerable platform adjustments of varying magnitude that, in turn, were influenced by cyclonic activity and climatic factors such as ENSO.

2. Study Site

One Tree Island (OTI) is located on the southeastern margin of One Tree Reef (Figure 1). This asymmetrical and triangular platform reef is 5.5 km long, 3 km wide, and is situated to the west of the shelf continental shelf edge (20 km) and 100 km east of the Australian coastline. One Tree Reef accommodates different geomorphological units, morphological features, and landforms commonly known in reef platforms (Figure 1) [21]. Among these is the forereef, composed of reef-building coral communities forming finger-like features named spur and grooves (Figure 1) [22]. These are parallel ridges and channels, respectively, thought to dissipate and focus the incoming wave energy [23,24], potentially leading to the formation of elongated and prograding spits (Figure 1) [9]. Wave energy on One Tree Reef is further attenuated/dissipated as waves propagate across the reef flat [25,26], which in One Tree Reef is dominated by rubble (coral pieces that usually range in size from 4.75 to 75 mm or above, commonly known as gravel) and, as such, linked to high-energy incident waves. The deposition and lagoonwards migration of accumulated rubble, deposited storm ridges, and prograding spits on the reef flat are what cause the formation and stabilization of rubble islands such as OTI [9,27]. The backreef in this platform comprises a lagoon with numerous patch reefs and includes extensive sandy deposits known as sand aprons [7], which provide suitable conditions for coral colonization (Figure 1) [28].
The dominant winds in this region come from the southeast, and it is strong between December and April when associated with the passage of cyclones. Waves at One Tree Reef are characterized by average significant wave height (Hs) of 1.54 m, peak wave period (Tp) of 7.43 s, and a mean wave direction (Өm) of around 115–120° (lagoon-ward), corresponding to a mean wave power (P) of 20.93 N m−1. Tides are semidiurnal and mesotidal, with an average spring tidal range of 3 m [9].

3. Materials and Methods

3.1. Topographic Data

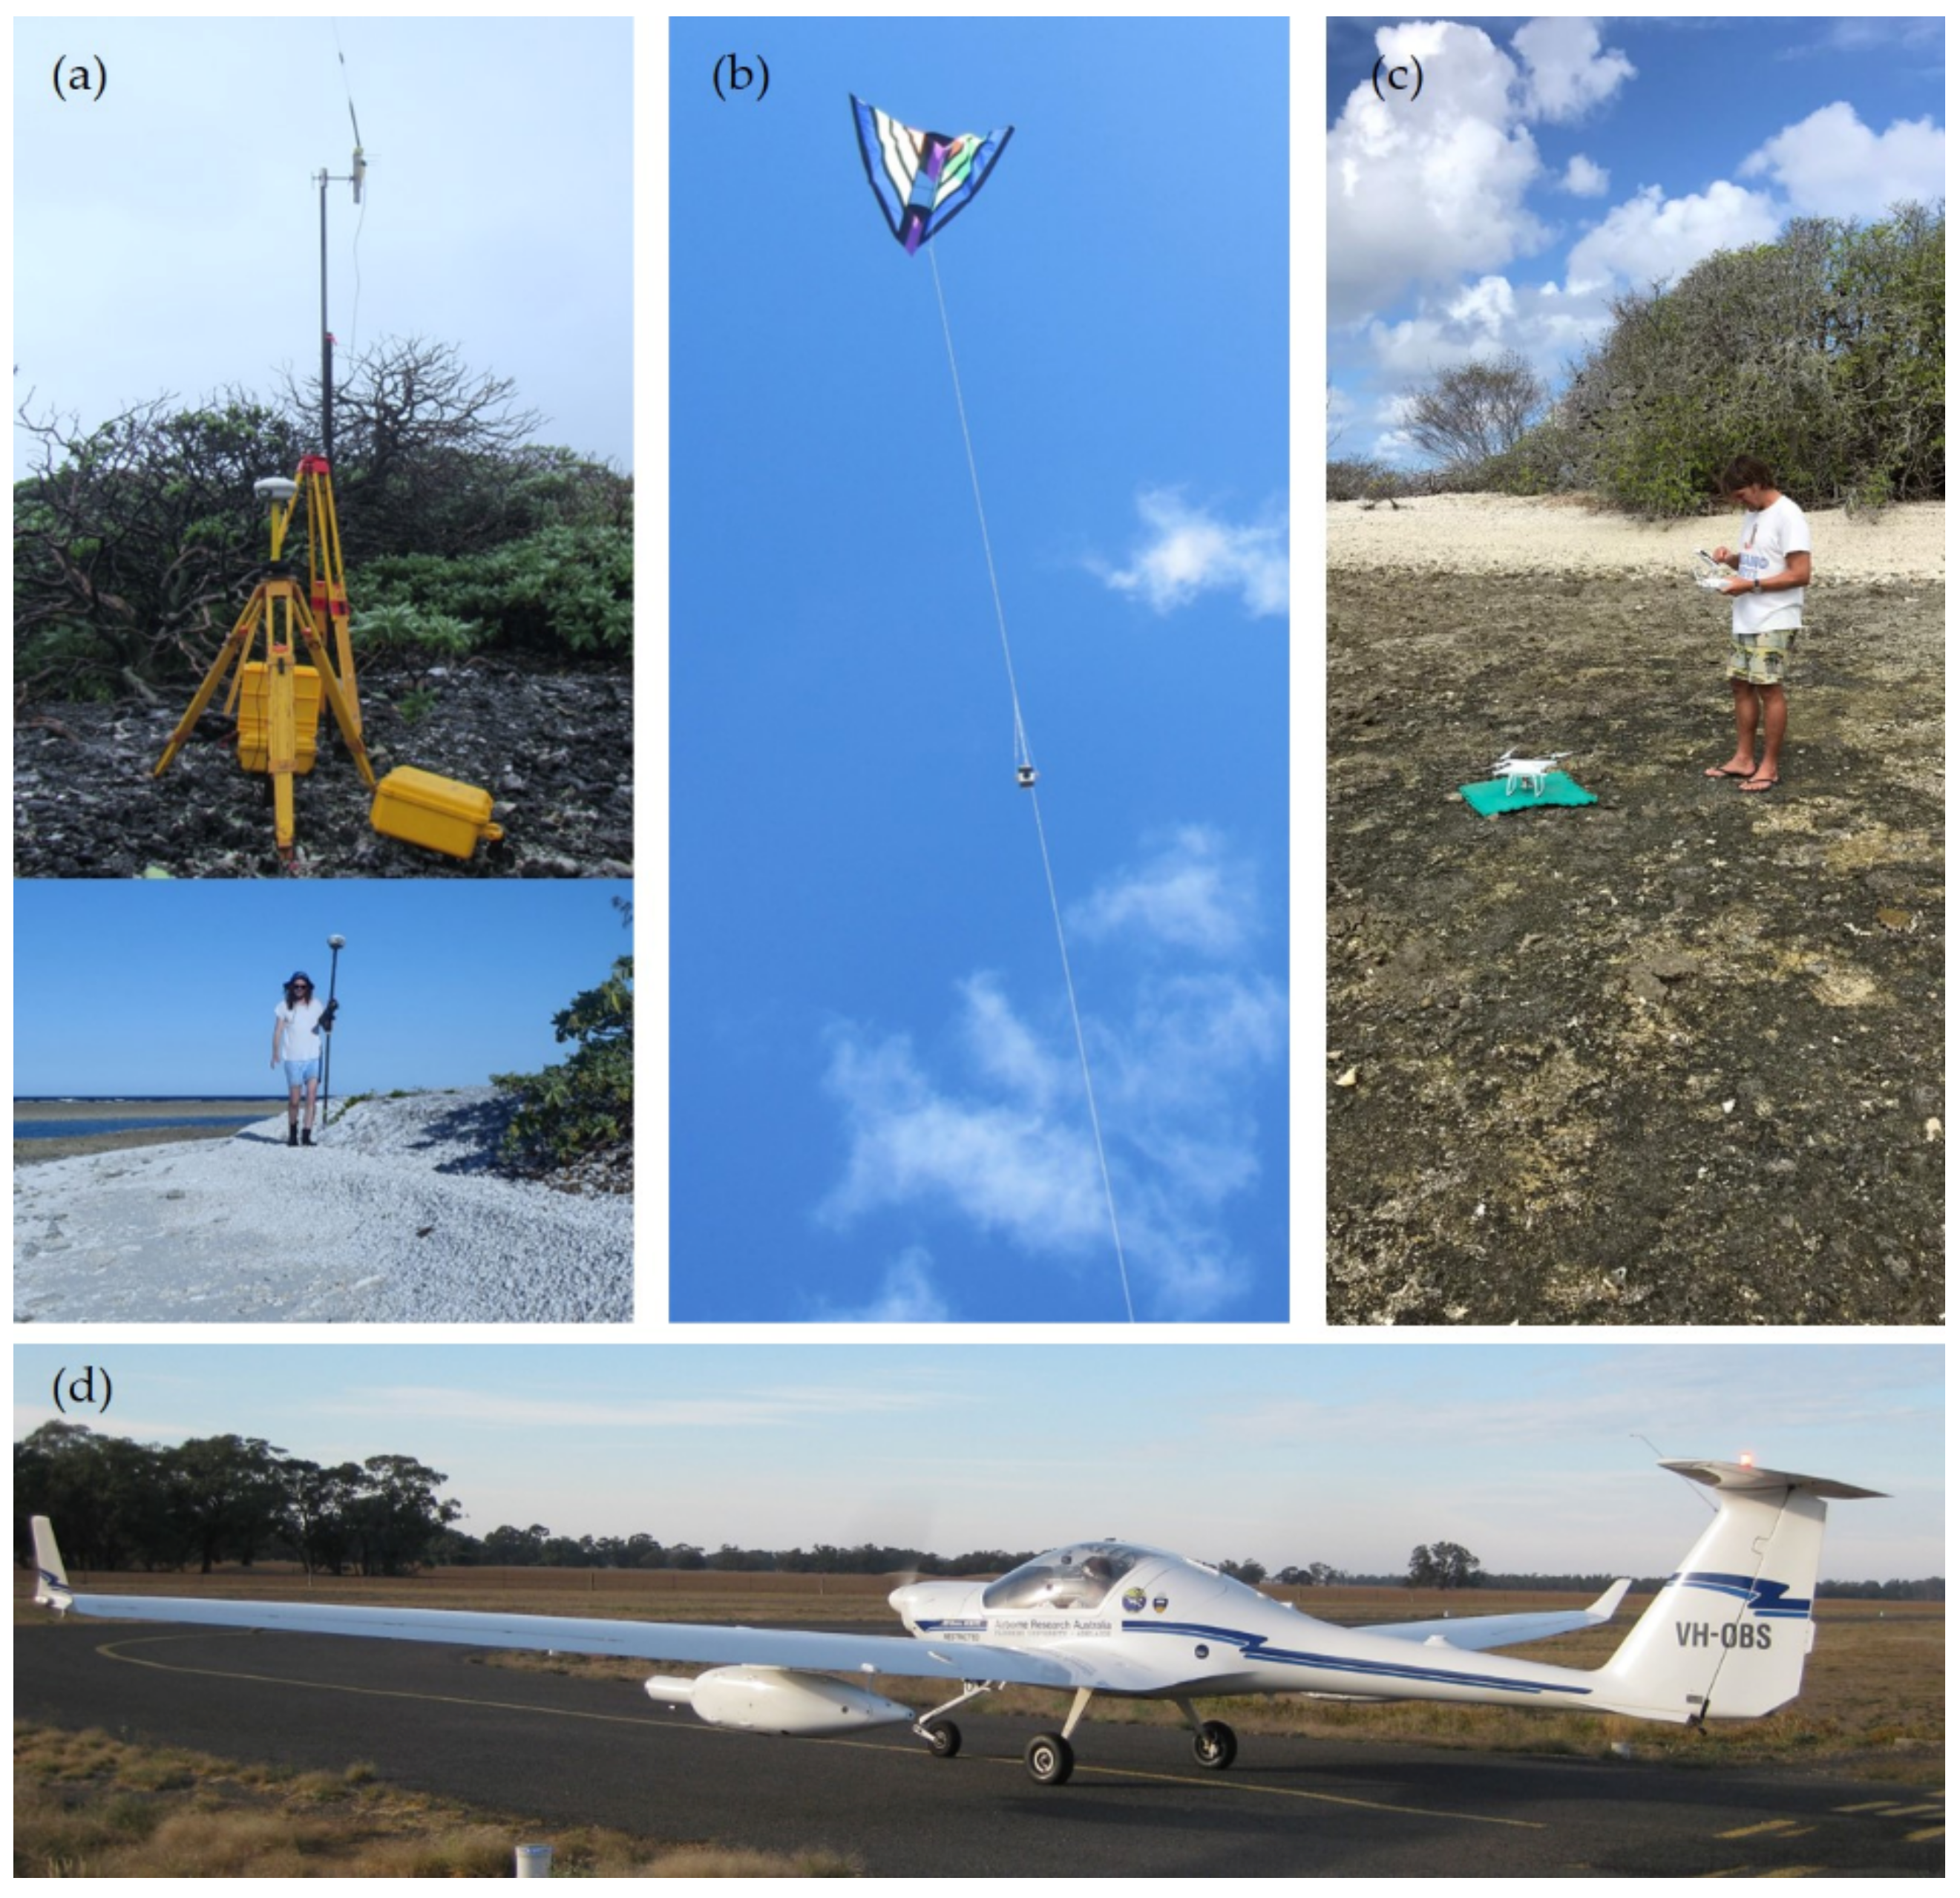
We investigated the geomorphic changes at OTI using topographical surveying and remotely-sensed data derived from numerous techniques spanning a period of 55 years (from 1964 to 2019). The different methods employed included aerial photos (1964, 1978, and 1980), satellite imagery (2001 and 2009), Real Time Kinematic and Differential Global Positioning Systems (RTK DGPS) (2008, 2011, and 2016), Kite Aerial Photography (KAP) (2014 and 2015), Light Detection and Ranging (LiDAR) (2018), and Remotely Piloted Aircraft Systems (RPAs) (2019) (Figure 2).
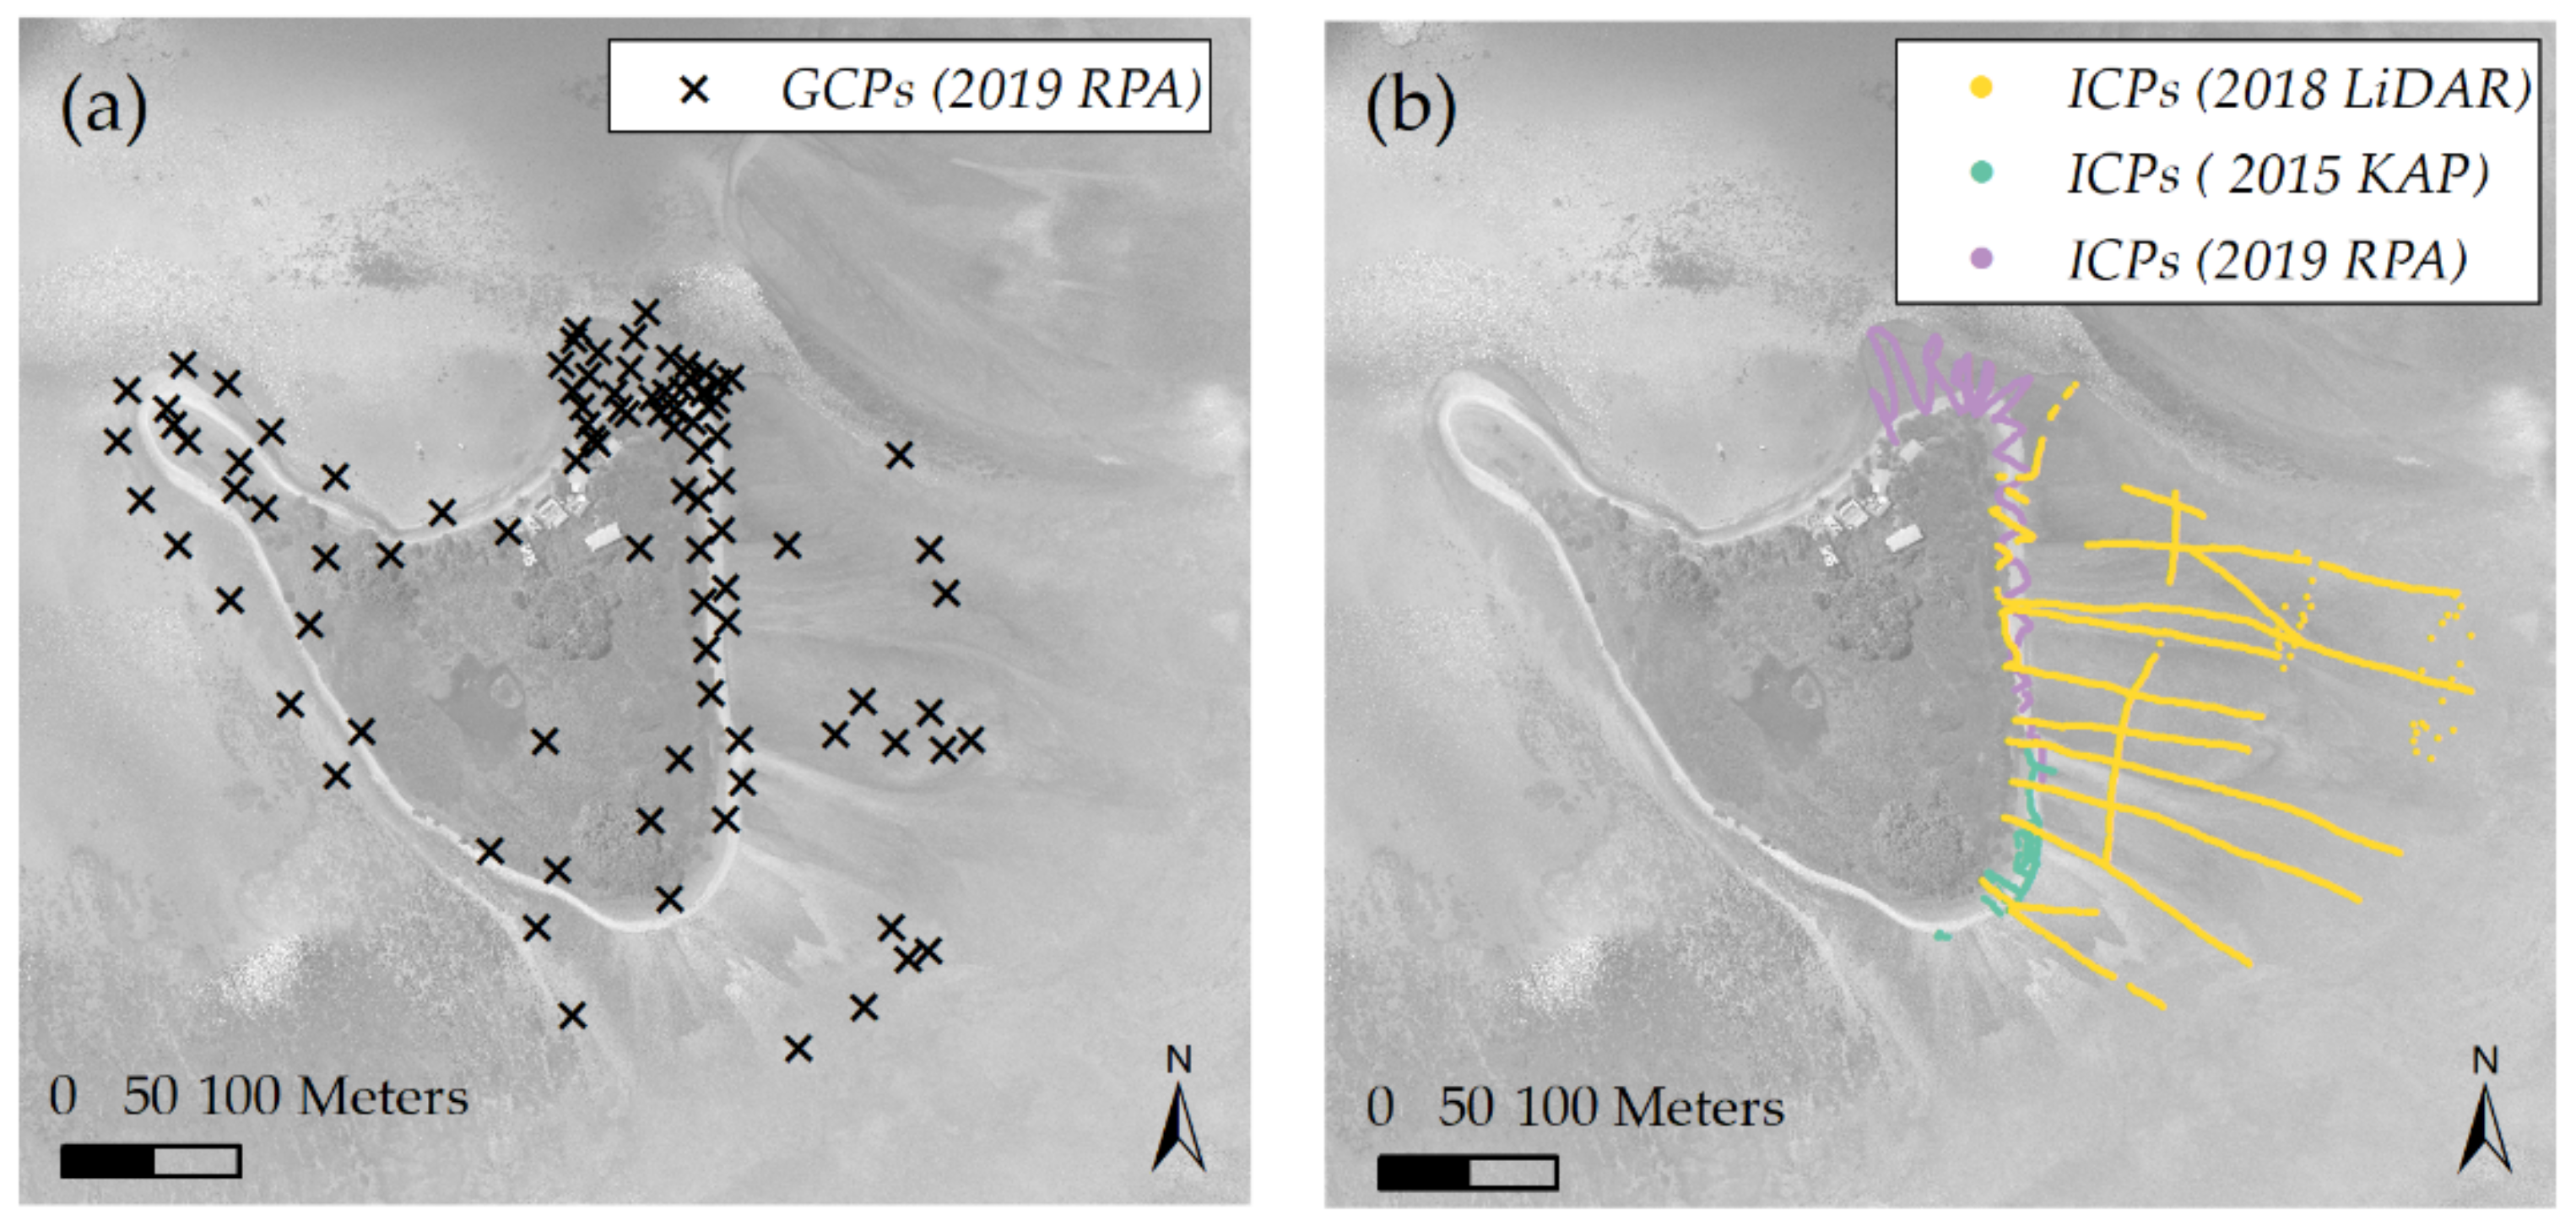
The aerial photos were rectified using the 2009 satellite image and a minimum of 20 and 30 Ground Control Points (GCPs) for the 1978 and the 1964 and 1980 aerial photos, respectively (the reader is referred to the work of [9] for a detailed explanation of the geospatial techniques used). We used Structure from Motion (SfM) algorithms (Agisoft Metashape Professional software version 1.5.3) to obtain topographic data from the KAP and the RPAs photos (i.e., DEMs and orthomosaics) during low tide. We used different GCP configurations to orient, scale, and georeference the images and the subsequent 3D models and mosaics generated (Figure 3a) to the Australian Height Datum (AHD). Careful visual inspection of each dataset was undertaken to ensure that the potential GCPs (e.g., blocks) did not vary spatially and provided accurate georeferencing. Lastly, we compared the computed elevation of the DEMs with the elevation of in situ Individual Check Points (ICPs) that were measured with the RTK-DGPS in the area to quantify their vertical accuracy and using the Add Surface Information tool in ArcMap (®ESRI) GIS software version 10.2 (Figure 3b).

3.2. Detection of Geomorphic Changes

We used different datasets to investigate both the decadal and short-term (annual) geomorphic evolution and morphodynamics of OTI. The errors considered for the planform measurements were those inherent in the resolution of the datasets used, which varied from 0.02 to 4 m, depending (Table 1).

3.2.1. Decadal Analyses

We investigated the planform morphological changes of OTI using two proxies: the edge of the vegetation and the outer island perimeter. The edge of the vegetated core of the island was digitized from available imagery at five-time steps (1978, 1980, 2009, 2018, and 2019). This metric provides a good representation of the island’s relatively stable vegetated core, allowing us to investigate its change in size. This is an important and commonly used proxy [3]; however, it does not capture changes to the more dynamic beaches and shoreline driven by short-term episodic events [29,30]. Thus, the outer island perimeter was also mapped, allowing the assessment of changes in the shape of the island and the island’s susceptibility to morphological change during the period of analysis. The perimeter was delimited using the transition line that separates the island beach from the reef flat (i.e., the toe of the beach, [31]). Furthermore, we digitized the outlines of the rubble spits and the featureless rubble sheets located near the island perimeter and over the reef flat using aerial photos and satellite imagery, and we complemented these with RTK-DGPS points measured at the ends of some rubble spits. All features used in this study were easily identifiable in the datasets listed in Table 1 and were manually digitized and stored as shapefiles.

3.2.2. High-Resolution and Short-Term Analyses

Analysis of available high-resolution DEMs (derived from the 2014 and 2015 KAP, 2018 LiDAR, and the 2019 RPA surveys) allowed the estimation of the rubble spit’s dimensions and dynamics, as well as the estimation of volumetric changes occurring along the rubble island shoreline. We obtained the rubble spit dimensions (volumes) by extracting individual rubble spits using the Surface Volume Tool from the 3D Analyst Tools and considering the mean elevation of the reef flat as the baseline surface reference (0.64, and 0.82 m, for the 2018, and 2019 datasets, respectively). Furthermore, we extracted evenly spaced profiles (every 10 m) using the Extraction Tool within the Spatial Analyst Tools, along the rubble spits to investigate potential time-dependent migration.
The patterns and volumes of rubble erosion/accretion were obtained by computing DEMs of difference (DoDs) with consecutive DEMs (2014 and 2015 KAP, 2018 LiDAR, and 2019 RPA). This was done on a cell-by-cell basis (the outputs were exported from Metashape using 0.20 m resolution) and using the Raster Calculator tool. To eliminate the noise inherent in each of the DEMs and improve the estimations of geomorphic change, we propagated the vertical errors of the DEMs as uncertainties in the computed DoDs using Equation (1) [29]:
u DoD = z new 2 + z old 2
where, u DoD is the propagated vertical uncertainty, and z new and z old are the associated RMS vertical errors of each DEM. In this way, computed changes under the imposed threshold were excluded from the analyses.
Table 2 depicts the Root Mean Square (RMS) vertical errors exhibited by each high-resolution dataset (2014–2019). It must be noted that these DEMs (2014 and 2015 KAP and 2019 RPA) were built and assessed using a limited amount of GCPs and/or Individual Check Points (ICPs), respectively. However, we consider the vertical accuracies to be sufficient for investigating the geomorphic changes at the study site, as we expect the magnitude of those changes to be beyond those values (as those recorded by [14] in the southern shoreline at OTI); and furthermore, we are interested mainly in quantifying changes that are generally greater than 20 cm.
All the datasets used and the different geomorphic change analyses performed at OTI are shown in Table 3.

3.3. Hydrodynamic Data and Cyclones

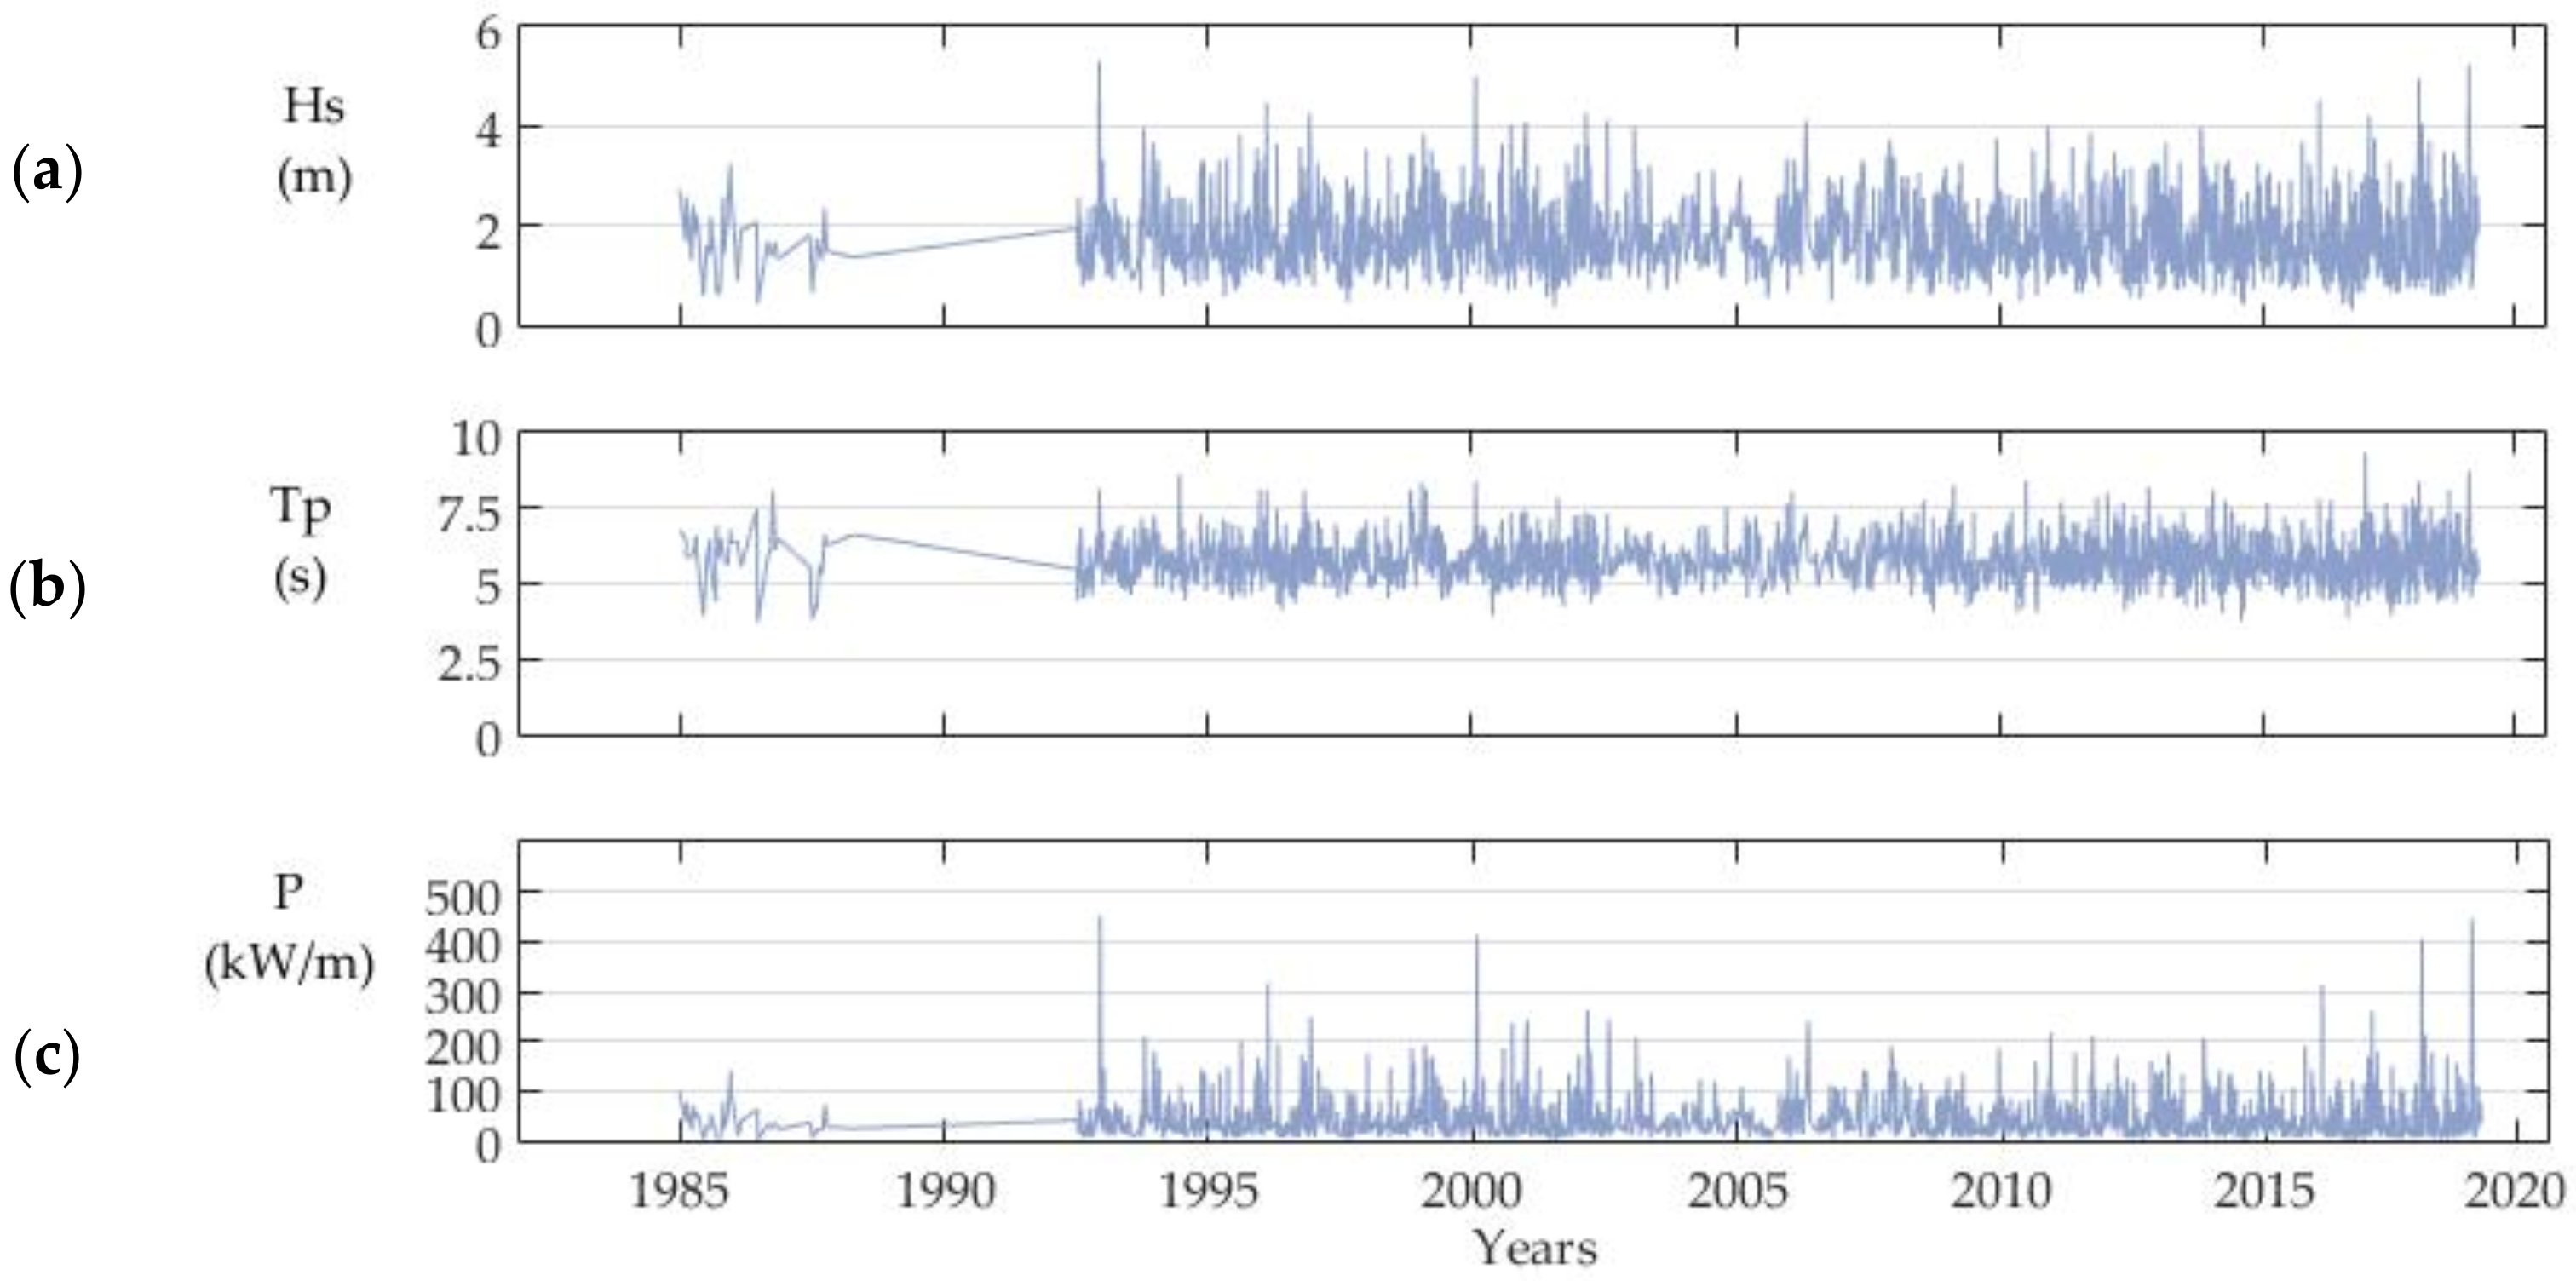
We coupled the geomorphic changes detected at OTI with time series of significant wave height (Hs), wave peak period (Tp), and wave power (P), paying special attention to changes derived from the impact of tropical cyclones. We used wave time series derived from satellite altimetry data extracted by RADWave [30] (Figure 4) for the Capricorn Bunker Group (CBG) (Southern Great Barrier Reef) from 1985 to 2019. There was a significant data gap from 1989 to 1991, due to no operating satellites, with data frequency and spatial coverage increasing considerably after this time.
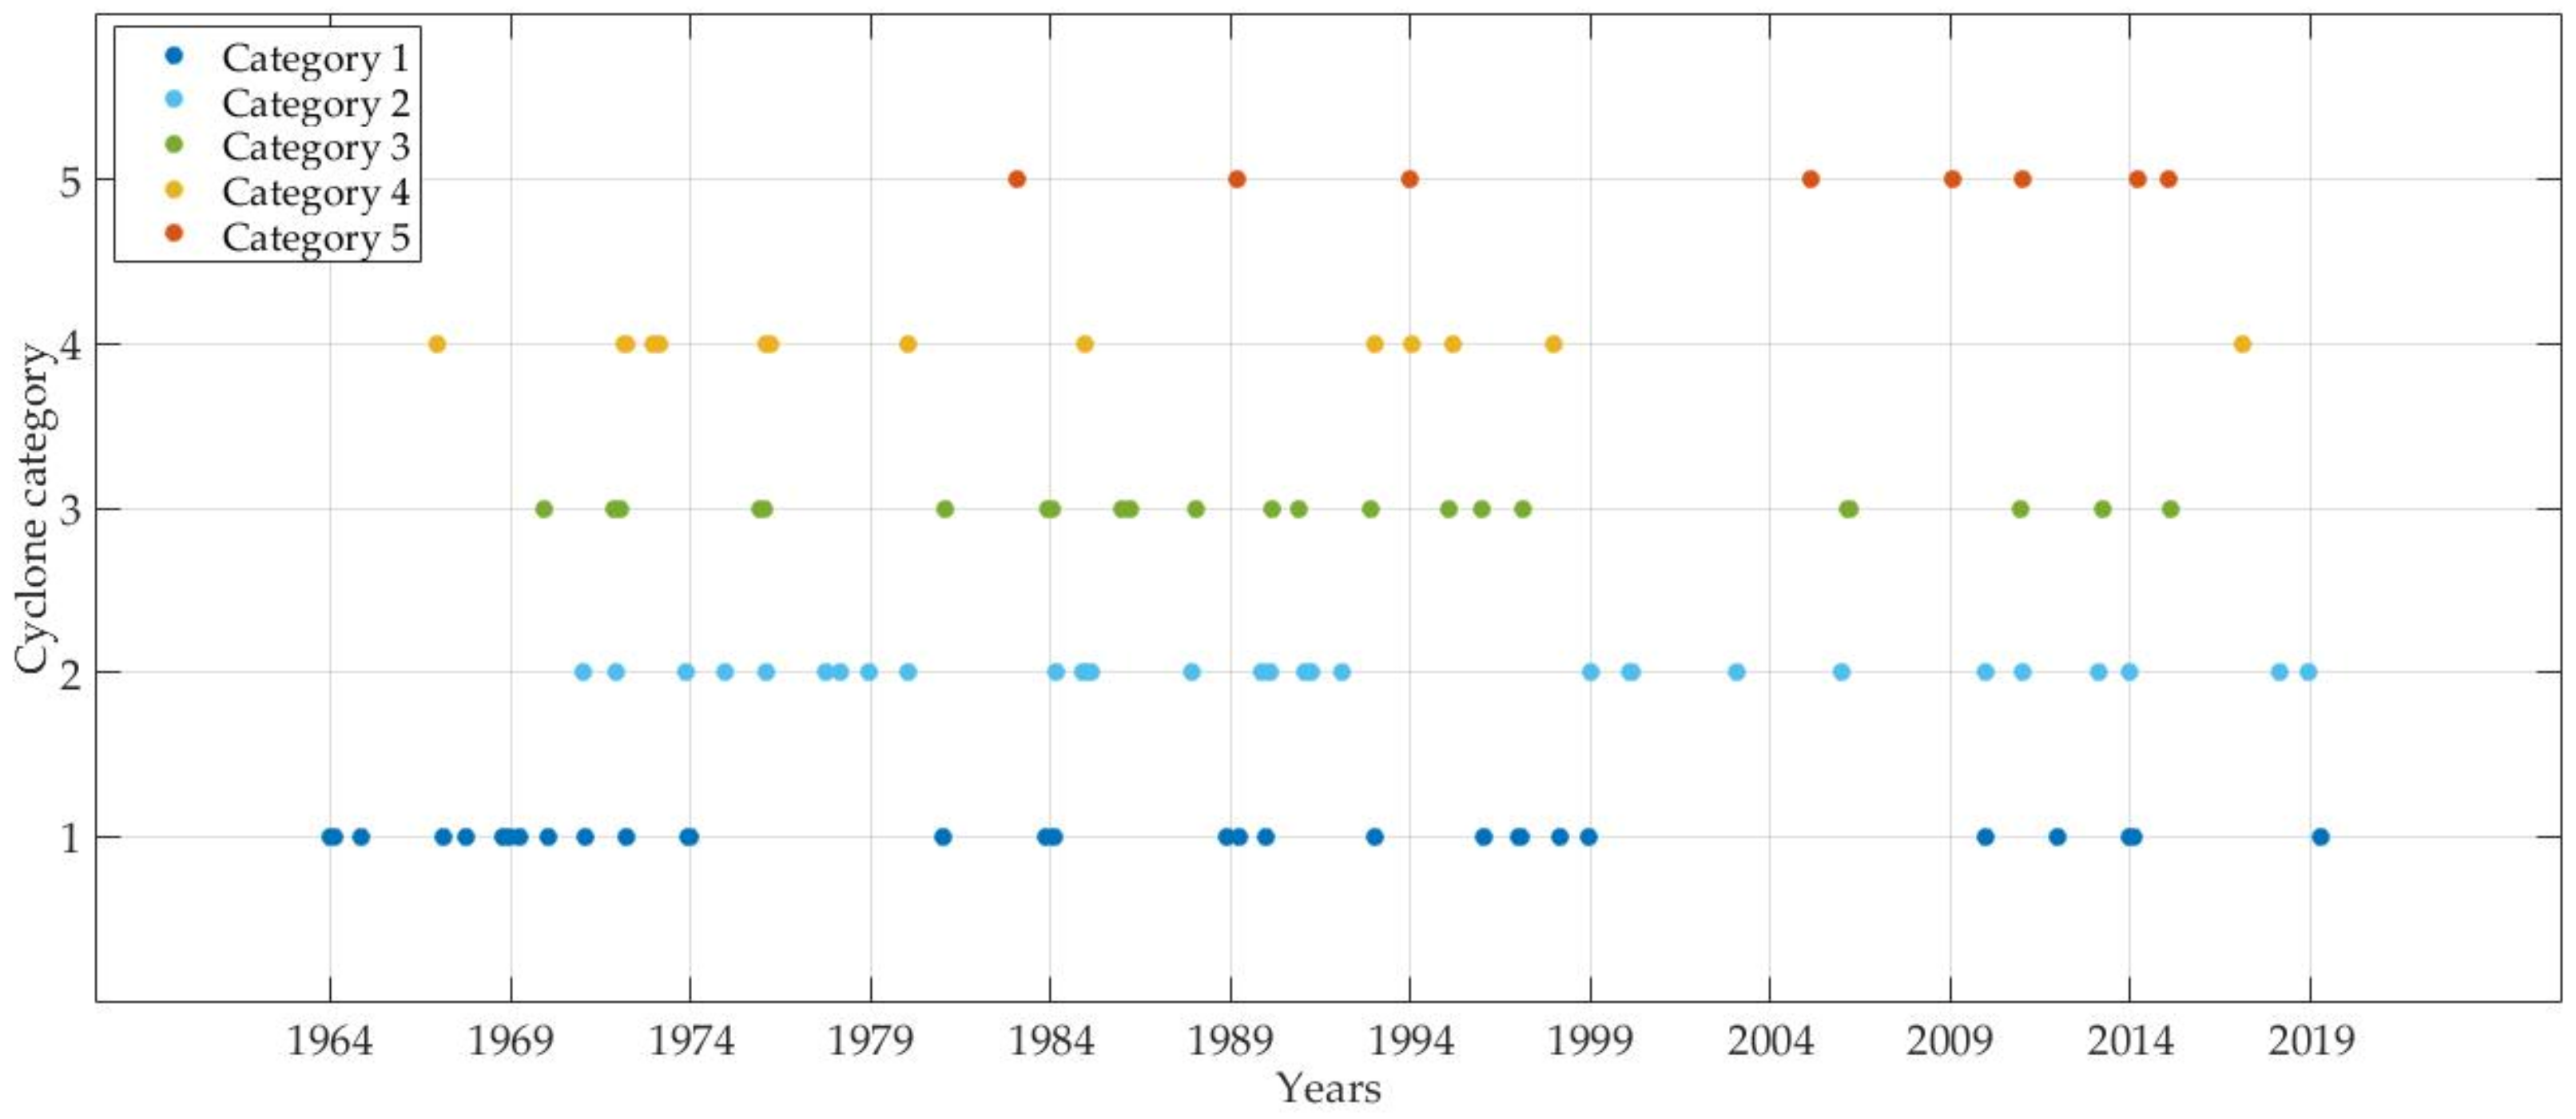
Tropical cyclones track data were obtained from a database from the Australian Bureau of Meteorology (BOM) (http://www.bom.gov.au/cyclone/history/) and were categorized (from 1 to 5) according to their wind speeds (maximum mean wind speeds of 63–88, 89–117, 118–159, 160–199, and above 200 km/h, corresponding to Categories 1, 2, 3, 4, and 5, respectively). A total number of 118 cyclones were tracked in the Great Barrier Reef (GBR) from 1964 to 2019; however, only 109 were analyzed as the remaining nine were not considered cyclones when passing close to OTI. The entire list of cyclone names, dates, and categories is in the Supplementary Materials (Table S1). Due to the non-continuous nature of the wave time series (Figure 4), our data may not reflect some of the cyclone peaks of wave energy (Figure 5); equally, the datasets might not reflect the waves generated by distant cyclones beyond the Capricorn Bunker Group.
To improve our understanding of the mechanisms and the magnitude of the hydrodynamic forcing responsible for inducing geomorphic changes at OTI, we visually compared the changes recorded in the different available datasets with the number and intensity of cyclones and the accumulated wave power of each stage of planform change identified. Moreover, we analyzed the spatial tracks and changing strength of key cyclones through the GBR. This allowed us to better characterize the effect of cyclone proximity/distance in relation to the specific island changes recorded (all the spatial cyclone tracks are included as Supplementary Materials in Figures S1–S5). Lastly, we looked at climate oscillations such as El Niño-Southern Oscillation (ENSO) and rates of sea-level rise as drivers of island change and evolution.

4. Results

4.1. Decadal Geomorphic Changes

4.1.1. Island Planform Changes

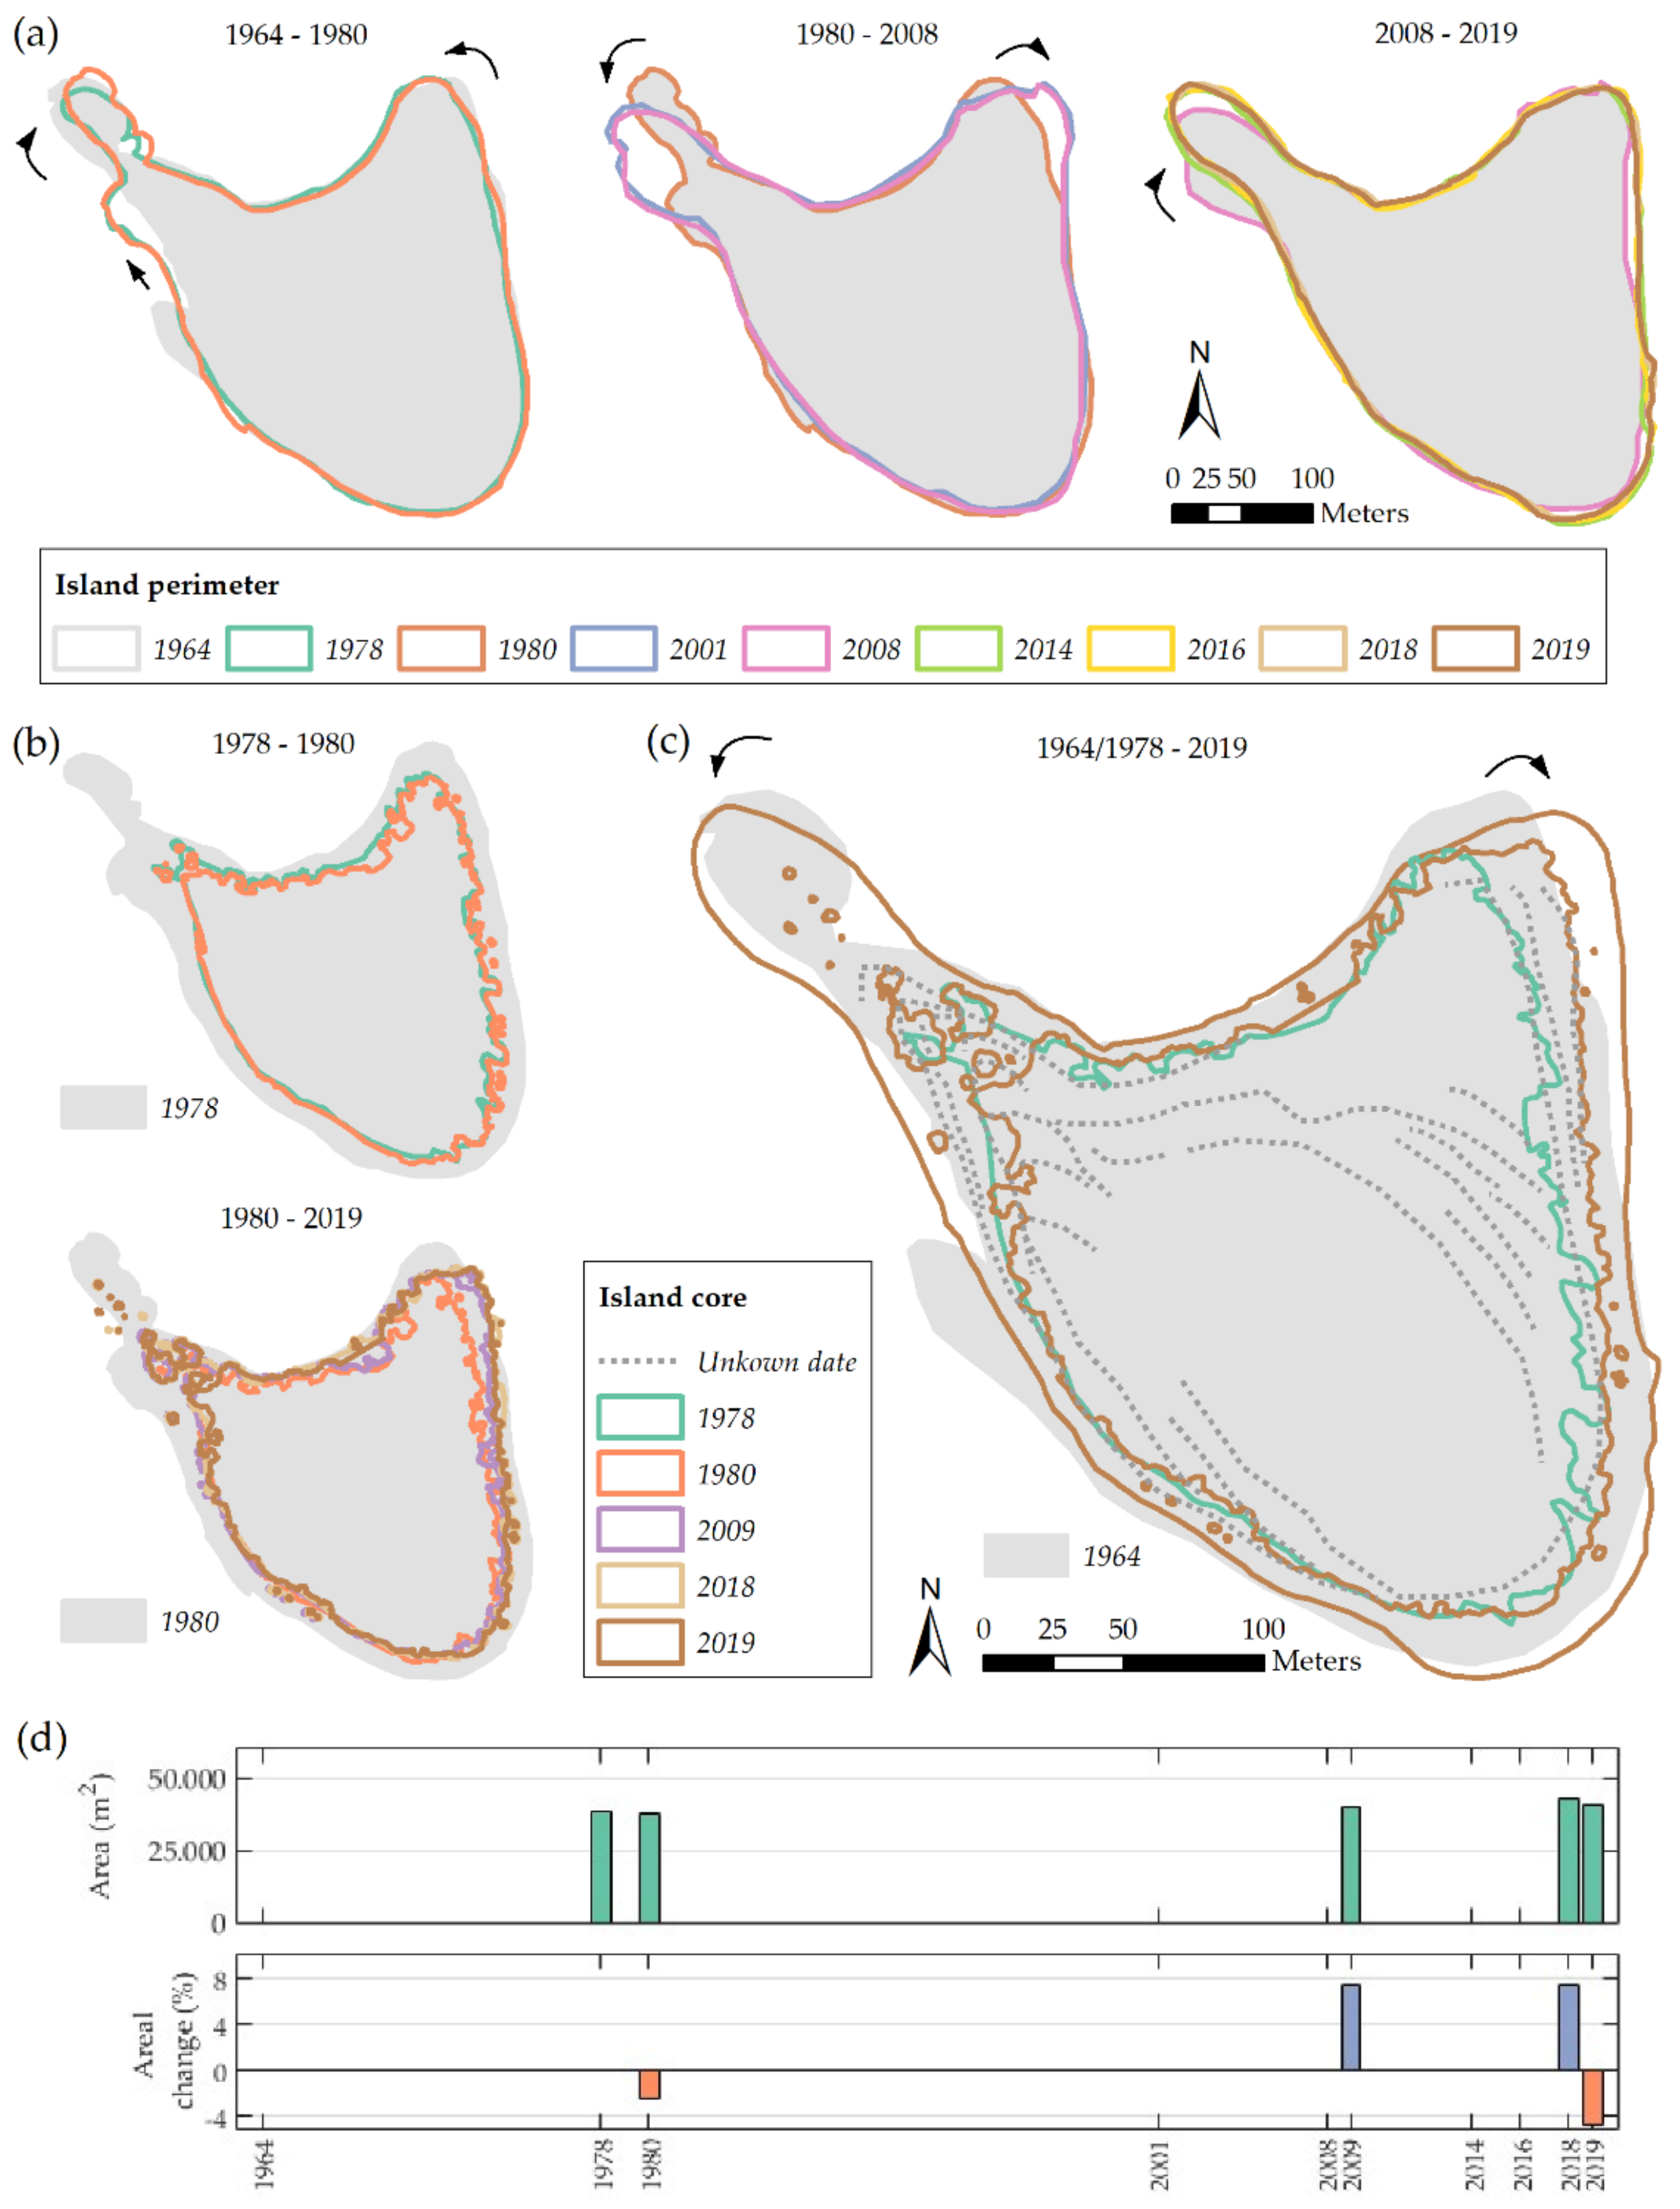
The digitized planform changes revealed that between 1964 and 2019, the island perimeter alternated between different stages of mobility and relative stability. From 1964 to 1978, rubble was transported along a distance of 64 m through the W island margin towards the NW, and the NW spit of the island showed some clockwise rotation, with a shoreline displacement that ranged from 8 to 15 m (Figure 6a).
Contrary to this, the NE spit experienced an anticlockwise rotation which was translated to the erosion of the NE and E island shorelines that ranged from approximately 4 to 10 m (Figure 6a). The southern shoreline of the island eroded slightly (4 m) and showed subtle and localized progradation in a small area to the W of around 6 m. The NW spit rotated clockwise again between 1978 to 1980, with maximum shoreline displacements of 15 m, and there was also slight progradation along the W as well as along the NE and E shorelines (with maximum displacements of 6 and 7 m, respectively) (Figure 6a). The greatest mobility in the island perimeter was observed between 1980 to 2001, which also represents the longest time span between images. During this period, both the NW and NE spits showed the greatest anticlockwise and clockwise rotations with maximum shoreline displacements of 40 and 22 m, respectively. In addition, there was erosion along the SW, S, and SE shorelines of up to 10 m. During the period from 2001 to 2008, the island remained stable, with a slight progradation of the southern shoreline (6 m) and the NW spit experiencing an anticlockwise movement of much less magnitude than the previous one observed (1980–2001) (~5 against 40 m, respectively). Interestingly, from 2008 to 2014, both the NW and NE spits experienced a clockwise shift (much more accentuated in the former) with shoreline displacements of 40 and 4 m, respectively. This led to an average progradation of 10 m along the NE and E island shorelines; furthermore, the S shoreline also prograded clearly by up to 11 m at some points. The clockwise rotation continued until 2016, although the displacements recorded were much smaller than in the previous period for the NW spit (~6 m) and similar in the NE spit (NE shoreline prograded ~4 m). In addition, the E shoreline eroded by around 5 m, while along the S and SW shorelines, the erosion was minor (around 3 m). From 2016 onwards, no significant planform changes were observed (Figure 6a) with the exception of slight erosion along the S, SW, and W shorelines (up to 5 m) as well as a slight progradation localized in a small area to the east of the S shoreline (up to 5 m).
The net planform changes in the island perimeter during the study period (1964 to 2019) showed that the opposite rotation of the NW and NE spits translated into ~20 m of shoreline progradation in the NE spit and around 8 m in the NW spit. The SE and both the SW and W island margins experienced progradation (by 8 m) and shoreline erosion (around 7 m), respectively (Figure 6c). These net changes were small when compared to some of the cumulative gross shape changes observed, especially those from 1980 to 2001 (i.e., the anticlockwise and clockwise rotation of the NE and NW spits causing the shorelines to prograde towards the ocean by around 22 and 40 m, respectively).

4.1.2. Vegetated Island Core Changes

The vegetated island core remained stable from 1978 to 1980 (note that the vegetation line in 1964 was not easily distinguishable) with the exception of the N vegetation line that seemed to erode, although it cannot be clearly observed as the 1980 image was overexposed. Between 1980 and 2009, the core prograded clearly with maximum displacements of ~20 m along the NE margin that decreased towards the SE (Figure 6b). This progradation occurred in parallel to the clockwise rotation experienced by the island NE shoreline spit between 2001 and 2008. Progradation continued along the NE spit and the SE island shoreline until 2018, showing displacements ranging from approximately 3 to 12 m. From 2018 to 2019, the island core showed slight erosion along the NE, E, SE, and W shorelines (Figure 6b). The net planform changes of the island core showed more stability than the net change observed for the island perimeter, as the planform changes were confined to the NE, E, and SE vegetation lines, which experienced clear progradation ranging from 22 m in the NE to 10 and 7 m in the SE and S (Figure 6b). This translated into net growth of the island core (Figure 6c) by 7.2% (from 38,218 to 40,974 m2) in the 41-year period spanning from 1978 to 2019. The gross areal changes of the vegetated island core are shown in Table 4.
Further visual evidence supporting the growing trend of OTI was provided by the 2018 high-resolution LiDARDEM, as it allowed us to identify imprints corresponding to previous island contours or storm ridges of unknown dates, which were also digitized (dotted black lines in Figure 6c). Despite the general net growing trend observed, the areal extension of the island core at OTI had experienced both gross increases and decrease during the investigated time period. For instance, it grew by 7.4% both in the 29-year period spanning from 1980 to 2009, and the 9-year period from 2009 to 2018. However, from 1978 to 1980 and from 2018 to 2019, the island decreased in size by 2.4% and 4.8%, respectively (Figure 6d). Similar to the gross changes observed in the island perimeter, these island core size fluctuations could respond to varying forcing conditions, including seasonal rainfall as well as high energy events such as cyclones likely playing an important role.

4.1.3. Featureless Rubble Sheets and Rubble Spits

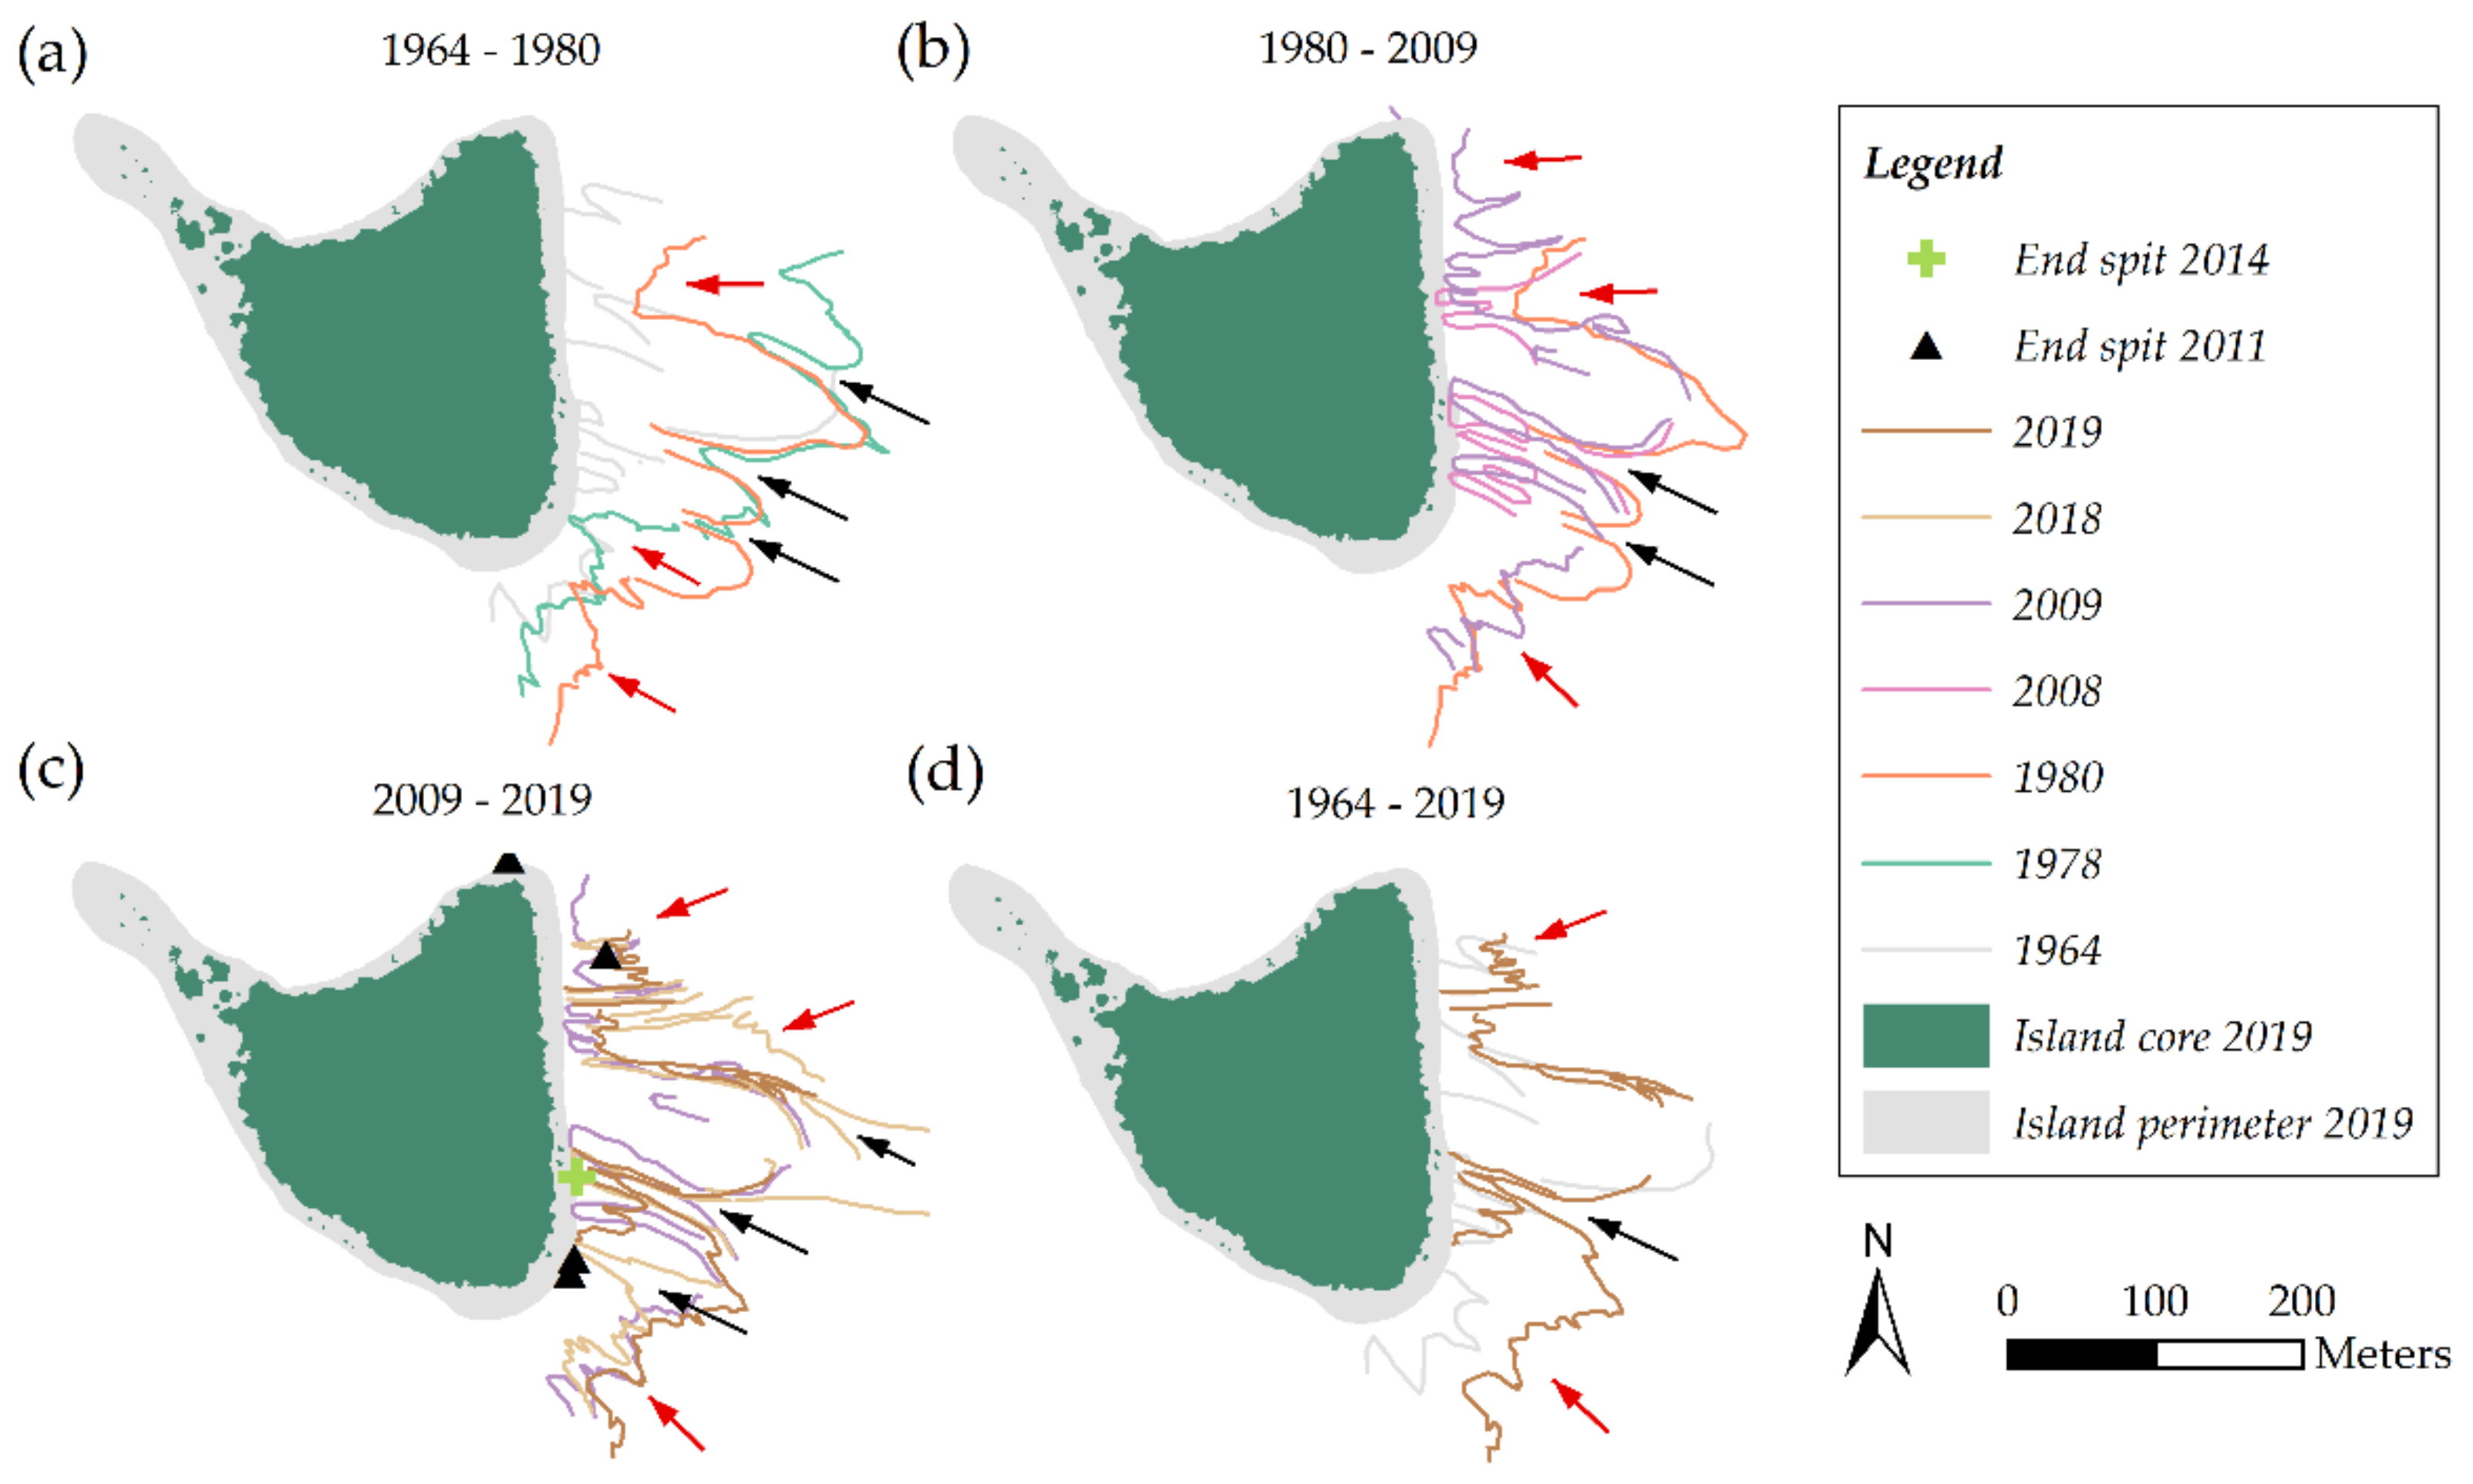
Our analysis of the satellite imagery and orthomosaics showed transport of rubble across the reef flat lagoonwards during the entire analyzed period. From 1964 to 1980 (Figure 7), featureless rubble sheets and well-defined rubble spits could be seen approaching the island (see red and black arrows in Figure 7). Notably, the progradation of some of the rubble spits occurred from 1978 to 1980. For instance, the upper rubble spit in 1978 (pointed by the upper black arrow, Figure 7a) prograded by around 80 m by 1980. The progradation of featureless rubble sheets was also evident, such as those located in the northern area of the rubble flat prograded by around 50 m from 1980 to 2009 (Figure 7b). Interestingly, we observed that the location of some rubble spits from 1980 to 2009 did not seem to vary significantly from the previous years (see the black arrows, Figure 7b). RTK measurements performed over the spit ends in 2014 (see the light green cross in Figure 7c, respectively) support this finding, which was not far from the position of some of the 2018 split ends. Moreover, the location of the 2011 spit end measurement coincided with both the 2018 and 2019 spit ends (see black triangle, Figure 7c). Additional evidence is provided in Figure 7d, which shows a rubble spit (see black arrow, Figure 7d) digitized in the same location in two datasets with a 55-year time difference (from 1964 to 2019); and moreover, it was present in this particular area in all of the analyzed datasets.
The high-resolution topography of the 2018 LiDAR and the 2019 RPA DEMs (Table 1) allowed us a deeper analysis of the dimensions and dynamics of four rubble spits, hereafter referred to as RS-A, RS-B, RS-C, and RS-D (Figure 8a). Their volumetric and areal characteristics are depicted in Table 5. However, it must be noted that volume and 3D area were only calculated for the parts of the rubble spits that coincided with the area of maximum accuracy (i.e., the striped white polygon in Figure 8), as in the area to the right of this polygon we did not use GCPs to georeference the RPA datasets (Figure 3a). Therefore, the volume and 3D area of the 2019 RS-C and RS-D spits were solely calculated for the corresponding spit parts falling within this polygon.
Between October 2018 and April 2019, the small rubble spits (RS-A and RS-B) decreased both in volume and area by 6.7 and 36.4 m3 and by 4.3 and 103.7 m2, respectively (Figure 8 and Table 5). In contrast, the largest spits (RS-C and RD-D) increased their area and volume (Figure 8), both of them enlarging their dimensions by more than 500 m2 (Table 5). The topography of the 2019 RS-C and RS-D (Figure 8b) confirmed that rubble spits prograde lagoonwards by rolling over themselves, confirming our interpretation of the decadal rubble spit changes mentioned before. The studied rubble spits also migrated northwards between 2018 and 2019, with mean migration rates of 4.2, 3.9, and 6 m/year for RS-A, RS-B, and RS-D, respectively (Figure 9). These results indicate that the rubble arrival to this particular area of the rubble flat contributed to both rubble spit progradation and growth (as observed in RS-C and RS-D, Figure 8b and Table 5); they also indicate that the rubble may have experienced remobilization, causing the previously estimated decrease in rubble spit dimensions (RS-A and RS-B, Table 5), as well as the observed spatial migration of rubble, spits towards the north (RS-A, RS-B, and RS-D, Figure 9).

4.2. Short-Term Patterns of Rubble Erosion and Accretion

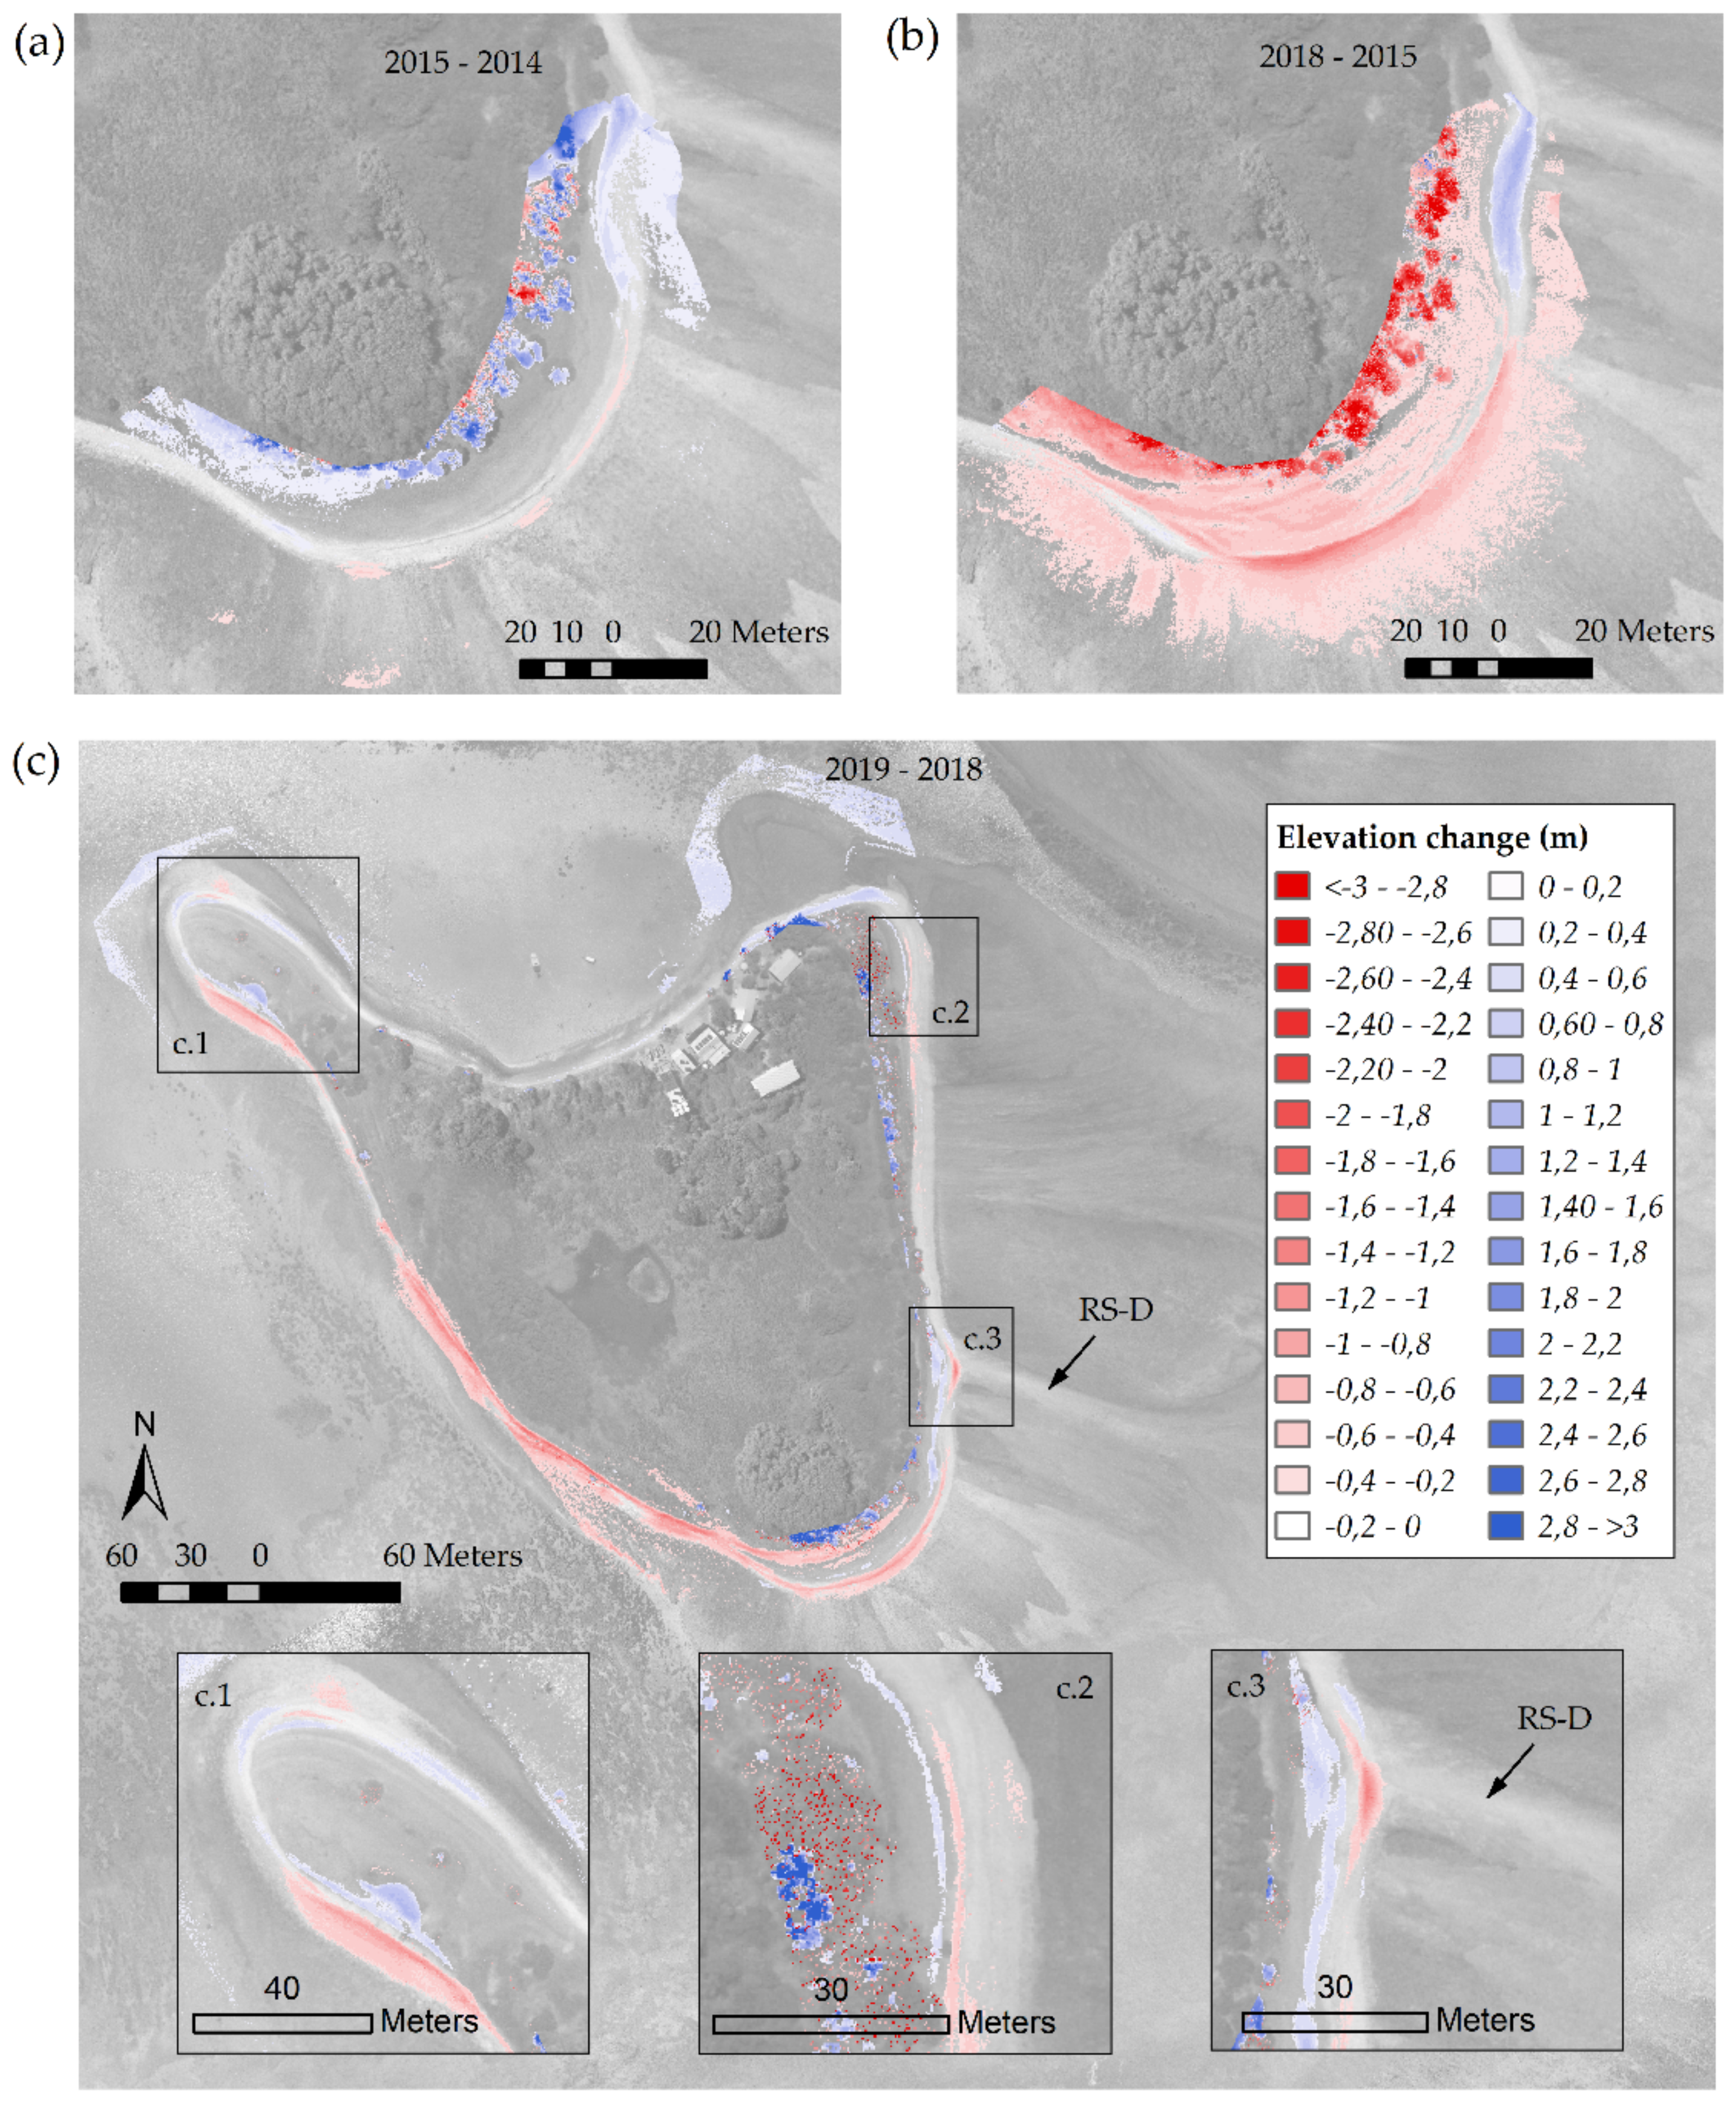
From 2014 to 2015, the southern island shoreline eroded slightly, showing vertical erosion values ranging from 0.22 to 0.46 m (see red areas in the computed DoD, Figure 10a). On the other hand, accretion of rubble occurred at both the distal shoreline ends; the western one showed magnitudes of deposition that varied from 0.28 to 0.52 m, and from 0.24 to up to 1.35 m on the eastern one (blue areas in Figure 10a), as well as in a small area located on the adjacent rubble flat (accretion up to 0.70 m, Figure 10a). In general, the most pronounced geomorphic changes along the southern margin of OTI occurred from 2015 to 2018. During this period, parts of the shoreline showed minimum and maximum erosion depths of 0.27 m and 1.40 m, respectively. In addition, the rubble flat close to the island shoreline was also affected, exhibiting vertical erosion changes ranging from 0.27 to 0.56 m. Rubble deposition was again localized at both distal ends of the southern shoreline, with smaller accretion thicknesses on the western margin (varying from 0.26 to 0.51 m) than on the eastern one (varying from 0.27 to 1.23 m, Figure 10b).
The patterns of geomorphic change recorded along the southern margin of OTI from 2018 to 2019 were also in congruence with those described for the previous years (see Figure 10c). The rubble was eroded along the entire shoreline and also close to the end of RS-D, showing vertical depths of erosion of up to 1.64, 1.0, and 1.30 m in the west, central, and east areas, respectively. The accretion patterns observed showed thicknesses ranging from 0.32 to 0.50 m in the central region, up to 0.9 m in the eastern margin, and adjacent to the RS-D end. Our results showed that during the analyzed period (2014 to 2019), the southern margin of OTI underwent mostly erosion, with only minor accretion. In addition, the observed spatial patterns of rubble erosion/accretion seemed to be maintained throughout the years; however, their magnitude, as well as the extension of the areas affected varied, again probably linked to variations in the hydrodynamic conditions.
Additional geomorphic changes detected along the rest of the island from 2018 to 2019 included erosion along the western shoreline margin (depths up to 1.8 m, Figure 10c), as well as rubble erosion/accretion linked to wave overtopping (see these areas highlighted in black squares in Figure 10c), which are indicative of localized island vertical growth. Interestingly the wave overtopping patterns displayed in Figure 10c(c.3) suggested that the rubble spits not only contributed to the previously mentioned north-east shoreline progradation and subsequent island planform growth but also to the delivery of rubble to OTI island and its aggradation process.

4.3. Cyclones and Wave Power in the CBG

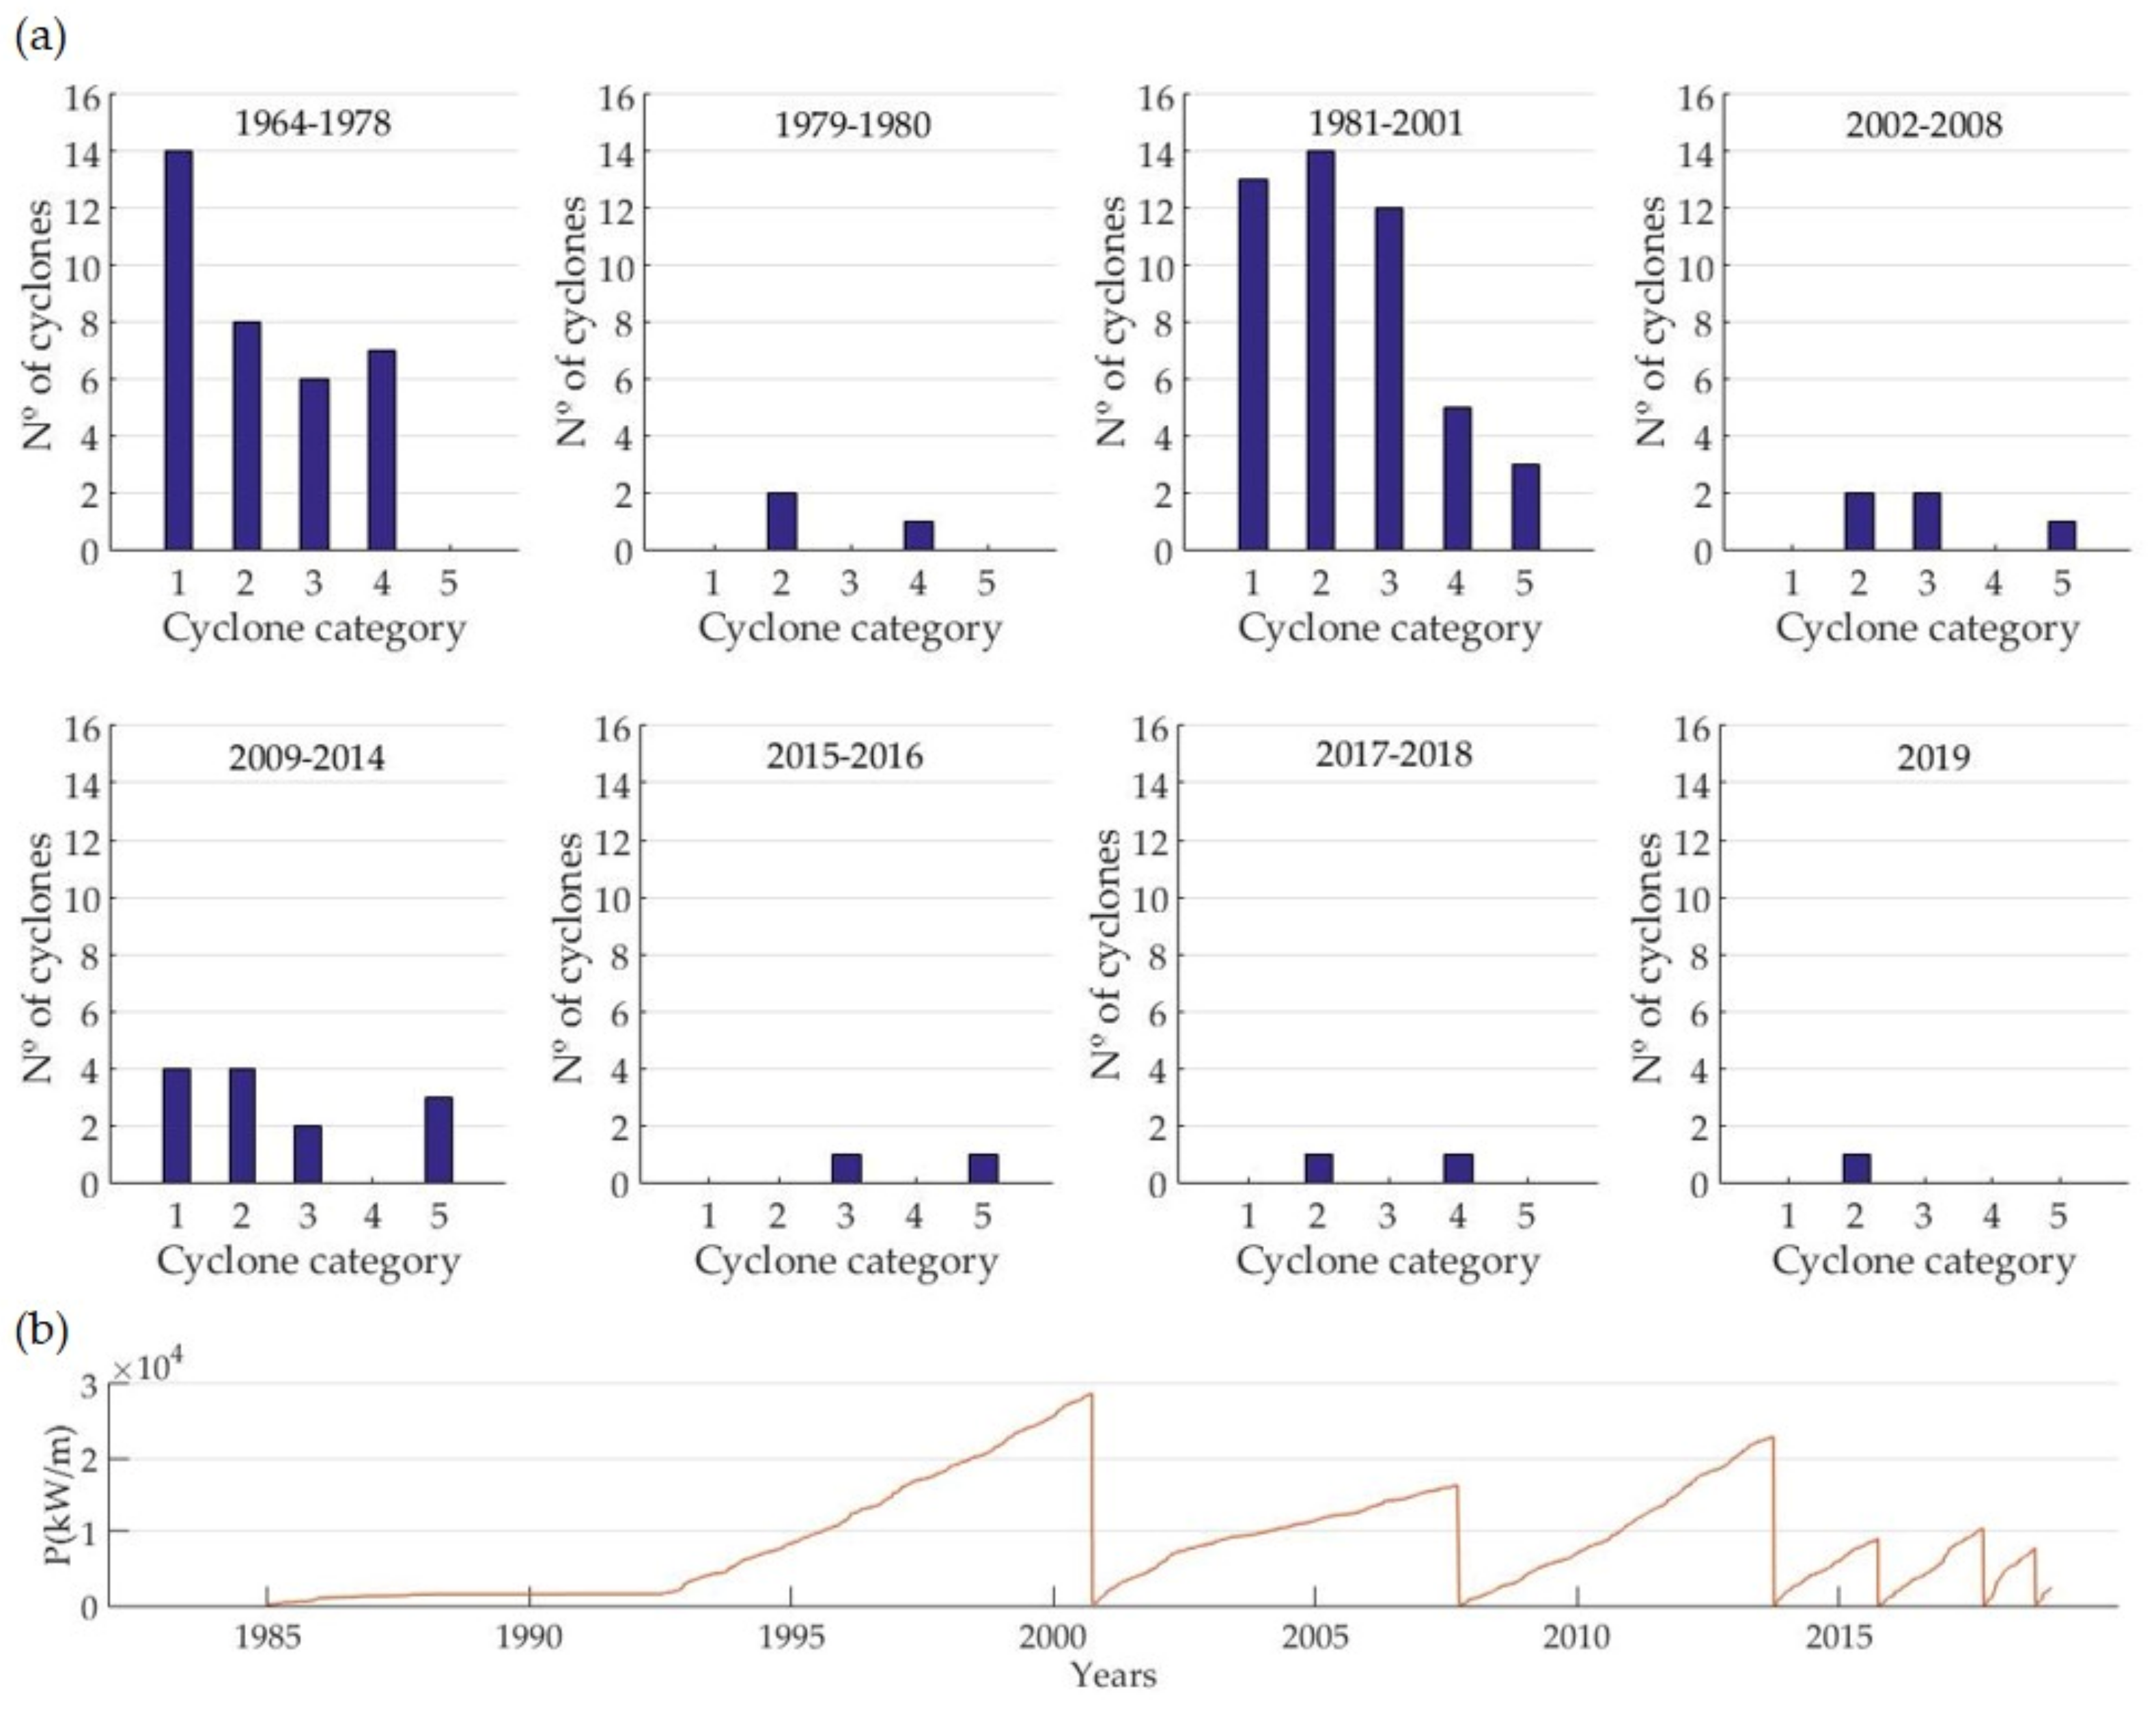
Figure 11a shows the number of cyclones recorded in the GBR during the different periods of planform island geomorphic change analyzed (Figure 6a) and the maximum categories they reached. The accumulated wave power during the different periods is in Figure 11b. Generally, during the longer periods analyzed, the accumulated wave power peaks were higher, and subsequently, the planform changes in the island perimeter were more pronounced. For instance, during the 14-year period spanning from 1964 to 1978, we observed a clockwise and anticlockwise rotation of the NW and NE spits, respectively, of smaller magnitude than the opposite movement that both spits displayed in the following 20-yr period from 1981 to 2001 (Figure 6a). This more pronounced planform change from 1981 to 2001 may be explained by the higher number of cyclones measured in comparison with the previous period (47 versus 35, respectively, Figure 11a; see also the higher peak of accumulated wave power, Figure 11b). In addition, there was an increase in cyclone intensity as three Category 5 cyclones were recorded between 1981–2001, while in the previous periods (1964–1978 and 1979–1980), no Category 5 cyclones were measured (Figure 11).
This increasing trend in cyclone intensity during the whole period of study could also be observed (Figure 5), with an increase in Category 5 cyclones from 2005 onwards.
We obtained additional evidence of the influence of the number and intensity of the cyclones in the planform geomorphic changes in OTI when comparing both the 6-year and 5-year periods spanning from 2002 to 2008 and from 2009 to 2014, respectively. Only five cyclones occurred between 2002 and 2008 (Figure 11a), and the geomorphic changes were small (subtle anticlockwise rotation of the NW spit with shoreline displacements of 5 m and a slight progradation of the southern shoreline, Figure 6a). In contrast, between 2009 and 2014, there were thirteen cyclones (including three Category 5 cyclones, Figure 11a), leading to larger wave power in this period (Figure 11b) and more pronounced planform changes along the island perimeter (significant clockwise shift of the NW spit and slight progradation of the NE, E and S island shorelines, Figure 6a).
Our results show that the number and intensity of cyclones have influenced the evolution of OTI during the investigated period; the proximity of these cyclones to the island is also an important aspect to take into account. The 1-year periods spanning from 1979 to 1980, and from 2015 to 2016 were characterized by three and two cyclones tracked within the GBR and nearby One Tree, respectively: two of Category 2 and one of Category 4 (named Severe Tropical Cyclone Simon); and one of Category 4 and one of Category 5 (named Severe Tropical Cyclone Marcia) during the second (Figure 11). One may expect more accentuated island geomorphic changes during the second period, as despite there being fewer cyclones, their intensities were higher. Nevertheless, the clockwise shift of the NW spit was more accentuated in the former (15 m of shoreline displacement versus 6 m between 2015 and 2016) (Figure 6a). When looking at the tracks of the most intense cyclones in both periods, cyclone Simon (1980) passed closer to OTI than Marcia (2015) did (Figure 12), triggering planform geomorphic changes in the island that could be easily observable (Figure 6a) even though it was categorized as a Category 3 cyclone at that time. These findings confirmed the importance of cyclone proximity in the evolution of OTI.

5. Discussion

5.1. OTI Has Increased Its Size during the Past 41 Years

The 7% increase in the net area experienced by OTI’s vegetated core represents an addition of 2800 m2 (or 0.28 ha) of land to the initial island core configuration in a 41-year period (it was 3.8 Ha in 1978), which corresponds to an approximate decadal rate of change of +1.75%. This expansion was not homogenous along the entire island perimeter, but rather, it was limited to the NE island margin. Trends of island growth have also been documented in other islands of the world over the past decades. For instance, 12 of a total of 27 islands analyzed in four different atolls in the Central Pacific Ocean (Funafuti, Tarawa, Pingelap, and Mokil) experienced growth of more than 3%, although these increases were more or less pronounced according to the duration of the time windows analyzed [31]. Additional atoll islands in the Central Pacific have also shown growing trends. This is the case at 33 out of the 52 islands investigated by [4] in the Wotje Atoll (Republic of the Marshall Islands), which also exhibited net island areal increases during a 65-year period (from 1945 to 2010). Further proof that atoll islands have been growing over the past decades was provided by [3] in a global study covering 30 Pacific and Indian Ocean atolls. They assessed planform changes in 709 atoll islands, revealing that no atoll lost land area and that 88.6% of islands were either stable or had increased their extent, while only 11.4% had contracted.
Worthy of note is that none of the previous works considered island composition (e.g., sand, gravel, and/or mixed sand-gravel) as a factor influencing possible variations in island behavior. Nevertheless, works such as [32] and [33] considered this factor in the analysis of island changes and evolution. Interestingly, the island growth exhibited in OTI maintains similarities with that observed in other rubble islands located in Funafuti Atoll. For instance, Avalau-Teafuafou island expanded by 9.7% from 1971 to 2013. The initial island size (1–5 ha), time window (42 years), and the magnitude of net island growth (9.7%) [32] were quite similar to the ones found in this study (3.8 ha, 42 years, and 7%, respectively); but perhaps the rubble island with the closest resemblance to OTI is Motuloa Island, Tuvalu. The initial area of this island was 3.8 Ha (1971), and it experienced a net areal increase of 5.88% during the 43-year time window (1971–2014) [33]. In addition, we have found comparable trends to OTI at some mixed sand-gravel islands in Tuvalu, such as Mateiko and Muliteatua Islands (in Nukulaelae and Funafuti Atolls, respectively). The initial size of both (1971) was 3.8 Ha, and both experienced an increase in area (6.34% and 3.56% for Mateiko and Muliteatua, respectively) during a 43-year period (1971 to 2014) [33]. Even though the evolution of OTI matched those of other rubble islands of similar size, we cannot extrapolate the observed trend here to every similar rubble island as the patterns of atoll island planform change are atoll-and island-specific [3], and individual island trends may also depend on their relative leeward and/or windward locations within atoll sides [34]. In fact, small islands such as OTI (<5 ha) have been found to experience contrasting areal changes that either include stability, increase, or decrease in size [3]. Our results also showed that OTI experienced gross changes slightly greater (up to 7.4%) than the total net changes (7.2%), and this was consistent with other studies [31]. In fact, OTI has likely experienced much greater gross changes than those we measured due to the temporal resolution of the available datasets. Our results show that OTI is a geomorphically unstable rubble island; however, as pointed out by other authors in other areas of the world, that does not necessarily make it prone to disappearance [31].
The topographic contours in the high-resolution 2018 LiDAR (Figure 6 and Figure 7) revealed the planform changes defined by the evolution of the island. According to the literature [12,35,36], rubble cays begin their existence as a storm deposit that then expand in size to become cays. The innermost contours in the LiDAR would then correspond to one single deposit of material that could have been formed during one ‘pulse’ event. Afterward, the arrival of sediment to the initial core of OTI and its accumulation led to island expansion and shoreline progradation along the two distinct spits located in the NE and NW (see the incipient spits in Figure 6c and Figure 7a), which prograded progressively towards the lagoon giving way to the formation of the present NE and NW spits. The dating of subsurface island material is required to verify this interpretation.
Our data revealed that during the study period (1964–2019), the island perimeter exhibited six stages of mobility at different magnitudes (1964–2016) and two stages of stability (2016–2018 and 2018–2019). The mobility stages were mostly characterized by planform adjustments of the NW and NE spits, which behaved differently, and to a minor extent, the erosion or progradation of the island shorelines. The period from 1964 to 1978 is the only stage of mobility in which the NE spit followed an anticlockwise rotation (shoreline displacement ranging from 4 to 10 m), as during the rest of the stages, it rotated clockwise with varying magnitudes (22 m from 1980 to 2001, 4 m from 2008 to 2014, and 4 m from 2014 to 2016) or remained stable (1978–1980 and 2011–2008) (Figure 6a). This clockwise rotation, together with the welding of rubble spits along the NE and E margin of the island (Figure 7), caused the progradation of the vegetation line (20 m in the period 1980–2008 and from 3 to 12 m in the period 2008–2018) (Figure 6b) and the subsequent expansion of the island core by more than 7% (Figure 6b,d). This expansion was only possible due to the availability and breakdown of rubble from the forereef and its transport across the rubble flat and towards the lagoon (the arrival of material is clearly evidenced by the rubble spits and featureless rubble sheets depicted in Figure 7).
The NW spit exhibited large planform adjustments and several changes in the direction of the rotation. For instance, it experienced clockwise shoreline rotation from 1964 to 1978, from 1978 to 1980, from 2008 to 2014, and from 2014 to 2016 (shoreline displacements of 8–15, 15, 40, and 6 m, respectively), whereas it showed anticlockwise rotation from 1980 to 2001, and from 2011 to 2008 (shorelines displacements of 40 and 5 m, respectively). The stability stages of the island perimeter (2016–2018 and 2018–2019) were characterized by no appreciable movement of any of the spits and a slight erosion of the S, SW, and W shorelines along the island perimeter. It is also in these periods of spit stability that there was erosion along the NE, E, SE, and W vegetation lines (Figure 6b), leading to the estimated island core decrease in size of 4% (Figure 6d).
The previous reflects that the most susceptible island features to exhibit morphological changes were clearly the NW spit and, to a lesser extent, the NE spit followed by the NE, E, and SE shorelines along the island perimeter. The varying changes in direction and magnitude of the spit shifts (especially those experienced by the NW spit) that characterized the different mobility and stability stages could be related to changes in the hydrodynamics conditions, such as variations in wave direction as well as the magnitude, amount, and proximity of cyclones. For instance, dominant wave energy from the S could trigger the clockwise rotation of the NW spit, while dominant wave energy from the N could trigger its anticlockwise rotation. Rubble islands exist in some form of equilibrium with the dominant wave conditions, which in the tropics are quite stable. The main factors of change in the wave climate correspond to local cyclones or large-scale weather phenomena such as ENSO. The following section discusses the possible oceanographic controls for island evolution.

5.2. Oceanographic Controls of Rubble Island Evolution

Our results from the coupled analysis of the amount and intensity of cyclones with geomorphic changes prove that periods of more abundant and intense cyclones typically coincide with periods of increased island planform adjustments and vice versa. [37] documented considerable impact to the reef at One Tree, including the substantial movement of rubble as a result of Tropical Cyclone Hamish, which passed 130 km east of One Tree as a Category 4, 1 March 2009. This cyclone could have been responsible for a considerable part of the 40 m shoreline change between 2008 and 2014. Our data have demonstrated that cyclone proximity to the islands could be a driver of coastal change of equal importance to the amount and/or intensity of cyclones. Note that a Category 3 cyclone passing less than one hundred kilometers away from OTI (Simon (1980)) triggered greater planform island change in OTI than a Category 5 cyclone which tracked much further (hundreds of kilometers) away (Marcia (2015)). Additional characteristics (such as cyclone duration and frequency), coupled if possible with DEM and orthomosaic data from immediately before and after the event, are required to better comprehend not only the magnitude of the observed island changes but also the styles of morphological readjustment over time.
Another factor to consider are climate drivers such as ENSO, which is a natural cycle in the Pacific Ocean temperatures, winds, and clouds that influence the worldwide climate. The positive (negative) phase of the ENSO is known as La Niña (El Niño) and in Australia results in the warming (cooling) of ocean temperatures which typically results in an increase (decrease) of cyclone numbers. The Southern Oscillation Index (SOI) measures the strength of El Niño and La Niña events, and the historical time series (available here: http://www.bom.gov.au/climate/enso/#tabs=Pacific-Ocean&pacific=History) shows that El Niño dominated from 2002 to 2007 while La Niña dominated from 2007 to 2014 (from 2010 to 2012 it was the strongest on record). The previous El Niño coincided with a fewer number of cyclones (five, Figure 11a) and subtle island changes recorded in the mobility stage from 2001 to 2008 in OTI (anticlockwise rotation of the NW spit by around 5 m and stable NE spit, Figure 6a), while La Niña coincided with a higher number of cyclones (thirteen, Figure 11a) and substantial island changes recorded in the mobility stage from 2008 to 2014 (clockwise rotation of both the NW and NE spits by 40 and 4 m, respectively, as well as erosion of the SW, S, SE, and E shorelines, Figure 6a). It is likely that during the previous El Niño event, the dominant wave energy came from the N (anticlockwise rotation of the NW spit), whereas during La Niña it did from the S, triggering its clockwise rotation. The previous also reflects that apart from the influence of the proximity of the cyclones on the magnitude of island geomorphic changes, the cyclone position relative to the island is an additional important aspect to consider as it could influence the styles of platform adjustment and result in either island expansion (cyclones approaching from the E or SE directions able to transport new or already existing rubble on the reef flat towards the island) or the island decrease in size (cyclones approaching from the N and eroding the N island shoreline).
Similar to OTI, other islands in the world have also been found to respond to inter-annual atmospheric phenomena such as ENSO [38,39] or those related to variable monsoon winds [11].

5.3. The Role of Rubble Spits and Overtopping on the Short-Term Evolution of Rubble Islands

The southern shoreline at OTI showed a slight net progradation towards the ocean during the last decades; in contrast, the high-resolution and short-term analyses (2014–2019) indicated that erosion was happening in this region of the island, as illustrated in the computed DoDs (Figure 10). Localized erosion on atoll islands is typically counteracted by progradation on other island parts through alongshore sediment transport, which is known to dominate shoreline change in some atoll islands [31]. The northward migration of rubble spits observed in our results supports this alongshore transport of material as the short-term mechanism by which rubble has been transported towards and accumulated in the proximity of the NE spit of the island during the past years. This northwards transport of rubble likely contributes to the observed long-term shoreline progradation towards the ocean of the NE and E shorelines, as well as to the expansion of OTI (Figure 6b).
Previous studies suggested that the vertical build-up of rubble as spits growing on top of each other could contribute to the formation of rubble islands [9]. Our results suggest that when rubble spits are attached to an already formed island (as it is the case of RS-D, Figure 8 and Figure 9), these rubble spits may also ‘feed’ the island directly with rubble, contributing to their vertical build-up through wave overtopping (as depicted in the patterns of rubble erosion/accretion in the DoD of Figure 10c (c.3)). While detailed studies of overtopping rubble islands are not widely reported in the literature, it is important to note that other authors have established wave overtopping as one of the main mechanisms of accretion in gravel barriers [40]. These rubble spits could either grow with the arrival of new rubble from the forereef or with previously eroded and reworked rubble from the island shorelines. More research is needed looking at attached rubble spits as possible mechanisms involved in island aggradation and growth through wave overtopping.

5.4. Effects of Climate Change on Rubble Island Evolution

The rise in sea level is one of the consequences of climate change, and island erosion is expected to occur; however, numerous works have shown that many islands of the world have remained stable or even increased their size during periods in which sea level has been rising. For instance, 85% of the 27 atoll islands analyzed by [31] in the Central Pacific remained stable or increased their areas, experiencing a rate of sea-level rise of 2 mm/year. Similarly, [4] observed that the shorelines in different islands on Wotje Atoll (Republic of Marshall Islands) have largely accreted since 1945, again under conditions of rising seas. In addition, numerical modeling simulations have shown that gravel islands such as Fatato Island (Funafuti atoll, Tuvalu) both accrete and retreat lagoonwards, in response to Sea Level Rise (SLR) through wave overtopping, which is considered as the primary mechanism for vertical island accretion [41]. On the other hand, other studies suggest that many islands in the Pacific will be uninhabitable in only decades [42]. In fact, in the Solomon Islands [6] it has been documented that five vegetated reef islands (1–5 ha in size) have recently vanished, and a further six islands are experiencing severe shoreline recession, in some cases leading to the destruction of villages and the relocation of their communities.
OTI has expanded under a sea-level rise rate of 4.9 mm/yr based on measurements from a SEAFRAME tidal gauge station located at Rosslyn Bay since 1992 (BoM website: http://www.bom.gov.au/oceanography/tides.shtml). While there is no evidence that OTI would still expand under higher rates of sea-level rise, it must be noted that sea-level rise is only one of the factors triggering the physical adjustment of islands. Future work should include additional aspects such as variations in carbonate production and sediment generation, wave-reef interactions and sediment transport pathways, and extreme events such as cyclones and storms [43] to understand the future trajectory of OTI and other rubble islands under different climate change scenarios.
Climate change also brings increased sea surface temperatures (SSTs) and acidification. As temperature rises, the intensity of tropical cyclones is expected to increase between a global average of 2–11% by 2100 [44], and this may lead to greater changes in island extent and planform shape. However, the positive or negative impact of cyclones on the stability of rubble islands will rely on the availability and production of new rubble by the coral communities at the forereef [45], and coral productivity will be severely affected by increased SST and ocean acidification. In fact, simulations performed by [12] at Lady Elliot island predicted a linear decrease of 79% in carbonate production by 2100 on the reef, which was consistent with the findings of other works. In addition, [46] reported an acceleration in the degradation of coral reefs around lime-sand islands in the South China Sea, which may have exacerbated shoreline erosion. However, in the same way that storms trigger greater change over the decadal-scale than sea-level rise, marine heatwaves cause much more destruction over the decadal scale than slowly increasing SST and acidification. Recent marine heat waves have severely affected coral reefs of the world and this will intensify in the near future with climate change [47]. Bleaching events might lead to high coral mortality and dramatic island changes. For example, [2] described the sudden area increase of a rubble island after a bleaching event and how that island later reverts to its original size/shape in the absence of additional sources of rubble. Further research is necessary to understand the differences, if any, between the evolution of rubble and sandy coral islands in climate change scenarios.

6. Conclusions

The integration of varying remote sensing methods across different timescales performed in this study has improved understanding regarding the styles and process controls of geomorphic change at One Tree Island. Our analyses included decadal and annual evolution coupled with wave climate and led to the following conclusions:
  • One Tree Island is a morphologically dynamic island that has been growing since its initial formation. It grew by 7% in a 41-year period (from 1978 to 2019) while experiencing substantial net planform changes. The styles of net planform change included ocean progradation of the southern shoreline, as well as both the NE and NW spits, although we identified even greater gross directional shifts and adjustments happening in different stages.
  • Gross planform adjustments in rubble islands like One Tree are partly governed by the number and intensity of cyclones which in turn are influenced by the positive and negative ENSO phases as well as by their proximity and relative position to the island.
  • Rubble spits play important roles in island growth. Our study identified two mechanisms: (1) rubble spit welding to the island followed by wave-driven longshore transport to feed other parts of the island; (2) in cases where one end of the rubble spit was connected to the island, there was some evidence of overtopping processes contributing to island growth in elevation. The contribution of overtopping to the evolution of rubble islands requires further research.
  • Deciphering the future trajectory of rubble islands under a climate change scenario becomes a challenging task unless efforts are joined towards a complete understanding of the individual impacts of the controls involved on island change and evolution, which in turn will require more frequent quantitative island observations and monitoring. It is only building on that basis that we could better comprehend the impacts of those island controls combined, and the responses, in turn, may vary from island to island according to their own geological and ecological characteristics.

Supplementary Materials

The following are available online at https://www.mdpi.com/article/10.3390/rs13081582/s1: Figure S1: Cyclone tracks in the GBR (1964–1973); Figure S2: Cyclone tracks in the GBR (1973–1980); Figure S3: Cyclone tracks in the GBR (1980–1990); Figure S4: Cyclone tracks in the GBR (1990–2009); Figure S5: Cyclone tracks in the GBR (2009–2019); Table S1: List of cyclone names, dates, and categories.

Author Contributions

Conceptualization, L.T., A.V.-C. and J.M.W.; Data curation, L.T. and C.S.; Formal analysis, L.T., A.V.-C. and J.M.W.; Funding acquisition, L.T., A.V.-C., J.M.W. and J.H. (Jörg Hacker); Investigation, L.T.; Methodology, L.T.; Resources, C.S., S.D., T.E.F., T.S., D.H., J.H. (Jon Hill), W.F. and J.H. (Jörg Hacker); Software, L.T. and C.S.; Supervision, A.V.-C. and J.M.W.; Visualization, L.T. and C.S.; Writing—original draft, L.T.; Writing—review and editing, L.T., A.V.-C., J.M.W., C.S., S.D., T.E.F., T.S., D.H., J.H. (Jon Hill), W.F. and J.H. (Jörg Hacker). All authors have read and agreed to the published version of the manuscript.

Funding

Financial support of this research was provided by the Australian Research Council (DP120101793, FT100100215), the internal research plan of the University of Cádiz, and the University of York Research Priming Fund.

Institutional Review Board Statement

Not applicable.

Informed Consent Statement

Not applicable.

Data Availability Statement

The data presented in this study are available on request from the corresponding author.

Acknowledgments

Field measurements were taken over several field trips; we acknowledge the many students and volunteers of the Geocoastal Research Group that contributed to data collection. One Tree Island Research Station is a facility managed by The University of Sydney. Wave data were sourced from the Integrated Marine Observing System (IMOS)—IMOS is a national collaborative research infrastructure supported by the Australian Government. We would like to thank the Australian Centre for Field Robotics, in particular Mitch Bryson, for equipment, training, and assistance with the kite imagery. We also acknowledge Shakti Chakravarty for being the instrument operator in the research aircraft and the Hackett Foundation of Adelaide for substantially supporting ARA.

Conflicts of Interest

The authors declare no conflict of interest.

References

  1. Yates, M.L.; Cozannet, G.L.; Garcin, M.; Salaï, E.; Walker, P. Multidecadal Atoll Shoreline Change on Manihi and Manuae, French Polynesia. J. Coast. Res. 2013, 29, 870–882. [Google Scholar] [CrossRef]
  2. Kayanne, H.; Aoki, K.; Suzuki, T.; Hongo, C.; Yamano, H.; Ide, Y.; Iwatsuka, Y.; Takahashi, K.; Katayama, H.; Sekimoto, T.; et al. Eco-geomorphic processes that maintain a small coral reef island: Ballast Island in the Ryukyu Islands, Japan. Geomorphology 2016, 271, 84–93. [Google Scholar] [CrossRef]
  3. Duvat, V.K.E. A global assessment of atoll island planform changes over the past decades. Wiley Interdiscip. Rev. Clim. Chang. 2019, 10, e557. [Google Scholar] [CrossRef] [Green Version]
  4. Ford, M. Shoreline changes interpreted from multi-temporal aerial photographs and high resolution satellite images: Wotje Atoll, Marshall Islands. Remote Sens. Environ. 2013, 135, 130–140. [Google Scholar] [CrossRef]
  5. Ford, M.R.; Kench, P.S. Multi-decadal shoreline changes in response to sea level rise in the Marshall Islands. Anthropocene 2015, 11, 14–24. [Google Scholar] [CrossRef] [Green Version]
  6. Albert, S.; Leon, J.X.; Grinham, A.R.; Church, J.A.; Gibbes, B.R.; Woodroffe, C.D. Interactions between sea-level rise and wave exposure on reef island dynamics in the Solomon Islands. Environ. Res. Lett. 2016, 11. [Google Scholar] [CrossRef]
  7. Vila-Concejo, A.; Harris, D.L.; Shannon, A.M.; Webster, J.M.; Power, H.E. Coral reef sediment dynamics: Evidence of sand-apron evolution on a daily and decadal scale. J. Coast. Res. 2013, 65, 606–611. [Google Scholar] [CrossRef]
  8. Isaack, A.; Gischler, E. The significance of sand aprons in Holocene atolls and carbonate platforms. Carbonates Evaporites 2017, 32, 13–25. [Google Scholar] [CrossRef]
  9. Shannon, A.M.; Power, H.E.; Webster, J.M.; Vila-Concejo, A. Evolution of coral rubble deposits on a reef platform as detected by remote sensing. Remote Sens. 2013, 5, 1–18. [Google Scholar] [CrossRef] [Green Version]
  10. Dawson, J.L.; Smithers, S.G. Shoreline and beach volume change between 1967 and 2007 at Raine Island, Great Barrier Reef, Australia. Glob. Planet. Chang. 2010, 72, 141–154. [Google Scholar] [CrossRef]
  11. Kench, P.S.; Brander, R.W. Response of reef island shorelines to seasonal climate oscillations: South Maalhosmadulu atoll, Maldives. J. Geophys. Res. Earth Surf. 2006, 111. [Google Scholar] [CrossRef]
  12. Hamylton, S. Will coral islands maintain their growth over the next century? A deterministic model of sediment availability at Lady Elliot Island, Great Barrier Reef. PLoS ONE 2014, 9, e94067. [Google Scholar] [CrossRef] [Green Version]
  13. Scoffin, T.P. Reef aerial photography from a kite. Coral Reefs 1982, 1, 67–69. [Google Scholar] [CrossRef]
  14. Bryson, M.; Duce, S.; Harris, D.; Webster, J.M.; Thompson, A.; Vila-Concejo, A.; Williams, S.B. Geomorphic changes of a coral shingle cay measured using Kite Aerial Photography. Geomorphology 2016, 270, 1–8. [Google Scholar] [CrossRef]
  15. Hamylton, S.M. Mapping coral reef environments: A review of historical methods, recent advances and future opportunities. Prog. Phys. Geogr. 2017, 41, 803–833. [Google Scholar] [CrossRef]
  16. Joyce, K.E.; Duce, S.; Leahy, S.M.; Leon, J.; Maier, S.W. Principles and practice of acquiring drone-based image data in marine environments. Mar. Freshw. Res. 2019, 70, 952–963. [Google Scholar] [CrossRef]
  17. Hamylton, S.M.; McLean, R.; Lowe, M.; Adnan, F.A.F. Ninety years of change on a low wooded island, Great Barrier Reef. R. Soc. Open Sci. 2019, 6, 181314. [Google Scholar] [CrossRef] [Green Version]
  18. Murfitt, S.L.; Allan, B.M.; Bellgrove, A.; Rattray, A.; Young, M.A.; Ierodiaconou, D. Applications of unmanned aerial vehicles in intertidal reef monitoring. Sci. Rep. 2017, 7, 1–11. [Google Scholar] [CrossRef] [Green Version]
  19. Fallati, L.; Saponari, L.; Savini, A.; Marchese, F.; Corselli, C.; Galli, P. Multi-Temporal UAV Data and object-based image analysis (OBIA) for estimation of substrate changes in a post-bleaching scenario on a maldivian reef. Remote Sens. 2020, 12, 2093. [Google Scholar] [CrossRef]
  20. Casella, E.; Collin, A.; Harris, D.; Ferse, S.; Bejarano, S.; Parravicini, V.; Hench, J.L.; Rovere, A. Mapping coral reefs using consumer-grade drones and structure from motion photogrammetry techniques. Coral Reefs 2017, 36, 269–275. [Google Scholar] [CrossRef]
  21. Vila-Concejo, A.; Kench, P.S. Storms in coral reefs. In Coastal Storms: Processes and Impacts; Ciavola, P., Coco, G., Eds.; John Wiley and Sons: Hoboken, NJ, USA, 2017; pp. 127–144. ISBN 1118937082/9781118937082. [Google Scholar]
  22. Duce, S.; Vila-Concejo, A.; Hamylton, S.; Bruce, E.; Webster, J.M. Spur and groove distribution, morphology and relationship to relative wave exposure, Southern Great Barrier Reef, Australia. J. Coast. Res. 2014, 70, 115–120. [Google Scholar] [CrossRef]
  23. Munk, W.H.; Sargent, M.C. Adjustment of Bikini Atoll to Ocean Waves; US Government Printing Office: Washington, DC, USA, 1954.
  24. Duce, S.; Vila-Concejo, A.; Hamylton, S.M.; Webster, J.M.; Bruce, E.; Beaman, R.J. A morphometric assessment and classification of coral reef spur and groove morphology. Geomorphology 2016, 265, 68–83. [Google Scholar] [CrossRef]
  25. Harris, D.L.; Vila-Concejo, A.; Webster, J.M. Geomorphology and sediment transport on a submerged back-reef sand apron: One Tree Reef, Great Barrier Reef. Geomorphology 2014, 222, 132–142. [Google Scholar] [CrossRef]
  26. Harris, D.L.; Power, H.E.; Kinsela, M.A.; Webster, J.M.; Vila-Concejo, A. Variability of depth-limited waves in coral reef surf zones. Estuar. Coast. Shelf Sci. 2018, 211, 36–44. [Google Scholar] [CrossRef] [Green Version]
  27. Scoffin, T.P. The geological effects of hurricanes on coral reefs and the interpretation of storm deposits. Coral Reefs 1993, 12, 203–221. [Google Scholar] [CrossRef]
  28. Thornborough, K.J.; Davies, P.J. Reef flats. In Encyclopedia of Modern Coral Reefs; Hopley, D., Ed.; Springer: Dordrecht, The Netherlands, 2011; pp. 869–876. ISBN 978-90-481-2639-2. [Google Scholar]
  29. Wheaton, J.M.; Brasington, J.; Darby, S.E.; Sear, D.A. Accounting for uncertainty in DEMs from repeat topographic surveys: Improved sediment budgets. Earth Surf. Process. Landf. J. Br. Geomorphol. Res. Gr. 2010, 35, 136–156. [Google Scholar] [CrossRef]
  30. Smith, C.; Salles, T.; Vila-Concejo, A. RADWave: Python code for ocean surface wave analysis by satellite radar altimeter. J. Open Source Softw. 2020, 5, 2083. [Google Scholar] [CrossRef]
  31. Webb, A.P.; Kench, P.S. The dynamic response of reef islands to sea-level rise: Evidence from multi-decadal analysis of island change in the Central Pacific. Glob. Planet. Chang. 2010, 72, 234–246. [Google Scholar] [CrossRef]
  32. Kench, P.S.; Thompson, D.; Ford, M.R.; Ogawa, H.; McLean, R.F. Coral islands defy sea-level rise over the past century: Records from a central Pacific atoll. Geology 2015, 43, 515–518. [Google Scholar] [CrossRef]
  33. Kench, P.S.; Ford, M.R.; Owen, S.D. Patterns of island change and persistence offer alternate adaptation pathways for atoll nations. Nat. Commun. 2018, 9, 605. [Google Scholar] [CrossRef] [Green Version]
  34. East, H.K.; Perry, C.T.; Beetham, E.P.; Kench, P.S.; Liang, Y. Modelling reef hydrodynamics and sediment mobility under sea level rise in atoll reef island systems. Glob. Planet. Chang. 2020, 192, 103196. [Google Scholar] [CrossRef]
  35. Stoddart, D.R.; Fosberg, F.R.; Spellman, D.L. Cays of the Belize barrier reef and lagoon. Atoll Res. Bull. 1982, 256, 1–73. [Google Scholar] [CrossRef] [Green Version]
  36. Kench, P.S.; Chan, J.; Owen, S.D.; McLean, R.F. The geomorphology, development and temporal dynamics of Tepuka Island, Funafuti atoll, Tuvalu. Geomorphology 2014, 222, 46–58. [Google Scholar] [CrossRef]
  37. Woolsey, E.; Bainbridge, S.J.; Kingsford, M.J.; Byrne, M. Impacts of cyclone Hamish at One Tree Reef: Integrating environmental and benthic habitat data. Mar. Biol. 2012, 159, 793–803. [Google Scholar] [CrossRef]
  38. Solomon, S.M.; Forbes, D.L. Coastal hazards and associated management issues on South Pacific Islands. Ocean Coast. Manag. 1999, 42, 523–554. [Google Scholar] [CrossRef]
  39. Rankey, E.C. Nature and stability of atoll island shorelines: Gilbert Island chain, Kiribati, equatorial Pacific. Sedimentology 2011, 58, 1831–1859. [Google Scholar] [CrossRef]
  40. Matias, A.; Williams, J.J.; Masselink, G.; Ferreira, Ó. Overwash threshold for gravel barriers. Coast. Eng. 2012, 63, 48–61. [Google Scholar] [CrossRef]
  41. Masselink, G.; Beetham, E.; Kench, P. Coral reef islands can accrete vertically in response to sea level rise. Sci. Adv. 2020, 6, eaay3656. [Google Scholar] [CrossRef]
  42. Storlazzi, C.D.; Elias, E.P.L.; Berkowitz, P. Many atolls may be uninhabitable within decades due to climate change. Sci. Rep. 2015, 5, 1–9. [Google Scholar] [CrossRef] [Green Version]
  43. Kench, P.S.; Mann, T. Reef island evolution and dynamics: Insights from the Indian and Pacific oceans and perspectives for the Spermonde archipelago. Front. Mar. Sci. 2017, 4, 145. [Google Scholar] [CrossRef] [Green Version]
  44. Knutson, T.R.; McBride, J.L.; Chan, J.; Emanuel, K.; Holland, G.; Landsea, C.; Held, I.; Kossin, J.P.; Srivastava, A.K.; Sugi, M. Tropical cyclones and climate change. Nat. Geosci. 2010, 3, 157–163. [Google Scholar] [CrossRef] [Green Version]
  45. Perry, C.T.; Kench, P.S.; Smithers, S.G.; Riegl, B.; Yamano, H.; O’Leary, M.J. Implications of reef ecosystem change for the stability and maintenance of coral reef islands. Glob. Chang. Biol. 2011, 17, 3679–3696. [Google Scholar] [CrossRef]
  46. Liu, J.; Huang, R.; Yu, K.; Zou, B. How lime-sand islands in the South China Sea have responded to global warming over the last 30 years: Evidence from satellite remote sensing images. Geomorphology 2020, 371, 107423. [Google Scholar] [CrossRef]
  47. Hughes, T.P.; Kerry, J.T.; Álvarez-Noriega, M.; Álvarez-Romero, J.G.; Anderson, K.D.; Baird, A.H.; Babcock, R.C.; Beger, M.; Bellwood, D.R.; Berkelmans, R.; et al. Global warming and recurrent mass bleaching of corals. Nature 2017, 543, 373–377. [Google Scholar] [CrossRef] [PubMed]
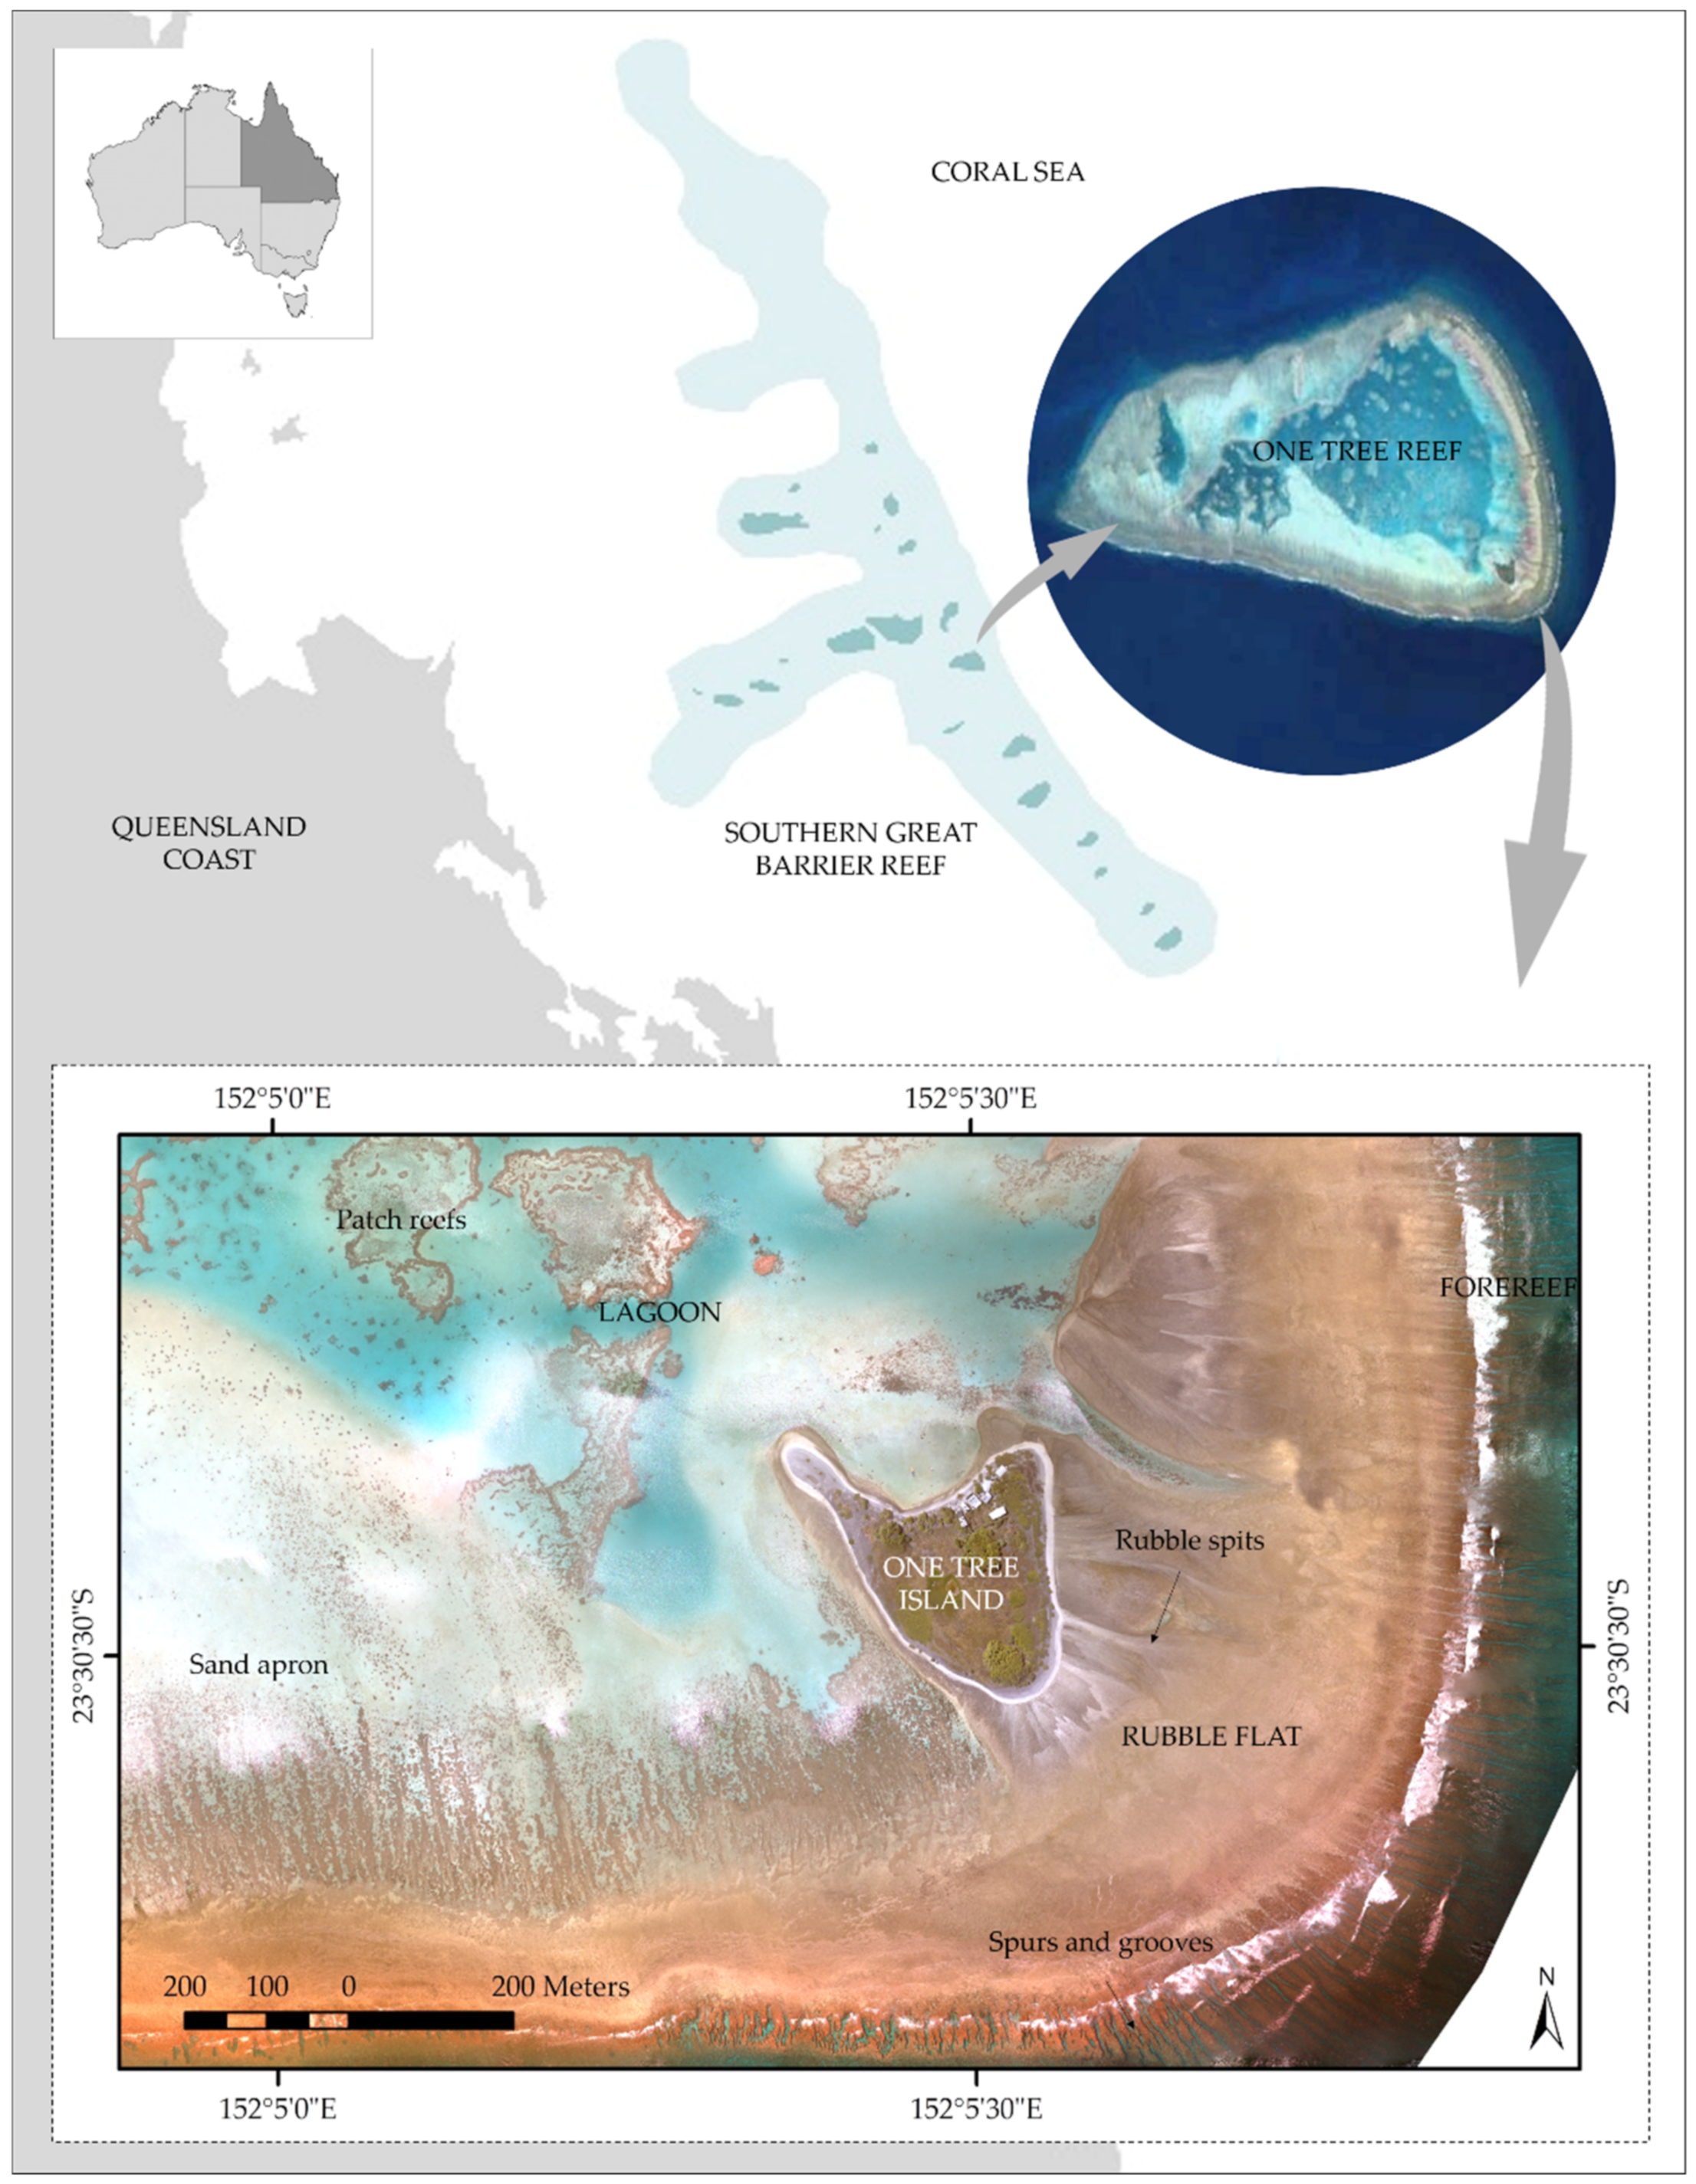
Figure 1. Location map of the southern Great Barrier Reef and One Tree Island.
Remotesensing 13 01582 g001
Figure 2. Examples of the ground-based and airborne methods used for this study: (a) Trimble RTK-DGPS R8, (b) Wingspan delta-coynes kite equipped with a 16 Mpx Sony NEX-5N, (c) DJI Phantom 4 Pro with an integrated 20 Mpx camera, and (d) ARA’s research motorglider carrying a Canon EOS 5Dmk4 DSLR and two Lidars in the underwing pods, a Riegl VQ-820-G topo-bathymetric scanner and a Riegl Q680-iS topographic scanner. Data from both scanners were combined to derive seamless above and below water topography across the OTI reef (Photo by Shakti Chakravarty).
Remotesensing 13 01582 g002
Figure 3. Examples of (a) GCPs configuration used to georeference the 2019 RPA dataset and (b) ICPs used to estimate the vertical accuracy of the 2015 KAP, 2018 LiDAR, and the 2019 RPA datasets. Background image: 2018 LiDAR mosaic.
Remotesensing 13 01582 g003
Figure 4. Hydrodynamic conditions during the analysed period: (a) Hs (m), (b) Tp (s), and (c) P (kW/m).
Remotesensing 13 01582 g004
Figure 5. Cyclones passing by the GBR and their corresponding categories.
Remotesensing 13 01582 g005
Figure 6. Planform geomorphic changes and evolution of (a) the island perimeter/shape (1964–2019) and (b) island vegetation line/core (1978–2019), where the black arrows indicate the direction of the planform changes. (c) Net changes in the island perimeter between 1964 and 2019 (grey hatch and brown outer line), and net changes in the vegetated core between 1978 and 2019 (green and brown inner lines), and (d) OTI vegetated core areal changes (in m2 and in % change, where green represents the measured areas (Table 4), and blue and red represent gross increase and decrease in size, respectively). Dotted lines represent the possible location of previous shorelines inferred from the high-resolution LiDAR captured in 2018.
Remotesensing 13 01582 g006
Figure 7. Presence and location of featureless rubble sheets and rubble spits in OTI from (a) 1964 to 1980, (b) 1980 to 2009, (c) 2009 to 2019, and (d) 1964 and 2019. Examples of featureless rubble and well-defined rubble spits are pointed by red and black arrows, respectively. The light green cross and the black triangle represent RTK measurements performed at the end of some rubble spits.
Remotesensing 13 01582 g007
Figure 8. (a) Rubble spits identified in the 2018 and 2019 datasets (the striped area contains acceptable DEM vertical errors for the analysis of the rubble spits dimensions. See the vertical errors in Table 2). Background image: 2018 LiDAR DEM (b) RS-C and RS-D DEMs. Background image: 2018 LiDAR orthomosaic.
Remotesensing 13 01582 g008
Figure 9. Dynamics of the rubble spits present at the reef flat from the 2018 LiDAR (black lines) to the 2019 RPA (green lines) datasets (see the upper left map for location). Each panel shows the cross-sectional profile of the spit at the 40 m long transects (p1–pn).
Remotesensing 13 01582 g009
Figure 10. (a) 2015–2014 DoD, (b) 2018–2015 DoD, and (c) 2019–2018 DoD. Background image: 2018 LiDAR mosaic. Note that the more extreme change values on the Island are due to the inclusion/exclusion of trees.
Remotesensing 13 01582 g010
Figure 11. (a) Cyclone number and categories, and (b) accumulated wave power derived from satellite altimetry during the periods analyzed (additional cyclone information can be found in the Supplementary Materials, Table S1 and Figures S1–S5).
Remotesensing 13 01582 g011
Figure 12. Spatial tracks of (a) cyclone Simon (1980) and (b) cyclone Marcia (2015) relative to OTI (Tracks and background images retrieved from https://australiasevereweather.com/tropica8l_cyclones/) (all the cyclone tracks can be found in the Supplementary Materials, Figures S1–S5).
Remotesensing 13 01582 g012
Table 1. Dates, sensors, and resolution of some of the datasets used to investigate geomorphic changes at OTI. AP: Aerial Photo; SI: Satellite Image; KAP: Kite Aerial Photography; Li: Light Detection and Ranging; RPA: Remotely Piloted Aircraft System.
YearMonthMethod (Sensor)Resolution (m)
1964JuneAP1.4
1978JuneAP0.15
1980SeptemberAP0.5
2001AprilSI (IKONOS 2)4
2009DecemberSI (WorldView 2)0.5
2014FebruaryKAP (16 Mpx Sony NEX-5N)0.005
2015AprilKAP (16 Mpx Sony NEX-5N)0.20
2018OctoberLi (Canon EOS 5Dmk4 DSLR, Riegl VQ-820-G, and Riegl Q680-iS)0.12
2019AprilRPA (DJI Phantom 4 Pro onboard 20 Mpx camera)/RTK0.02
Table 2. Areas, RMS vertical errors of the KAP, LiDAR, and RPA datasets, and the number of ICPs used to assess their vertical accuracy.
DatasetArea (km2)RMSE (m)Nº ICPs
2014 KAP0.040.20332
2015 KAP0.030.10221
2018 LiDAR0.350.252035
2019 RPA16.670.20671
Table 3. Summary of the geomorphic change analyses performed at OTI.
YearDecadal AnalysesHigh-Resolution and Short-Term Analyses
IslandRubble
Spits
Rubble
Spits
Rubble Erosion/Accretion
Shoreline DynamicsVegetated Core Areal ChangesPresence/Absence and LocationDimensionsDynamicsSouthern
Shoreline
Complete Shoreline
1964o o
1978ooo
1980ooo
2001o o
2008o
2009 oo
2011 o
2014o o o
2015 o
2016o
2018ooooooo
2019ooooooo
Table 4. Gross areal measurements of the vegetated island core.
YearArea (m2)
197838,218
198037,207
200940,068
201843,035
201940,974
Table 5. Characteristics of the rubble spits in 2018 and 2019.
20182019
RSABCDABCD
Volume (m3)12.958.581.1383.66.222.1102.0 *509.8 *
Area 2D (m2)67.6336.61035.61336.063.3232.91538.81758.8
Area 3D (m2)68.7343.61056.11360.663.4233.5196.4 *1283.5 *
* Volumes and 3D areas solely calculated for the corresponding spit parts falling within the striped white polygon. See the horizontal and vertical errors in Table 1 and Table 2, respectively.
Publisher’s Note: MDPI stays neutral with regard to jurisdictional claims in published maps and institutional affiliations.