Article

Maria Basalts Chronology of the Chang’E-5 Sampling Site

1
Center of Lunar and Planetary Sciences, Institute of Geochemistry, Chinese Academy of Sciences, Guiyang 550081, China
2
University of Chinese Academy of Sciences, Beijing 100049, China
3
Institute of Remote Sensing and Geographical Information System, School of Earth and Space Sciences, Peking University, Beijing 100871, China
4
CAS Center for Excellence in Comparative Planetology, Hefei 230026, China
*
Author to whom correspondence should be addressed.
Remote Sens. 2021, 13(8), 1515; https://doi.org/10.3390/rs13081515
Submission received: 9 March 2021 / Revised: 5 April 2021 / Accepted: 12 April 2021 / Published: 14 April 2021
(This article belongs to the Special Issue Planetary Remote Sensing: Chang’E-4/5 and Mars Applications)

Abstract

:
Chang’E-5 is the first lunar sample return mission of China. The spacecraft was landed in the northwest of the Procellarum KREEP Terrane (43.0576°N, 308.0839°E) on 1 December 2020 and returned 1731 g samples from a previously unvisited region. The landing area has been proposed as one of the youngest mare basalt units of the Moon and holds important information of lunar thermal evolution and chronology. However, the absolute model ages estimated in previous studies are quite different, ranging from 2.07 Ga to 1.21 Ga. Such significant difference may be caused by (1) different crater counting areas, (2) different crater diameter ranges, (3) effects of secondary craters, and (4) biases in crater identification. Moreover, the accurate landing site was unknown and the ages were estimated over the Eratosthenian-aged mare unit (Em4) instead. In light of the above unsatisfactory conditions, this study seeks to establish a standard crater size-frequency distribution of the CE-5 landing site. We derived the concentrations of FeO and TiO2 to map out the pure basaltic areas where external ejecta deposits are negligible and thus secondary craters are rare. Based on the geochemistry of basaltic ejecta excavated by fresh craters in the mare unit, the FeO concentration threshold for mapping pure basaltic areas is 17.2 wt.%. The morphologically flat subunits in the pure basaltic areas were selected for crater identification and age dating to exclude the contamination of external ejecta to the best as we could. In the Chang’E-5 sampling site subunit, we detected 313 craters with a diameter greater than 100 m and derived the absolute model age as 1.49 0.084 + 0.084 Ga. The craters identified in all pure basaltic subunits of Em4 gave the model age of 1.41 0.028 + 0.027 Ga. As least affected by secondary craters, the crater size-frequency distribution of the sample-collected pure basaltic subunit can provide important constraints for lunar cratering chronology function in combination with isotopic age of returned samples.

1. Introduction

On 1 December 2020, China’s first lunar sample return mission, Chang’E-5 (CE-5), successfully landed in the northwest of lunar Procellarum KREEP Terrane (PKT) [1]. The CE-5 mission returned 1731 g samples from drilling the subsurface and grabbing surface regolith. The landing site (43.0576°N, 308.0839°E) is quite far from the sampled sites from the Apollo and Luna missions (Figure 1a). The ages of all lunar basaltic samples returned by previous missions are older than 2.93 Ga [2]. Hiesinger et al. [3,4] dated the lunar near-side mare basalt units using the crater size-frequency distribution (CSFD) model [5,6,7], and the results show that some mare units are younger than 2.0 Ga in the PKT region and that the CE-5 landing area (unit P58) can be dated to 1.33 Ga. Therefore, the location and age of the mare basalt of the CE-5 landing site were very different from previous sample return missions. The CE-5 samples can provide information about lunar late volcanism processes and thermal evolution. The absolute model age (AMA) and CSFD of the landing site, combined with the isotopic ages of returned samples can constrain the lunar cratering chronology model of 1–2 Ga and improve the accuracy of age dating on the Moon, which is critical for lunar science and cratering chronology models of other planets [5,6,7].
Surface model age of the CE-5 landed mare unit (Em4) has been investigated by several previous studies with the CSFD method. Qian et al. [8] analyzed the TiO2, FeO abundances, and mineralogy of the prelanding site of CE-5-Rümker region, and defined the boundaries of regional geologic units. They mapped craters on the Kaguya Terrane camera (TC) global morning mosaic, and derived the AMA of Em4 as 1.21 Ga. Using machine learning, Wu et al. [9] detected craters larger than 100 m in diameter in an area (53–56°W, 41–44°N) inside the Em4 unit. After excluding the secondaries from crater Copernicus, Harpalus, and Pythagoras, the Em4 was dated to 1.49 Ga [9]. Based on digital orthophoto map (DOM) derived from Lunar Reconnaissance Orbiter (LRO) Narrow Angle Camera (NAC) images and the SLDEM2015 elevation model, Jia et al. [10] dated the Em4 using the craters with a diameter larger than 200 m, and derived the AMA of 2.07 Ga. Qian et al. [11] divided the Em4 unit into 52 squares with the width of 1° × 1° and dated each of them. They dated the AMAs of the squares ranging from 2.9 Ga to 1.1 Ga, and the AMA of the entire Em4 unit was 1.53 Ga.
It can be concluded that the ages of the Em4 unit dated by previous studies are inconsistent with each other and substantially varied from 2.07 to 1.21 Ga. One reason is that they selected different regions for crater counting. More important, the northern part of the Em4 unit is highland and the eastern is Montes Jura, and there are many craters (Sharp B, Pythagoras, Philolaus, etc.) that would deliver ejecta deposits to Em4 (Figure 1b). The discontinuous ejecta deposits are patchy and characterized by localized deposits and shallow elongated secondary craters that usually occur in clusters and chains (Figure 1c,d). These studies declared that they identified and removed the secondary craters based on the morphology. However, in high energy impact, the morphologic features of secondary craters and primary craters are similar. Therefore, it is difficult to completely distinguish secondary craters from primary craters based on their morphology, leading to great uncertainty [12,13]. Werner et al. [14] estimated that counting all secondary craters would increase the CSFD model age by a factor of two at most. It is necessary to effectively exclude the effects of secondaries to obtain an accurate CSFD of the CE-5 landing area.
In this study, we utilized the FeO content, which was derived from Kaguya Multiband Imager (MI) data, to divide the Em4 unit into two classes: pure basaltic areas (the basaltic areas least affected by external ejecta, PB) and non-pure basaltic areas (the areas contaminated by external crater ejecta, NPB). In the PB areas, we defined the subunits where the surface is flat for crater identification and CSFD analysis. Based on LRO NAC images, we mapped out the primary craters with diameters larger than 100 m in the PB units and derived the model ages. Given the high spatial resolution of the crater identification images and the least external ejecta contamination, our CSFD provided a standard CSFD of primary craters of the CE-5 sample collecting area. To analyze the possible ejecta sources, we estimated the model ages of the surrounding external craters. Based on the distance and ages of these craters with respect to the CE-5 landing site, we predicted the craters that might contribute impact-melt breccias to the CE-5 samples.

2. Data and Methods

2.1. Data

Kaguya MI data, which has spatial resolutions of 20 m/pixel for the five visible bands (415, 750, 900, 950, and 1000 nm) and 62 m/pixel for the four near-infrared bands (1000, 1050, 1250, and 1550 nm), were used for the calculation of the FeO and TiO2 concentrations [16]. We used the MAP-V3.0 level data that had been topographically corrected and radiometrically corrected (http://www.darts.isas.jaxa.jp/planet/pdap/selene/, acessed on 10 September 2020). We used the Kaguya TC DTM data with a spatial resolution of 10 m/pixel [17]. The SLDEM2015 is a high-resolution lunar topography model of ~59 m/pixel produced by a combination of the Lunar Orbiter Laser Altimeter (LOLA) and Kaguya TC DTM [18] (http://imbrium.mit.edu/EXTRAS/ SLDEM2015/, accessed on 30 August 2020). The LRO NAC images, with spatial resolutions between 0.5 m and 2.5 m per pixel [19], were used to visually identify craters. The dataset can be downloaded from LRO data collections (http://wms.LRO.asu.edu/LRO/search, accesed on 30 August 2020). These images were mosaicked to analyze the topographic and geological features.

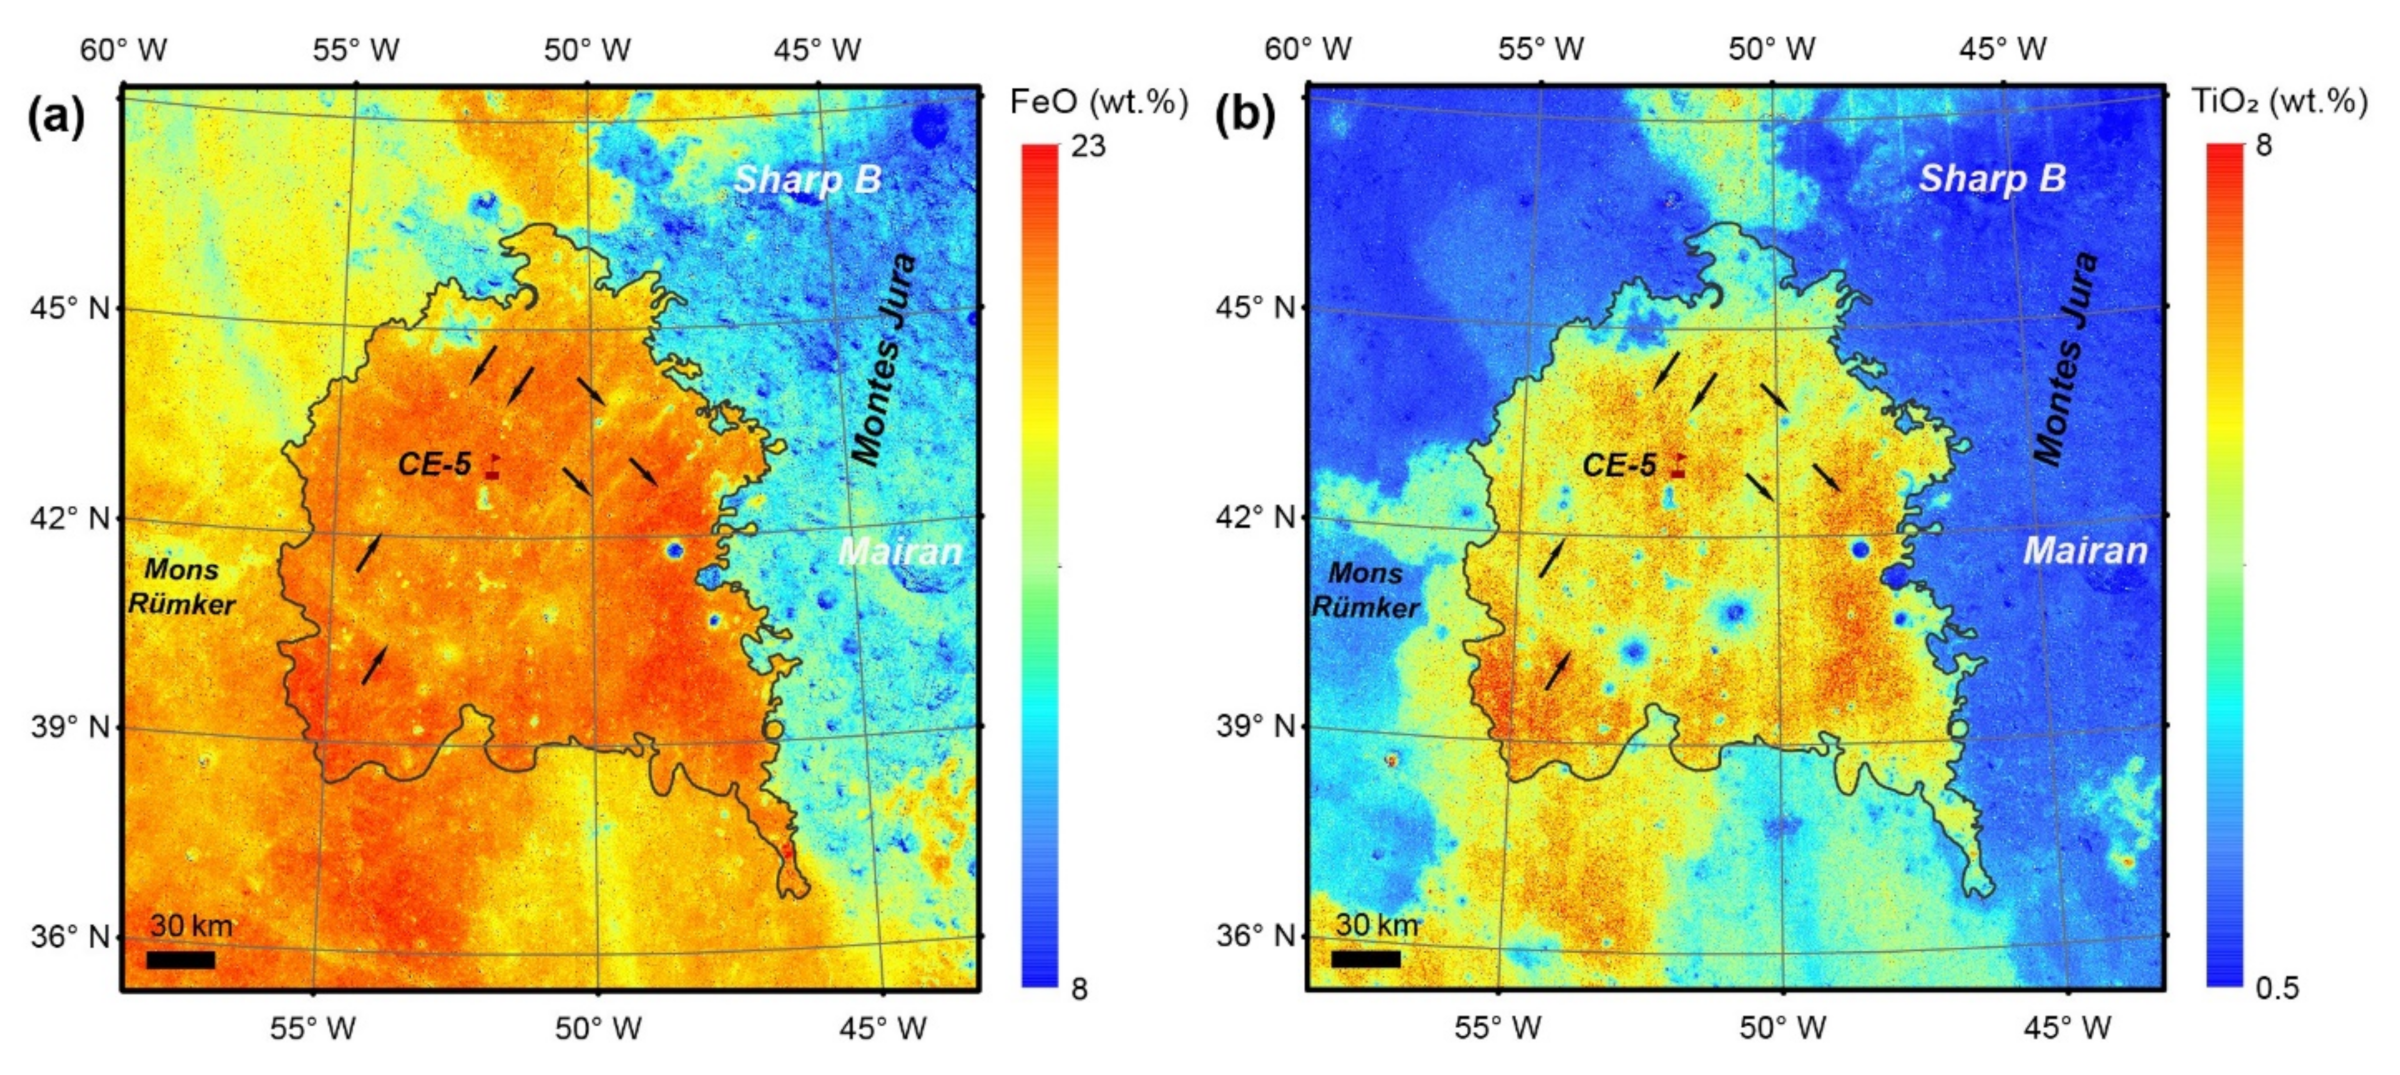
2.2. FeO and TiO2 Content

Lucey et al. [20] provided algorithms to inverse the FeO and TiO2 abundances based on Clementine UV/VIS images. The algorithm was then modified to validate other datasets [20,21,22,23,24,25]. In this study, the FeO and TiO2 abundances were derived from the Kaguya MI data. The FeO abundance was derived using algorithm described by Lemelin et al. [25], and the TiO2 abundance was derived using algorithm described by Otake et al. [22]. The equations are as follows.
θ Fe 1 = arctan R 950 / R 750 1.39 R 750 0.04
θ Fe 2 = 0.0656 e ( 3.6681 × θ Fe 1 )
FeO wt . % = θ Fe 2 × 1.0708 0.3986
θ Ti = arctan R 415 / R 750 0.208 R 750 + 0.108
TiO 2 wt . % = θ Ti 14.964 × 0.72
where R 415 , R 750 , and   R 950 are the reflectance at 415 nm, 750 nm, and 950 nm, respectively. The standard deviations were 0.85 wt.% for FeO and 0.43 wt.% for TiO2. However, Pieters [26] noted that the TiO2 abundance has high uncertainty at low-Ti values (<2 wt.%).

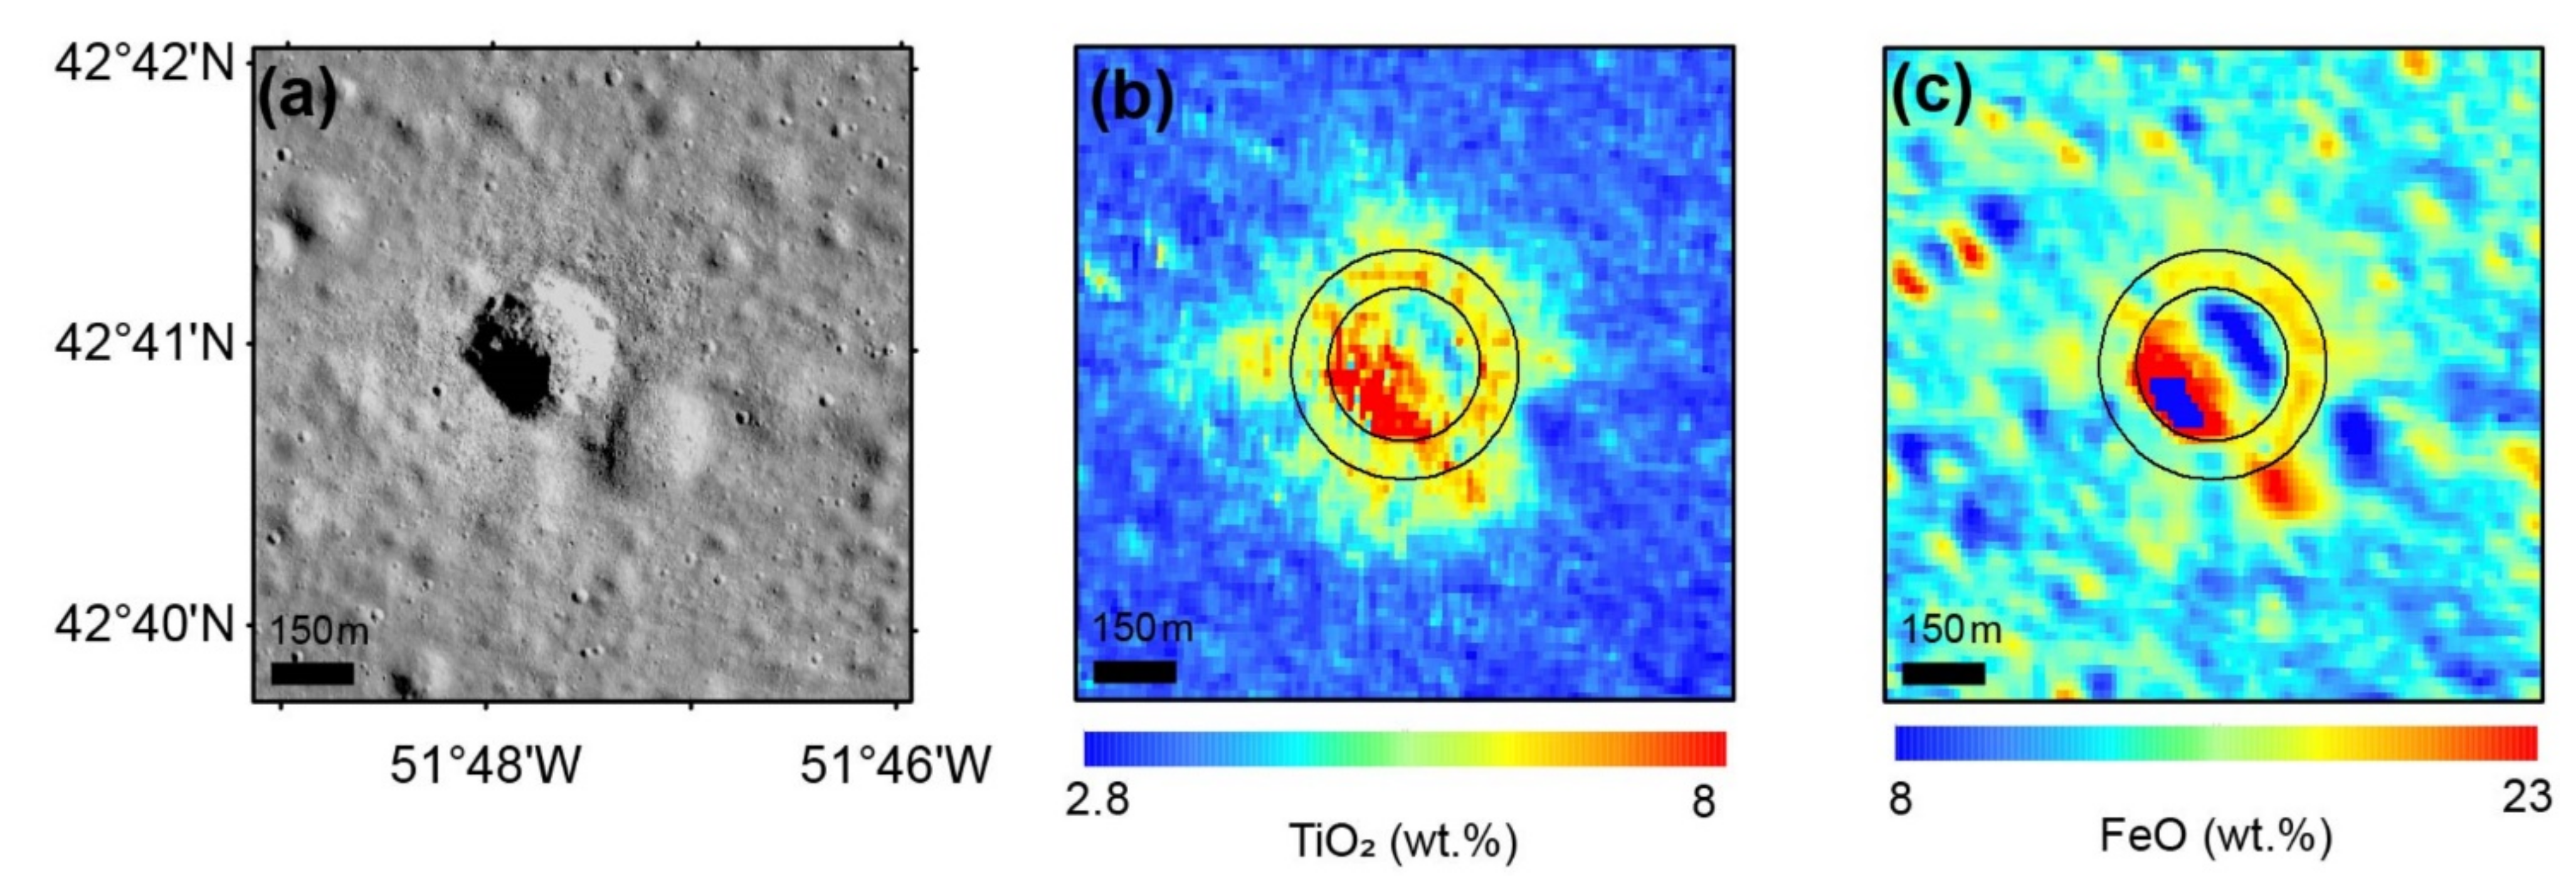
2.3. Identifying Pure Basalts

The FeO and TiO2 contents of most Em4 areas were higher than outside (Figure 2). Meanwhile, the western and northern parts showed regions with low abundances, and most of them were due to contaminations of external ejecta rays. These ejecta rays are transported from the craters on the Montes Jura and highland geologic units, which have lower FeO and TiO2 abundances.
Korotev et al. [27] mapped the Fe–Al composition based on the feldspathic lunar meteorite samples and the lunar soil samples brought back through the Apollo and Luna missions. The FeO contents of the maria basalts range from 15 wt.% to 23 wt.%, the feldspathic highlands material ranges from 1.5 wt.% to 6.5 wt.% [27]. Considering that maria and highland have large differences in FeO contents, Em4 can be divided into two categories based on the FeO contents: pure basaltic areas (the basaltic areas least affected by external ejecta, PB) and non-pure basaltic areas (the areas contaminated by external crater ejecta, NPB). In PB areas, the effects of secondary craters could be removed the best because external ejecta were not deposited.
A key question is defining the threshold of FeO content to distinguish the PB areas and NPB areas. Due to space weathering, the surface basalts will turn to maturity, resulting in being featureless in spectrum. A postdated cratering event can penetrate to the subsurface and expose the immature material in its ejecta, which can be used to characterize the properties of the pure basalts. Continuous ejecta deposits, which usually distribute less than 2 radii from the crater center, are the closest ejecta part and almost all the materials are excavated from the subsurface. However, the ratio of ejecta to local materials decreases with increasing distance [28,29]. Therefore, we mapped out the fresh craters in Em4 unit and extracted the TiO2 and FeO contents in the 1–1.5 radii from crater center. The threshold FeO content to distinguish PB and NPB was derived from these fresh craters.

2.4. Crater Size-Frequency Distribution Model

The CSFD model is based on two hypotheses: (1) the formation of impact craters is randomly distributed in the lunar surface; and (2) the degradation rate of craters is far less than the production rate [30]. Thus, an aged surface has undergone more impact events and has more craters than a young surface. With the radiogenic isotope ages of lunar samples from the Apollo and Luna missions, Luna production function (PF) [6,31,32] and Luna chronology function (CF) [30,33] were established to calibrate the absolute model age of the lunar surface. CSFD model is one of the most widely used techniques for lunar surface dating, with the development of lunar remote sensing exploration.
Based on the mapped craters in crater counting areas, the model age can be calculated using the Craterstats2 tool, which was developed by Michael et al. [34]. In the dating process, the PF of Neukum et al. [6] was employed, with the standard lunar equilibrium proposed by Hartmann [35]. Meanwhile, we used the Poisson timing analysis proposed by Michael et al. [36] to analyze the uncertainties of derived model age. The accuracy of Poisson timing analysis is independent of the statistical method of craters in the dating process.

3. Results

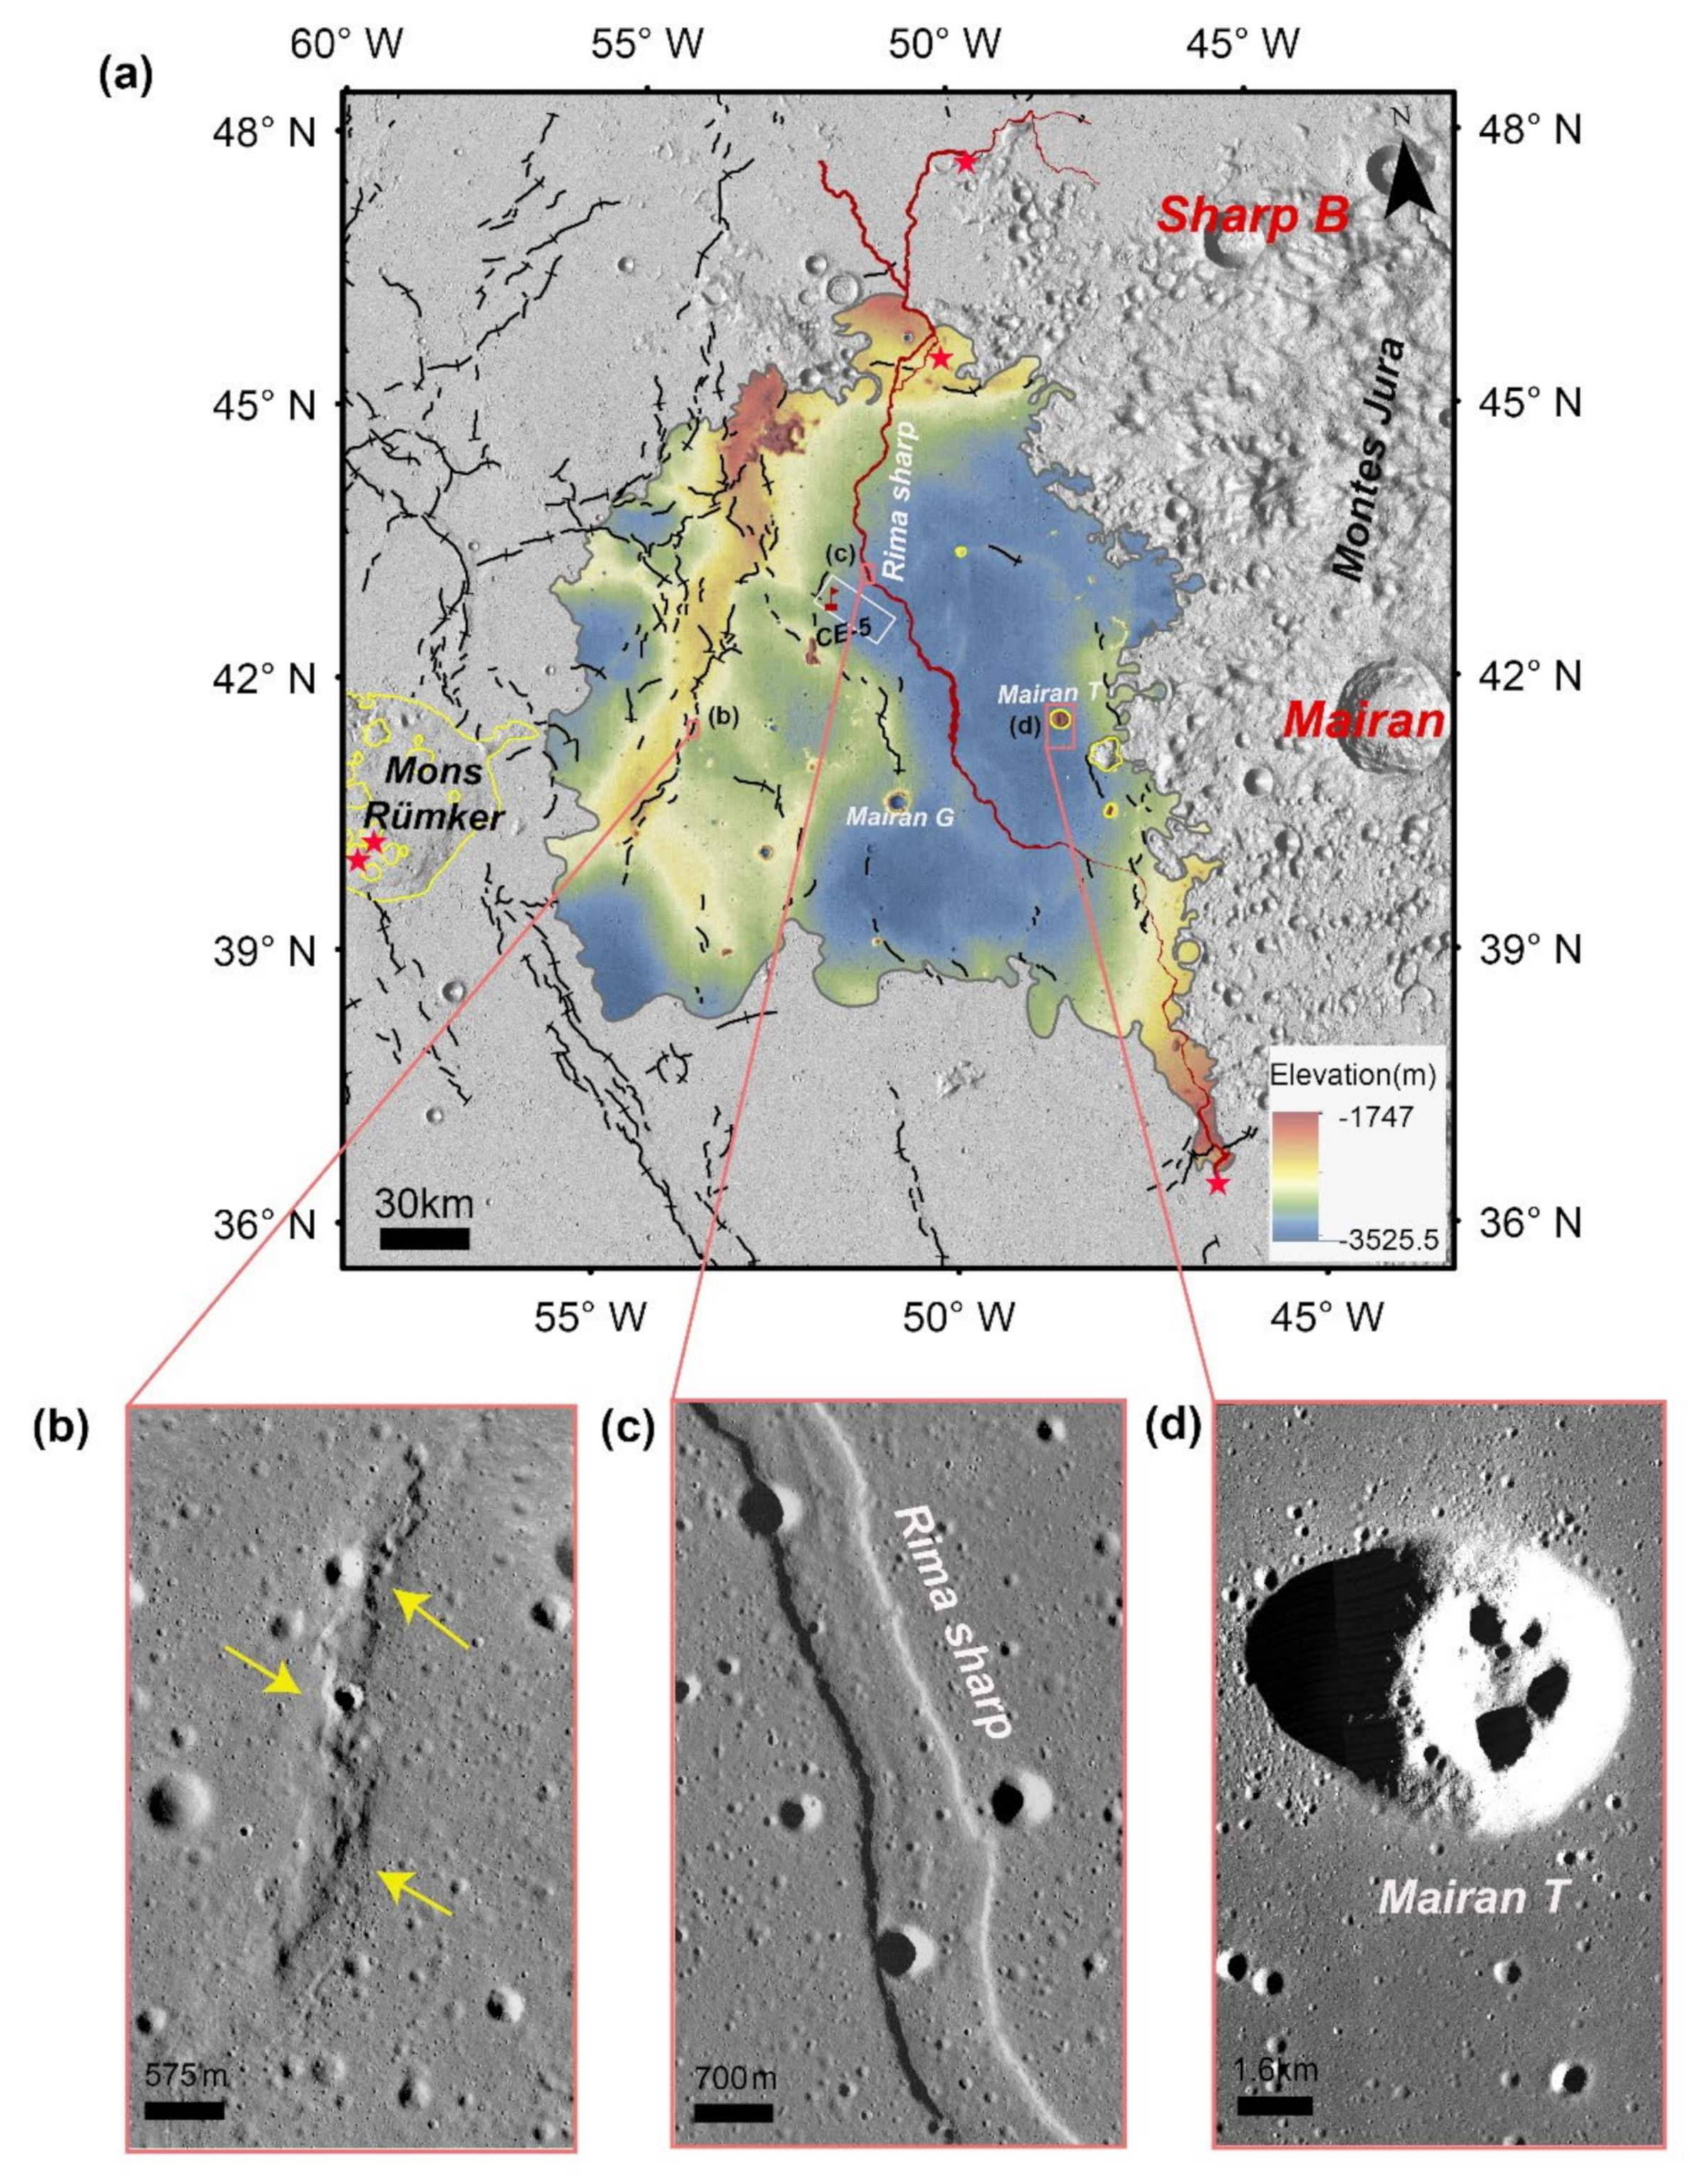
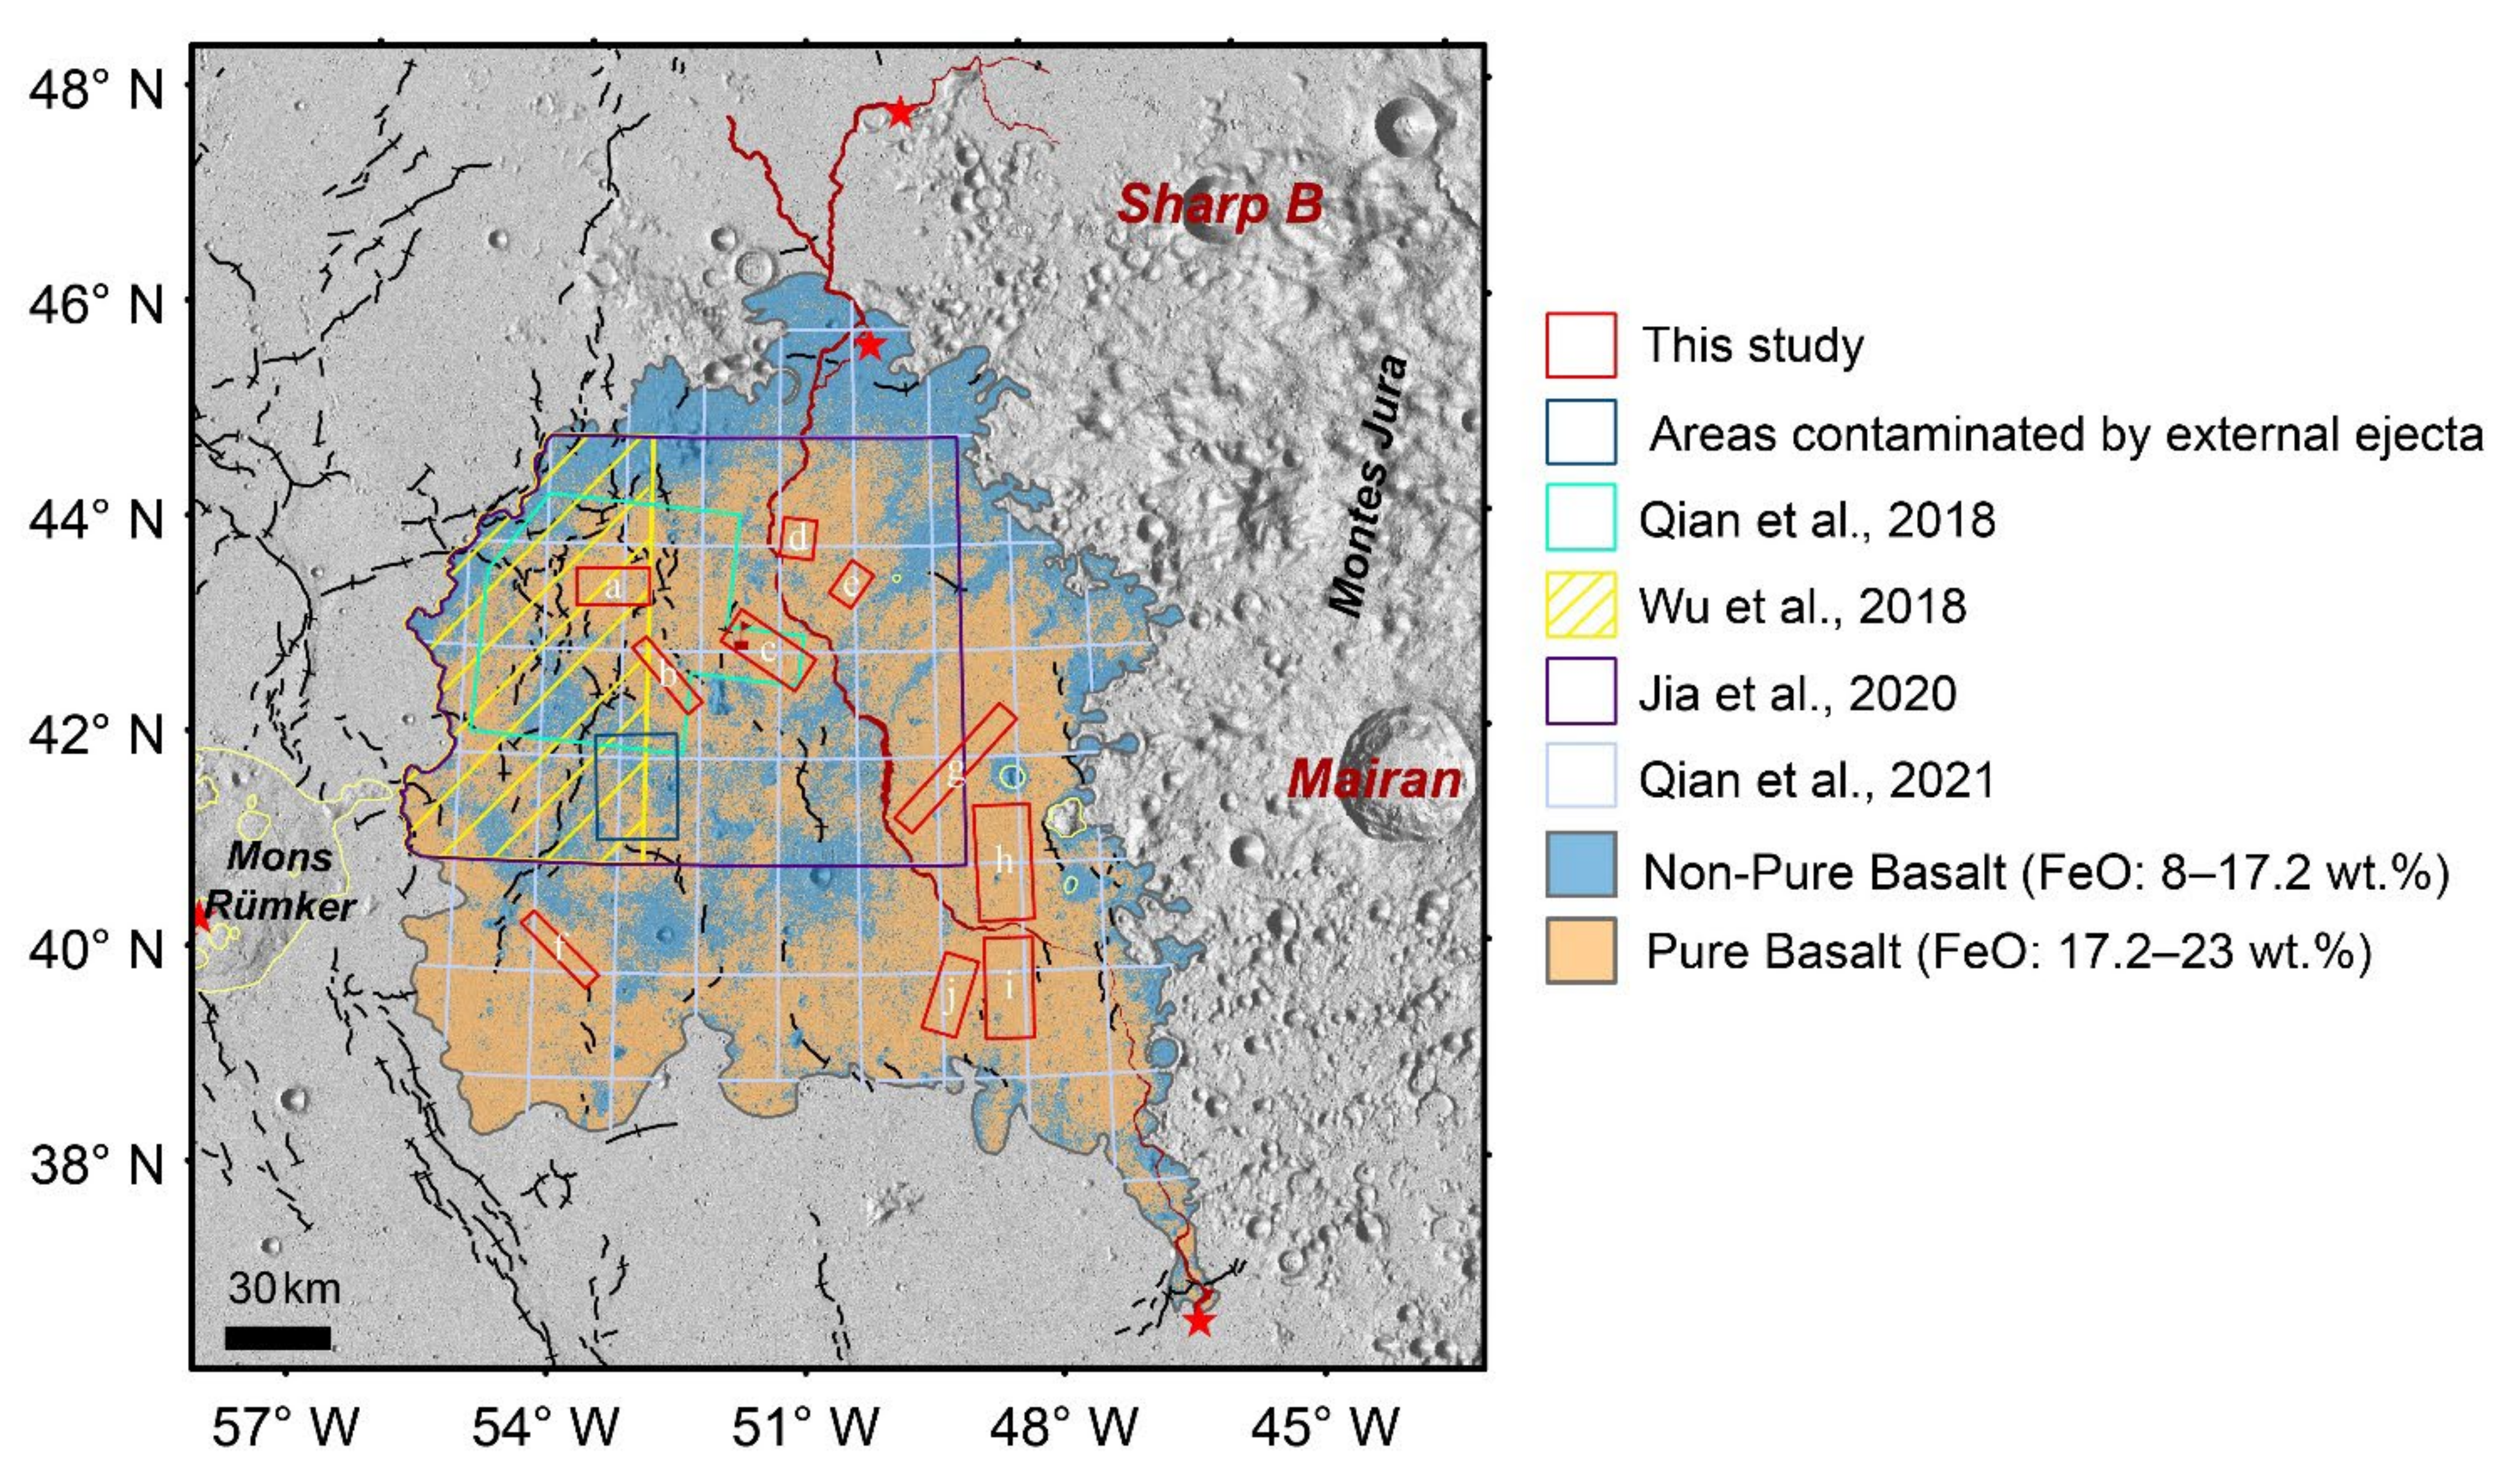
3.1. Topography and Geologic Context

Em4 is relatively flat in morphology, but the western maria is ~50–250 m higher than the eastern (Figure 3a), which indicates possible multiphase mare eruptions. Based on SLDEM2015 and LRO NAC images, we identified the geologic structures including the wrinkle ridges, sinuous rilles, and domes in the Em4 unit (Figure 3a). The lowest point is the Mairan G crater bottom (−3525.5 m), and the highest point is the top of the Mairan T dome (−1747 m). The topography relief is mainly caused by sinuous rilles, wrinkle ridges, and volcanic domes. Sinuous rilles are products of high effusion-rate eruptions with high temperature and low viscosity [37]. Rima Sharp has an average width of 840 m, and an average depth of 76 m [38]. The channel of this rille cuts through the Em4 unit (Figure 3a,b), suggesting a younger age than Em4. Wrinkle ridges that were formed in compressional stress conditions are in abundance in the west of Em4 (Figure 3a). Wrinkle ridges express folded basalt layers overlying thrust faults [39,40]. Mairan domes are located in the east of Em4. These volcanic domes are composed of high SiO2 and low FeO lava flows [41]. Previous study suggests that this volcanic event (around ~3 Ga) is older than the Em4 mare basalts [42]. The geologic structures in Em4 indicate that this region may have undergone a complex evolution history.
Xiao et al. [43] found that the material may be quick or migrate slowly in areas with larger slope. They confirmed that topographic slope will affect the density and size-frequency distribution of craters by counting craters on the geologic units with the same age and different inclines. In order to preclude the influence of inclined topography in crater statistics, we avoided areas developed with geologic structures.

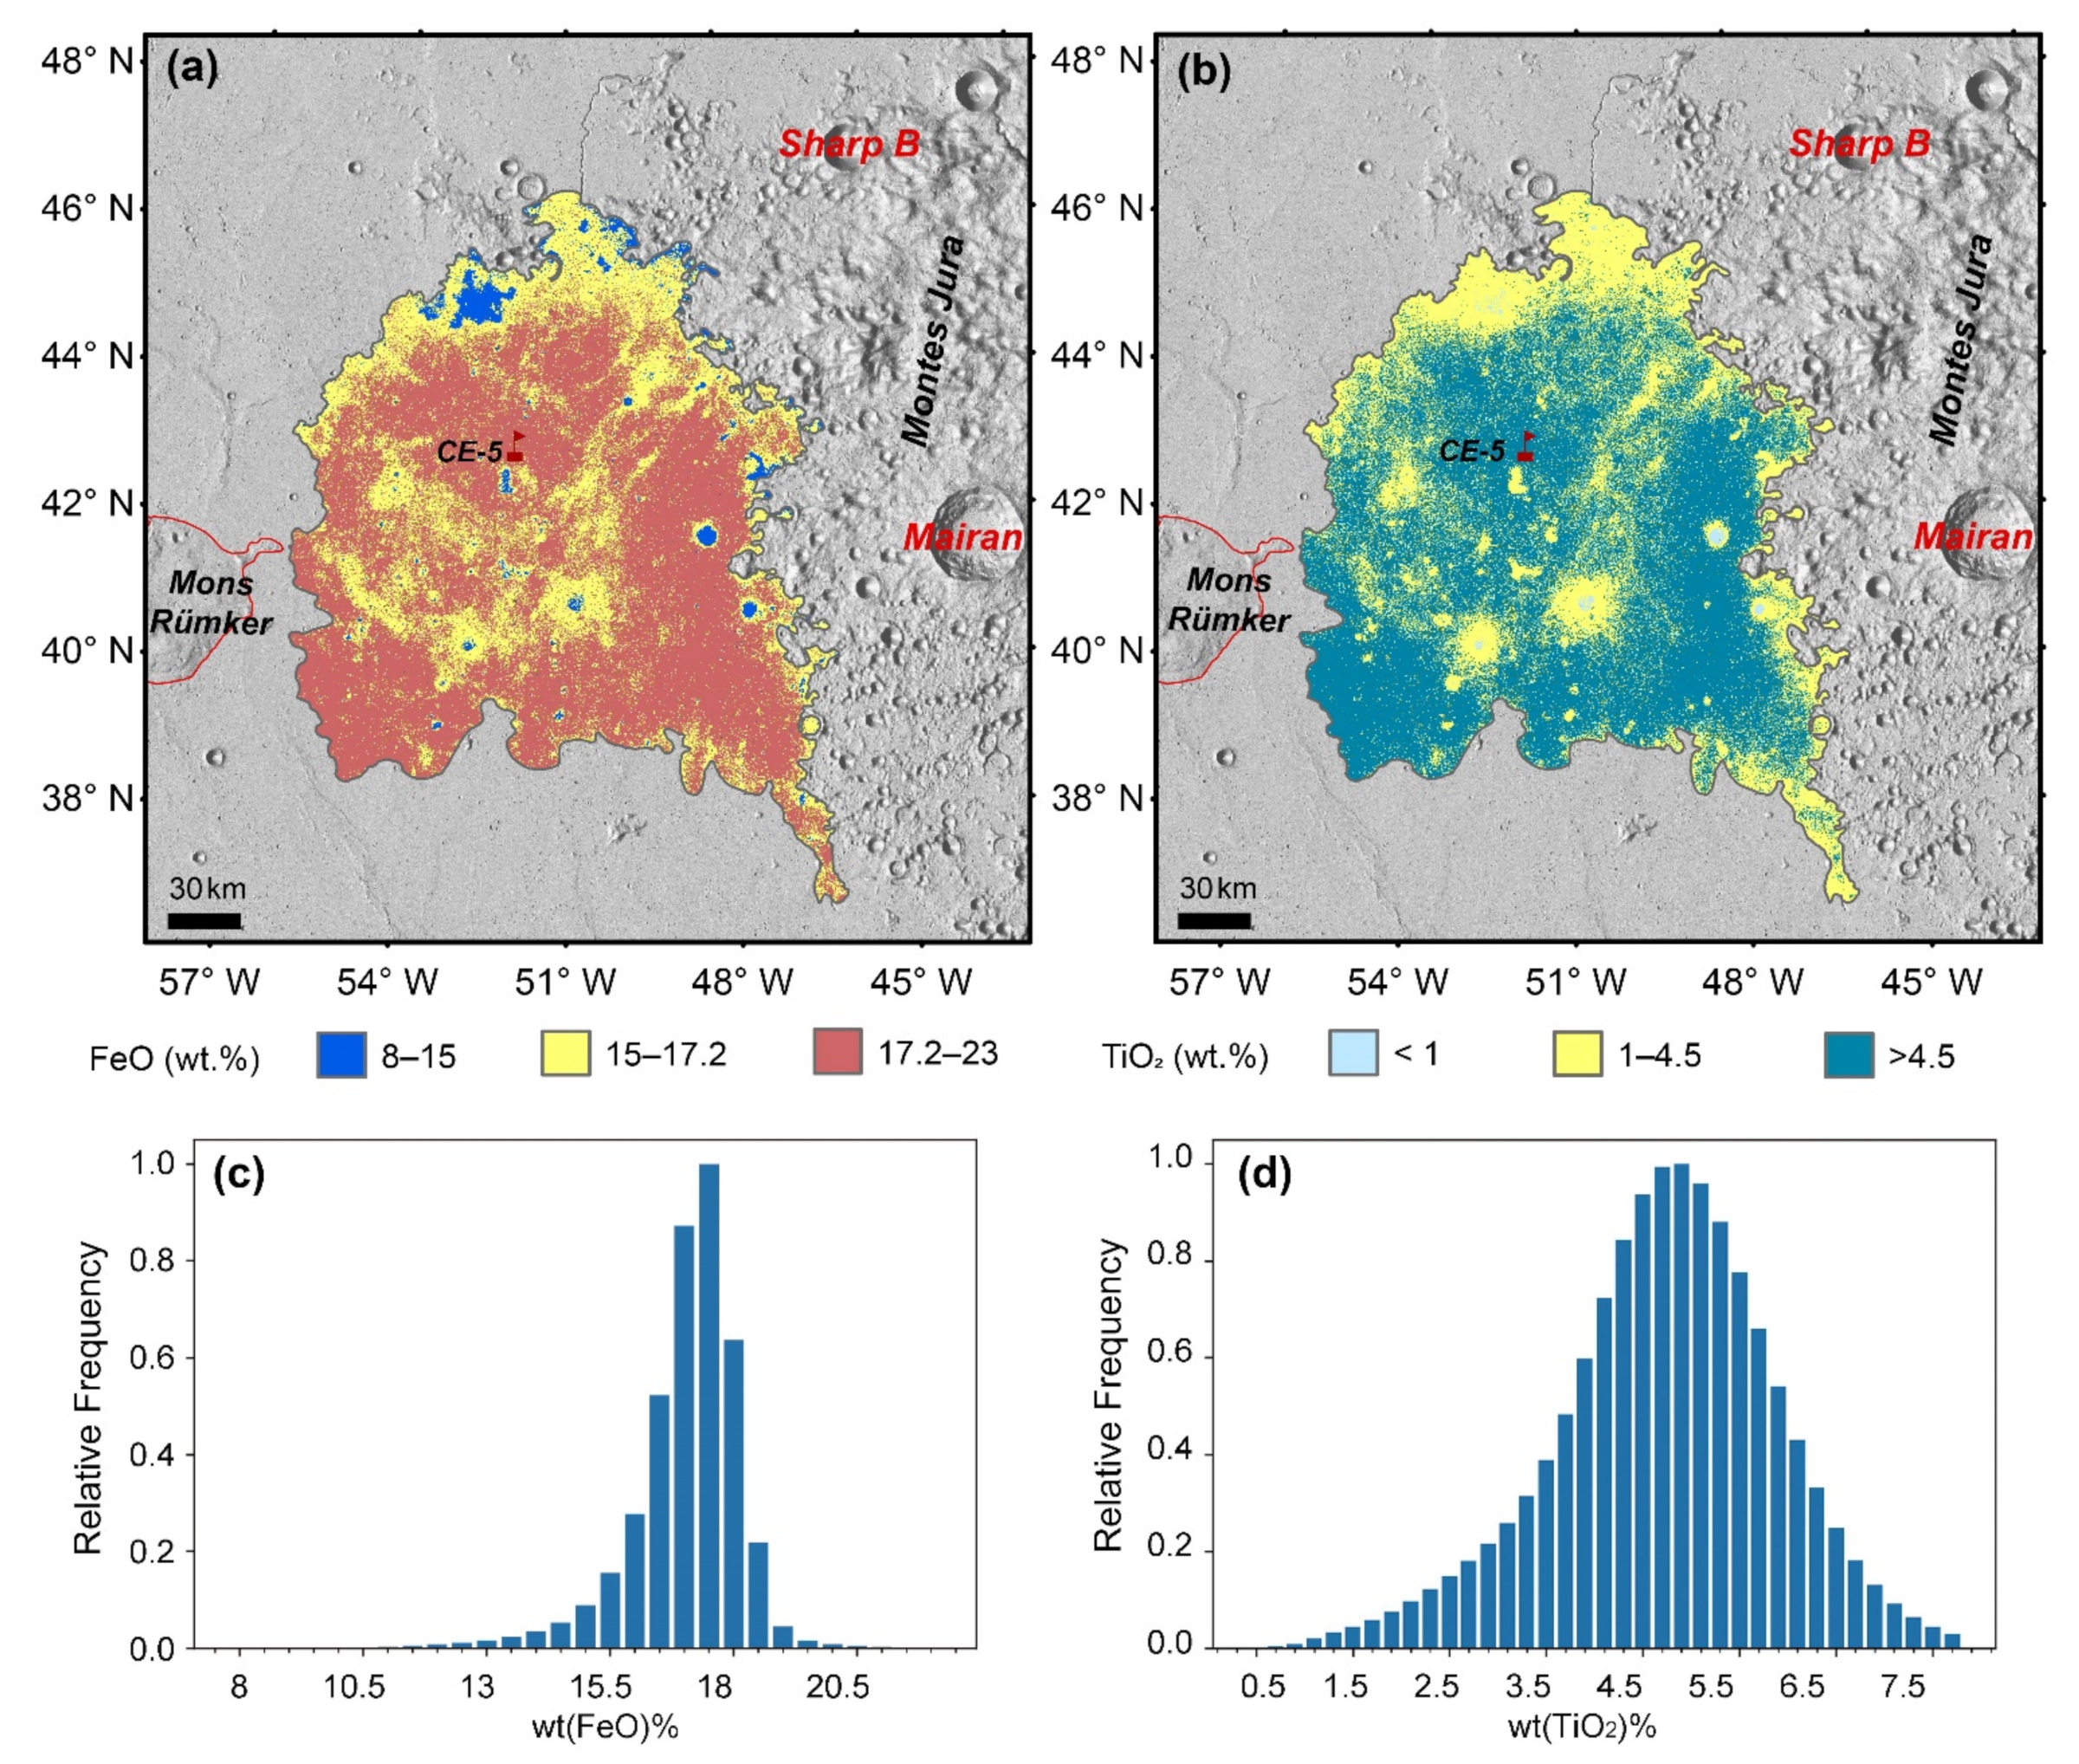
3.2. Pure Basaltic Area Identification

Using the algorithm of Leminlin et al. [25], we calculated the FeO contents of Em4 (Figure 2a). The average content of FeO in Em4 is 17.3 wt.%, and the areas with FeO content greater than 15 wt.% in Em4 occupy 96% of the whole area. However, these regions include the areas mixed with external ejecta (Figure 2a and Figure 4a). In order to find pure basaltic materials, the small and fresh craters (e.g., Figure 5) that can excavate the immature pure basaltic materials have to be identified. These craters should meet the following criteria.
(1)
The continuous deposits are not contaminated by external ejecta.
(2)
The crater is located on a basaltic region.
(3)
The crater is large enough to penetrate through the surface mature regolith.
The TiO2 contents in Em4 are 0.5–8 wt.% (Figure 4d), with an average of 4.7 wt.%. According to the titanium-dependent maria basalts classification of Giguere et al. [44], 61% of the Em4 area has TiO2 contents >4.5 wt.% and belongs to intermediate-Ti and high-Ti basalts. The ejecta-basalts mixtures have a TiO2 content of 1–4.5 wt.% and occupy 39% of the region. Materials on the bottom of two large impact craters in Em4 have TiO2 contents less than 1 wt.% (Figure 2b and Figure 4b), indicating that the impacts penetrated through the mare and exposed the substrate feldspathic materials. In this study, the areas with TiO2 contents >4.5 wt.% are thought to be pure basalts. In these areas (Figure 4b), we identified the craters whose rim had higher TiO2 contents than outside and showed clearly visible rock on the wall and rim. These craters are young and the continuous ejecta deposits are not affected by feldspathic ejecta. We identified 13 fresh craters with diameters of 252–898 m. These craters were used for resolving thee FeO threshold to distinguish PB and NPB. We collected the FeO contents of the fresh craters at pixels in 1 to 1.5 crater radii from the crater center. Then, we calculated the mean, median, and standard deviation of the collected data. The results are shown in Table 1.
As shown in Table 1, except for No. 3 crater, the mean FeO content in the rim of each crater was more than 17 wt.%. The mean FeO content of all craters was 16.6 wt.%, and their standard deviation was very large. This may suggest that the craters have various FeO abundance in different locations, which may be caused by spatial heterogeneity. Space weathering will accelerate the mixing rate of the basin basalt and the underlying lunar regolith, and with the increase of the distance from the impact crater, the ejecta distribution becomes gradually uneven. When extreme values appear in statistics, it is better to use the median value as the representative value instead of the mean value, because the median is not affected by small amounts of extreme values. Therefore, the median FeO content of all impact craters, 17.2 wt.%, was used as the threshold FeO content to define PB areas. Thereafter, according to the FeO content, Em4 can be divided into subunits of two types: PB (17.2–23 wt.%) and NPB (8–17.2 wt.%), as shown in Figure 6. Given that the threshold is defined from the exposed subsurface basalts that have experienced weak space weathering, the threshold value is quite strict when applying it to the whole Em4 region. Such a strict threshold can identify the areas even lightly contaminated by external ejecta and provide robust PB areas.
It was noticeable that the FeO inversion algorithm is affected by submicroscopic metallic iron (SMFe), the products of space weathering [45]. Spectral reflectance decreases with an increase in the abundance of SMFe, but the ratio of near-IR to visible reflectance increases [45]. Based on the FeO inversion algorithm described in Lemelin et al. [25], the increase in space weathering will lead to decreased FeO content when the reflectance at 700 nm band is greater than 0.04. As ~99.96% of the Em4 area has a reflectance at 750 nm greater than 0.04, we can assume that the FeO contents were slightly underestimated in areas with strong space weathering. As a result, the identified PB areas were smaller than the actual PB areas. However, the dating results are independent of the dating area if the crater number is statistically reasonable. In addition, we applied a strict threshold FeO content to identify the PB areas, which worked even more robustly as the surface FeO contents were underestimated. Thus, space weathering in the study area did not affect the model ages.
Compared with the FeO content classification map (Figure 6), the TiO2 content >4.5 wt.% areas were basically consistent with the PB area. Some regions that have TiO2 content <4.5 wt.%, and FeO content >17.2 wt.%, belong to PB areas that may have been mixed with mature regolith or lightly affected by external ejecta. Furthermore, the algorithm inversed TiO2 abundance had higher uncertainty at low-Ti values. Therefore, we finally chose the lunar surface with FeO content >17.2 wt.% as the candidate areas for dating. In this study, we selected 10 crater counting subunits (Em4a–Em4j; Figure 6 red rectangles) with consideration of both pure basalt distribution and topography. Em4a–Em4e are located in the north; Em4f is located in the southwest; Em4g–Em4j are located in the southeast. The internal terrain of each dating area was flat and smooth, and the degradation of impact craters in these areas were unaffected by the slopes of the terrain. Meanwhile, the contamination of secondaries caused by far-field ejecta of external craters are minimal in these crater counting areas.

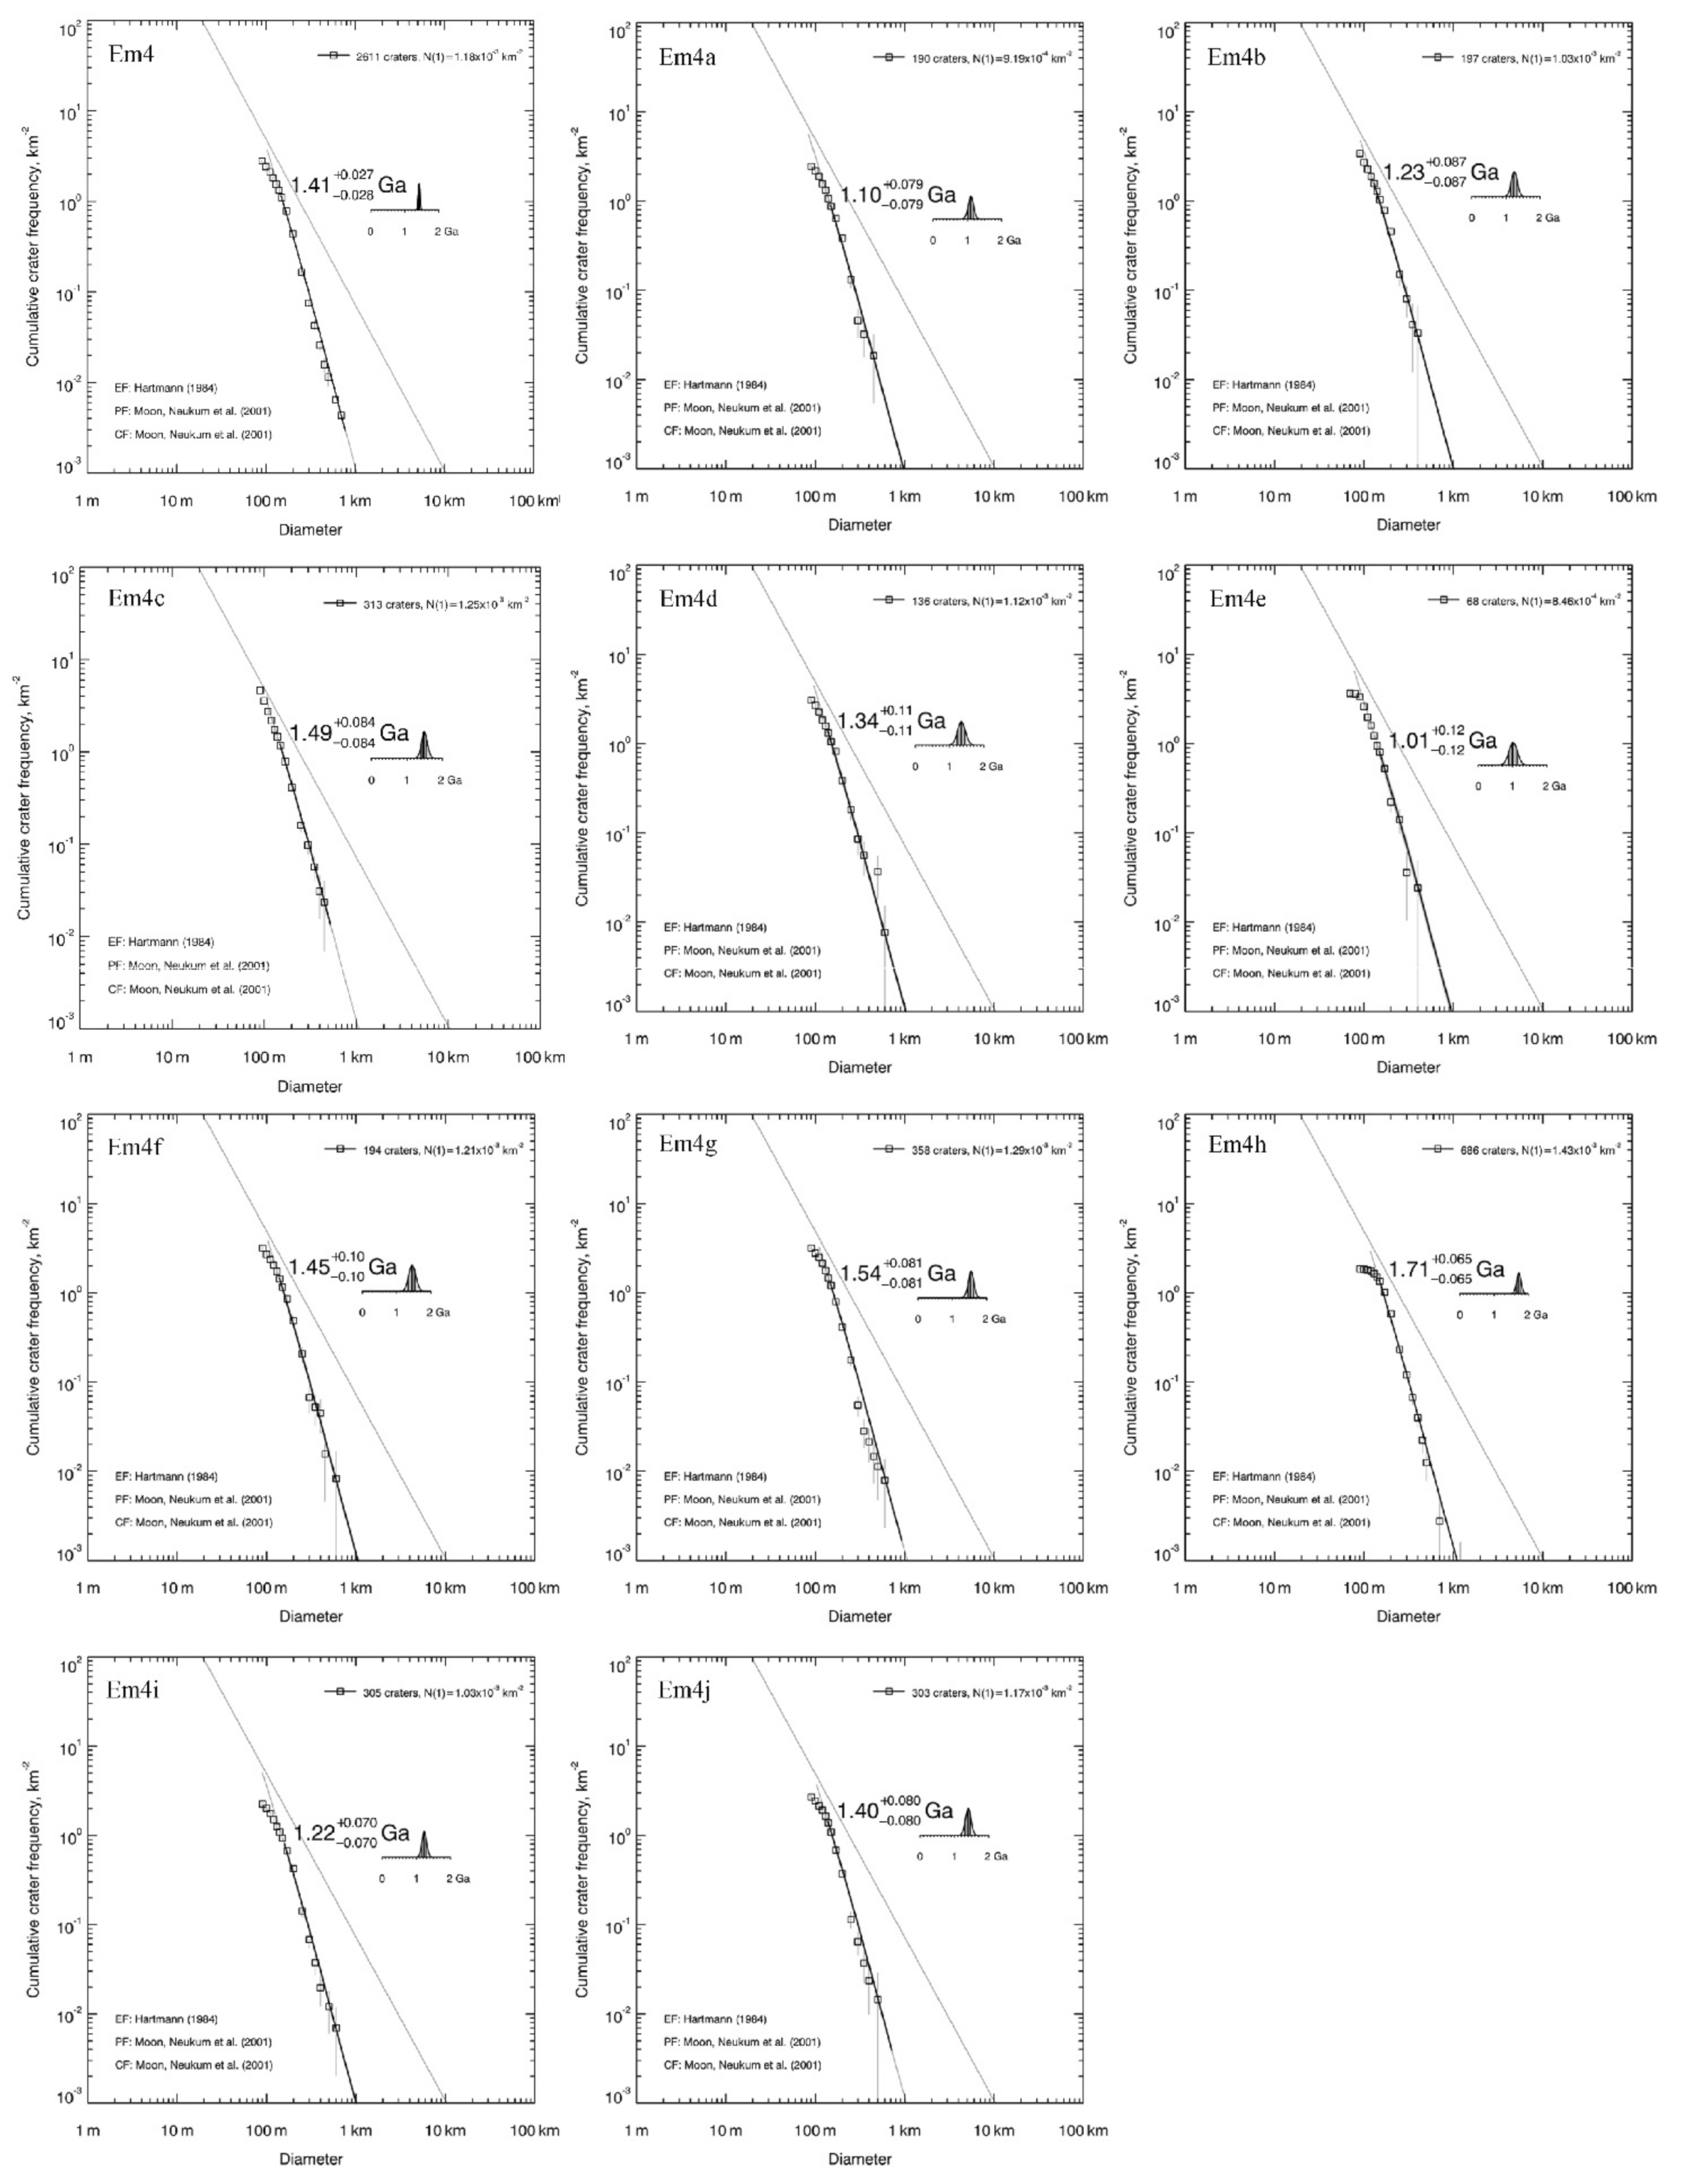
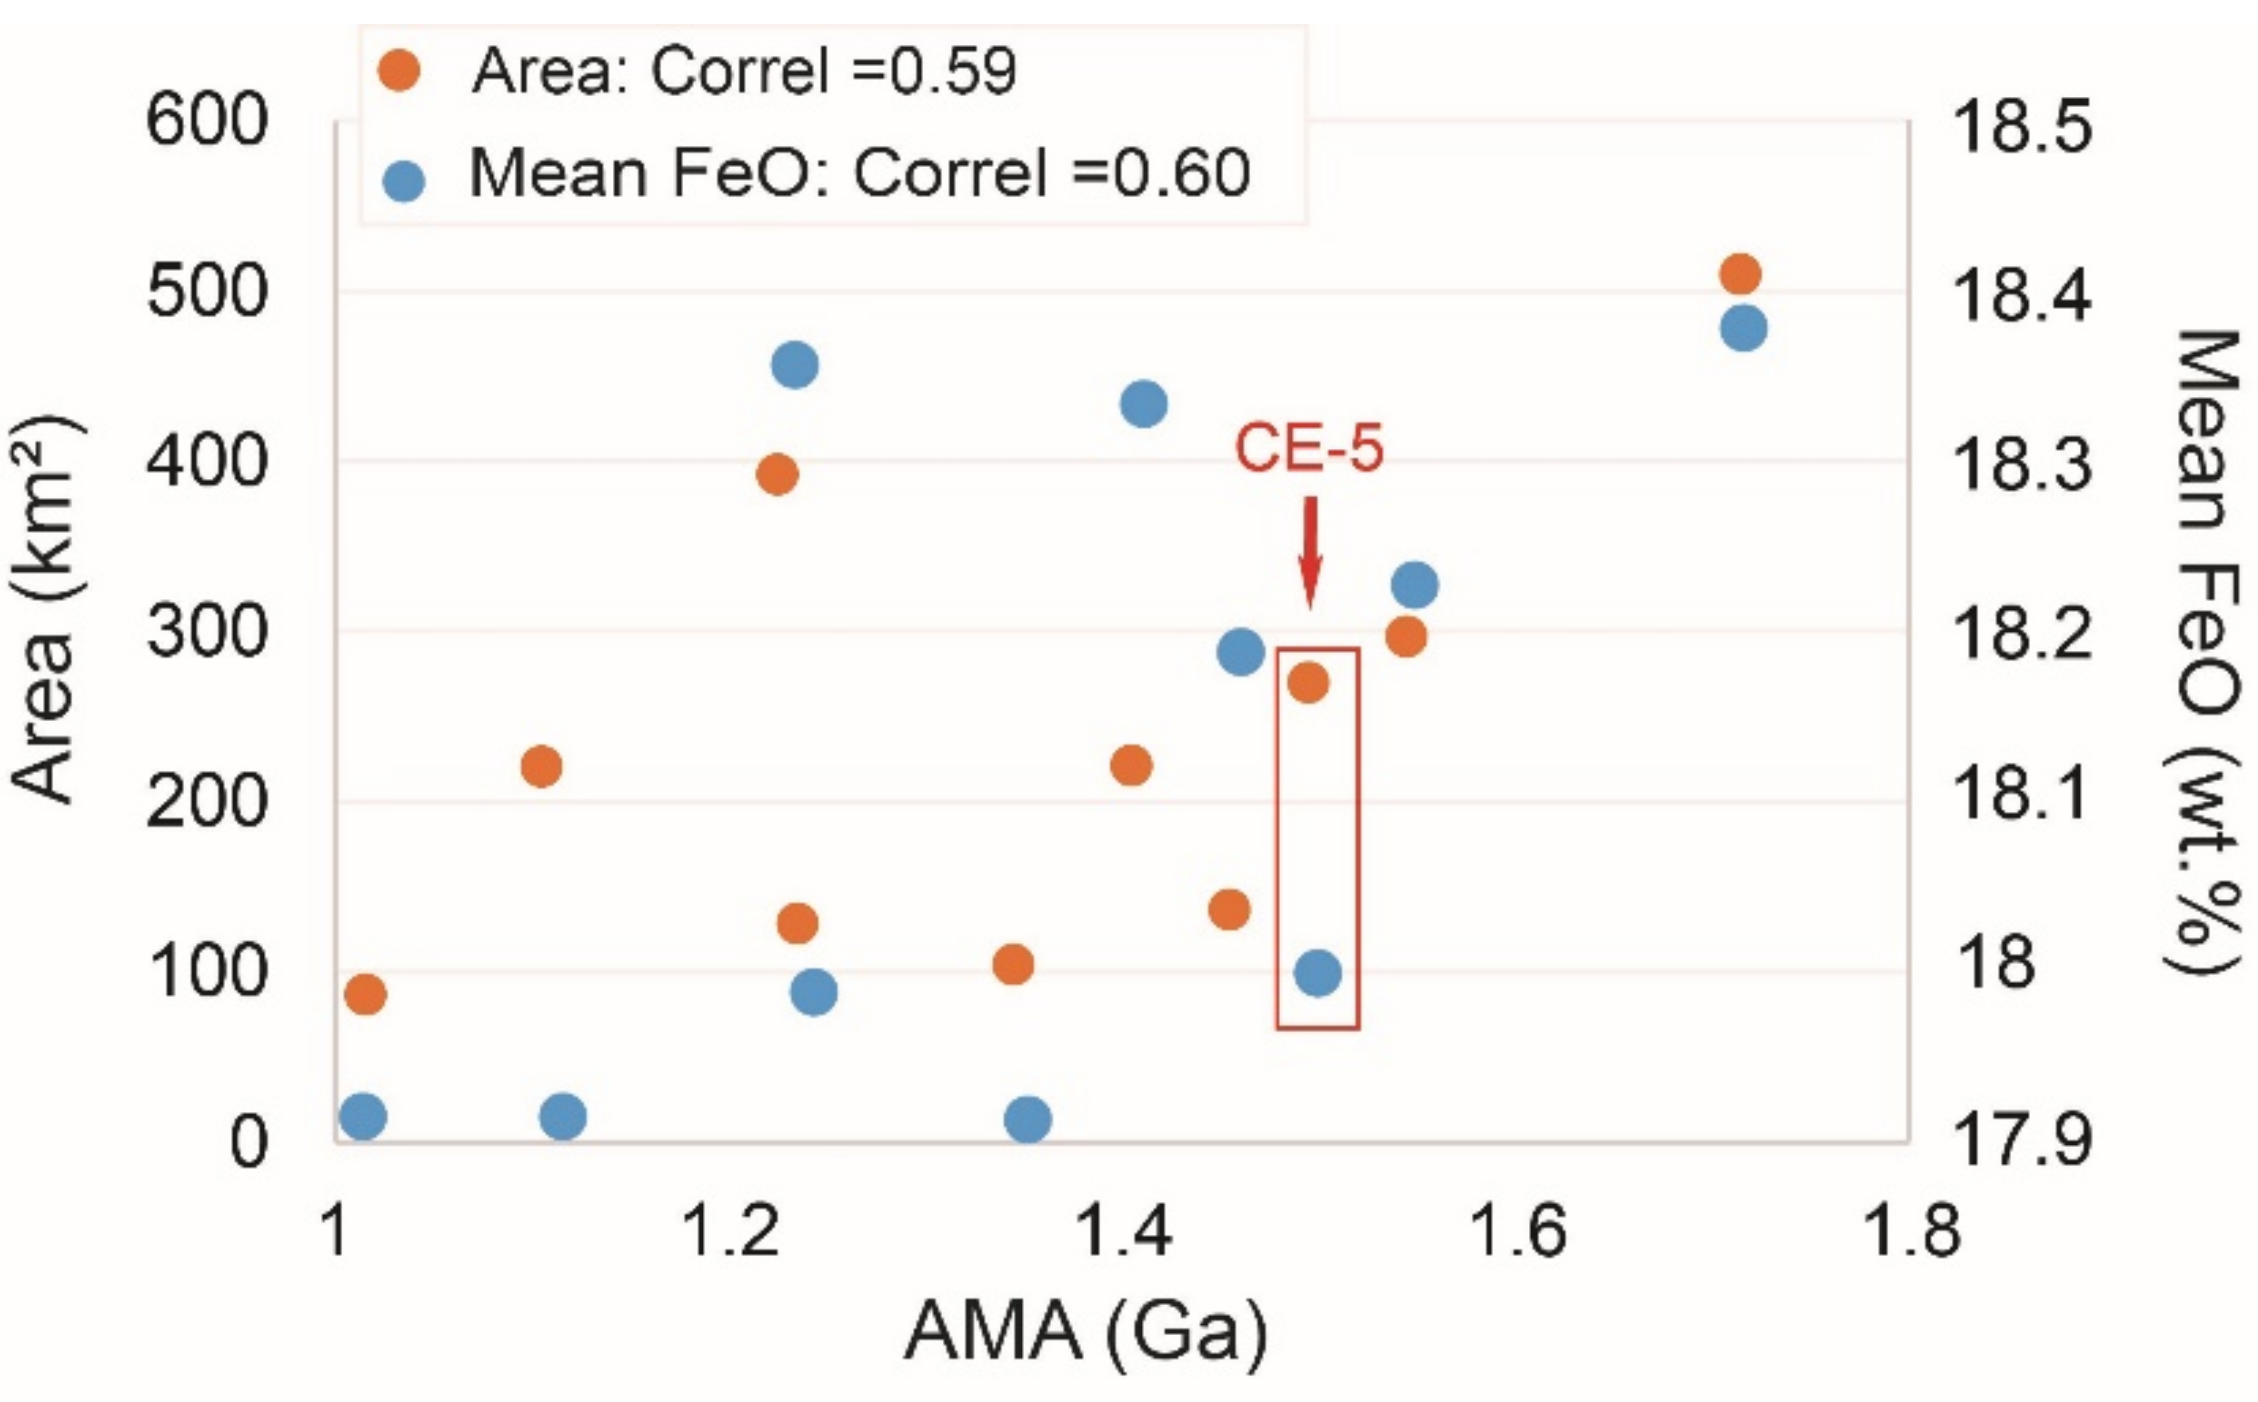
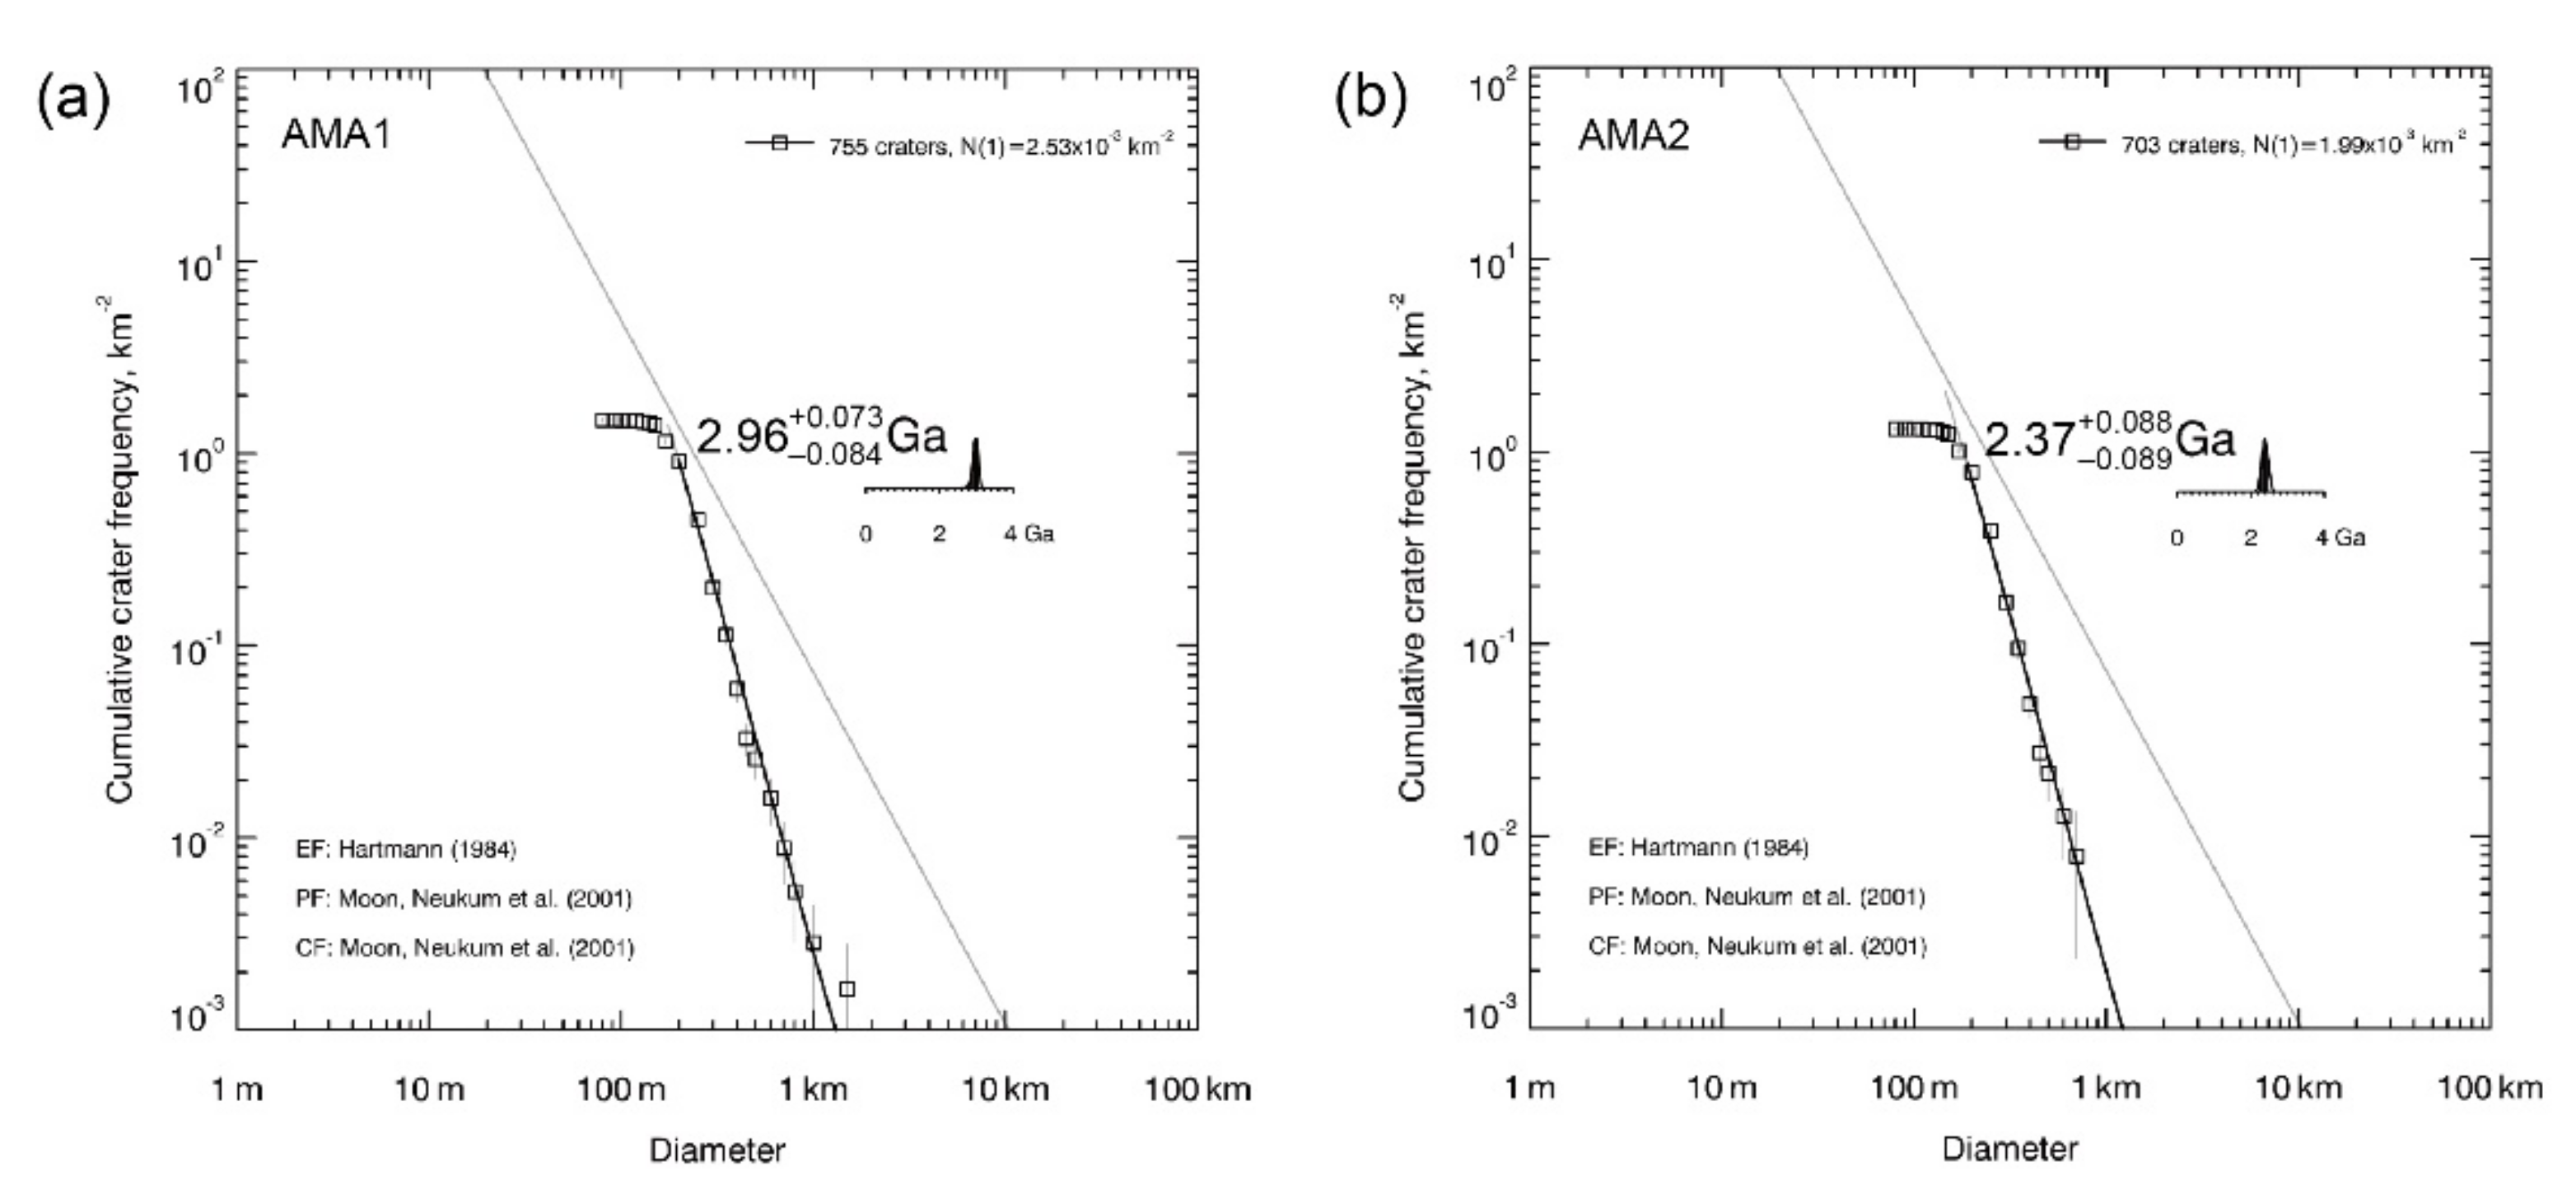
3.3. Model Age Estimates

The absolute model ages were obtained from the CSFD measurements with the statistical results of craters with diameters larger than 100 m, location, and number. The AMA of the whole of the Em4 unit is shown in Figure 7. Em4 ( 1.41 0.028 + 0.027 Ga) and the AMAs of the subunits are shown in Figure 7. Em4ato Em4j, Em4a (1.10 Ga) and Em4b (1.23 Ga) are located in the northwest; Em4d (1.34 Ga) and Em4e (1.01 Ga) are located in the northeast; Em4i (1.22 Ga) and Em4j (1.40 Ga) are located in the southeast. These regions had smaller model ages than the overall AMA of Em4 (1.41 Ga), but were smaller in area and had larger uncertainties in general. The subunit of CE-5 sample collection site, Em4c, is located near the center of Em4 and dated as 1.49 Ga. Em4f (1.45 Ga), Em4g (1.54 Ga), and Em4h (1.71 Ga) are contiguous to the Mairan T dome. These regions have older model ages than the overall AMA of Em4.

4. Discussion

4.1. Model Age of the CE-5 Landing Site

Using crater identification images in different spatial resolutions and different dating areas in the Em4 unit (Figure 6), previous studies have provided different model ages of this area ranging from 2.07 Ga to 1.21 Ga [4,8,9,10,11], as shown in Table 2. Therefore, the age of the CE-5 landing is very suspect. The resolution of the images for crater identification will severely affect the identification of heavily degraded craters and the diameter measurement [46]. According to the hypothesis of the CSFD model, the greater the number of craters, the older the area. If seriously degraded craters are missed, the AMA will be underestimated. Qian et al. [8] identified craters in Em4 using Kaguya TC images with a spatial resolution of 10 m/pixel. We tested the craters in their crater catalog to calculate the AMA of the Em4a. The obtained age was 1.01 0.16 + 0.16 Ga, which was less than the age of this study ( 1.10 0.079 + 0.079 Ga), in which the high resolution LRO NAC images enabled us to identify smaller craters and had higher accuracy in measuring the crater diameters.
LRO NAC images were used in Wu et al. [9], Jia et al. [10], Qian et al. [11] and this study. However, it can be found that the dating areas (Figure 6) of Wu et al. [9] and Jia et al. [10] contained NPB areas. There were many secondaries that were difficult to distinguish from primary craters based on morphology. The dating area of Wu et al. [9] for Em4 involves few NPB, and the AMA 1.49 0.17 + 0.17 Ga was close to that in this study ( 1.41 0.028 + 0.027 Ga). The AMA in the Em4a derived using the crater catalog of Wu et al. [9] was 1.10 0.072 + 0.072 Ga, which was very close to our estimate. The dating area of Jia et al. [10] contained more NPB areas in the central part. The AMA of 2.07 0.028 + 0.027 Ga is far older than this study. In the study of Qian et al. [11], the Em4 region is divided into 52 subunits and each were dated. They estimated the AMA of the whole Em4 unit as 1.53 0.027 + 0.027 Ga, which was older than our result ( 1.41 0.028 + 0.027   Ga). In summary, given the uncertainties, our dating results are consistent with previous studies in general, except for Jia et al. [10]. With the least secondary contamination and good image resolution, the absolute model age of 1.41 0.028 + 0.027 Ga in this study is a reliable estimate about the CSFD of the whole Em4 unit if all the subunits are coevaluated.
It is noticeable that AMAs of subunit Em4a–Em4j range from 1.01 to 1.71 Ga, though we assumed that all the areas were pure basaltic. Several reasons may cause the results. These subunits are different in areas and may have different degrees of ejecta contamination. Though Em4 was defined as an individual mare unit because of its spectroscopic difference from the neighboring mare unit [3,4], it is spatially ununiform, as shown in the morphology in Figure 3a. Em4 may be formed through multi-phase eruptions and experienced different post modifications in different areas. The Rima Sharp that cuts through Em4 indicates the existence of late volcanic activities (Figure 3a), though the FeO and TiO2 concentrations do not show clear discrepancies (Figure 2). The FeO content can indicate the contamination by external ejecta. In an individual mare unit, the area with smaller FeO content indicates higher contamination of highland material. Figure 8 shows that there is no obvious low correlation between AMA and mean FeO content of the investigated subunits, which suggests unobvious contaminations of highland material in these PB subunits. Figure 8 also shows that there is no obvious low correlation between AMA and the crater counting area, which rules out the statistic bias due to area difference. Finally, the lunar chronology function is unconstrainted in 1–3 Ga due to the lack of lunar samples [30], which may lead to higher uncertainties for geologic units with an age in this range.
The CE-5 was landed in the PB subunit Em4c, which covers an area of ~270 km2 and has a relatively smooth surface (Figure 3a). The mean FeO content of Em4c is 18.0 wt.% (Figure 8). Based on 313 craters with a diameter larger than 100 m, the absolute model age of Em4c was 1.49 0.084 + 0.084 Ga, which does not differ from the model age over the whole Em4 region ( 1.41 0.028 + 0.027 ) given the uncertainties. Crater distribution randomness can be used to evaluate if an area is affected by secondary craters as they are usually more clustered than primary craters [47]. Using the CraterStats2 clustering analysis function with the mean 2nd-closest neighbor distance (M2CND) measure method [47], we analyzed the randomness of craters in Em4c. The method evaluates the randomness of testing craters by comparing them with randomly generated craters through Monte Carlo simulations [47]. The clustering analysis results of 5 diameter bins are shown in Figure 9a–e individually and are summarized in Figure 9f. The results show that all the actual values lie inside the Monte Carlo simulations, which suggests that the mapped craters in Em4c are randomly distributed.
Considering the possible spatial heterogeneity over Em4, we suggest that Em4c, rather than the whole Em4, can best characterize the geologic settings of the samples returned by CE-5. The spatially random distribution of the craters in Em4c (Figure 9) suggests that the mapped craters are not affected by secondary craters. Thus, we think that the model age of the CE-5 landing site is 1.49 0.084 + 0.084 Ga. The CSFD of Em4c, combined with the isotopic age from the CE-5 samples, can provide important constraints to the lunar chronology function.

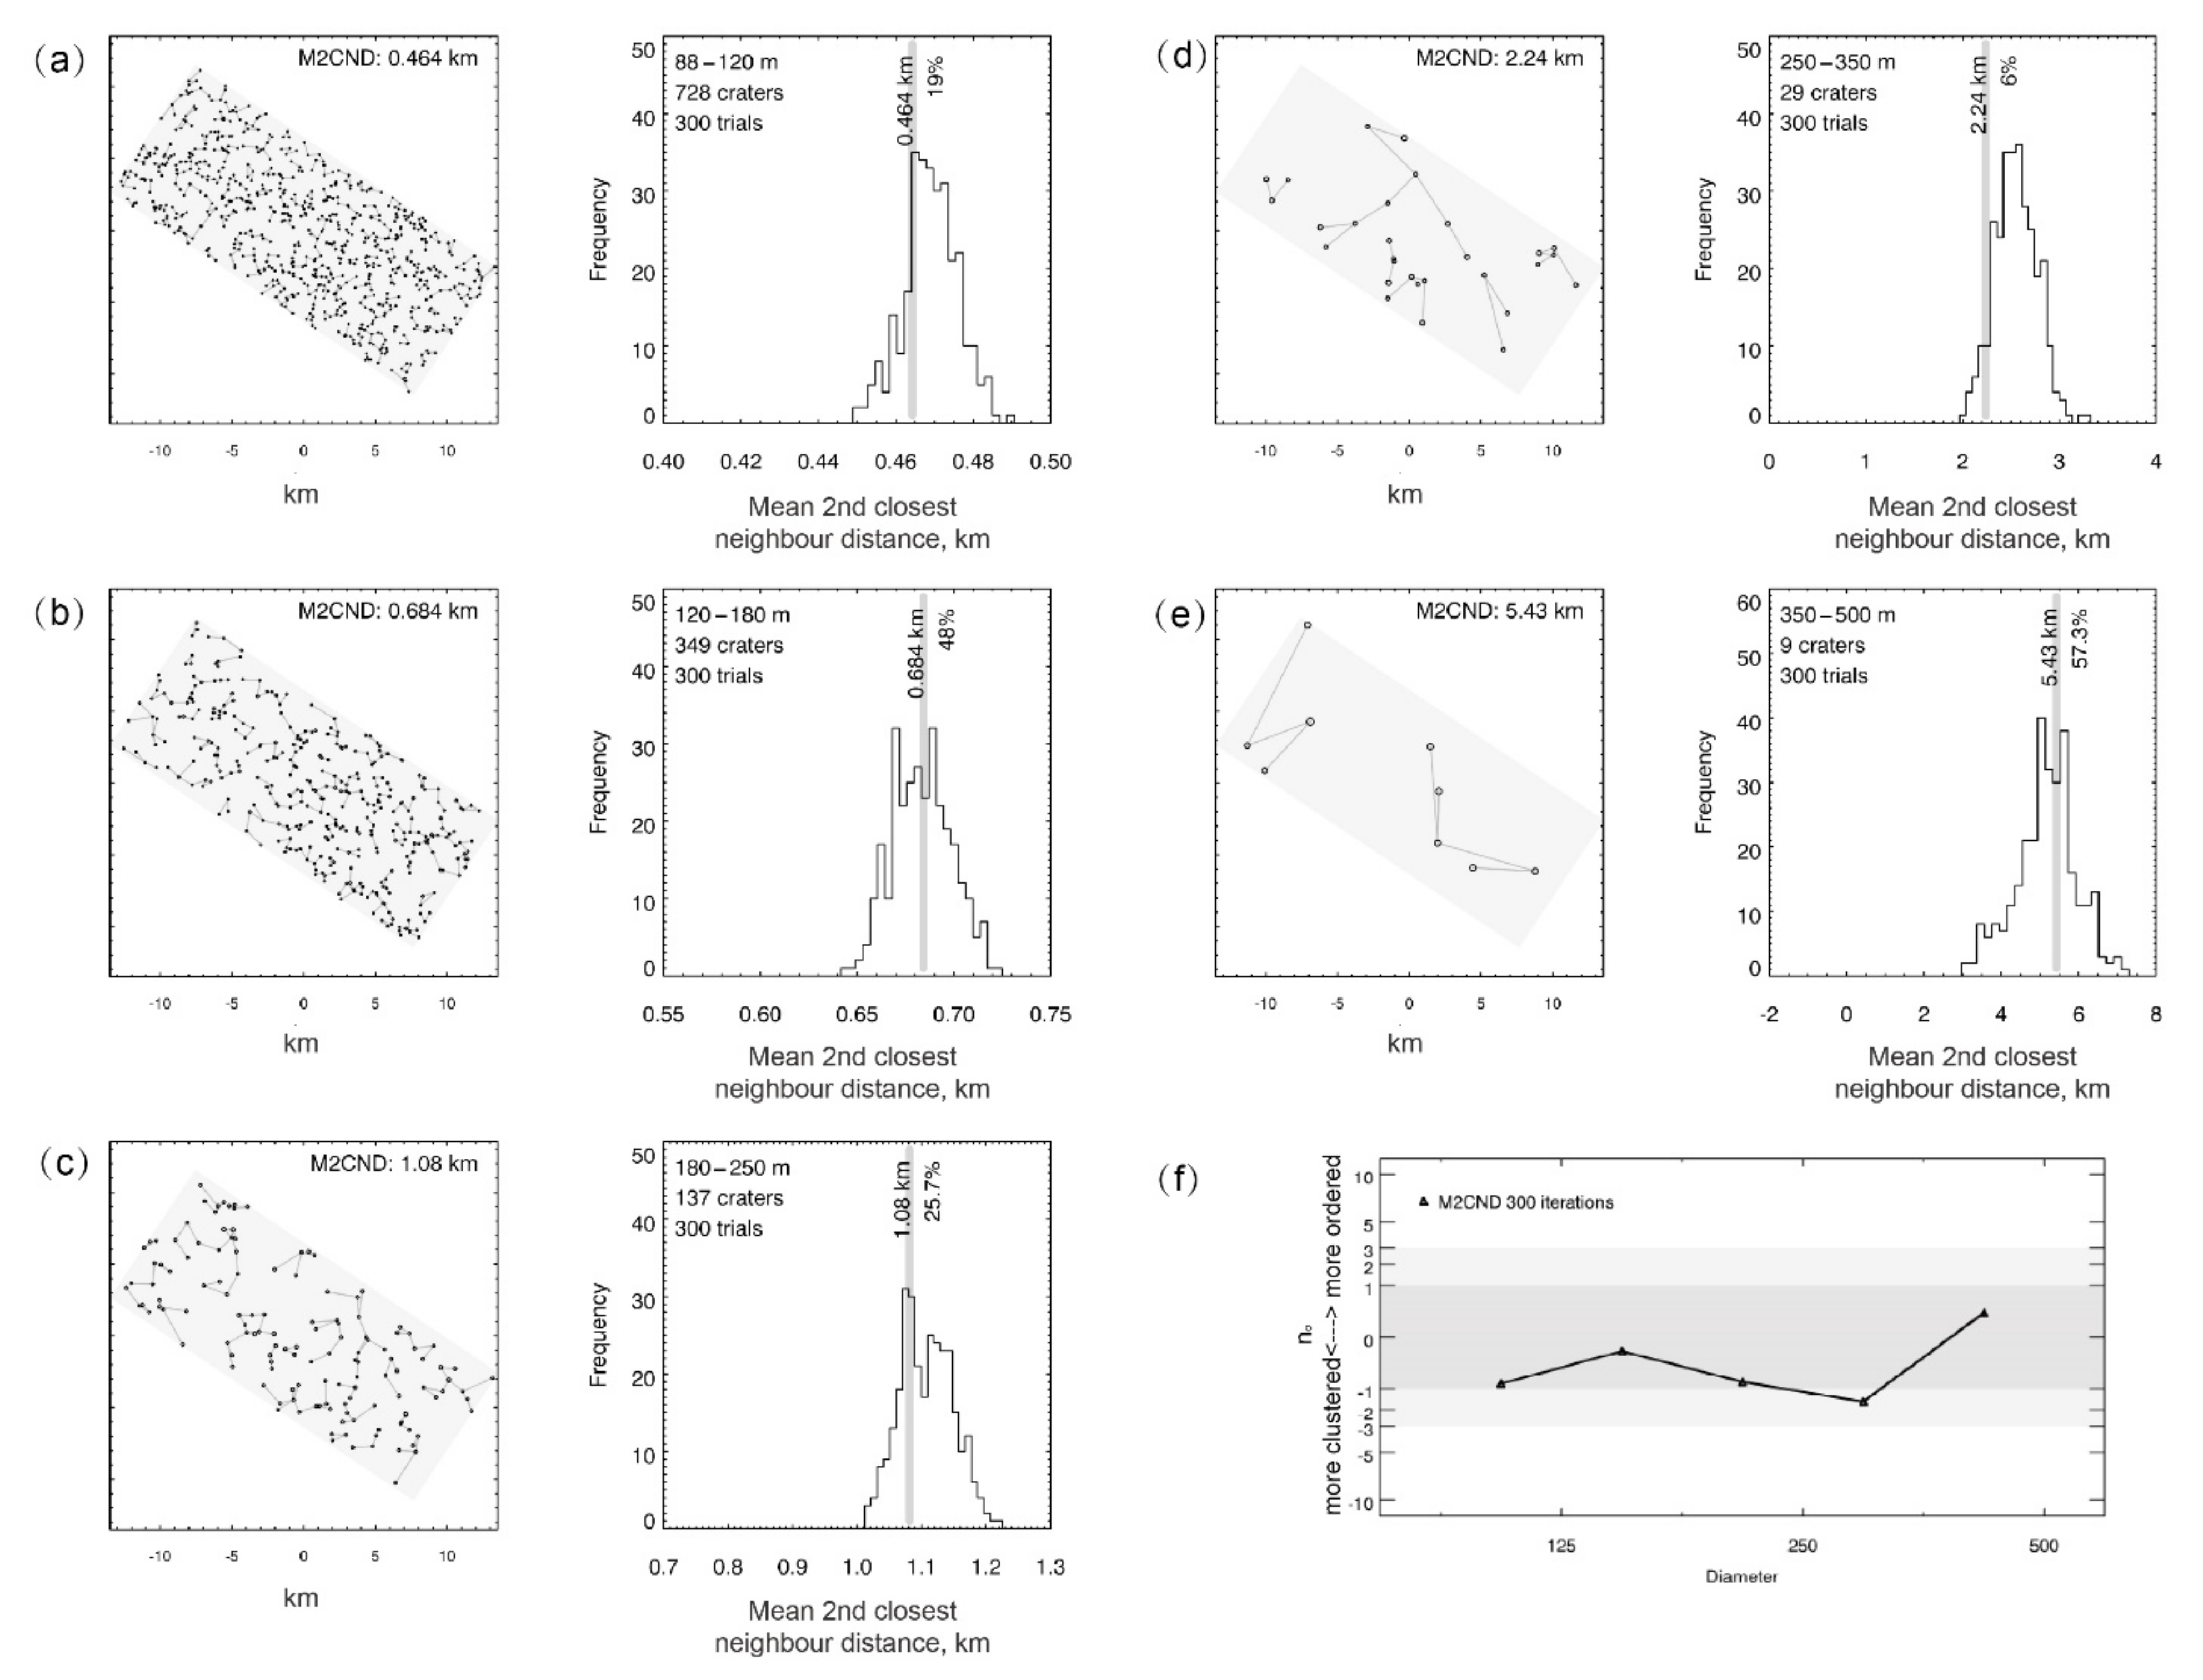
4.2. Evaluating Secondary Crater Effects

In order to evaluate the influence of secondary craters in age dating with CSFD, we selected an area covered by external ejecta according to the FeO classification map (Figure 6 blue rectangle), and dated the CSFD model age. Based on all of the mapped impact craters in this region without excluding the secondary craters, the AMA was 2.96 0.084 + 0.073 Ga, as shown in Figure 10a. After we identified the secondary crater based on morphology and removed them, the AMA of this region was 2.37 0.089 + 0.088 Ga, as shown in Figure 10b. The age was far greater than the PB subunits and most of the other studies of the Em4 region, and the main reason is that the secondaries were not well identified just from the morphologic characteristics. Thus, our crater identifications in PB areas can eliminate the influence of secondary craters with good performance.

4.3. Possible Components of the CE-5 Samples

The CE-5 probe landed in a PB area Em4c (43.0576°N, 308.0839°E). The landing site surface contains 18.1 wt.% FeO, 6.8 wt.% TiO2, and 6.3 ppm Th [15] based on remote sensing data (Figure 1a and Figure 2). The returned samples were predicted with dominating mare basalt. However, with an evolution history of more than 1 Byr, non-mare materials can be transported to the sampling site through post impact events, even if the amount is small. Some small brecciated materials that are not big enough to form secondary craters would be preserved in the form of breccia. It is important to identify these external impact craters that are younger than the landing site to interpret the origination of breccia. The AMAs of the external impact craters around the landing site (Figure 1a) were derived using CSFD model. As shown in Table 3, the AMAs of crater Sharp B, Harding, Copernicus, and Aristarchus were younger than the CE-5 landing area. Thus, the returned samples may contain brecciated materials of these craters.
Sharp B crater is located at the Montes Jura, where the materials are poor in iron, titanium [22], and rich in thorium [15]. The Aristarchus crater has many special rock types such as pure-olivine suite, pure-anorthosite, and alkaline suite [49,50,51]. The Copernicus crater has been detected to have rocks of magnesian-suite, pure-olivine suite, and pure-anorthosite [52,53,54,55]. The Harding crater is located at the Imbrian-aged mare basalt [3], and its ejecta may contain Imbrian-aged basaltic breccia. These special components of young craters are possibly found in the CE-5 returned samples.

4.4. The Significance of the CE-5 Samples

Thermal evolution history is one of the most important aspects for the science of the Moon. The main eruptions of lunar magma are before ~3.0 Ga, but the young volcanism may had lasted up to ~1.0 Ga [3,4]. Revealing more information of the extended periods of lunar magmatism is critical to understanding the whole thermal evolution history. The Em4 mare unit, where the CE-5 probe landed and collected samples, is thought to be produced from the late mare eruption of ~1.3 Ga [3,4]. However, the morphology and geologic structures in this unit suggest that it may have experienced a complex evolution history instead of being produced in one mare eruption activity. In the pure basaltic area that covers the CE-5 landing site, we obtained a model age of 1.49 Ga, which is older than the early estimates of the whole Em4 region with a significant difference [3,4]. Such an old age suggests that the Em4 unit may be not as young as expected, at least in part. The reason may be that early studies defined mare units only by spectral differences on false color images [3,4]. If this is common in other mare units, a deeper investigation of the original mare units may reveal a different magmatism story of the Moon. The CE-5 samples and our CSFD statistics can provide important constraints on this topic. Moreover, our results can be used to renew the lunar cratering chronology function, which has extensive and important implications in studying the Moon and other terrestrial planets.

5. Conclusions

The detailed geological study of the CE-5 landing site is helpful for the analysis of the returned samples. This study provides a method to calculate crater size-frequency distribution over the pure basaltic unit and was applied to the CE-5 landing area. We also analyzed the possible components of the CE-5 samples. Based on above analysis, we drew the following conclusions:
(1)
Pure basalt areas in Em4 were mapped out with FeO contents greater than the threshold of 17.2 wt.%, which was derived from the fresh craters of the region.
(2)
The model age of the pure basaltic unit where the CE-5 landed was 1.49 0.084 + 0.084   Ga based on the craters with a diameter greater than 100 m.
(3)
The ejecta breccia from craters Sharp B, Harding, Copernicus and Aristarchus were possibly sampled by CE-5.
The crater size-frequency distribution of the landing area, in combination with the isotopic ages of returned samples, can be used to constrain lunar cratering chronology model of 1–2 Ga and improve the accuracy of lunar age dating. The improved chronology model is critical not only for lunar science, but also for chronologic studies of other terrestrial planets.

Author Contributions

Conceptualization, Z.X., J.L. and D.G.; Methodology, Z.X. and D.G.; Software, Z.X.; Validation, Z.X.; Data curation, Z.X.; Writing—original draft preparation, Z.X.; Writing—review and editing, D.G. and J.L. All authors have read and agreed to the published version of the manuscript.

Funding

This work was supported by the Strategic Priority Research Program of Chinese Academy of Sciences (Grant No. XDB 41000000), the Pre-research project on Civil Aerospace Technologies by CNSA (Grant No. D020201), and the National Science and Technology Infrastructure Work Projects (Grant No. 2015FY210500). D.G. is supported by National Natural Science Foundation of China (No. 41902317) and the China Postdoctoral Science Foundation (No. 2019M650319).

Institutional Review Board Statement

Not applicable.

Informed Consent Statement

Not applicable.

Data Availability Statement

The Kaguya Multiband Imager (MI) MAP-V3.0 level data are archived in the SELENE Data Archive (http://darts.isas.jaxa.jp/planet/pdap/selene/ accessed on 30 August 2020). The SLDEM2015 is available from LOLA Planetary Data System (PDS) Data Note (http://imbrium.mit.edu/EXTRAS/ accessed on 30 August 2020 SLDEM2015/). The LRO NAC images are available from the LRO data collections (http://wms.lroc.asu.edu/lroc/search accessed on 30 August 2020). The thorium abundance data are available from the PDS Geoscience Node (https://pds-geosciences.wustl.edu/missions/lunarp/reduced_special.html accessed on 30 August 2020).

Acknowledgments

We gratefully acknowledge all those who worked on the SELENE Data Archive to make the Kaguya TC DTM data and Multiband Imager (MI) data publicly available. We also thank the Planetary Data System archive for providing the LRO NAC imagery and SLDEM2015. We are grateful to the anonymous reviewers and editors for their constructive feedback, which improved the quality of this paper.

Conflicts of Interest

The authors declare no conflict of interest.

References

  1. Jolliff, B.L.; Gillis, J.J.; Haskin, L.A.; Korotev, R.L.; Wieczorek, M.A. Major lunar crustal terranes: Surface expressions and crust-mantle origins. J. Geophys. Res. Space Phys. 2000, 105, 4197–4216. [Google Scholar] [CrossRef] [Green Version]
  2. Borg, L.E.; Gaffney, A.M.; Shearer, C.K.; DePaolo, D.J.; Hutcheon, I.D.; Owens, T.L.; Ramon, E.; Brennecka, G. Mechanisms for incompatible-element enrichment on the Moon deduced from the lunar basaltic meteorite Northwest Africa 032. Geochim. Cosmochim. Acta 2009, 73, 3963–3980. [Google Scholar] [CrossRef]
  3. Hiesinger, H.; Head, J.W.; Wolf, U.; Jaumann, R.; Neukum, G. Ages and stratigraphy of mare basalts in Oceanus Procellarum, Mare Nubium, Mare Cognitum, and Mare Insularum. J. Geophys. Res. Planets 2003, 108. [Google Scholar] [CrossRef] [Green Version]
  4. Hiesinger, H.; Head, J.W., III; Wolf, U.; Jaumann, R.; Neukum, G.; Ambrose, W.A.; Williams, D.A. Ages and stratigraphy of lunar mare basalts: A synthesis. In Recent Advances and Current Research Issues in Lunar Stratigraphy; Geological Society of America: Boulder, CO, USA, 2011; Volume 477. [Google Scholar]
  5. Neukum, G.; Ivanov, B.A. Crater size distributions and impact probabilities on earth from lunar, terrestrial planeta, and asteroid cratering data. In Hazards due to Comets and Asteroids; University of Arizona Press: Tucson, AZ, USA, 1994; pp. 359–416. [Google Scholar]
  6. Neukum, G.; Ivanov, B.; Hartmann, W.K. Cratering records in the Inner solar system in relation to the lunar reference system. Space Sci. Rev. 2001, 96, 55–86. [Google Scholar] [CrossRef]
  7. Neukum, G.; König, B.; Arkani-Hamed, J. A study of lunar impact crater size-distributions. Moon 1975, 12, 201–229. [Google Scholar] [CrossRef]
  8. Qian, Y.Q.; Xiao, L.; Zhao, S.Y.; Zhao, J.N.; Huang, J.; Flahaut, J.; Martinot, M.; Head, J.W.; Hiesinger, H.; Wang, G.X. Geology and scientific significance of the Rumker region in northern Oceanus Procellarum: China’s Chang’E-5 landing region. J. Geophys. Res. Planets 2018, 123, 1407–1430. [Google Scholar] [CrossRef] [Green Version]
  9. Wu, B.; Huang, J.; Li, Y.; Wang, Y.; Peng, J. Rock abundance and crater density in the candidate Chang’E-5 landing region on the Moon. J. Geophys. Res. Planets 2018, 123, 3256–3272. [Google Scholar] [CrossRef]
  10. Jia, M.; Yue, Z.; Di, K.; Liu, B.; Liu, J.; Michael, G. A catalogue of impact craters larger than 200 m and surface age analysis in the Chang’e-5 landing area. Earth Planet. Sci. Lett. 2020, 541, 116272. [Google Scholar] [CrossRef]
  11. Qian, Y.; Xiao, L.; Head, J.W.; van der Bogert, C.H.; Hiesinger, H.; Wilson, L. Young lunar mare basalts in the Chang’e-5 sample return region, northern Oceanus Procellarum. Earth Planet. Sci. Lett. 2021, 555, 116702. [Google Scholar] [CrossRef]
  12. Basilevsky, A.T.; Kozlova, N.A.; Zavyalov, I.Y.; Karachevtseva, I.P.; Kreslavsky, M.A. Morphometric studies of the Copernicus and Tycho secondary craters on the moon: Dependence of crater degradation rate on crater size. Planet. Space Sci. 2018, 162, 31–40. [Google Scholar] [CrossRef]
  13. Stadermann, A.C.; Zanetti, M.R.; Jolliff, B.L.; Hiesinger, H.; van der Bogert, C.H.; Hamilton, C.W. The age of lunar mare basalts south of the Aristarchus Plateau and effects of secondary craters formed by the Aristarchus event. Icarus 2018, 309, 45–60. [Google Scholar] [CrossRef]
  14. Werner, S.C.; Ivanov, B.A.; Neukum, G. Theoretical analysis of secondary cratering on Mars and an image-based study on the Cerberus Plains. Icarus 2009, 200, 406–417. [Google Scholar] [CrossRef]
  15. Lawrence, D.J.; Puetter, R.C.; Elphic, R.C.; Feldman, W.C.; Hagerty, J.J.; Prettyman, T.H.; Spudis, P.D. Global spatial deconvolution of Lunar Prospector Th abundances. Geophys. Res. Lett. 2007, 34. [Google Scholar] [CrossRef] [Green Version]
  16. Ohtake, M.; Haruyama, J.; Matsunaga, T.; Yokota, Y.; Morota, T.; Honda, C.; Team, L. Performance and scientific objectives of the SELENE (KAGUYA) Multiband Imager. Earth Planets Space 2008, 60, 257–264. [Google Scholar] [CrossRef] [Green Version]
  17. Haruyama, J.; Ohtake, M.; Matsunaga, T.; Otake, H.; Ishihara, Y.; Masuda, K.; Yokota, Y.; Yamamoto, S. Data products of SELENE (Kaguya) Terrain Camera for future lunar missions. In Proceedings of the Lunar and Planetary Science Conference, The Woodlands, TX, USA, 17–21 March 2014; p. 1304. [Google Scholar]
  18. Barker, M.K.; Mazarico, E.; Neumann, G.A.; Zuber, M.T.; Haruyama, J.; Smith, D.E. A new lunar digital elevation model from the Lunar Orbiter Laser Altimeter and SELENE Terrain Camera. Icarus 2016, 273, 346–355. [Google Scholar] [CrossRef] [Green Version]
  19. Robinson, M.S.; Brylow, S.M.; Tschimmel, M.; Humm, D.; Lawrence, S.J.; Thomas, P.C.; Denevi, B.W.; Bowman-Cisneros, E.; Zerr, J.; Ravine, M.A.; et al. Lunar Reconnaissance Orbiter Camera (LROC) instrument overview. Space Sci. Rev. 2010, 150, 81–124. [Google Scholar] [CrossRef]
  20. Lucey, P.G.; Blewett, D.T.; Jolliff, B.L. Lunar iron and titanium abundance algorithms based on final processing of Clementine ultraviolet-visible images. J. Geophys. Res. Planets 2000, 105, 20297–20305. [Google Scholar] [CrossRef]
  21. Ling, Z.; Zhang, J.; Liu, J.; Li, B.; Wu, Z.; Ni, Y.; Sun, L.; Chen, J. Lunar global FeO and TiO2 mapping based on the recalibrated Chang ‘ E-1 dataset. Acta Petrol. Sin. 2016, 32, 87–98. [Google Scholar]
  22. Otake, H.; Ohtake, M.; Hirata, N. Lunar iron and titanium abundance algorithms based on SELENE (Kaguya) Multiband Imager data. In Proceedings of the Lunar and Planetary Science Conference, The Woodlands, TX, USA, 19–23 March 2012; p. 1905. [Google Scholar]
  23. Lawrence, D.J.; Feldman, W.C.; Elphic, R.C.; Little, R.C.; Prettyman, T.H.; Maurice, S.; Lucey, P.G.; Binder, A.B. Iron abundances on the lunar surface as measured by the Lunar Prospector gamma-ray and neutron spectrometers. J. Geophys. Res. Planets 2002, 107, 13-1–13-26. [Google Scholar] [CrossRef]
  24. Sato, H.; Robinson, M.S.; Lawrence, S.J.; Denevi, B.W.; Hapke, B.; Jolliff, B.L.; Hiesinger, H. Lunar mare TiO2 abundances estimated from UV/Vis reflectance. Icarus 2017, 296, 216–238. [Google Scholar] [CrossRef]
  25. Lemelin, M.; Lucey, P.G.; Song, E.; Taylor, G.J. Lunar central peak mineralogy and iron content using the Kaguya Multiband Imager: Reassessment of the compositional structure of the lunar crust. J. Geophys. Res. Planets 2015, 120, 869–887. [Google Scholar] [CrossRef]
  26. Pieters, C.M.; Englert, P.A.J. Compositional diversity and stratigraphy of the lunar crust derived from reflectance spectroscopy. In Remote Geochemical Analysis, Elemental and Mineralogical Composition; Pieters, C.M., Ed.; Cambridge University Press: Cambridge, UK, 1993. [Google Scholar]
  27. Korotev, R.L.; Jolliff, B.L.; Zeigler, R.A.; Gillis, J.J.; Haskin, L.A. Feldspathic lunar meteorites and their implications for compositional remote sensing of the lunar surface and the composition of the lunar crust. Geochim. Cosmochim. Acta 2003, 67, 4895–4923. [Google Scholar] [CrossRef]
  28. Hörz, F.; Ostertag, R.; Rainey, D.A. Bunte Breccia of the Ries: Continuous deposits of large impact craters. Rev. Geophys. 1983, 21, 1667–1725. [Google Scholar] [CrossRef] [Green Version]
  29. Xie, M.; Zhu, M.-H. Estimates of primary ejecta and local material for the Orientale basin: Implications for the formation and ballistic sedimentation of multi-ring basins. Earth Planet. Sci. Lett. 2016, 440, 71–80. [Google Scholar] [CrossRef]
  30. Hiesinger, H.; Jaumann, R.; Neukum, G.; Head III, J.W. Ages of mare basalts on the lunar nearside. J. Geophys. Res. Planets 2000, 105, 29239–29275. [Google Scholar] [CrossRef]
  31. Neukum, G. Meteorite Bombardment and Dating of Planetary Surfaces; National Aeronautics and Space Administration: Washington, DC, USA, 1984. [Google Scholar]
  32. Hartmann, W.K. Martian cratering 8: Isochron refinement and the chronology of Mars. Icarus 2005, 174, 294–320. [Google Scholar] [CrossRef]
  33. Neukum, G.; Horn, P. Effects of lava flows on lunar crater populations. Moon 1976, 15, 205–222. [Google Scholar] [CrossRef]
  34. Michael, G.G.; Neukum, G. Planetary surface dating from crater size–frequency distribution measurements: Partial resurfacing events and statistical age uncertainty. Earth Planet. Sci. Lett. 2010, 294, 223–229. [Google Scholar] [CrossRef]
  35. Hartmann, W.K. Does crater “saturation equilibrium” occur in the solar system? Icarus 1984, 60, 56–74. [Google Scholar] [CrossRef]
  36. Michael, G.G.; Kneissl, T.; Neesemann, A. Planetary surface dating from crater size-frequency distribution measurements: Poisson timing analysis. Icarus 2016, 277, 279–285. [Google Scholar] [CrossRef]
  37. Konopliv, A.S.; Park, R.S.; Yuan, D.-N.; Asmar, S.W.; Watkins, M.M.; Williams, J.G.; Fahnestock, E.; Kruizinga, G.; Paik, M.; Strekalov, D.; et al. High-resolution lunar gravity fields from the GRAIL Primary and Extended Missions. Geophys. Res. Lett. 2014, 41, 1452–1458. [Google Scholar] [CrossRef]
  38. Hurwitz, D.M.; Head, J.W.; Hiesinger, H. Lunar sinuous rilles: Distribution, characteristics, and implications for their origin. Planet. Space Sci. 2013, 79–80, 1–38. [Google Scholar] [CrossRef]
  39. Lu, Y.; Wu, Y.; Michael, G.G.; Basilevsky, A.T.; Li, C. Young wrinkle ridges in Mare Imbrium: Evidence for very recent compressional tectonism. Icarus 2019, 329, 24–33. [Google Scholar] [CrossRef]
  40. Yue, Z.; Li, W.; Di, K.; Liu, Z.; Liu, J. Global mapping and analysis of lunar wrinkle ridges. J. Geophys. Res. Planets 2015, 120, 978–994. [Google Scholar] [CrossRef] [Green Version]
  41. Boyce, J.M.; Giguere, T.; Mouginis-Mark, P.; Glotch, T.; Taylor, G.J. Geology of Mairan middle dome: Its implication to silicic volcanism on the Moon. Planet. Space Sci. 2018, 162, 62–72. [Google Scholar] [CrossRef]
  42. Glotch, T.D.; Hagerty, J.J.; Lucey, P.G.; Hawke, B.R.; Giguere, T.A.; Arnold, J.A.; Williams, J.-P.; Jolliff, B.L.; Paige, D.A. The Mairan domes: Silicic volcanic constructs on the Moon. Geophys. Res. Lett. 2011, 38. [Google Scholar] [CrossRef] [Green Version]
  43. Xiao, Z.; Zeng, Z.; Ding, N.; Molaro, J. Mass wasting features on the Moon—How active is the lunar surface? Earth Planet. Sci. Lett. 2013, 376, 1–11. [Google Scholar] [CrossRef]
  44. Giguere, T.A.; Taylor, G.J.; Hawke, B.R.; Lucey, P.G. The titanium contents of lunar mare basalts. Meteorit. Planet. Sci. 2000, 35, 193–200. [Google Scholar] [CrossRef]
  45. Fischer, E.M.; Pieters, C.M. Remote determination of exposure degree and iron concentration of lunar soils using VIS-NIR spectroscopic methods. Icarus 1994, 111, 475–488. [Google Scholar] [CrossRef]
  46. Xiao, Z.; Strom, R.G. Problems determining relative and absolute ages using the small crater population. Icarus 2012, 220, 254–267. [Google Scholar] [CrossRef]
  47. Michael, G.G.; Platz, T.; Kneissl, T.; Schmedemann, N. Planetary surface dating from crater size-frequency distribution measurements: Spatial randomness and clustering. Icarus 2012, 218, 169–177. [Google Scholar] [CrossRef]
  48. Mazrouei, S.; Ghent, R.R.; Bottke, W.F.; Parker, A.H.; Gernon, T.M. Response to Comment on “Earth and Moon impact flux increased at the end of the Paleozoic”. Science 2019, 365. [Google Scholar] [CrossRef] [Green Version]
  49. Mustard, J.F.; Pieters, C.M.; Isaacson, P.J.; Head, J.W.; Besse, S.; Clark, R.N.; Klima, R.L.; Petro, N.E.; Staid, M.I.; Sunshine, J.M.; et al. Compositional diversity and geologic insights of the Aristarchus crater from Moon Mineralogy Mapper data. J. Geophys. Res. Planets 2011, 116. [Google Scholar] [CrossRef] [Green Version]
  50. Le Mouelic, S.; Langevin, Y.; Erard, S. The distribution of olivine in the crater Aristarchus inferred from Clementine NIR data. Geophys. Res. Lett. 1999, 26, 1195–1198. [Google Scholar] [CrossRef]
  51. Ling, Z.; Zhang, J.; Wu, Z.; Sun, L.; Liu, J. The compositional distribution and rock types of the Aristarchus region on the Moon. Sci. Sin. Phys. Mech. Astron. Astrophys. 2013, 43, 1403–1410. (In Chinese) [Google Scholar] [CrossRef]
  52. Dhingra, D.; Pieters, C.M.; Head, J.W.; Isaacson, P.J. Large mineralogically distinct impact melt feature at Copernicus crater—Evidence for retention of compositional heterogeneity. Geophys. Res. Lett. 2013, 40, 1043–1048. [Google Scholar] [CrossRef] [Green Version]
  53. Lucey, P.G.; Hawke, B.R.; Horton, K. The distribution of olivine in the Crater Copernicus. Geophys. Res. Lett. 1991, 18, 2133–2136. [Google Scholar] [CrossRef]
  54. Pieters, C.M. Copernicus crater central peak: Lunar mountain of unique composition. Science 1982, 215, 59–61. [Google Scholar] [CrossRef] [PubMed] [Green Version]
  55. Ohtake, M.; Matsunaga, T.; Haruyama, J.; Yokota, Y.; Morota, T.; Honda, C.; Ogawa, Y.; Torii, M.; Miyamoto, H.; Arai, T.; et al. The global distribution of pure anorthosite on the Moon. Nature 2009, 461, 236–240. [Google Scholar] [CrossRef] [PubMed]
Figure 1. (a) Th content of Procellarum KREEP Terrane (PKT) in simple cylindrical projection (the red solid line is the boundary of PKT; the black solid line denotes geologic boundary of Em4 [8]; “A” represents the Apollo sampling sites and “L” represents the Luna sampling sites; the background image is the hillshade produced from SLDEM2015; Th data were observed from LP mission with the resolution of 5°/pixel [15]). (b) Kaguya MI 1550 nm band reflectance image covering the Em4 unit in Lambert conformal conic projection (the red flag marks the CE-5 landing site. The arrows denote the external ejecta patches from different directions). (c,d) show the secondaries in the areas marked by white boxes in (b). The secondaries in (c) are in cluster and chain patterns. (d) shows an elongated crater with the long and short axes of 850 m and 634 m, respectively. The elongated shape indicates a secondary impact origin.
Remotesensing 13 01515 g001
Figure 2. FeO (a) and TiO2 (b) abundances of the Em4 unit. The red flag marks the CE-5 landing site. The dark grey line denotes the geologic boundary of Em4. The arrow denotes the external ejecta from different directions.
Remotesensing 13 01515 g002
Figure 3. (a) Topography of the Em4 unit and surrounding terrains. The elevation is Kaguya TC DTM. The base image is SLDEM2015 hillshade. The yellow lines denote volcanic domes. The red stars denote volcanic vents. The crimson lines denote Rima Sharp. The black lines denote wrinkle ridges. The red flag marks the CE-5 landing site. The white line denotes the boundaries of Em4c. The grey line denotes the geologic boundaries of Em4. (b) Wrinkle ridge (53.96°W, 41.79°N). (c) Rima sharp (51.40°W, 43.48°N). (d) Mairan T Dome (48.51°W, 41.79°N).
Remotesensing 13 01515 g003
Figure 4. FeO (a) and TiO2 (b) classification map. (c) and (d) show the relative frequencies of FeO and TiO2 contents, respectively.
Remotesensing 13 01515 g004
Figure 5. (a) LRO NAC image of the crater No. 2 in Table 1. (b,c) show the TiO2 and FeO contents of the same crater. The circles in (b,c) represent the extents of 1 and 1.5 radii from the crater center, where the FeO and TiO2 contents of the pixels are collected.
Remotesensing 13 01515 g005
Figure 6. Crater counting areas of previous studies and this study. The pure basalt areas and non-pure basalt areas are mapped.
Remotesensing 13 01515 g006
Figure 7. Crater size-frequency distributions, mean AMAs of Em4 and subunits Em4a–Em4j. The AMAs were determined using the Craterstats2 Tool [34] with the production and chronology functions of Neukum et al. [6].
Remotesensing 13 01515 g007
Figure 8. The correlations of AMAs with crater counting areas and mean FeO contents. Correl = correlation coefficient. Orange points denote the AMAs against subunit areas and the correlation coefficient is 0.59. Blue points denote the AMAs against mean FeO contents and the correlation coefficient is 0.60.
Remotesensing 13 01515 g008
Figure 9. (ae) show the clustering analysis for five consecutive diameter bins of craters in Em4c. Craters are shown to scale with line segments connecting 2nd-closest neighbors. The measured mean 2nd-closest neighbor distance (M2CND) is plotted with respect to the Monte Carlo M2CND histogram for simulated random scatterings of the same crater catalog [47]. (f) n sigma plot of M2CND all the diameter bins.
Remotesensing 13 01515 g009
Figure 10. AMAs of the area contaminated by external ejecta before (a) and after (b) secondary craters were removed based on the crater morphology. Location of the area is shown as the blue square in Figure 6.
Remotesensing 13 01515 g010
Table 1. Properties of the identified fresh craters in the Em4 region.
Crater Number
(No.)
X (°)Y (°)Diameter (m)FeO (wt.%)
Mean
FeO (wt.%)
Median
Standard
Deviation
1309.2483 43.5156 898 17.0 17.0 1.05
2308.2003 42.6849 275 17.6 17.7 0.66
3306.5969 41.0291 396 16.9 16.9 0.97
4310.9380 40.0592 335 17.7 17.7 0.63
5309.7386 40.4121 252 17.4 17.3 0.71
6308.0127 43.1216 339 17.7 17.6 0.74
7307.2733 43.2583 646 17.2 17.2 0.63
8306.6480 41.2637 328 17.5 17.4 0.85
9309.7550 42.8579 747 17.2 17.0 0.90
10311.4511 40.6872 477 17.5 17.5 0.64
11311.2801 41.4460 443 17.4 17.4 0.68
12305.0674 41.7707 307 17.5 17.5 0.56
13311.2772 42.9367 392 17.2 17.2 0.63
All craters 16.617.23.49
Table 2. Absolute model age dating results of Em4 in this study and previous studies.
Crater Mapping ImageEm4 AMA (Ga)Crater Countering Area (km2)Minimum
Diameter (m)
Crater Number
Qian et al. [8]Kaguya TC 1.21 0.03 + 0.03 47422001580
Wu et al. [9]NAC 1.49 0.17 + 0.17 560750077
Jia et al. [10]NAC 2.07 0.028 + 0.027 17,074>2006455
Qian et al. [11]NAC 1.53 0.027 + 0.027 29,6003003268
This studyNAC 1.41 0.028 + 0.027 2361>1002611
Table 3. The location and AMA of external craters younger than the CE-5 landing area.
Crater NameLongitude (°)Latitude (°)Diameter (km)Distance (km)AMA (Ga)
Sharp B314.63 47.02 20.56 184.64 1.32 0.18 + 0.18
Harding288.31 43.55 22.68 435.60 1.25 0.36 + 0.44
Copernicus
Aristarchus
339.87 9.68 95.10 1315.05 0.80 a
312.45 23.77 40.32 594.93 0.14 0.022 + 0.022  
a: the AMA of Copernicus crater is based on Mazrouei et al. [48] where uncertainties are not provided.
Publisher’s Note: MDPI stays neutral with regard to jurisdictional claims in published maps and institutional affiliations.

