Article

Machine Learning Optimised Hyperspectral Remote Sensing Retrieves Cotton Nitrogen Status
1
Faculty of Science, School of Life and Environmental Sciences, Sydney Institute of Agriculture, The University of Sydney, Sydney, NSW 2006, Australia
2
CSIRO Agriculture and Food, Australian Cotton Research Institute, Locked Bag 59, Narrabri, NSW 2390, Australia
3
Faculty of Science, School of Physics, The University of Sydney, Sydney, NSW 2006, Australia
*
Author to whom correspondence should be addressed.
Remote Sens. 2021, 13(8), 1428; https://doi.org/10.3390/rs13081428
Submission received: 10 March 2021 / Revised: 30 March 2021 / Accepted: 3 April 2021 / Published: 7 April 2021
(This article belongs to the Special Issue Feature Extraction and Data Classification in Hyperspectral Imaging)

Abstract

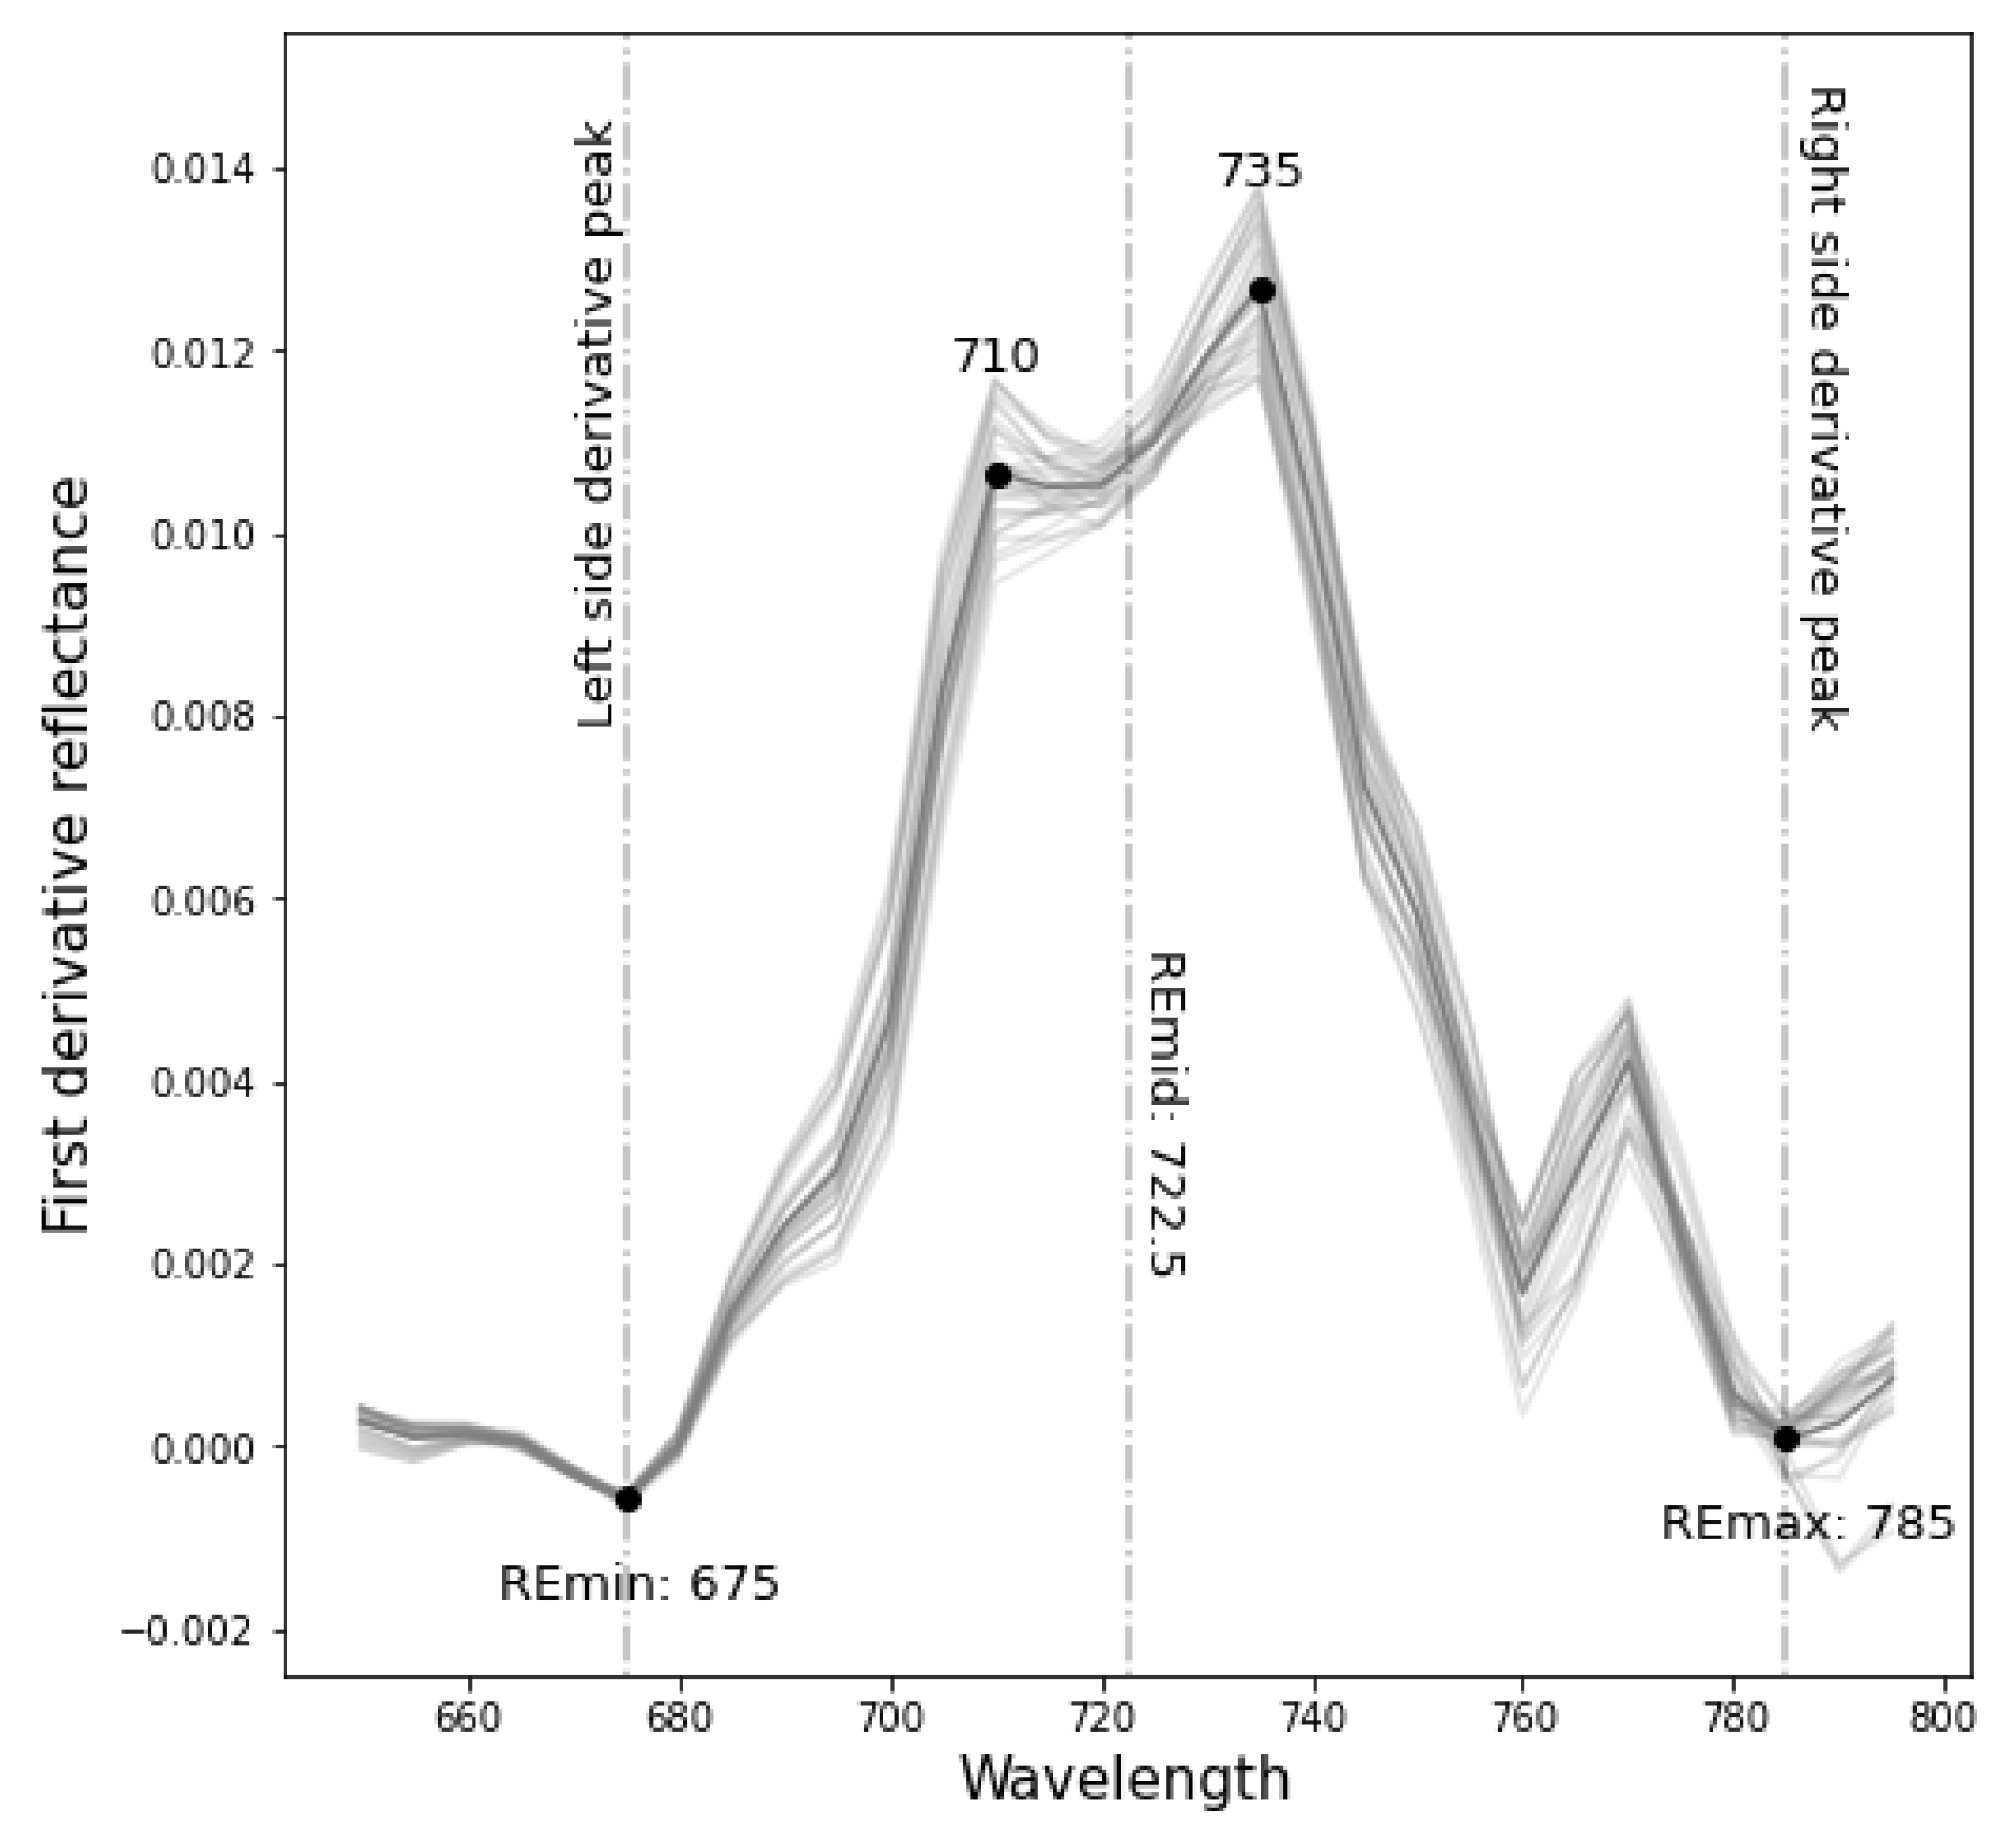
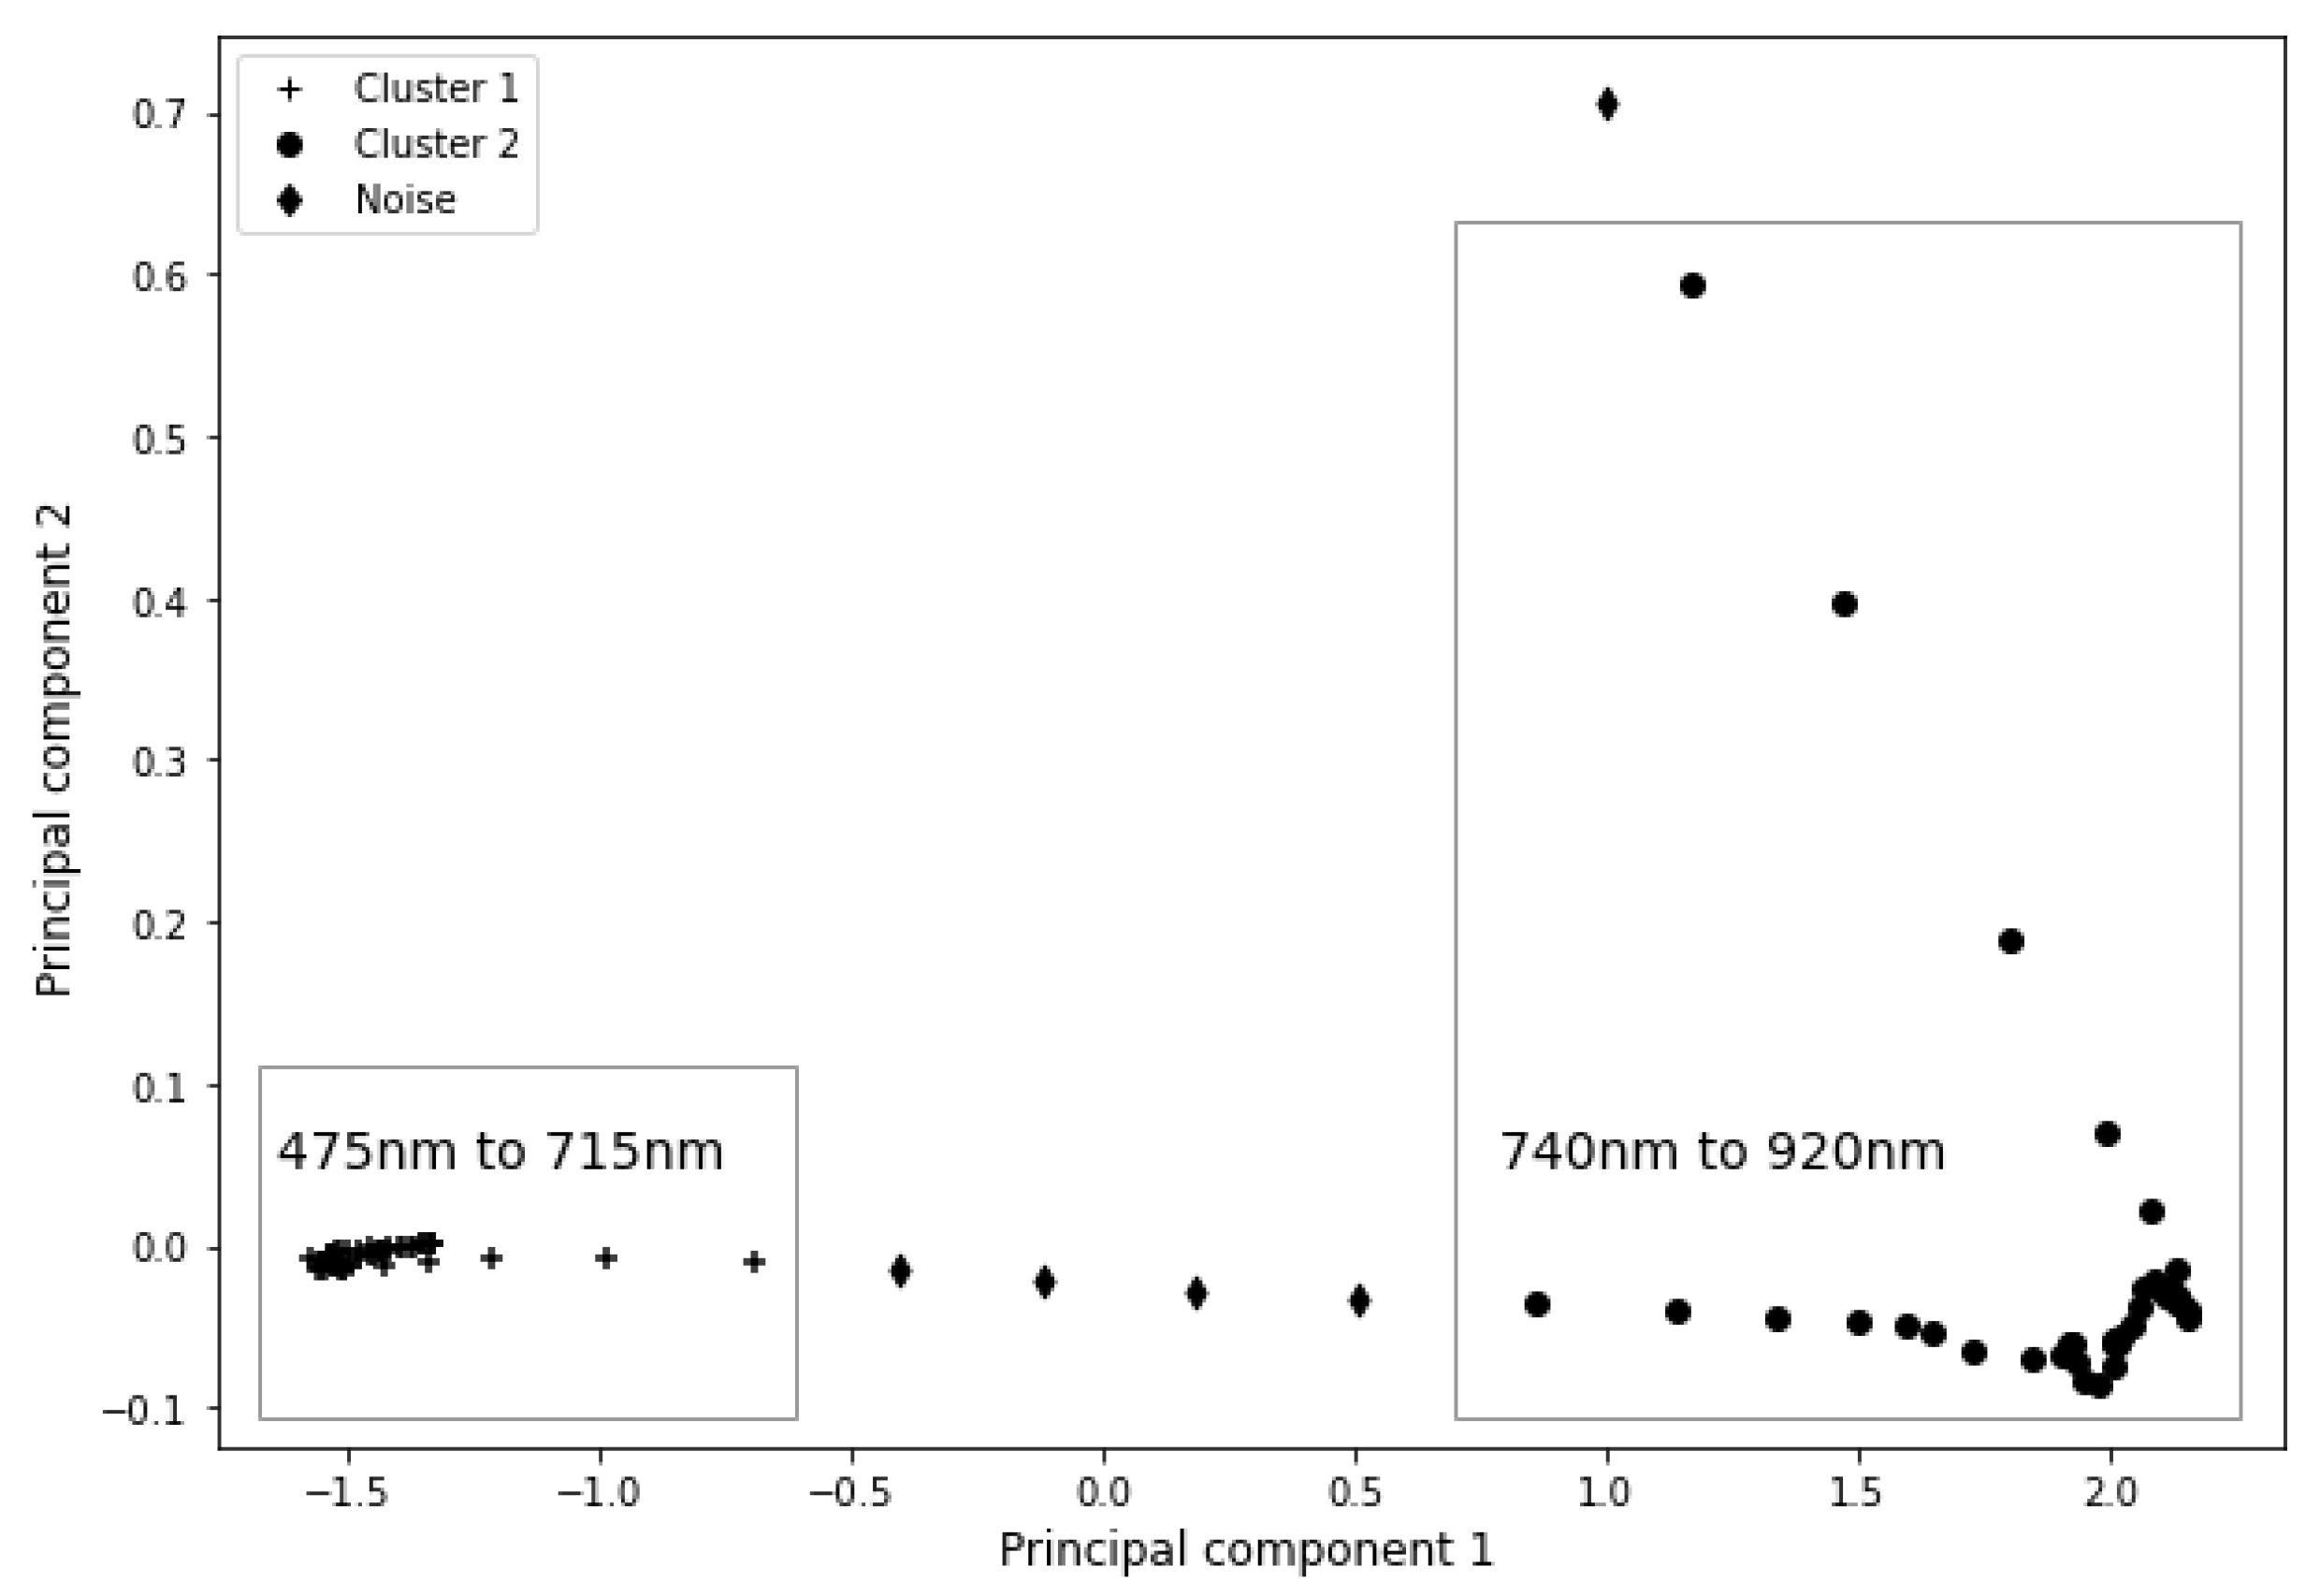
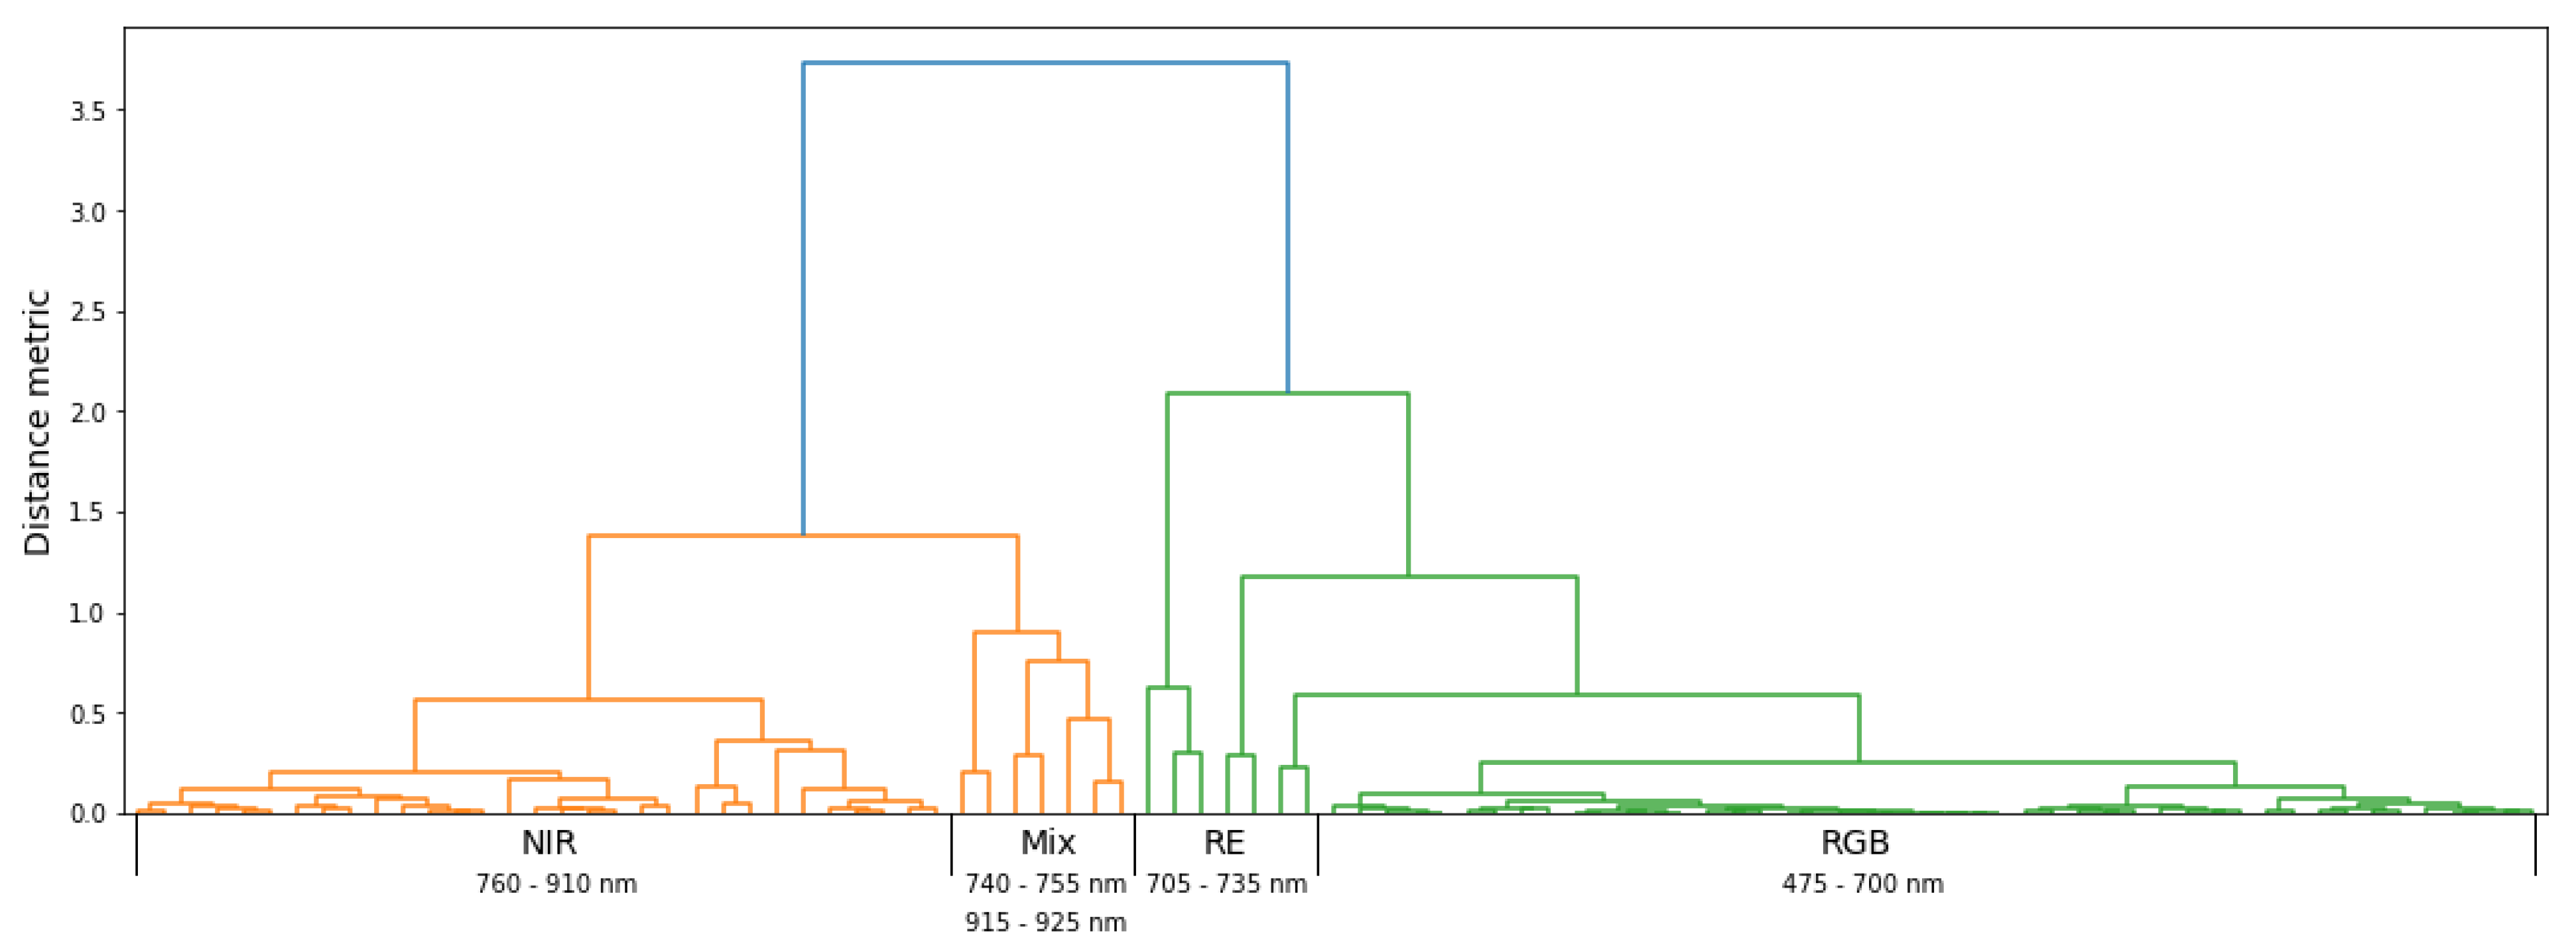
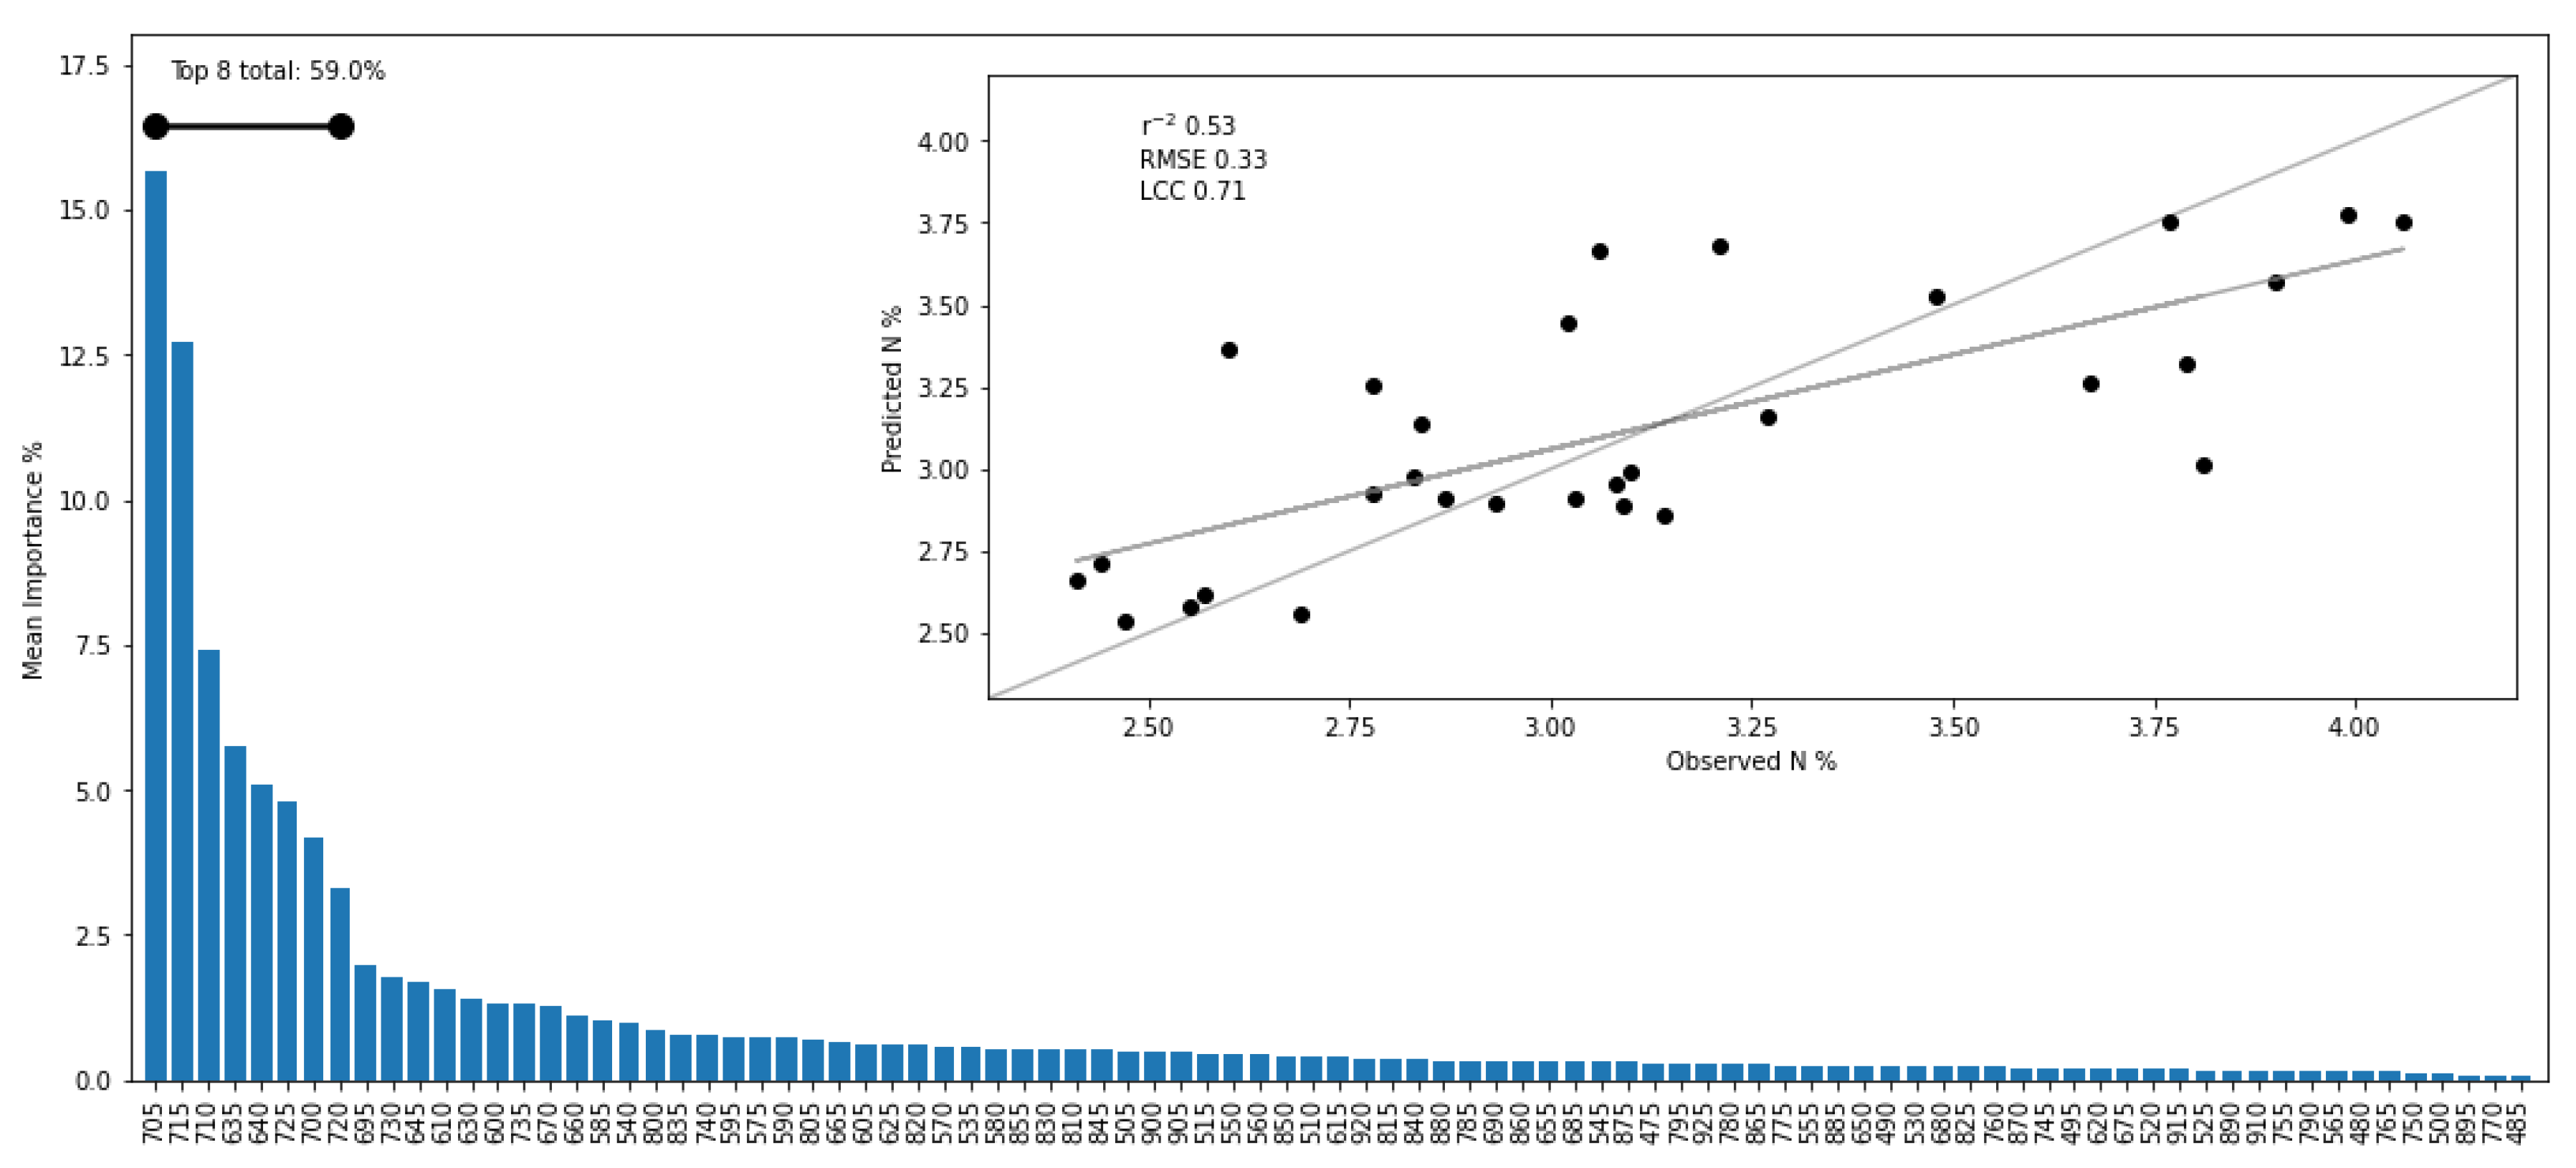
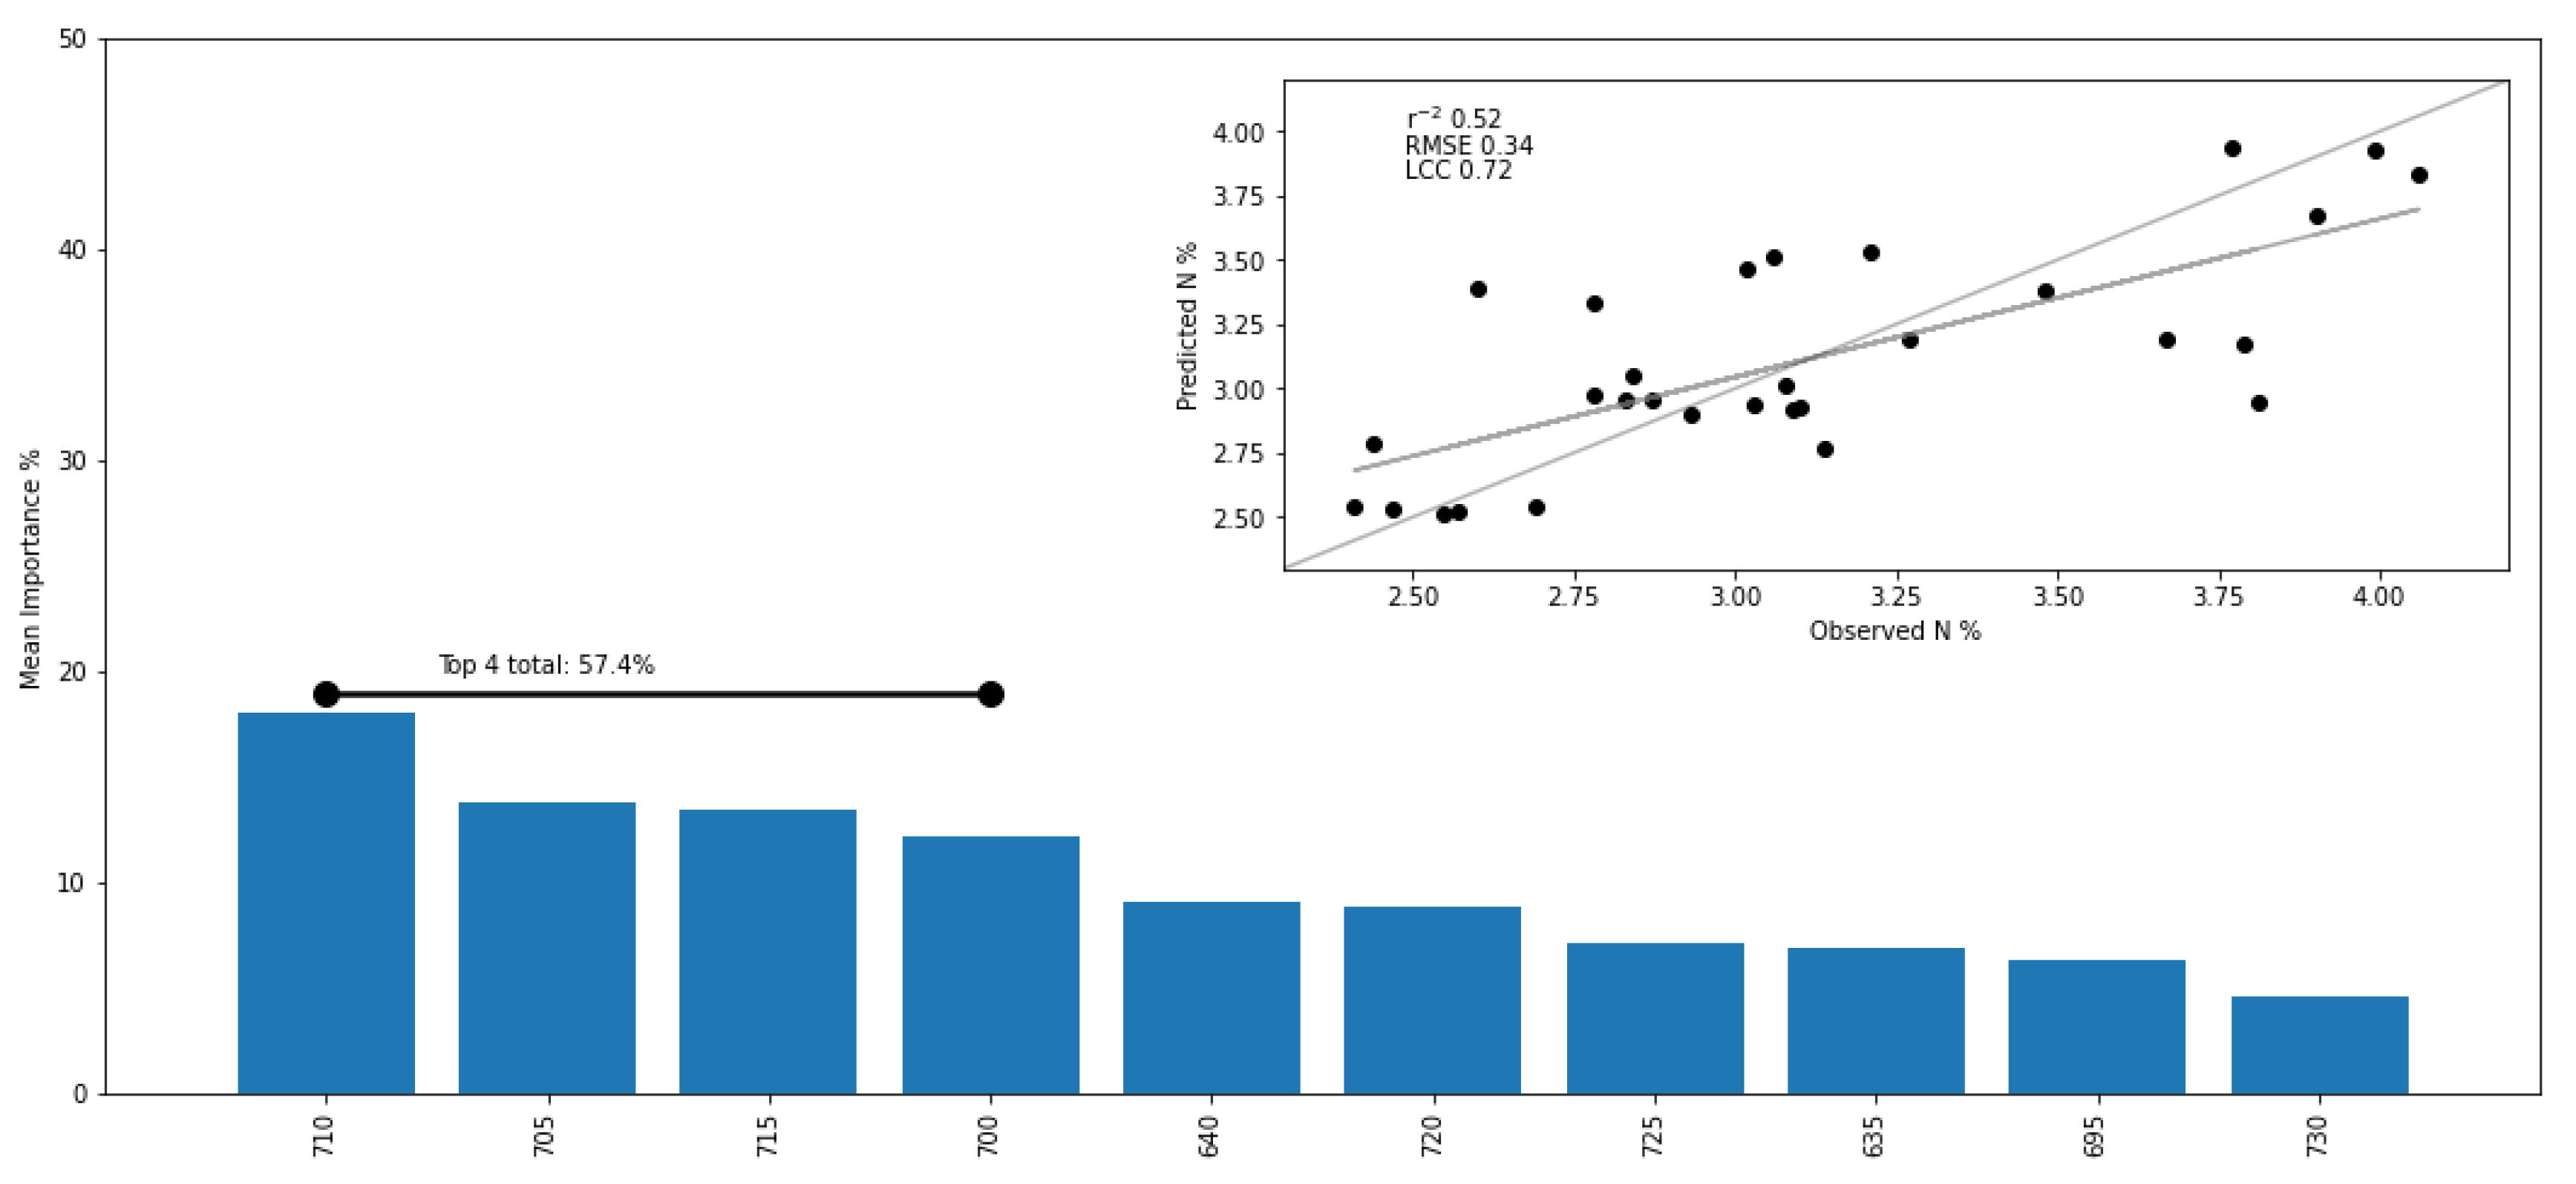
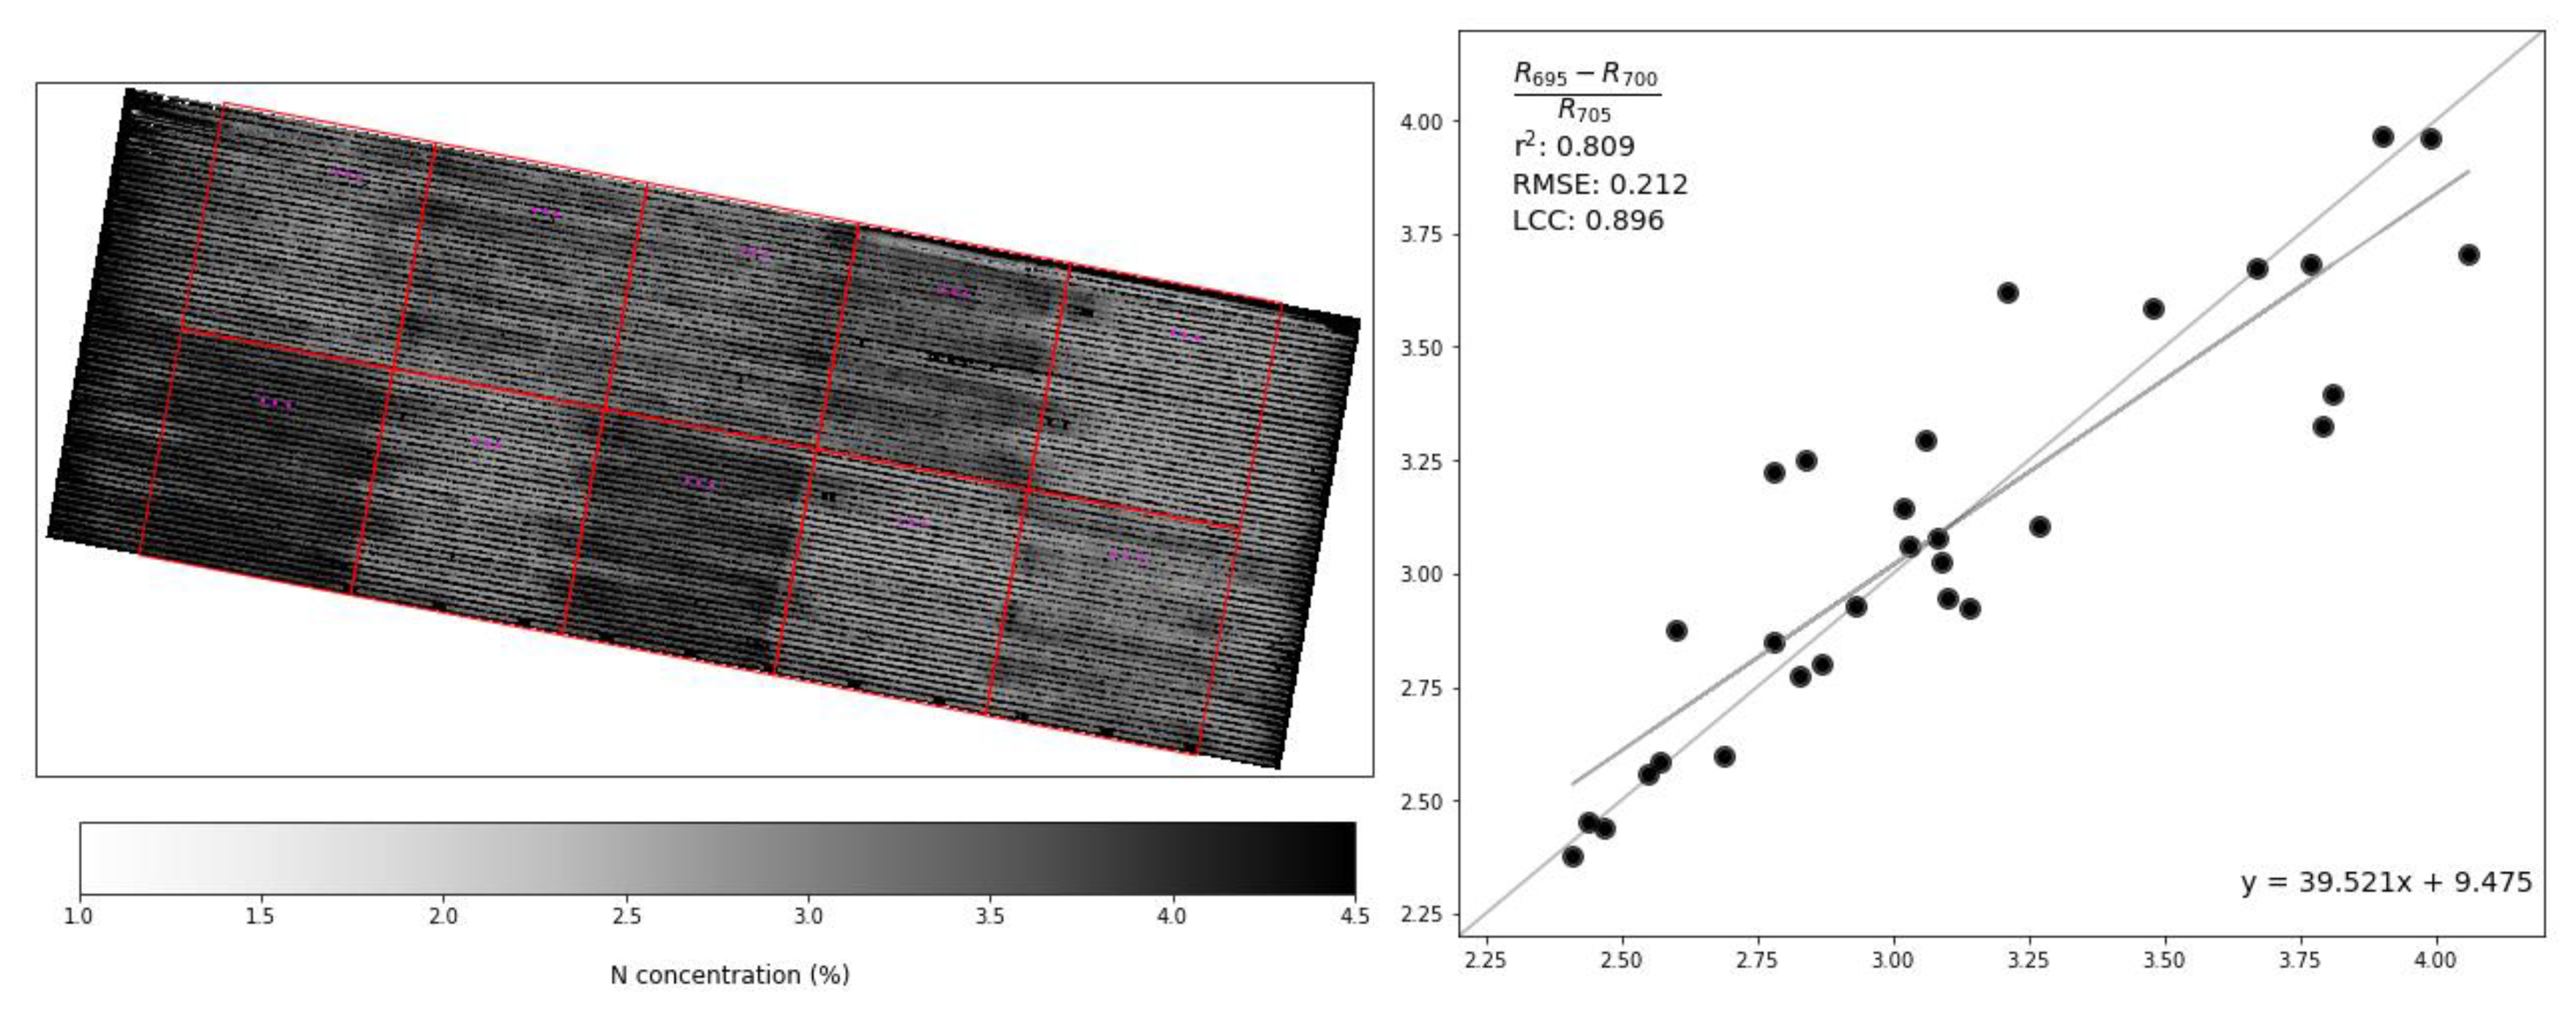
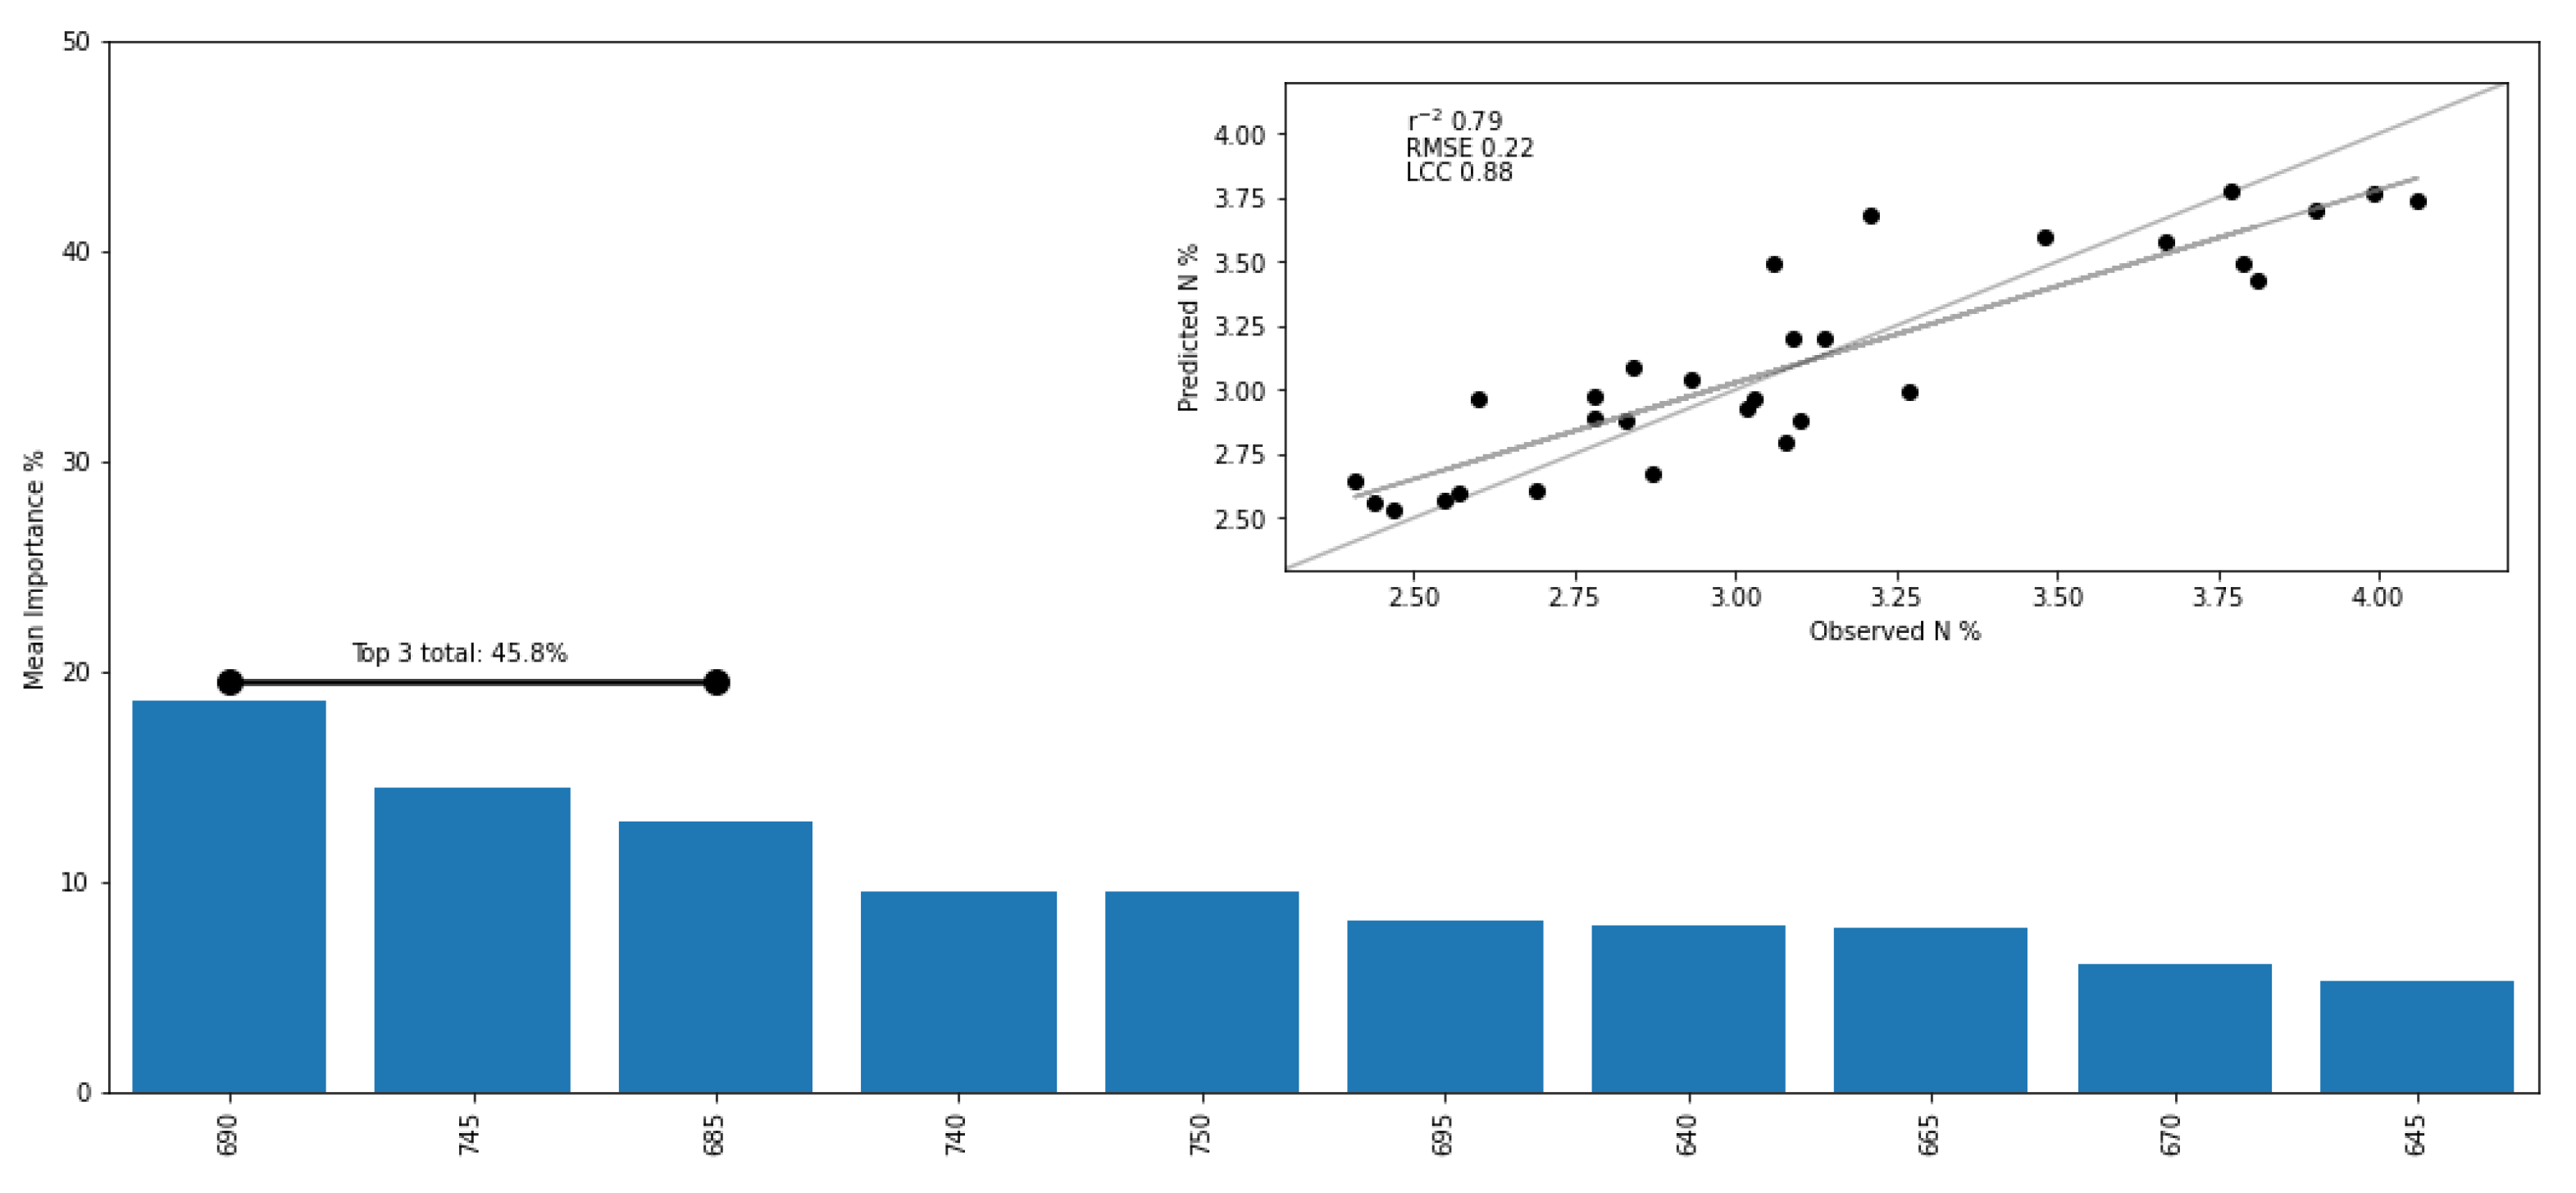
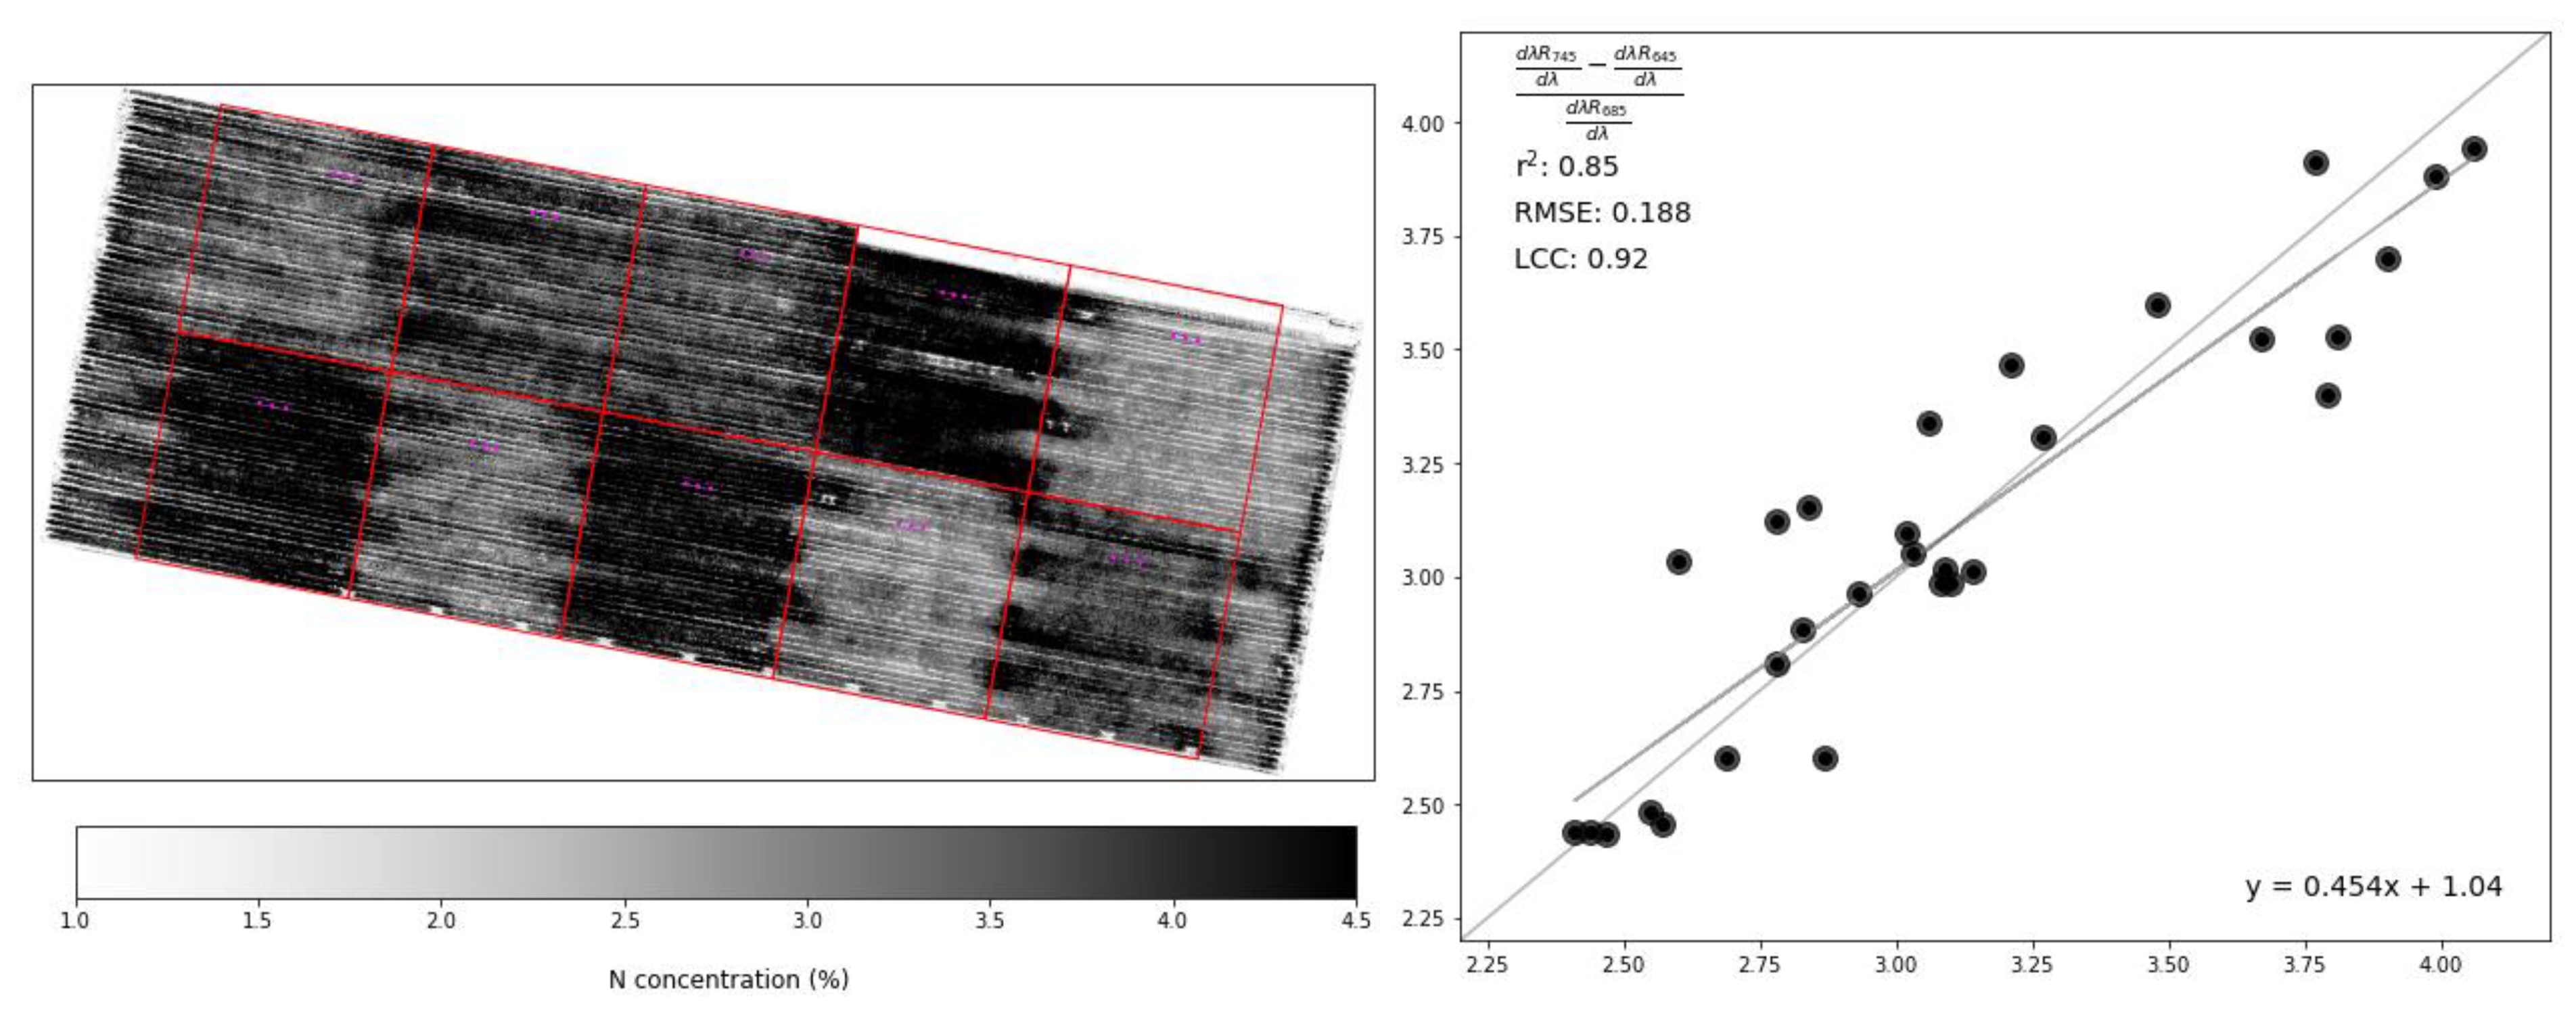
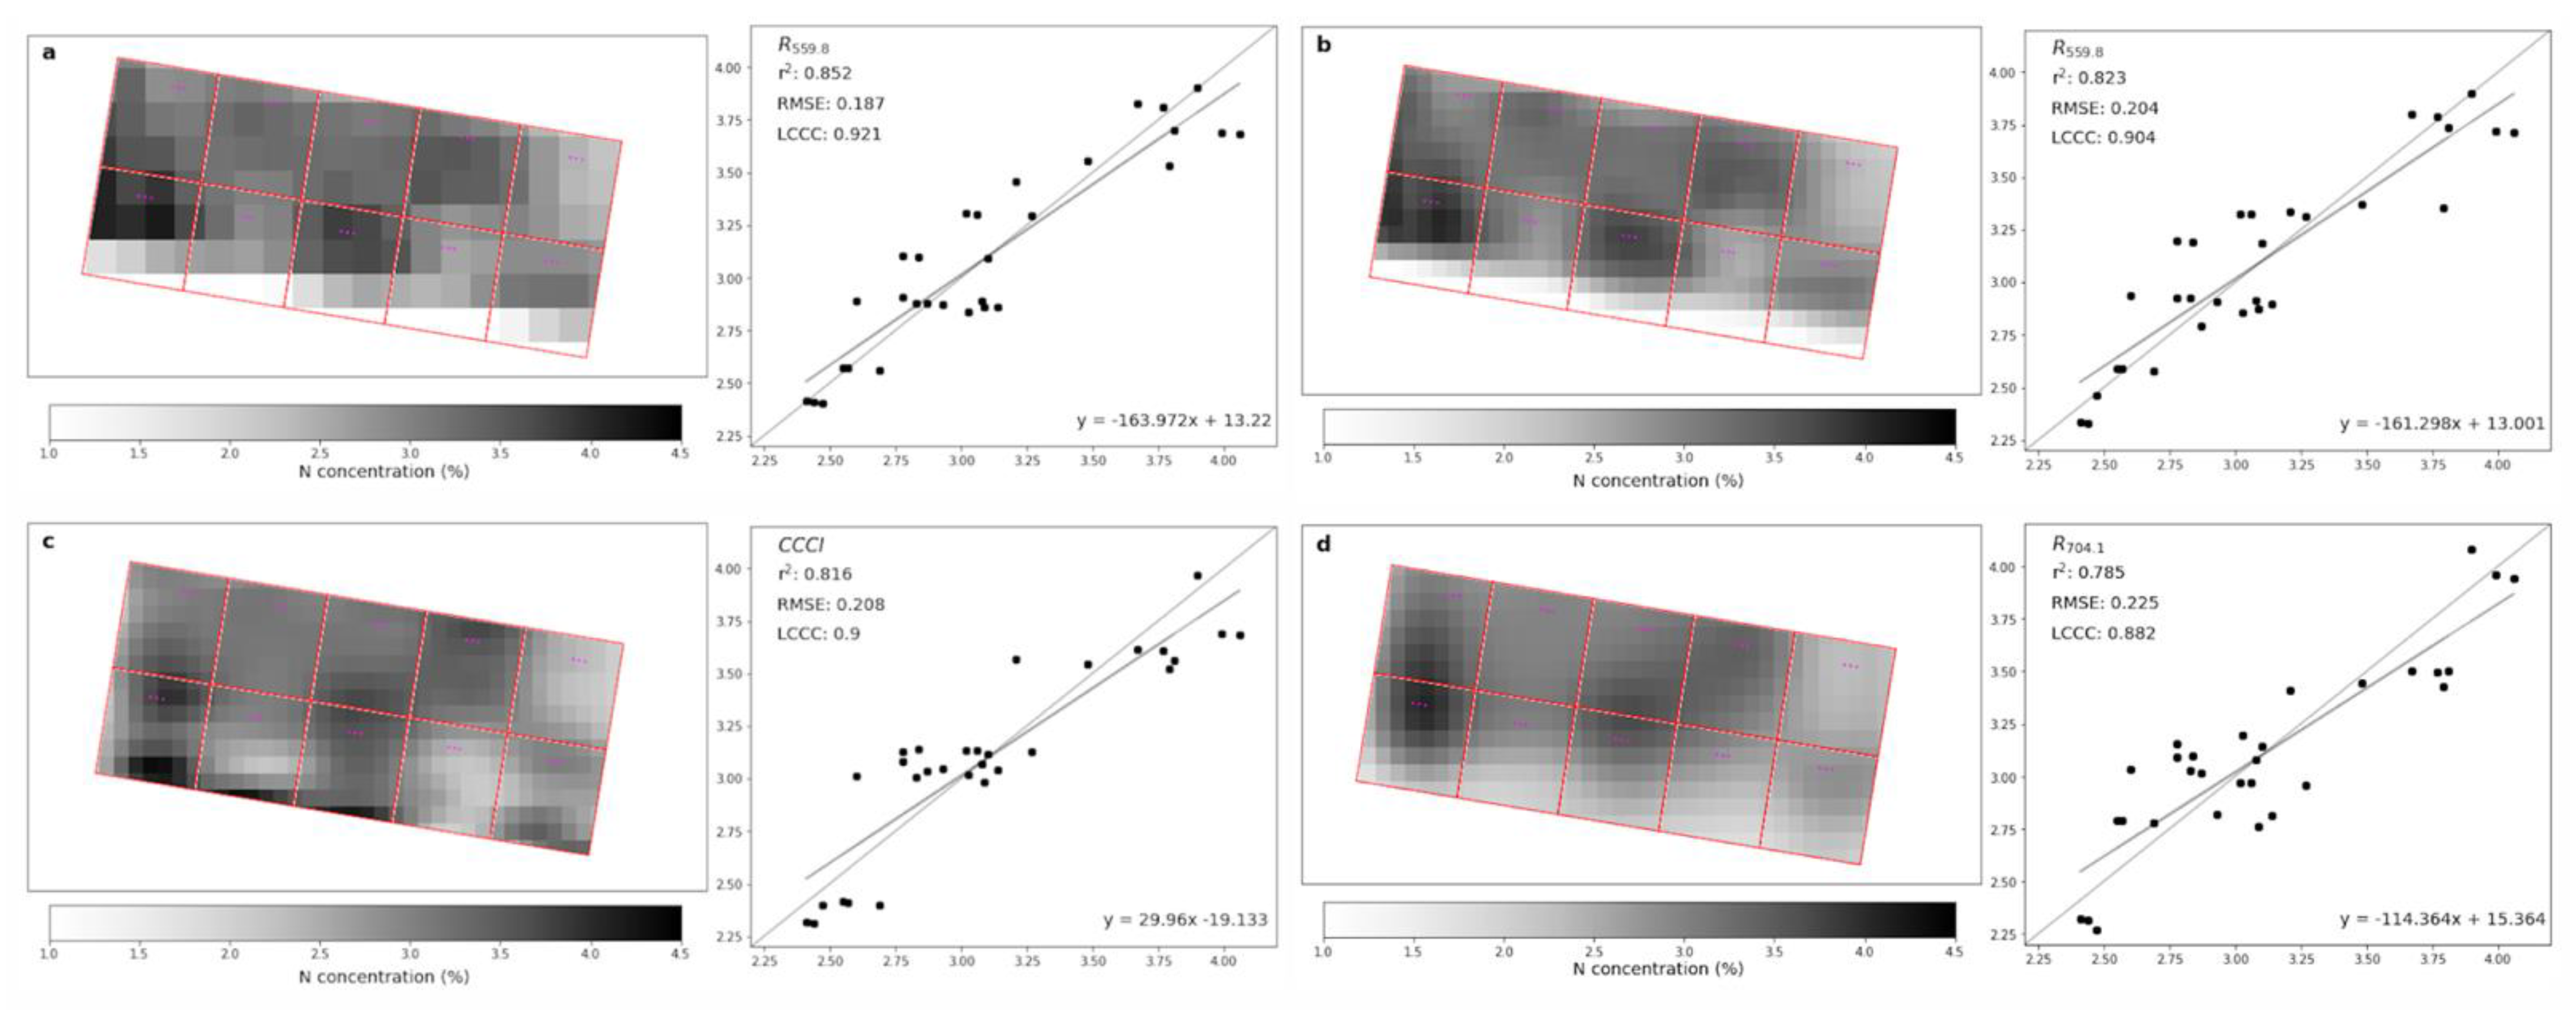
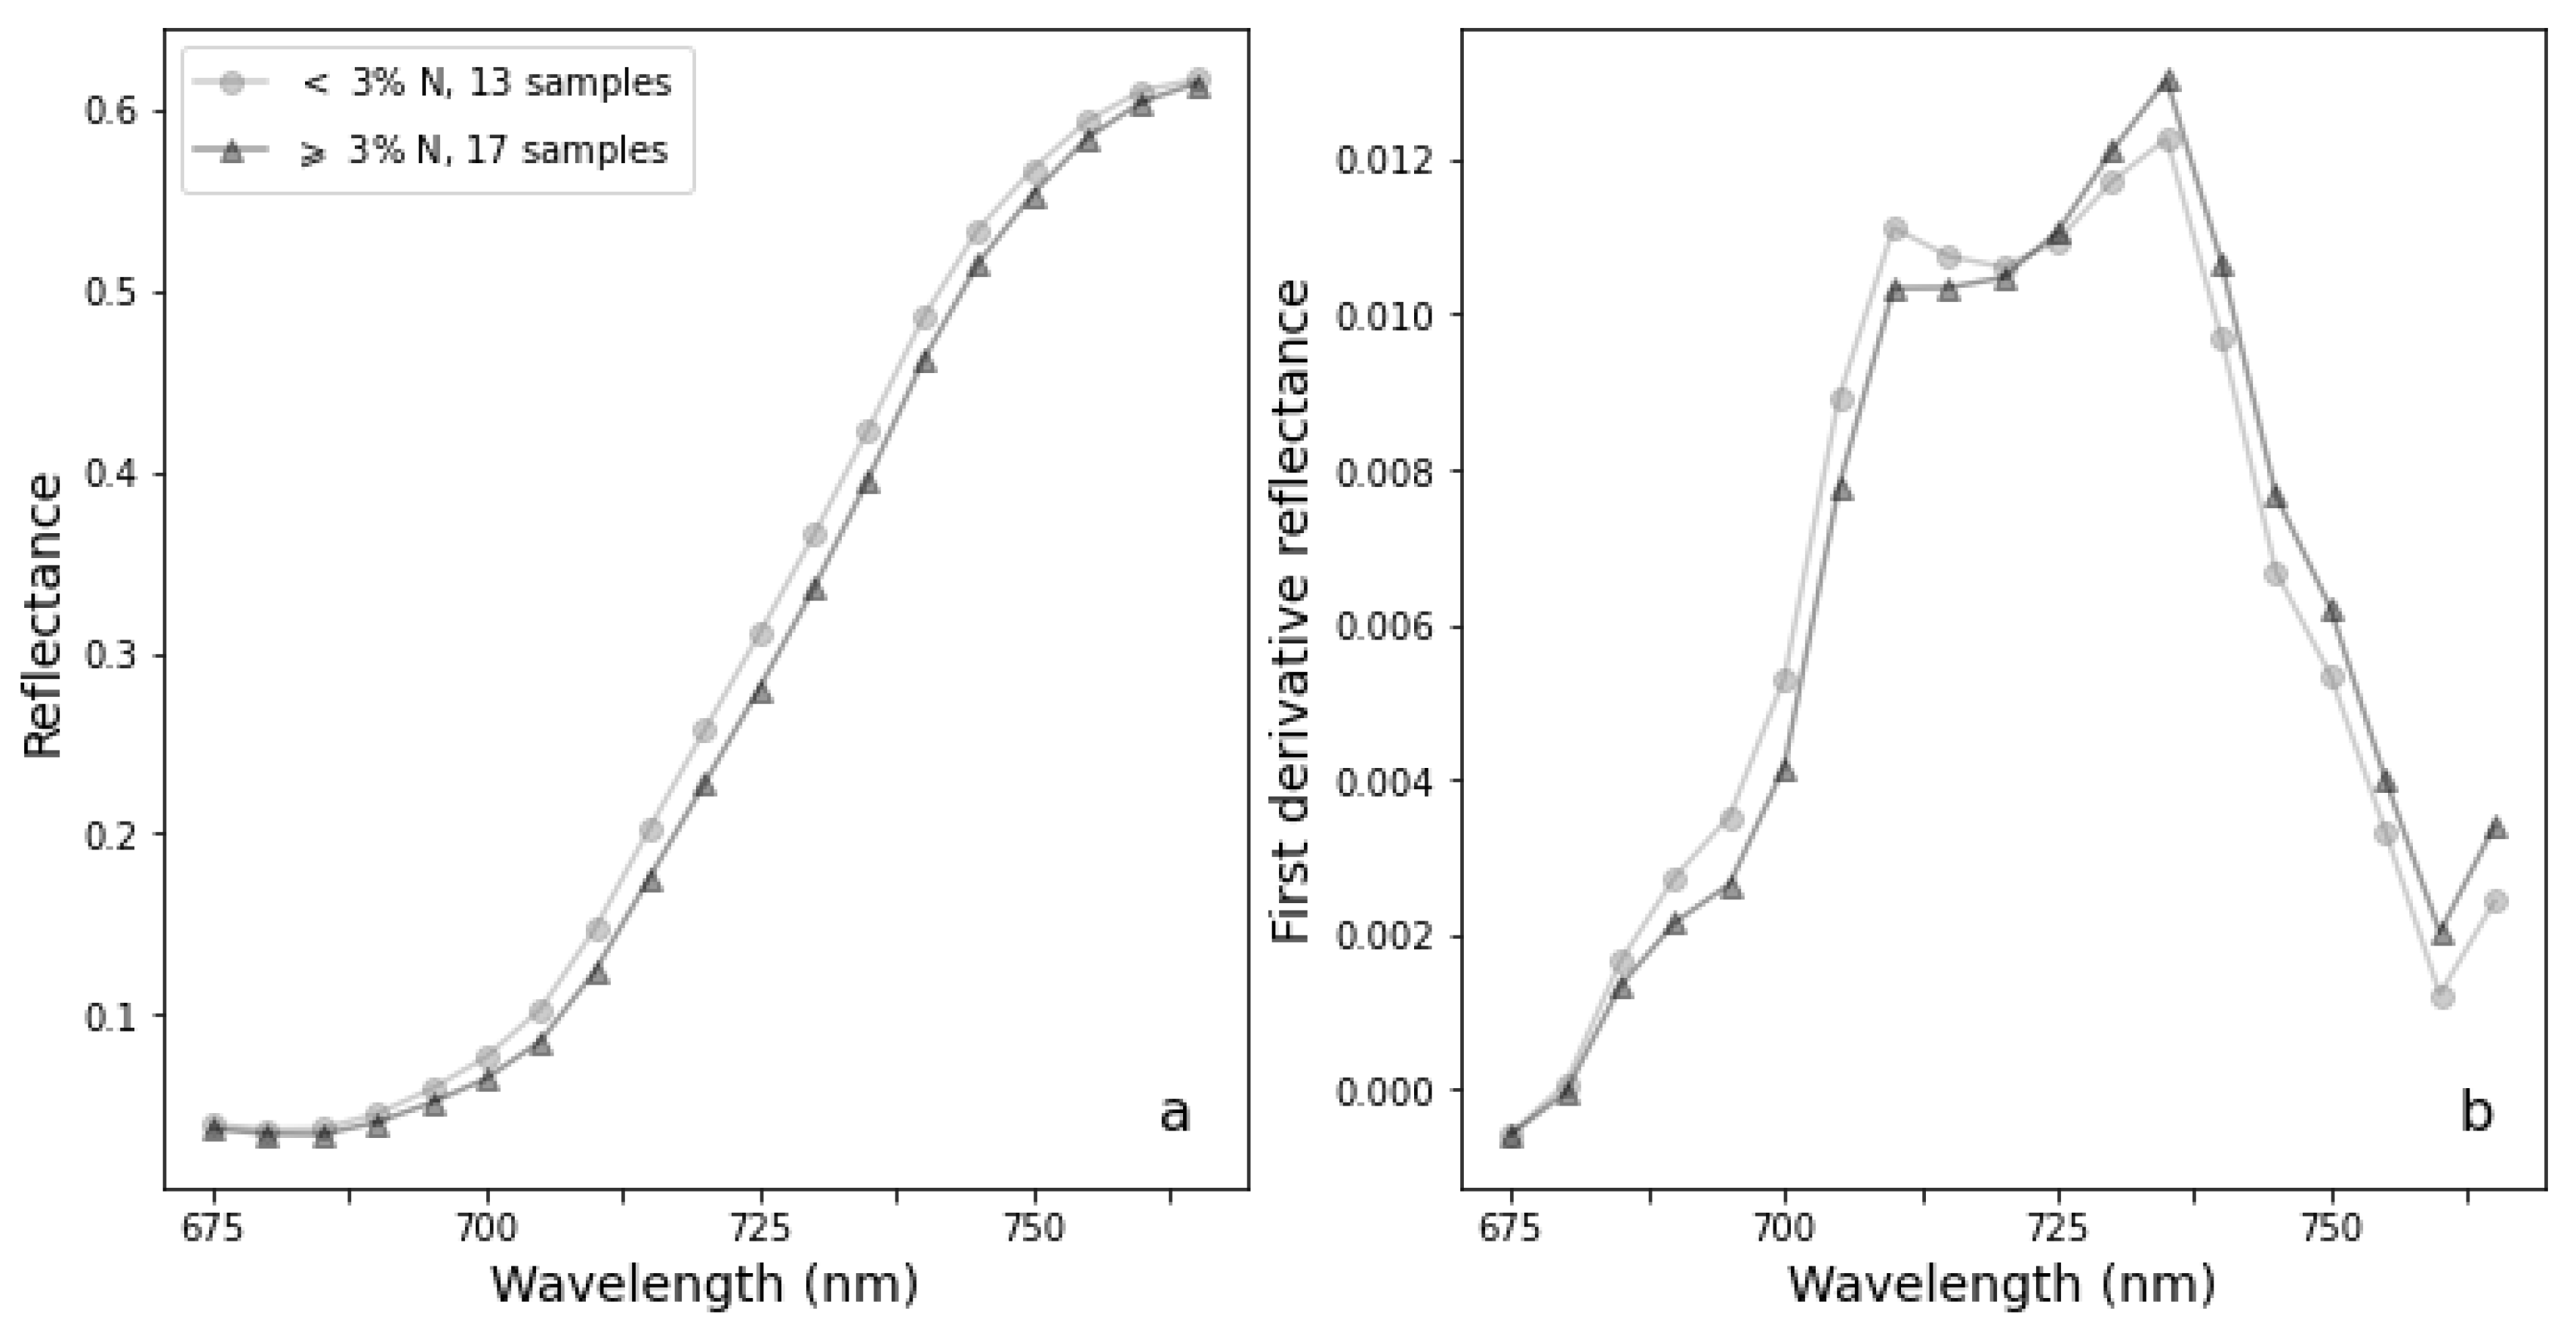
Hyperspectral imaging spectrometers mounted on unmanned aerial vehicle (UAV) can capture high spatial and spectral resolution to provide cotton crop nitrogen status for precision agriculture. The aim of this research was to explore machine learning use with hyperspectral datacubes over agricultural fields. Hyperspectral imagery was collected over a mature cotton crop, which had high spatial (~5.2 cm) and spectral (5 nm) resolution over the spectral range 475–925 nm that allowed discrimination of individual crop rows and field features as well as a continuous spectral range for calculating derivative spectra. The nominal reflectance and its derivatives clearly highlighted the different treatment blocks and were strongly related to N concentration in leaf and petiole samples, both in traditional vegetation indices (e.g., Vogelman 1, R2 = 0.8) and novel combinations of spectra (R2 = 0.85). The key hyperspectral bands identified were at the red-edge inflection point (695–715 nm). Satellite multispectral was compared against the UAV hyperspectral remote sensing’s performance by testing the ability of Sentinel MSI to predict N concentration using the bands in VIS-NIR spectral region. The Sentinel 2A Green band (B3; mid-point 559.8 nm) explained the same amount of variation in N as the hyperspectral data and more than the Sentinel Red Edge Point 1 (B5; mid-point 704.9 nm) with the lower 10 m resolution Green band reporting an R2 = 0.85, compared with the R2 = 0.78 of downscaled Sentinel Red Edge Point 1 at 5 m. The remaining Sentinel bands explained much lower variation (maximum was NIR at R2 = 0.48). Investigation of the red edge peak region in the first derivative showed strong promise with RIDAmid (R2 = 0.81) being the best index. The machine learning approach narrowed the range of bands required to investigate plant condition over this trial site, greatly improved processing time and reduced processing complexity. While Sentinel performed well in this comparison and would be useful in a broadacre crop production context, the impact of pixel boundaries relative to a region of interest and coarse spatial and temporal resolution impacts its utility in a research capacity.
Keywords: remote sensing; hyperspectral; multispectral; machine learning; nitrogen; cotton remote sensing; hyperspectral; multispectral; machine learning; nitrogen; cotton
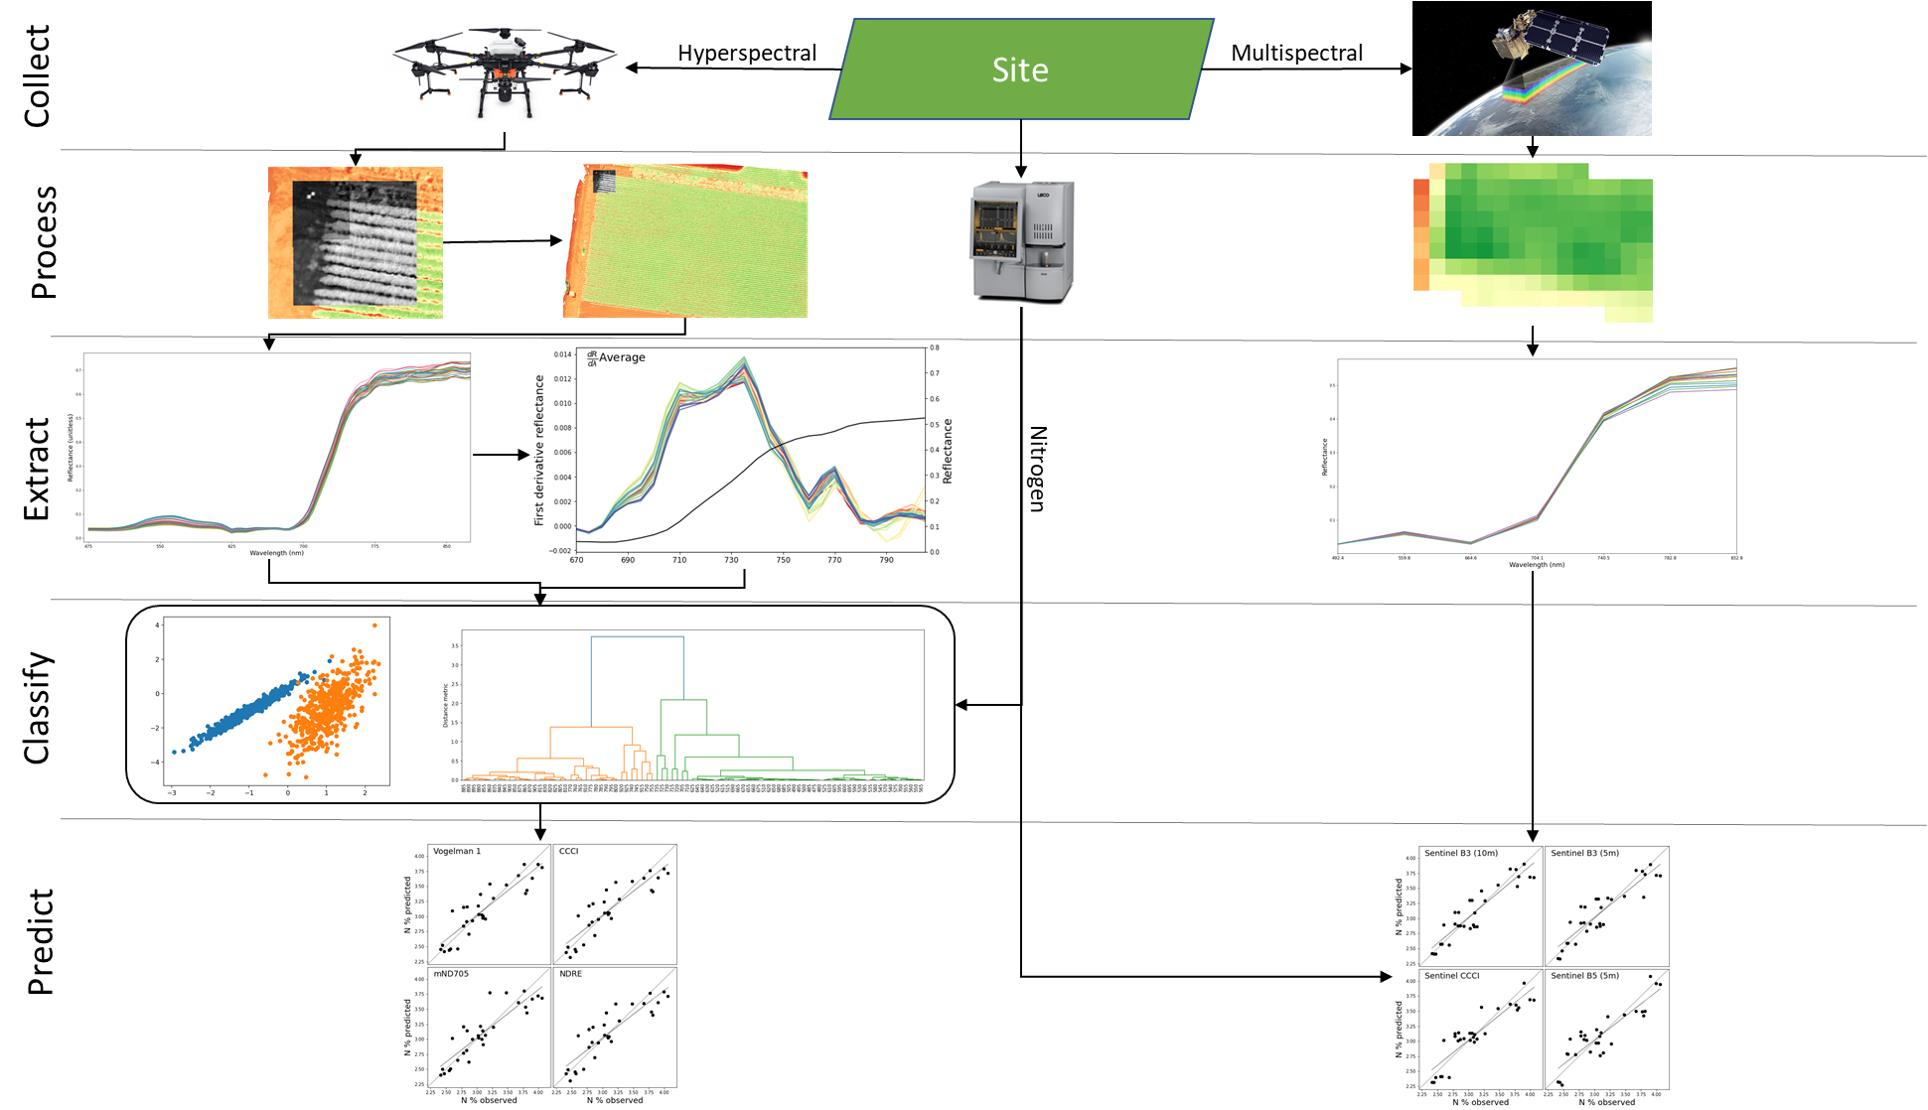
Graphical Abstract