Technical Note

Ambient PM2.5 Estimates and Variations during COVID-19 Pandemic in the Yangtze River Delta Using Machine Learning and Big Data

1
Department of Land Management, Zhejiang University, Hangzhou 310058, China
2
Zhejiang Academy of Surveying and Mapping, Hangzhou 311100, China
3
School of Geographic Sciences, East China Normal University, Shanghai 200241, China
4
School of Urban Construction, Zhejiang Shuren University, Hangzhou 310015, China
5
Department of Chemical and Biochemical Engineering, Iowa Technology Institute, University of Iowa, Iowa City, IA 52242, USA
*
Author to whom correspondence should be addressed.
Remote Sens. 2021, 13(8), 1423; https://doi.org/10.3390/rs13081423
Submission received: 15 March 2021 / Revised: 1 April 2021 / Accepted: 2 April 2021 / Published: 7 April 2021
(This article belongs to the Special Issue Artificial Intelligence in Remote Sensing of Atmospheric Environment)

Abstract

:
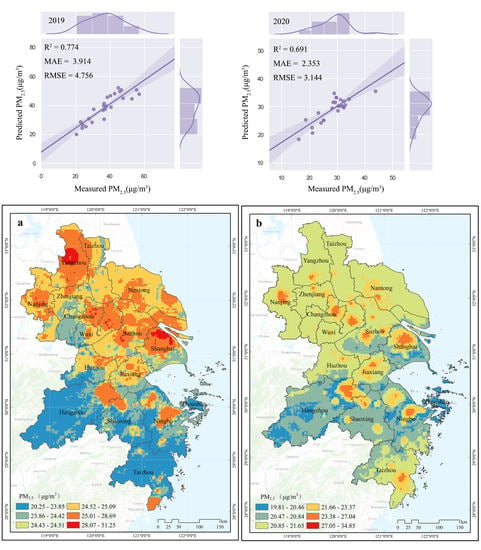
The lockdown of cities in the Yangtze River Delta (YRD) during COVID-19 has provided many natural and typical test sites for estimating the potential of air pollution control and reduction. To evaluate the reduction of PM2.5 concentration in the YRD region by the epidemic lockdown policy, this study employs big data, including PM2.5 observations and 29 independent variables regarding Aerosol Optical Depth (AOD), climate, terrain, population, road density, and Gaode map Point of interesting (POI) data, to build regression models and retrieve spatially continuous distributions of PM2.5 during COVID-19. Simulation accuracy of multiple machine learning regression models, i.e., random forest (RF), support vector regression (SVR), and artificial neural network (ANN) were compared. The results showed that the RF model outperformed the SVR and ANN models in the inversion of PM2.5 in the YRD region, with the model-fitting and cross-validation coefficients of determination R2 reached 0.917 and 0.691, mean absolute error (MAE) values were 1.026 μg m−3 and 2.353 μg m−3, and root mean square error (RMSE) values were 1.413 μg m−3, and 3.144 μg m−3, respectively. PM2.5 concentrations during COVID-19 in 2020 have decreased by 3.61 μg m−3 compared to that during the same period of 2019 in the YRD region. The results of this study provide a cost-effective method of air pollution exposure assessment and help provide insight into the atmospheric changes under strong government controlling strategies.

Graphical Abstract

1. Introduction

Coronavirus disease 2019 (COVID-19), as an infectious disease, was identified in the city of Wuhan, China, and spread to nearly every country around the globe [1,2,3]. On 20 January 2021, COVID-19 has been known to cause more than two million deaths worldwide, with a global mortality rate of 3.4%. In response to the outbreak of COVID-19, a nation-wide lockdown of cities was proposed by the Chinese government after January 2020, putting its 1.3 billion citizens inside their homes [4,5,6]. Almost all production activities, such as transportation, construction, and industries were completely restricted [7,8,9]. Such unprecedented stagnation of industrial production and residents’ consumption has effectively reduced air pollution emission, providing natural and typical test sites for estimating the impacts of human activities controlling on the air pollution control and reduction [10,11,12,13].
At present, studies on PM2.5 pollution during COVID-19, mainly use PM2.5 concentrations, which are generally sourced from ground observations and satellite remote sensing inversions [14,15,16,17,18,19]. Ground observations provided by meteorology stations are at a diurnal scale with high accuracy. However, these stations are usually sparsely distributed, limiting the knowledge of spatially continuous distributions of PM2.5 concentrations. Comparatively, satellite remote sensing inversions can provide a spatially continuous distribution of PM2.5, which can fill the data gap in areas where there is no monitoring station [20,21,22]. As a result, this study uses satellite remote sensing inversions to obtain high-precision PM2.5 concentration data to assess PM2.5 changes during COVID-19. To build the inversion model, variables regarding aerosol optical depth (AOD), climate, LUCC (land use and land cover) were usually selected according to previous studies [23,24,25,26]. Classic model and machine learning methods have been applied to fit the linear and non-linear relations between environmental variables and PM2.5 concentrations in previous research work [27,28,29,30]. It is suggested that classic models are usually sensitive to collinearity between independent variables and fail to handle a very large sample with missing data or outliers [31]. Although the variance expansion test and statistics can avoid the influence of collinearity by deleting those collinear variables [32], such a screening step can lose some important variables by mistake [33]. The linear models, e.g., multiple linear regression, failed to detect non-linear relations [22,34,35], given that the formation, diffusion, migration, and transformation of PM2.5 are complex, and perhaps non-linearly related to environmental factors. Machine learning methods can handle a very large sample with fast computing speed [36]. They were proved to be robust and insensitive to missing data and outliers. In recent years, machine learning methods, such as random forest (RF) [23,30,37,38], support vector regression (SVR) [39], and artificial neural network (ANN) [40] have been successfully used in estimating PM2.5 concentrations. Consequently, machine learning methods can be used to estimate the PM2.5 concentration during COVID-19.
In this study, we hypothesized that the government’s “lockdown policy” may have reduced air pollution in urban agglomeration. To address the influence of “lockdown policy” on PM2.5 concentrations, spatial PM2.5 concentrations during COVID-19 (2020-I) and the same period in 2019 (2019-I) were compared. Firstly, 29 independent variables regarding AOD, climate, terrain, population, road density, and Gaode map POI data were collected to build the RF, SVR, and ANN PM2.5 retrieving models. Secondly, the prediction accuracies of the three models were evaluated by determination R2, the cross-validation (CV), MAE, and RMSE. The importance of variables was assessed to examine the impact of each predictor on PM2.5 concentration. Finally, the optimal model was determined and applied in PM2.5 retrieval, to further estimate the influence of “lockdown policy” on PM2.5 concentrations. Investigation of PM2.5 changes before, and during, COVID-19 not only quantitatively evaluate the impact of the epidemic on economic activities and emission reductions, but also help understand the potential for pollution control in the Yangtze River Delta (YRD). This study aims to obtain high-resolution spatial continuous PM2.5 data and analyze the potential of PM2.5 pollutant emission reduction during COVID-19. The findings provide a reference for future air pollution control in the YRD.

2. Data and Methods

The Yangtze River Delta is located in the north-central subtropical zone and at the junction of eastern coastal China and the Yangtze River, including Shanghai, Zhejiang Province, and Jiangsu Province, as shown in Figure 1. The study region is the Yangtze River Delta’s core area, including 16 cities, such as Shanghai, Nanjing, and Hangzhou. The Yangtze River Delta accounts for 2.2% of the national land and 11.7% of the national population, contributing about 21% of the country’s gross domestic product (GDP). The urbanization level has reached 64.7%, and the urban space layout is still expanding. Therefore, the Yangtze River Delta is China’s leading economic development area. However, the rapid development of industrialization and urbanization has caused unprecedented pressure on the ecological environment leading to frequent pollution incidents.

2.1. Data

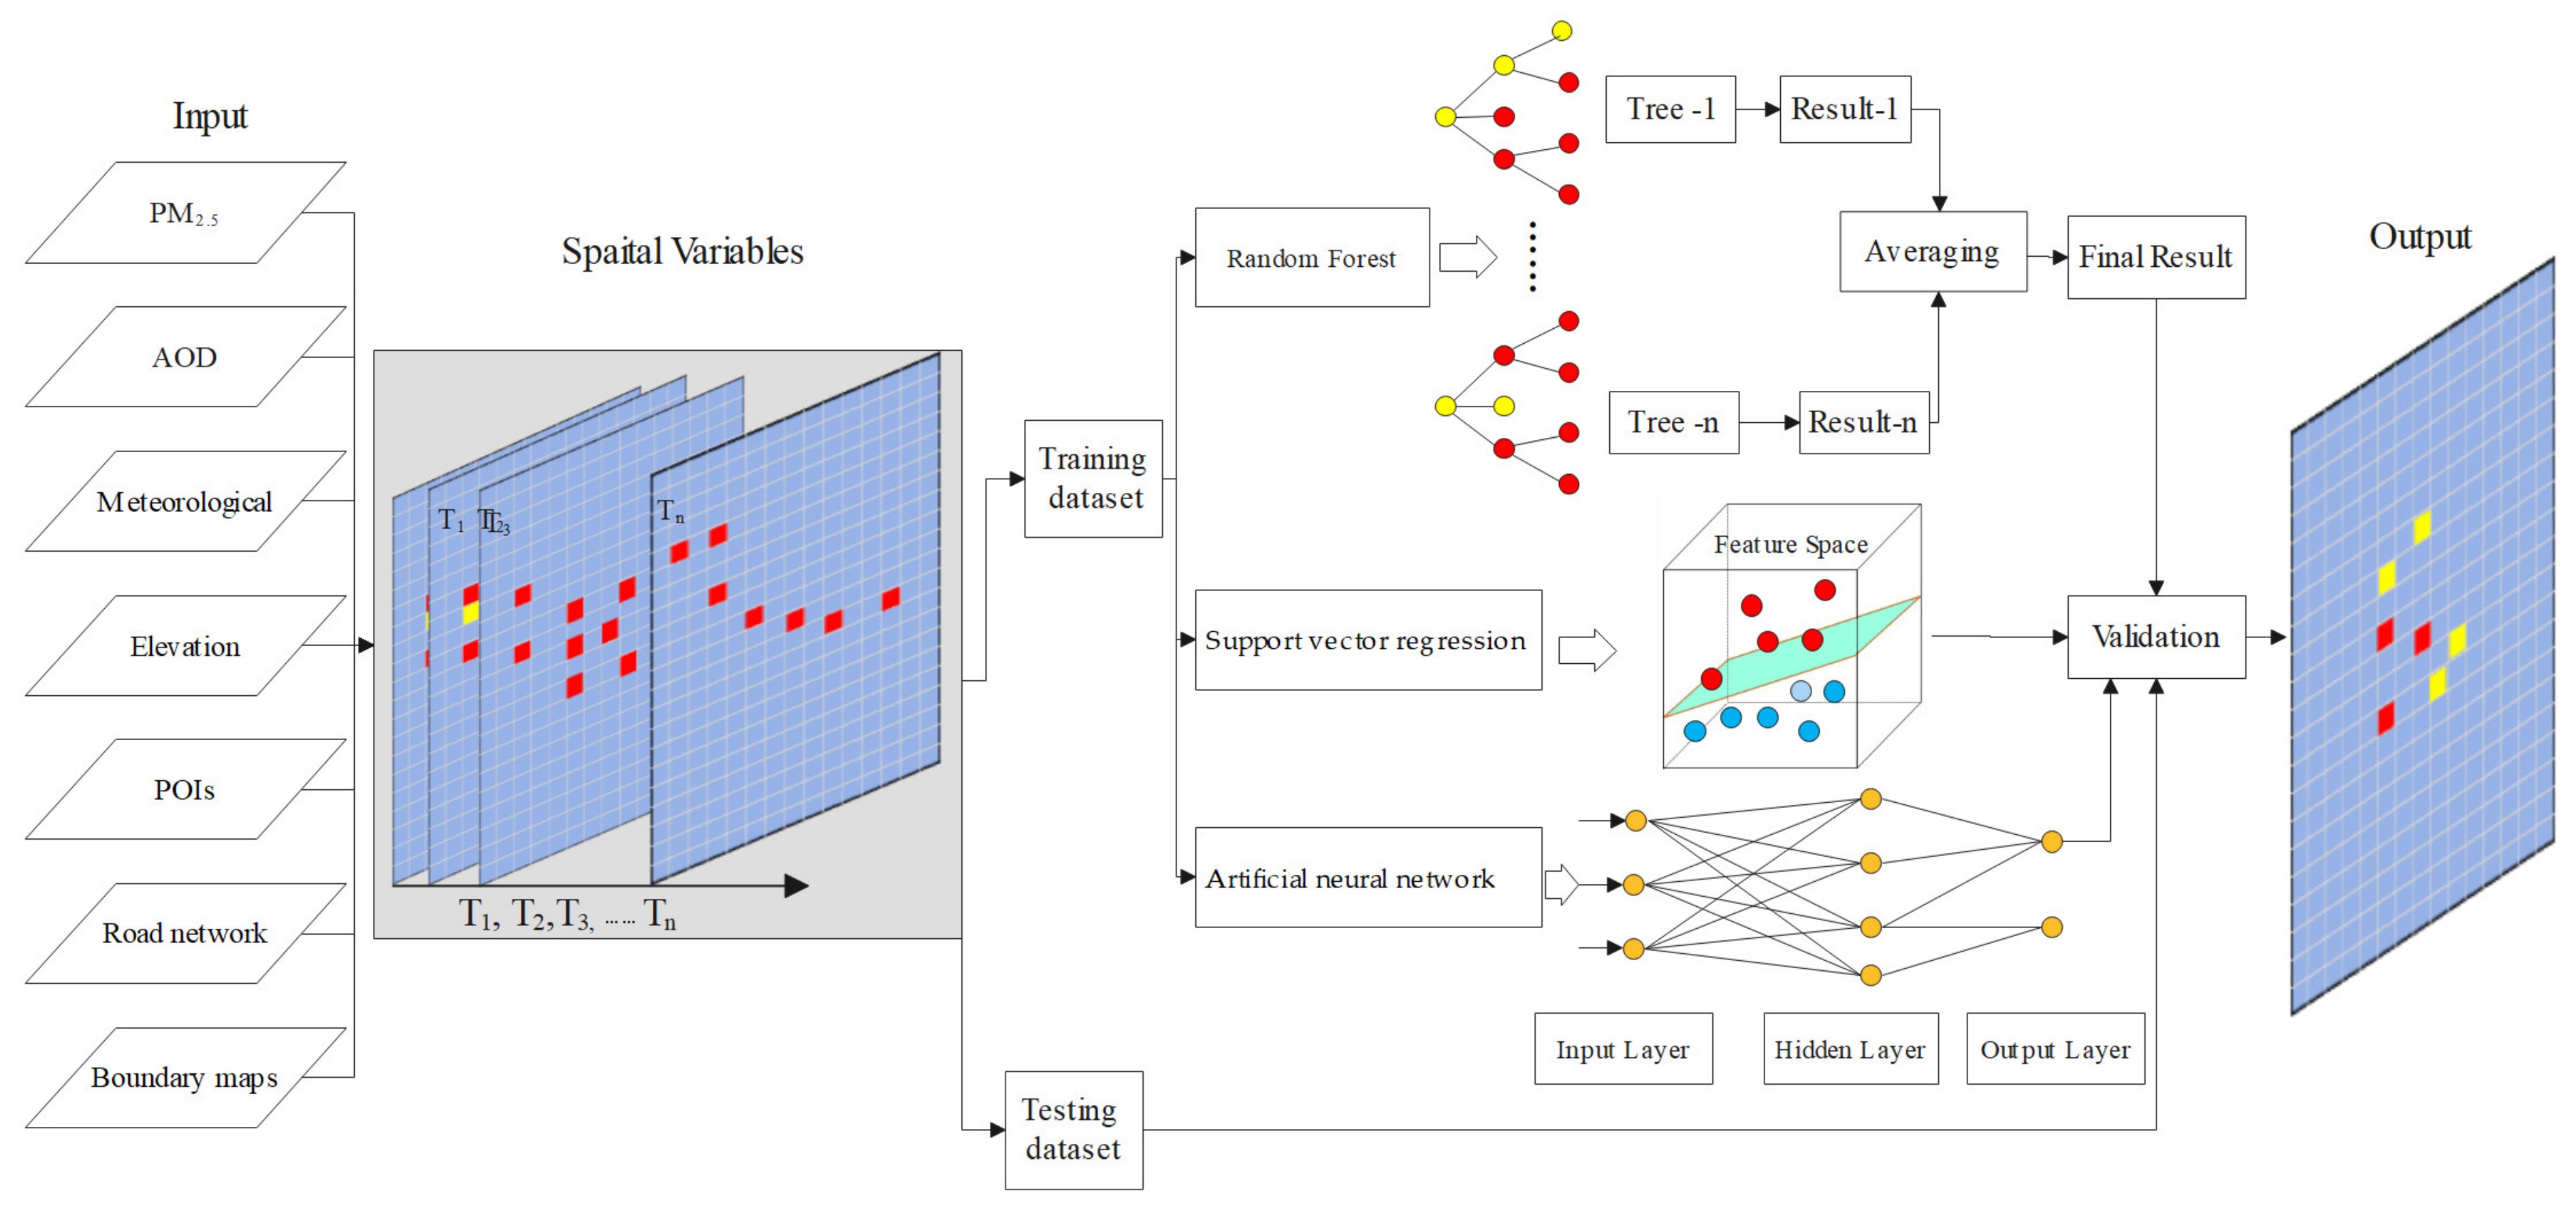
Independent variables covered both natural and socio-economic aspects and were divided into a training dataset (80% of the observation) and a testing dataset (20% of the observation). Table 1 lists seven types of data that were used to fit the PM2.5 concentration inversion model and evaluate the accuracy. The retrieval and pre-processing of these datasets in the current study are described below.
The workflow for processing data, fitting the model to produce the PM2.5 map, and assessing accuracy is exhibited in the flowchart in Figure 2.

2.1.1. PM2.5 Data

PM2.5 data were derived from hourly observations in the real-time publishing platform of urban air quality at China Environmental Monitoring Station (http://www.cnemc.cn/sssj/ accessed on 1 December 2020). There is a total of 214 monitoring stations, with the time range from 12 January to 20 February 2019 and 1 January to 9 February 2020. In accordance with the requirements for the validity of air pollutant concentration data in GB3095-2012, the quality control of PM2.5 data was performed [15]. Firstly, values of the hourly PM2.5 concentrations ≤ 0 and missing values were excluded. Secondly, if the measured data have been missing for more than 4 h in a day, all the data would be invalidated and excluded from the calculation of average daily PM2.5. Finally, a few anomalies with the hourly PM2.5 concentrations > 900 μg m−3 were also eliminated. A monthly average of PM2.5 was obtained based on the arithmetic mean of the daily average concentration.

2.1.2. Aerosol Optical Depth (AOD) Data

In this study, the MODIS Collection 6 MAIAC AOD products (MCD19A2) at a spatial resolution of 1 km from 12 January to 20 February 2019, and 1 January to 9 February 2020, covering the YRD region, were collected. Here, only the MAIAC AOD retrievals at 550 nm, and passing the recommended quality assurance (QA), are used, which yield a reliable data quality in China, especially in bright urban areas [41,42,43]. Last, the Terra and Aqua MAIAC AOD data were averaged and integrated to expand the spatial coverage of PM2.5 estimates.

2.1.3. POIs Data

POIs is a kind of place or a kind of thing marked on the map, including name, category, coordinate and other information, which can reflect social and economic activities. POIs were retrieved from the Gaode Map (https://www.amap.com/ accessed on 24 September 2020), which is the largest desktop and mobile map service provider in China. We obtained 8,806,799 POI records from 2019 to 2020 using Gaode Map’s application programming interface. Gaode Map classified these POIs into 23 categories based on their Chinese semantic phrase. All records were unified as Gauss Kruger coordinate system. Table 2 presents the 20 categories and the number of POI records for each category, excluding the 3 categories of Place Name and Address, Incidents and Event, and Indoor facilities.

2.1.4. Meteorological Data

Meteorological data were gathered from the Chinese meteorological data sharing service network (http://data.cma.cn/ accessed on 24 September 2020), including daily average wind speed, atmospheric pressure, temperature, relative humidity, and 24 h cumulative precipitation. The data was pre-processed and interpolated to obtain the meteorological elements’ continuous surface in the area.

2.1.5. Elevation Data

Elevation data were downloaded from China’s geospatial data cloud (http://gdex.cr.usgs.gov/gdex/ accessed on 24 September 2020), with the spatial resolution Define if appropriate.of 30 m, and the corresponding location altitude was extracted through the monitoring stations.

2.1.6. Boundary and Road Network Data

The boundary maps at city levels were obtained from the Open Street Map (https://www.openstreetmap.org/ accessed on 24 September 2020). Such datasets include China’s national highways, city roads, provincial, county, and township-level roads. The road density is calculated and generated by the kernel density method of ArcGIS software.

2.2. Model Structure and Validation

2.2.1. Random Forest Model

The random forest is a new machine learning algorithm consisting of multiple classifications and regression tree (CART) integrations [22,44,45]. Compared with CART, there are three distinct characteristics. First, random forests generate many trees, each of which is generated by a bootstrap sample in the original dataset, while in CART, all raw data are utilized to create only one tree. Second, the segmentation of tree nodes is performed by random forest each time based on an optimal variable in the subset of predictors, while CART selects the optimal variable among all predictors to segment the tree nodes. Finally, the trees in the random forest are completely grown without prune. This makes the random forest model not easy to overfit [46]. Three training parameters need to be defined in the random forest algorithm: n_estimators, the number of trees in the forest-based on a bootstrap sample of the observations; max_features, the number of features to be considered when looking for the best split (the default setting is “auto”: then max_features=n_features) and min_samples_lea, the minimum number of samples required to be at a leaf node (the default value is one). The two main parameters (i.e., n_estimators and max_features) in predicting the PM2.5 were determined and optimized, based on the out-of-bag (OOB) error rate of calibration.

2.2.2. Support Vector Regression Model

Support Vector Regression, SVR was proposed by Corinna Cortes and Vapnik in 1995 [47,48], which constructs a hyperplane or a set of hyperplanes in a high- or infinite-dimensional space, which can be used for classification, regression, or other tasks. The performance of SVR can be decided by three parameters, i.e., the kernel function, penalty factor (C), and the variance in kernel function (Gamma). Grid search and cross-validation were applied to determine the optimal values of the three parameters. In this study, radial basis function settings (RBF) with C = 8 and Gamma = 11 were optimal according to the validation results.

2.2.3. Back Propagation Artificial Neural Network

Back Propagation Artificial Neural Network (ANN) was proposed by Rumelhart and McClelland in 1986 [49], which consists of an interconnected group of artificial neurons. It processes information using a connectionist approach to computation. ANN is a non-linear statistical data modeling tool that can fit complex relationships between inputs and outputs, or find patterns in data. The structure of the ANN model includes three levels: Input level (29 neurons), an implication level (25 neurons), and an output level (1 neuron). The activation function was Relu, and the solver was Sigmoid.

2.2.4. Cross Validated Model Accuracy

The model performance is evaluated by determination coefficient (R2), mean absolute error (MAE), and root mean square error (RMSE). The larger the R2, the smaller the MAE and RMSE, indicating that the model prediction accuracy is higher. The relevant calculation formulas are as follows,
R 2 = i = 1 n P i M ¯ 2 / i = 1 n M i M ¯ 2
M A E = 1 n i = 1 n M i P i
R M S E = 1 n i = 1 n M i P i 2
where M is the measured value, P is the predicted value, M ¯ is the mean measured value, and n is the number of samples in the validation set.

3. Results and Analysis

3.1. Model Performance

Determination coefficient R2, MAE, and RMSE were applied to estimate the accuracy of modeling. As shown in Table 3, during the period of 2019-I (the same period in 2019), values of R2, MAE, and RMSE of the RF model were 0.938, 1.663 μg m−3, and 2.696 μg m−3, respectively; for SVR, values of R2, MAE, and RMSE were 0.740, 2.148 μg m−3, and 5.522 μg m−3, respectively; for ANN, values of R2, MAE, and RMSE were 0.739, 3.582 μg m−3, 5.538 μg m−3, respectively. During the period of 2020-I (during COVID-19), values of R2, MAE, and RMSE of RF model were 0.917, 1.026 μg m−3, and 1.413 μg m−3, respectively; for SVR, values of R2, MAE, and RMSE were 0.705, 1.521 μg m−3, and 2.663 μg m−3, respectively; for ANN, R2, MAE, and RMSE was 0.917, 2.476 μg m−3, and 3.258 μg m−3, respectively. In general, the RF model performed best in retrieving PM2.5 concentrations during both periods, followed by SVR and ANN.
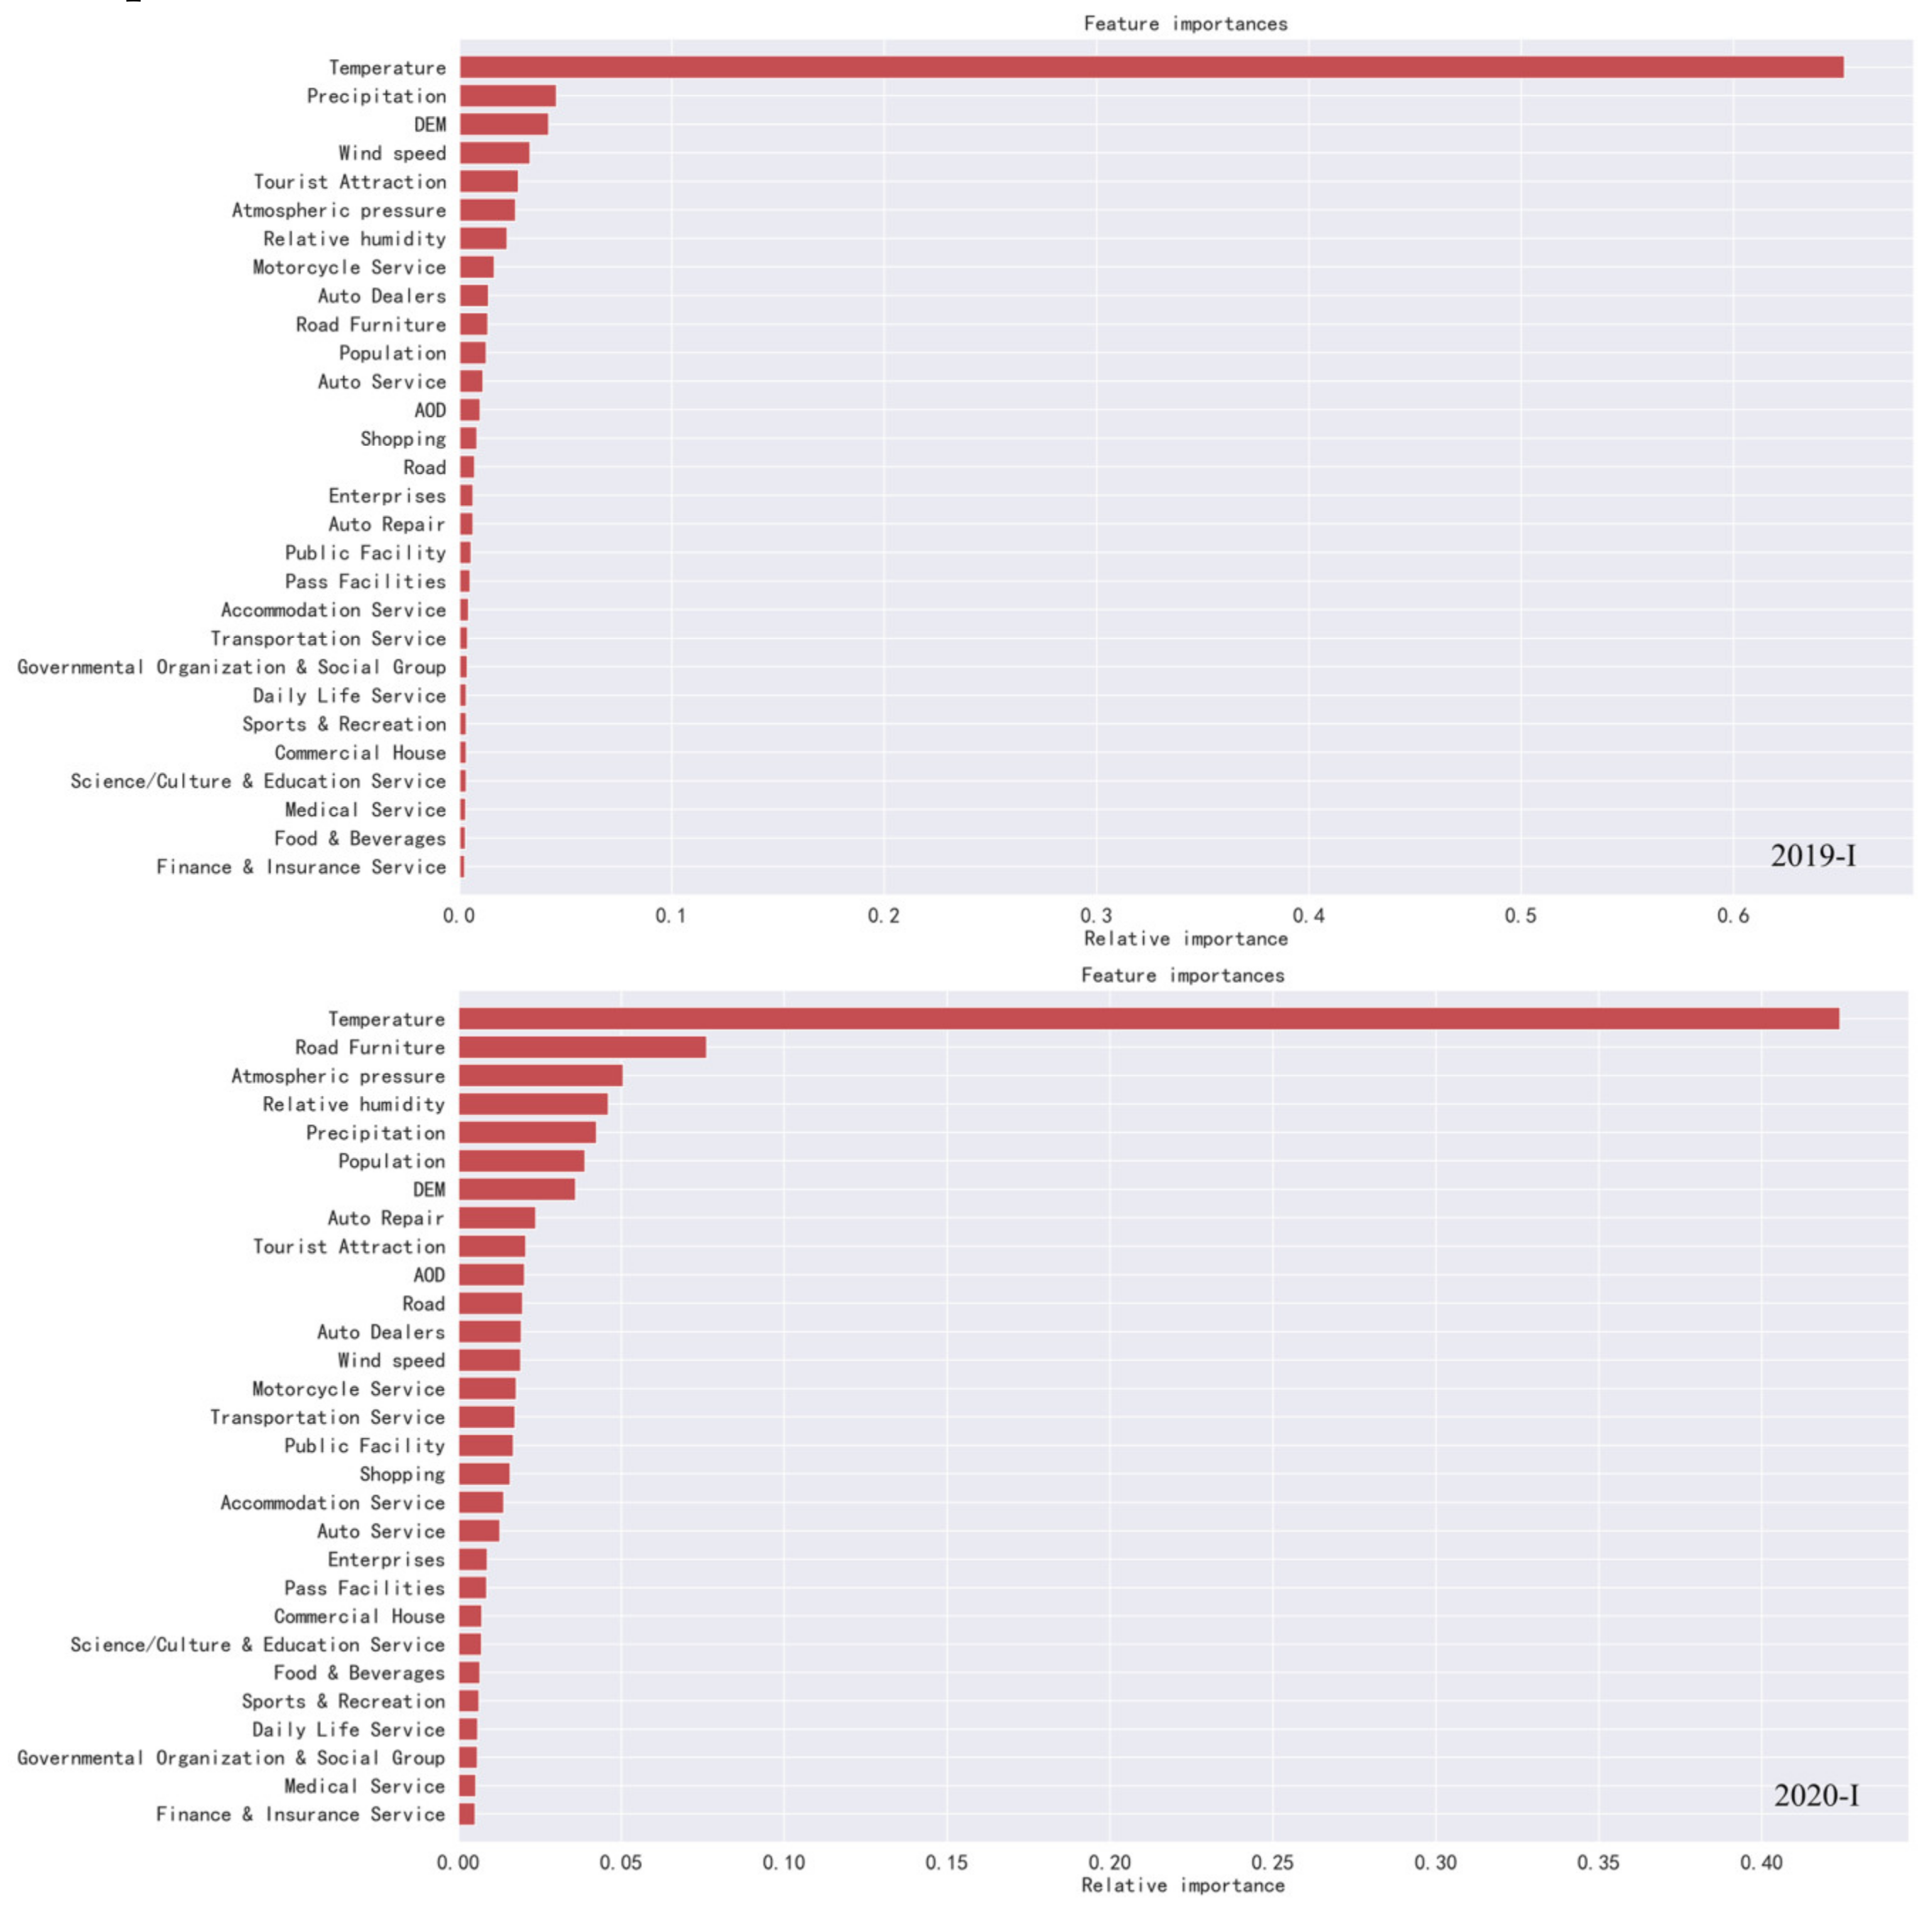
RF model provides an important assessment for each predictor variable. The importance of each variable could be assessed via the percent increase in prediction error (MSE) resulting from randomly permuting the values of an explanatory variable for the out-of-bag observations [22]. The importance assessment can make the variable selection more efficient.
As shown in Figure 3, during 2019-I, the five impact factors ranked by importance were as follows: temperature, precipitation, DEM, wind speed, tourist attraction. In contrast, during 2020-I, the order of importance was as follows: Temperature, road furniture, atmospheric pressure, relative humidity, and precipitation. It is suggested that RF models utilized a higher number and diverse selection of predictors for PM2.5. Over-parameterization can be avoided as = the RF can detect non-linear relations between variables and PM2.5 concentration, and the variable selection was included as a part of the cross-validation process [22,38].

3.2. Cross Validated Model Accuracy

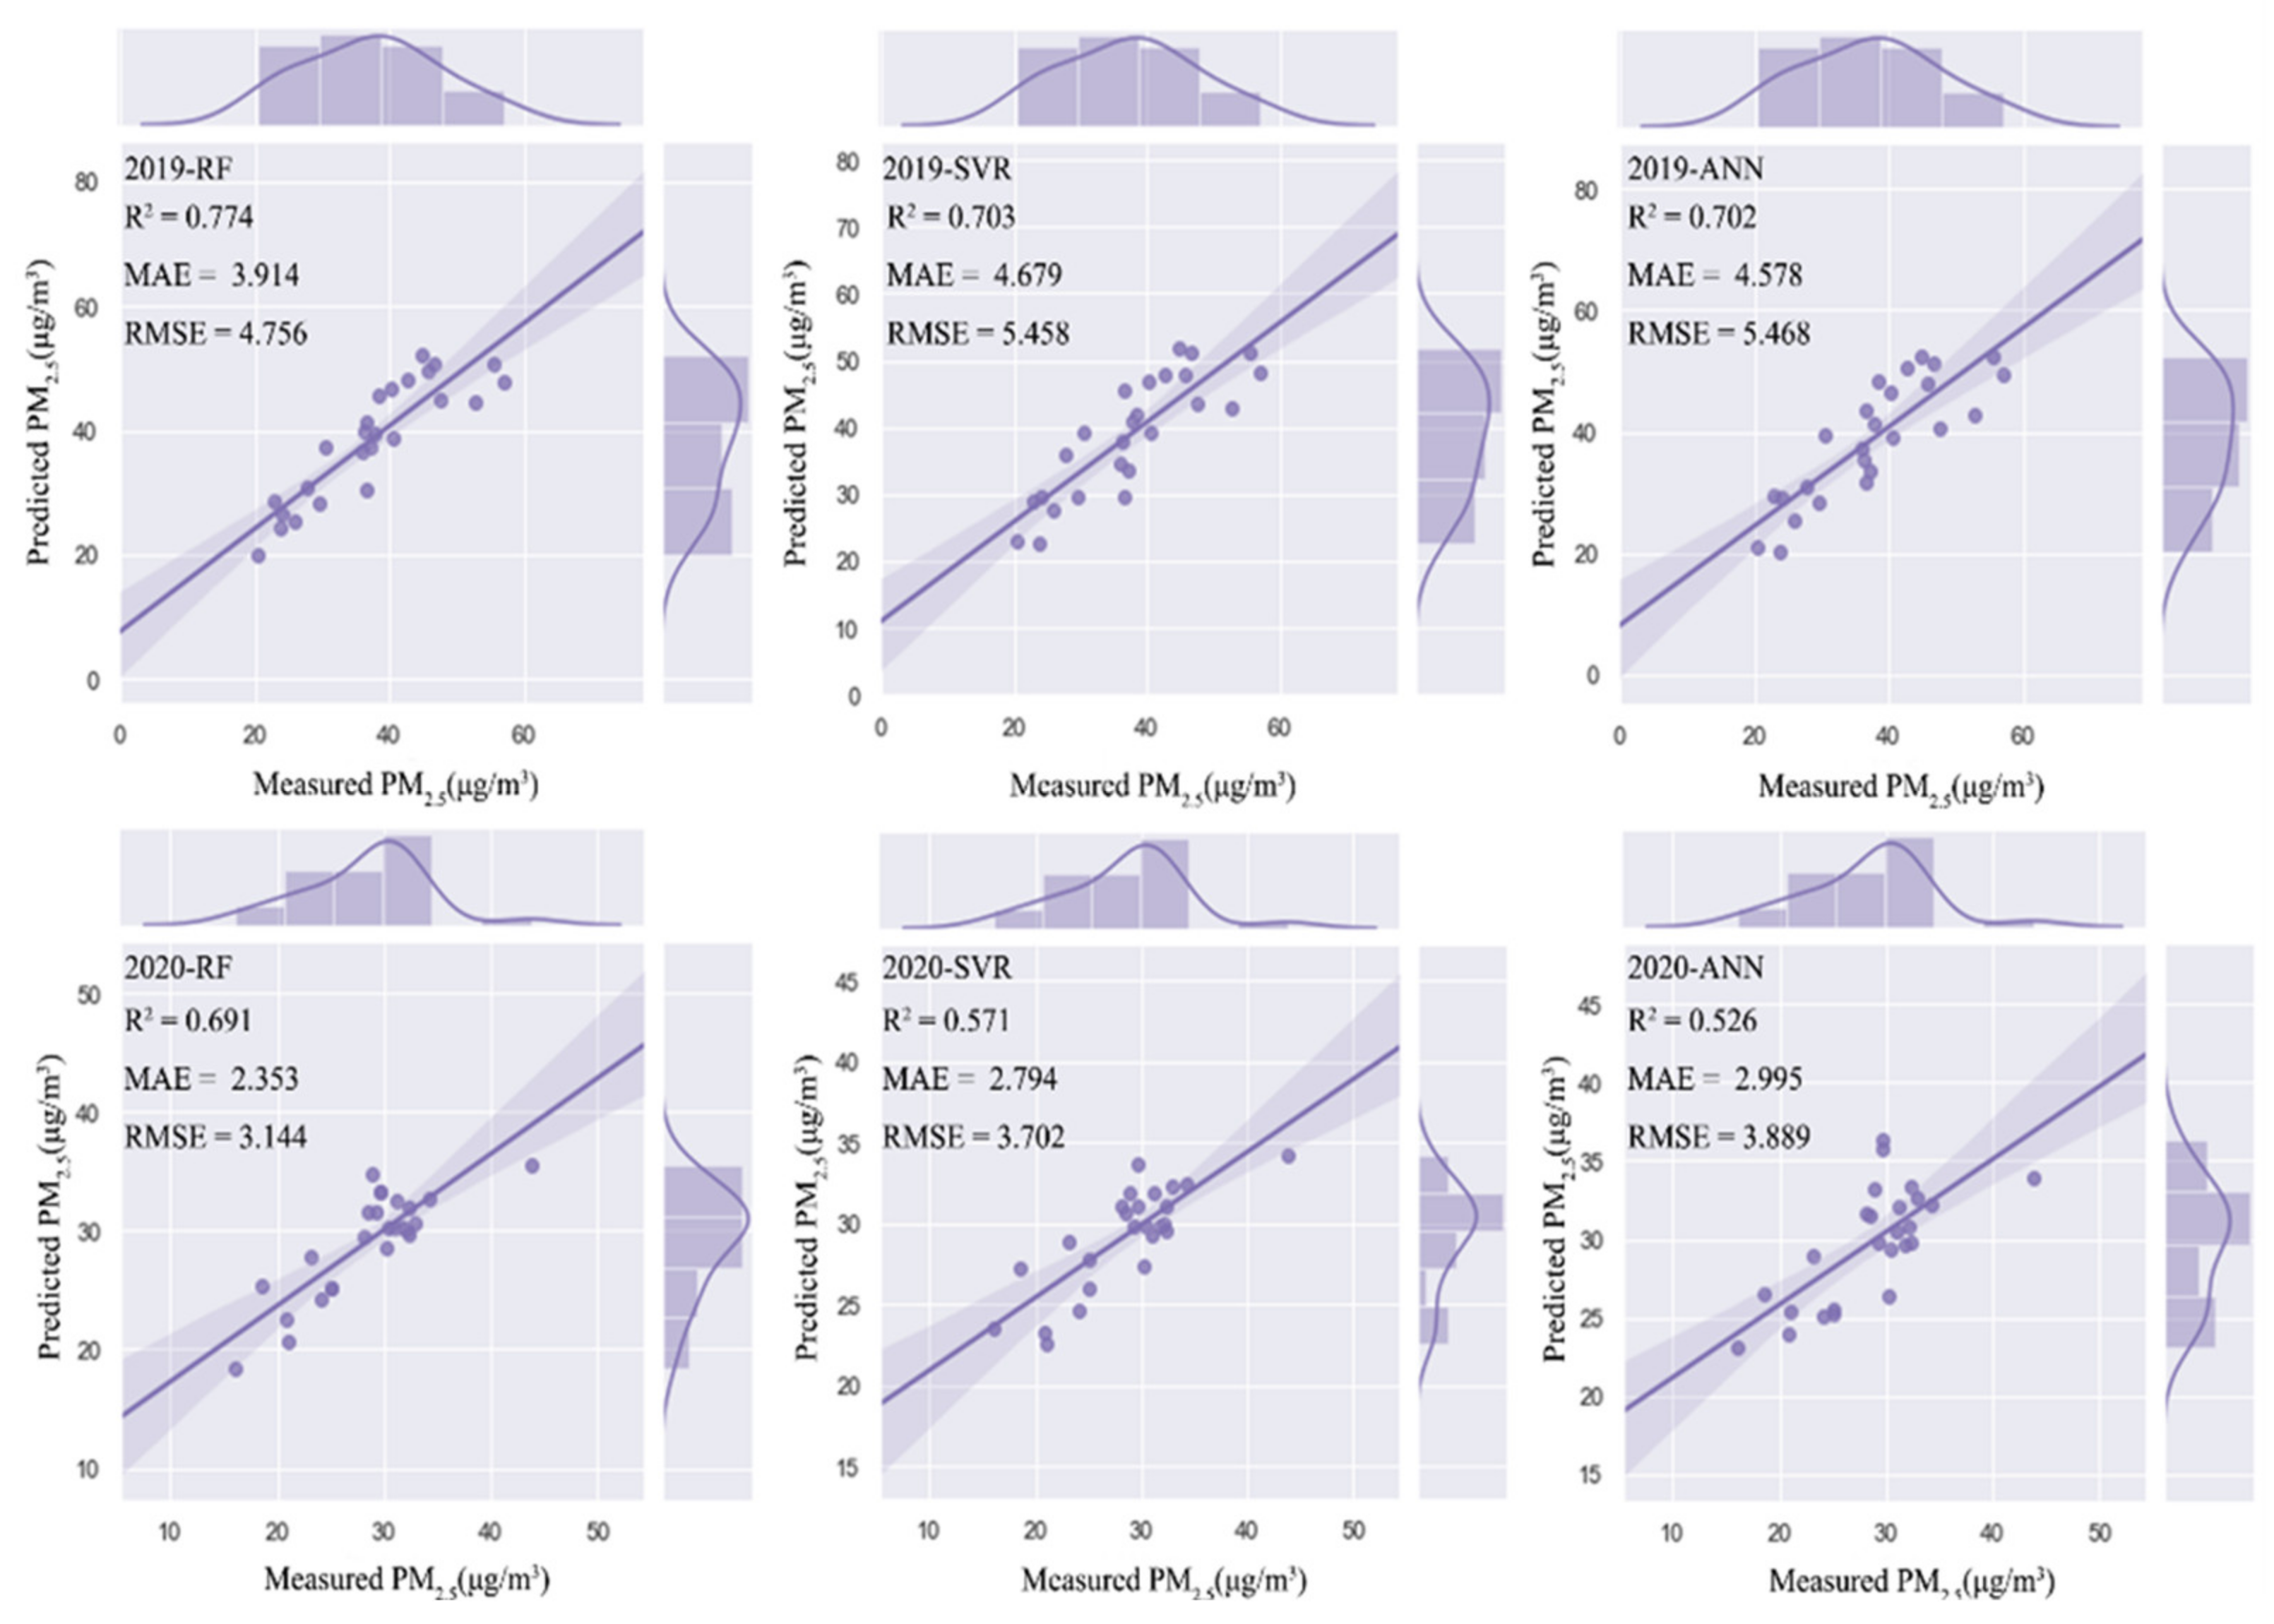
Cross-validation on the validation data set was applied to check to overfit of models. The cross-validated R2, MAE, and RMSE for PM2.5 and model type are presented in Figure 4. As shown in Figure 4, during the period of 2019-I (the same period in 2019), values of R2, MAE, and RMSE of RF model were 0.774, 3.914 μg m−3, and 4.756 μg m−3, respectively; for SVR, values of R2, MAE, and RMSE were 0.703, 4.679 μμg m−3, and 5.458 μg m−3, respectively; for ANN, values of R2, MAE, and RMSE were 0.702, 4.578 μg m−3, 5.468 μg m−3, respectively. During the period of 2020-I (during COVID-19), values of R2, MAE, and RMSE of RF model were 0.691, 2.353 μg m−3, and 3.144 μg/m3, respectively; for SVR, values of R2, MAE, and RMSE were 0.571, 2.794 μg m−3, and 3.702 μg m−3, respectively; for ANN, R2, MAE, and RMSE were 0.529, 2.995 μg m−3, and 3.889 μg m−3, respectively. Values of R2 all decreased slightly, while values of MAE and RMSE all increased slightly after cross-validation. The results of cross-validation suggested that the three models are slightly over-fitting.
In the Yangtze River Delta, the regional mean value of PM2.5 concentrations during 2019-I (the same period in 2019) and 2020-I (during COVID-19) were 38.353 μg m−3 and 29.94 μg m−3, respectively. According to ground-truth observations. The values are very close to the estimations of the RF model, of which the values are 38.628 μg m−3 and 30.453 μg m−3, respectively. The results indicate that the RF estimation should be a good approximation to the true state of PM2.5 concentrations in the Yangtze River Delta.
The regional mean value of measured PM2.5 and predicted PM2.5 (RF) of 16 cities in the Yangtze River Delta are shown in Figure 5. During 2019-I (the same period in 2019), differences between measured PM2.5 and predicted PM2.5 ranged from 0.089 μg m−3 to −2.867 μg m−3; comparatively, during 2020-I (during COVID-19), differences between measured PM2.5 and predicted PM2.5 ranged from 0.121 μg m−3 to 1.669 μg m−3. RF model performed well in most cities of Yangtze River Delta with satisfying goodness of fit. Cities with relatively big estimations errors are Zhoushan, Nantong, Taizhou, and Huzhou. The cities, as mentioned above, are coastal cities with low concentrations of PM2.5, where the weather conditions are complex and changeable, and which give rise to larger estimation errors.
In conclusion, a comprehensive comparison between models shows that R2 values of RF model are higher than SVR and ANN, while MAE values and RMSE values of RF are lower than those of SVR and RMSE. The results suggest that RF model is optimal in predicting PM2.5 concentrations. Therefore, RF model was selected for estimation of PM2.5.

3.3. PM2.5 Estimates during COVID-19

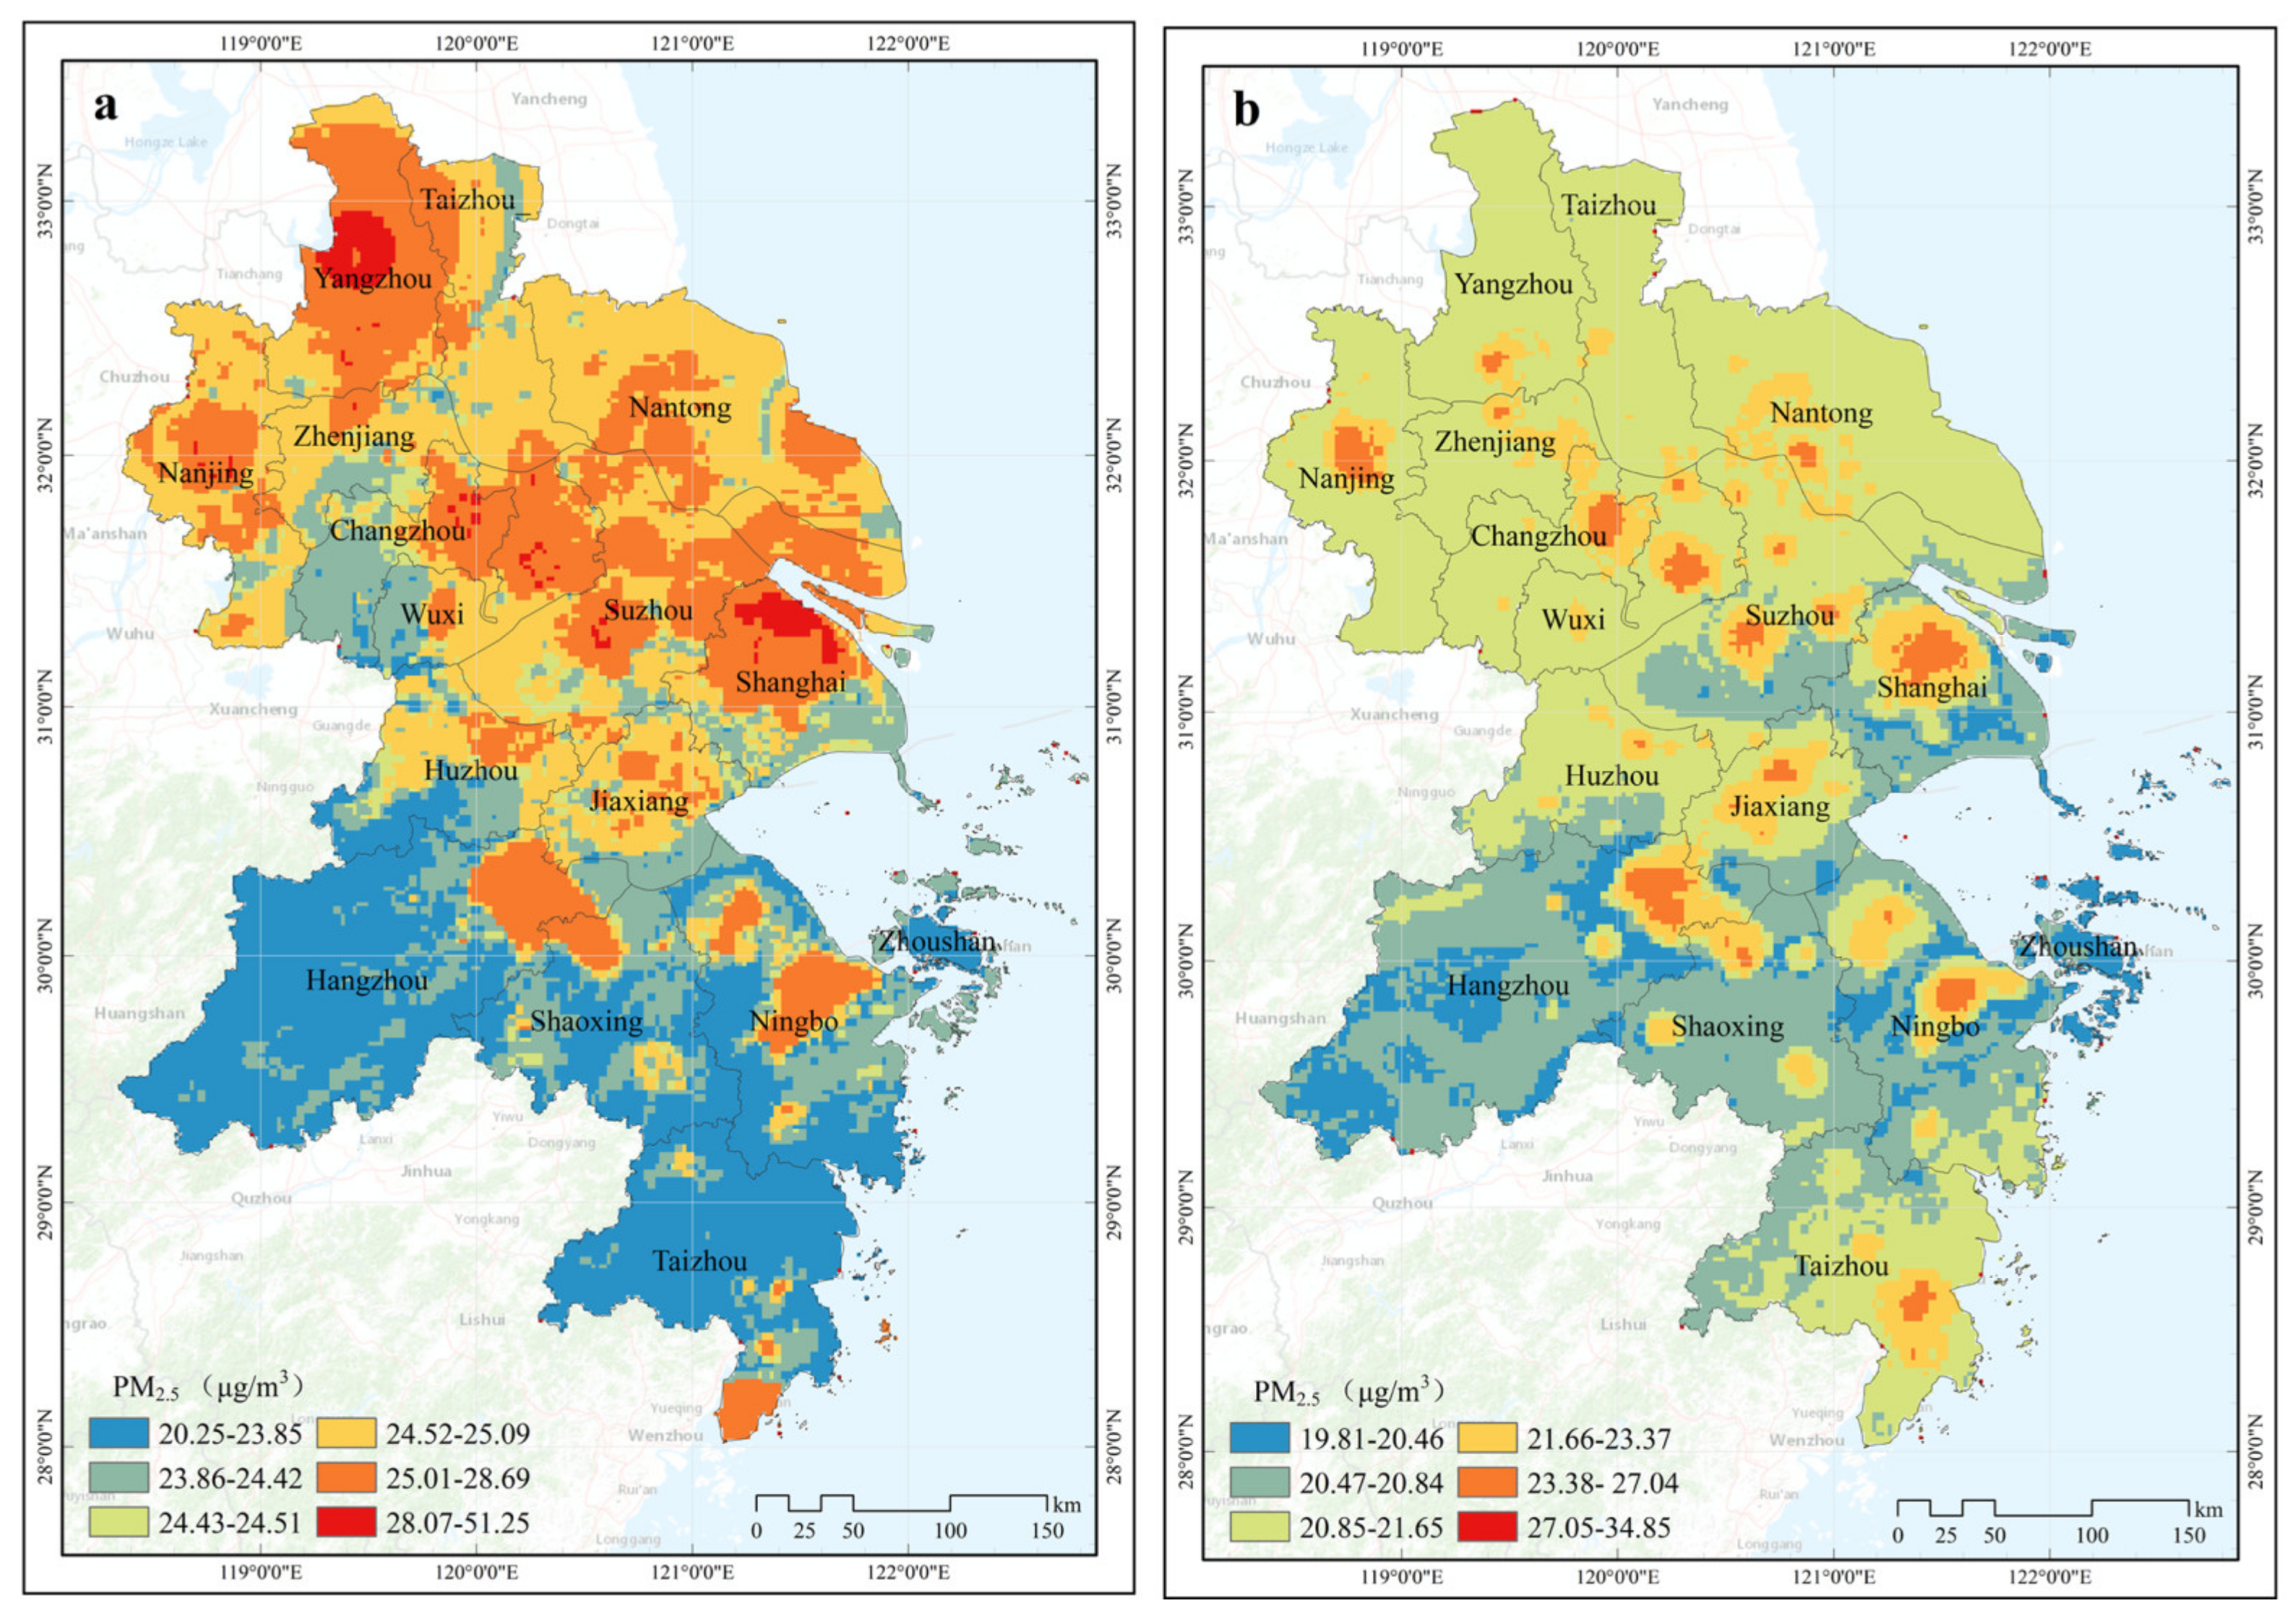
In this study, RF model was developed to estimate PM2.5 in the Yangtze River Delta with MODIS AOD data, meteorological, DEM, road density, and POI data. The results of the prediction of PM2.5, which are based on RF were mapped in the ArcGIS platform (Figure 6). According to our estimates, the mean value of PM2.5 concentrations during 2019-I (the same period in 2019) in the Yangtze River Delta was 25.129 μg m−3, while in 2020-I (during COVID-19), the mean value was 21.519 μg m−3. The highest/lowest values of PM2.5 concentrations during 2019-I (the same period in 2019) in Yangtze River Delta was 51.245 μg m−3, and 20.247 μg m−3, respectively; while in 2020-I (during COVID-19), the highest/lowest values decreased to 34.85 μg m−3, and 19.81 μg m−3, respectively. Higher PM2.5 concentrations were found in Jiangsu Province, especially in Wuxi, Changzhou, Suzhou, Taizhou, and other southern and middle Jiangsu regions. The low values of PM2.5 were mainly observed in the mountainous areas of Zhejiang Province, where the weak human activities in the mountains resulted in fewer emissions of PM2.5 precursors.
Overall, the spatial distribution of PM2.5 concentrations in the Yangtze River Delta showed a pattern of high north and low south; PM2.5 concentrations significantly decreased under the “lockdown policy” during COVID-19 in 2020. We pushed the PM2.5 site data into space through the model, effectively making up for the lack of space in the PM2.5 monitoring stations and obtaining data covering the entire region during COVID-19.

3.4. PM2.5 Variations during COVID-19

The overall declining trends of PM2.5 in the Yangtze River Delta can be found during COVID-19 in 2020, with only a few areas in Taizhou showed upward trends (Figure 7). The regional mean value of PM2.5 in the Yangtze River Delta has declined by 3.61 μg m−3 during COVID-19, with the highest decline rate found in Yangzhou (5.70 μg m−3), and lowest rate found in Taizhou (2.26 μg m−3), respectively. In general, higher decline rates of PM2.5 were mainly found in the north part of the Yangtze River Delta, which is also consistent with the spatial clustering of PM2.5 in the north part of the Yangtze River Delta. The area with high PM2.5 concentrations is usually the area with a high concentration of human activities. The northern part of the Yangtze River Delta has a flat terrain with a densely distributed population, industries, and farming activities. In contrast, the southern part is a mostly hilly and mountainous area with low population density and low air pollutant emission. According to previous studies, PM2.5 pollution in the Yangtze River Delta mainly comes from industry and traffic. Therefore, the obvious reductions of PM2.5 found in this study were directly related to the strict lockdown actions. The majority of fine particles from industry and traffic emissions were the primary emissions from industrial. It was found that traffic emissions decreased with an increase in secondary particles in PM2.5 during the COVID-19 lock period.

4. Discussion

Air pollution brings about many challenges for the sustainable development of cities. The sparse distribution of monitoring stations limits our understanding of spatial-temporal dynamics of air conditions. To address this gap, many researchers try to obtain the spatially continuous distribution of PM2.5 based on relations between PM2.5 and AOD. The AOD products, applied in earlier studies, have coarse spatial resolutions of about 10 km, which is difficult to apply in air pollution estimation studies at the urban scale. The recent newly developed AOD product, based on MODIS data, has a high resolution of 1 km, which significantly improves the spatial resolution of regional PM2.5 mapping and is gradually applied to the estimation model of urban PM2.5.
In this study, R2 value of RF model during COVID-19 in 2020 and the same periods of 2019 are 0.93, and 0.917, respectively; and the cross-validation R2 are 0.77 and 0.69, respectively. The RF model outperformed the SVR and ANN models in the Yangtze River Delta. It is suggested that the RF model explained a large fraction of the measured PM2.5 spatial variability based on the monitoring data and AOD in the Yangtze River Delta. To be comparable with our study, only those studies on AOD-PM2.5 estimations over the Yangtze River Delta are selected (Table 4). RF model can capture 69–77% of the variations in the sample-based CV and can outperform most previous models used for generating 3 km resolution PM2.5 maps of Yangtze River Delta, e.g., the Spatio-temporal model (STM) (CV R2 = 0.63; Yang et al., 2017) [25] and Linear mixed-effects (LME) model (CV R2 = 0.725; Ma et al., 2016) [50]. The accuracy of the current RF model is close to the results of the PM2.5 mapping model with 6 km and 10 km resolutions, including the geographically weighted regression model (GWR) model (Jiang et al., 2017) [51] and the three-stage hierarchical spatial and temporal statistical model (T-SSM) (She et al., 2020) [52]. The comparison indicates that the RF model is suitable for estimating and predicting PM2.5 concentration in the Yangtze River Delta. However, the RF model, developed in this study, is slightly over-fitting. Humidity correction and vertical correction are suggested in future modeling of PM2.5 to reduce the error of input variables to obtain the optimal research results.
Recent pioneer studies revealed that the mean value of PM2.5 concentrations in 367 cities during COVID-19 has decreased by 18.9 μg m−3 compared with the periods before COVID-19; PM2.5 in the city with the worst breakouts of COVID-19: Wuhan decreased by 1.4 μg m−3 [53]. The mean value of PM2.5 concentrations in Zhejiang province declined by 14.691 μg m−3 during COVID-19 [54]. The varying degree of PM2.5 varied due to different spatial-temporal scales of studies. However, a consensus is that PM2.5 concentrations decreased, in general, under the strict “lockdown policy” during COVID-19, and the air quality had improved [10,55,56,57,58]. This study provides a theoretical basis for controlling human activities to enhance the quality of air under extreme air pollution conditions. The published literature uses PM2.5 data from urban monitoring sites. This paper compares different models and uses the most accurate model to estimate PM2.5 data in the Yangtze River Delta during the epidemic and obtain PM2.5 data covering the entire region. Therefore, compared with the published literature, the PM2.5 data, estimated by the model, covers urban areas and rural areas, and can be reached through spatial analysis. The research results revealed the spatial heterogeneity of PM2.5 pollution during COVID-19.
In summary, RF-derived PM2.5 concentrations during COVID-19 in 2020 and the same period in 2019 were compared to assess the influence of “lockdown policy” on air pollution. The results of this study provide an important reference for air pollution control strategy. Although PM2.5 reduction, during COVID-19, is mainly caused by declining emissions caused by the stagnation of production and human activities, the effects of climatic change or previous inertia emission reduction cannot be ignored. Their contributions need to be clarified in future studies.

5. Conclusions

The machine learning method was able to explain a large proportion of the variability in the ambient PM2.5 concentrations in the Yangtze River Delta, with variables of meteorology, elevation, population, road, and POI data. The RF model of PM2.5 outperformed the SVR and ANN models in the Yangtze River Delta (YRD) region, and the predicted PM2.5 concentration, based on RF model, was of high spatial variations in the YRD region. Therefore, the RF model was found to provide an exposure assessment for studies on air pollution in China in the future. RF-based results suggested that PM2.5 concentrations in the YRD region decreased at multiple spatial scales during COVID-19 in 2020, compared with the value during the same period, in 2019, under the influence of “lockdown policy” on air pollution. We propose that further studies could look into the applications of the RF model as a decision-making tool in air pollution control, and the temporal and spatial resolution should be further improved.

Author Contributions

Conceptualization, D.L. and W.X.; methodology, D.L.; validation, W.M. and D.L.; formal analysis, D.L.; data curation, D.L. and J.W.; writing—original draft preparation, D.L. and L.Z.; writing—review and editing, J.W. and L.Z.; visualization, D.L. and W.M.; supervision, L.Z.; project administration, L.Z.; funding acquisition, L.Z. All authors have read and agreed to the published version of the manuscript.

Funding

This research was funded by The Philosophy and Social Sciences Foundation of Zhejiang Province, grant number 21NDQN270YB.

Institutional Review Board Statement

Not applicable.

Informed Consent Statement

Not applicable.

Data Availability Statement

No new data were created or analyzed in this study. Data sharing is not applicable to this article.

Conflicts of Interest

The authors declare that they have no known competing financial interests or personal relationships that could have appeared to influence the work reported in this paper.

References

  1. Sulaymon, I.D.; Zhang, Y.; Hopke, P.K.; Zhang, Y.; Hua, J.; Mei, X. COVID-19 pandemic in Wuhan: Ambient air quality and the relationships between criteria air pollutants and meteorological variables before, during, and after lockdown. Atmos. Res. 2021, 250, 105362. [Google Scholar] [CrossRef]
  2. Guan, D.; Wang, D.; Hallegatte, S.; Davis, S.J.; Huo, J.; Li, S.; Bai, Y.; Lei, T.; Xue, Q.; Coffman, D.; et al. Global supply-chain effects of COVID-19 control measures. Nat. Hum. Behav. 2020, 4, 577–587. [Google Scholar] [CrossRef]
  3. Coker, E.S.; Cavalli, L.; Fabrizi, E.; Guastella, G.; Lippo, E.; Parisi, M.L.; Pontarollo, N.; Rizzati, M.; Varacca, A.; Vergalli, S. The Effects of Air Pollution on COVID-19 Related Mortality in Northern Italy. Environ. Resour. Econ. 2020, 1–24. [Google Scholar] [CrossRef]
  4. Ming, W.; Zhou, Z.; Ai, H.; Bi, H.; Zhong, Y. COVID-19 and Air Quality: Evidence from China. Emerg. Mark. Financ. Trade 2020, 56, 2422–2442. [Google Scholar] [CrossRef]
  5. Liu, S.; Kong, G.; Kong, D. Effects of the COVID-19 on Air Quality: Human Mobility, Spillover Effects, and City Connections. Environ. Resour. Econ. 2020, 1–19. [Google Scholar] [CrossRef]
  6. Brimblecombe, P.; Lai, Y. Effect of sub-urban scale lockdown on air pollution in Beijing. Urban Clim. 2020, 34, 100725. [Google Scholar] [CrossRef]
  7. Chakraborty, I.; Maity, P. COVID-19 outbreak: Migration, effects on society, global environment and prevention. Sci. Total Environ. 2020, 728, 138882. [Google Scholar] [CrossRef] [PubMed]
  8. Li, M.; Wang, T.; Xie, M.; Li, S.; Zhuang, B.; Fu, Q.; Zhao, M.; Wu, H.; Liu, J.; Saikawa, E.; et al. Drivers for the poor air quality conditions in north China Plain during the COVID-19 outbreak. Atmos. Environ. 2020, 118103. [Google Scholar] [CrossRef]
  9. Pei, Z.; Han, G.; Ma, X.; Su, H.; Gong, W. Response of major air pollutants to COVID-19 lockdowns in China. Sci. Total Environ. 2020, 743, 140879. [Google Scholar] [CrossRef] [PubMed]
  10. Feng, S.; Jiang, F.; Wang, H.; Wang, H.; Ju, W.; Shen, Y.; Zheng, Y.; Wu, Z.; Ding, A. NO x Emission Changes Over China During the COVID-19 Epidemic Inferred from Surface NO2 Observations. Geophys. Res. Lett. 2020, 47, e2020GL090080. [Google Scholar] [CrossRef] [PubMed]
  11. Yuan, Q.; Qi, B.; Hu, D.; Wang, J.; Zhang, J.; Yang, H.; Zhang, S.; Liu, L.; Xu, L.; Li, W. Spatiotemporal variations and reduction of air pollutants during the COVID-19 pandemic in a megacity of Yangtze River Delta in China. Sci. Total Environ. 2021, 751, 141820. [Google Scholar] [CrossRef] [PubMed]
  12. Han, Y.; Lam, J.C.K.; Li, V.O.K.; Guo, P.; Zhang, Q.; Wang, A.; Crowcroft, J.; Wang, S.; Fu, J.; Gilani, Z.; et al. The Effects of Outdoor Air Pollution Concentrations and Lockdowns on Covid-19 Infections in Wuhan and Other Provincial Capitals in China. Preprints 2020. [Google Scholar] [CrossRef]
  13. Bao, R.; Zhang, A. Does lockdown reduce air pollution? Evidence from 44 cities in northern China. Sci. Total Environ. 2020, 731, 139052. [Google Scholar] [CrossRef] [PubMed]
  14. Fang, X.; Zou, B.; Liu, X.; Sternberg, T.; Zhai, L. Satellite-based ground PM2.5 estimation using timely structure adaptive modeling. Remote Sens. Environ. 2016, 186, 152–163. [Google Scholar] [CrossRef]
  15. Wang, S.; Zhou, C.; Wang, Z.; Feng, K.; Hubacek, K. The characteristics and drivers of fine particulate matter (PM2.5) distribution in China 2016. J. Clean. Prod. 2017, 142, 1800–1809. [Google Scholar] [CrossRef]
  16. Chen, G.; Li, S.; Knibbs, L.D.; Hamm, N.A.S.; Cao, W.; Li, T.; Guo, J.; Ren, H.; Abramson, M.J.; Guo, Y. A machine learning method to estimate PM2.5 concentrations across China with remote sensing, meteorological and land use information. Sci. Total Environ. 2018, 636, 52–60. [Google Scholar] [CrossRef] [PubMed]
  17. Ma, Z.; Hu, X.; Sayer, A.M.; Levy, R.; Zhang, Q.; Xue, Y.; Tong, S.; Bi, J.; Huang, L.; Liu, Y. Satellite-Based Spatiotemporal Trends in PM2.5 Concentrations: China, 2004-2013. Environ. Health Perspect. 2016, 124, 184–192. [Google Scholar] [CrossRef] [PubMed] [Green Version]
  18. Xue, W.; Zhang, J.; Zhong, C.; Ji, D.; Huang, W. Satellite-derived spatiotemporal PM2.5 concentrations and variations from 2006 to 2017 in China. Sci. Total Environ. 2020, 712, 134577. [Google Scholar] [CrossRef]
  19. Ma, Z.; Hu, X.; Huang, L.; Bi, J.; Liu, Y. Estimating ground-level PM2.5 in China using satellite remote sensing. Environ. Sci. Technol. 2014, 48, 7436–7444. [Google Scholar] [CrossRef]
  20. Lu, D.; Xu, J.; Yang, D.; Zhao, J. Spatio-temporal variation and influence factors of PM2.5 concentrations in China from 1998 to 2014. Atmos. Pollut. Res. 2017, 8, 1151–1159. [Google Scholar] [CrossRef]
  21. Zhai, L.; Zou, B.; Fang, X.; Luo, Y.; Wan, N.; Li, S. Land Use Regression Modeling of PM2.5 Concentrations at Optimized Spatial Scales. Atmosphere 2017, 8, 1. [Google Scholar] [CrossRef] [Green Version]
  22. Brokamp, C.; Jandarov, R.; Hossain, M.; Ryan, P. Predicting Daily Urban Fine Particulate Matter Concentrations Using a Random Forest Model. Environ. Sci. Technol. 2018, 52, 4173–4179. [Google Scholar] [CrossRef] [PubMed]
  23. Wei, J.; Huang, W.; Li, Z.; Xue, W.; Peng, Y.; Sun, L.; Cribb, M. Estimating 1-km-resolution PM2.5 concentrations across China using the space-time random forest approach. Remote Sens. Environ. 2019, 231, 111221. [Google Scholar] [CrossRef]
  24. Stafoggia, M.; Bellander, T.; Bucci, S.; Davoli, M.; de Hoogh, K.; de’ Donato, F.; Gariazzo, C.; Lyapustin, A.; Michelozzi, P.; Renzi, M.; et al. Estimation of daily PM10 and PM2.5 concentrations in Italy, 2013–2015, using a spatiotemporal land-use random-forest model. Environ. Int. 2019, 124, 170–179. [Google Scholar] [CrossRef] [PubMed]
  25. Yang, D.; Lu, D.; Xu, J.; Ye, C.; Zhao, J.; Tian, G.; Wang, X.; Zhu, N. Predicting spatio-temporal concentrations of PM2.5 using land use and meteorological data in Yangtze River Delta, China. Stoch. Environ. Res. Risk Assess. 2018, 32, 2445–2456. [Google Scholar] [CrossRef]
  26. Di, Q.; Amini, H.; Shi, L.; Kloog, I.; Silvern, R.; Kelly, J.; Sabath, M.B.; Choirat, C.; Koutrakis, P.; Lyapustin, A.; et al. An ensemble-based model of PM2.5 concentration across the contiguous United States with high spatiotemporal resolution. Environ. Int. 2019, 130, 104909. [Google Scholar] [CrossRef]
  27. Wei, J.; Li, Z.; Lyapustin, A.; Sun, L.; Peng, Y.; Xue, W.; Su, T.; Cribb, M. Reconstructing 1-km-resolution high-quality PM2.5 data records from 2000 to 2018 in China: Spatiotemporal variations and policy implications. Remote Sens. Environ. 2021, 252, 112136. [Google Scholar] [CrossRef]
  28. Wei, J.; Li, Z.; Xue, W.; Sun, L.; Fan, T.; Liu, L.; Su, T.; Cribb, M. The ChinaHighPM10 dataset: Generation, validation, and spatiotemporal variations from 2015 to 2019 across China. Environ. Int. 2021, 146, 106290. [Google Scholar] [CrossRef]
  29. Meng, X.; Hand, J.L.; Schichtel, B.A.; Liu, Y. Space-time trends of PM2.5 constituents in the conterminous United States estimated by a machine learning approach, 2005–2015. Environ. Int. 2018, 121, 1137–1147. [Google Scholar] [CrossRef]
  30. Huang, K.; Xiao, Q.; Meng, X.; Geng, G.; Wang, Y.; Lyapustin, A.; Gu, D.; Liu, Y. Predicting monthly high-resolution PM2.5 concentrations with random forest model in the North China Plain. Environ. Pollut. 2018, 242, 675–683. [Google Scholar] [CrossRef]
  31. Kashima, S.; Yorifuji, T.; Tsuda, T.; Doi, H. Application of land use regression to regulatory air quality data in Japan 2009. Sci. Total Environ. 2009, 407, 3055–3062. [Google Scholar] [CrossRef] [PubMed]
  32. Ryan, P.H.; Lemasters, G.K.; Biswas, P.; Levin, L.; Hu, S.; Lindsey, M.; Bernstein, D.I.; Lockey, J.; Villareal, M.; Khurana Hershey, G.K.; et al. A comparison of proximity and land use regression traffic exposure models and wheezing in infants. Environ. Health Perspect. 2007, 115, 278–284. [Google Scholar] [CrossRef] [PubMed] [Green Version]
  33. Thompson, B. Stepwise Regression and Stepwise Discriminant Analysis Need Not Apply here: A Guidelines Editorial. Educ. Psychol. Meas. 1995, 55, 525–534. [Google Scholar] [CrossRef]
  34. Lu, D.; Xu, J.; Yue, W.; Mao, W.; Yang, D.; Wang, J. Response of PM2.5 pollution to land use in China. J. Clean. Prod. 2020, 244, 118741. [Google Scholar] [CrossRef]
  35. Hino, M.; Benami, E.; Brooks, N. Machine learning for environmental monitoring. Nat. Sustain 2018, 1, 583–588. [Google Scholar] [CrossRef]
  36. Mao, W.; Lu, D.; Hou, L.; Liu, X.; Yue, W. Comparison of Machine-Learning Methods for Urban Land-Use Mapping in Hangzhou City, China. Remote Sens. 2020, 12, 2817. [Google Scholar] [CrossRef]
  37. Yang, L.; Xu, H.; Yu, S. Estimating PM2.5 concentrations in Yangtze River Delta region of China using random forest model and the Top-of-Atmosphere reflectance. J. Environ. Manag. 2020, 272, 111061. [Google Scholar] [CrossRef]
  38. Hu, X.; Belle, J.H.; Meng, X.; Wildani, A.; Waller, L.A.; Strickland, M.J.; Liu, Y. Estimating PM2.5 Concentrations in the Conterminous United States Using the Random Forest Approach. Environ. Sci. Technol. 2017, 51, 6936–6944. [Google Scholar] [CrossRef]
  39. Yang, W.; Deng, M.; Xu, F.; Wang, H. Prediction of hourly PM2.5 using a space-time support vector regression model. Atmos. Environ. 2018, 181, 12–19. [Google Scholar] [CrossRef]
  40. Gupta, P.; Christopher, S.A. Particulate matter air quality assessment using integrated surface, satellite, and meteorological products: 2. A neural network approach. J. Geophys. Res. 2009, 114. [Google Scholar] [CrossRef]
  41. Wei, J.; Li, Z.; Peng, Y.; Sun, L.; Yan, X. A regionally robust high-spatial-resolution aerosol retrieval algorithm for MODIS images over Eastern China. IEEE Trans. Geosci. Remote Sens. 2019, 57, 4748–4757. [Google Scholar] [CrossRef]
  42. Liu, N.; Zou, B.; Feng, H.; Wang, W.; Tang, Y.; Liang, Y. Evaluation and comparison of multiangle implementation of the atmospheric correction algorithm, Dark Target, and Deep Blue aerosol products over China. Atmos. Chem. Phys. 2019, 19, 8243–8268. [Google Scholar] [CrossRef] [Green Version]
  43. Lyapustin, A.; Wang, Y.; Korkin, S.; Huang, D. MODIS collection 6 MAIAC algorithm. Atmos. Meas. Tech. 2018, 11, 5741–5765. [Google Scholar] [CrossRef] [Green Version]
  44. Breiman, L.I.; Friedman, J.H.; Olshen, R.A.; Stone, C.J. Classification and Regression Trees; Wadsworth: Belmont, CA, USA, 1984; p. 40. [Google Scholar]
  45. Breiman, L. Random Forests. Mach. Learn. 2001, 45, 5–32. [Google Scholar] [CrossRef] [Green Version]
  46. Liu, Y.; Cao, G.; Zhao, N.; Mulligan, K.; Ye, X. Improve ground-level PM2.5 concentration mapping using a random forests-based geostatistical approach. Environ. Pollut. 2018, 235, 272–282. [Google Scholar] [CrossRef] [PubMed]
  47. Cortes, C.; Vapnik, V. Support-vector networks. Mach. Learn. 1995, 20, 273–297. [Google Scholar] [CrossRef]
  48. Drucker, H.; Burges, C.J.C.; Kaufman, L.; Chris, J.C.; Kaufman, B.L.; Smola, A.; Vapnik, V. Support Vector Regression Machines. Adv. Neural Inf. Process. Syst. 1997, 28, 779–784. [Google Scholar]
  49. Rumelhart, D.E.; Mcclelland, J.L. Parallel Distributed Processing; The MIT Press: Cambridge, MA, USA, 1986; pp. 45–76. [Google Scholar]
  50. Ma, Z.; Liu, Y.; Zhao, Q.; Liu, M.; Zhou, Y.; Bi, J. Satellite-derived high resolution PM2.5 concentrations in Yangtze River Delta Region of China using improved linear mixed effects model. Atmos. Environ. (1994) 2016, 133, 156–164. [Google Scholar] [CrossRef]
  51. Jiang, M.; Sun, W.; Yang, G.; Zhang, D. Modelling Seasonal GWR of Daily PM2.5 with Proper Auxiliary Variables for the Yangtze River Delta. Remote Sens. 2017, 9, 346. [Google Scholar] [CrossRef] [Green Version]
  52. She, Q.; Choi, M.; Belle, J.H.; Xiao, Q.; Bi, J.; Huang, K.; Meng, X.; Geng, G.; Kim, J.; He, K.; et al. Satellite-based estimation of hourly PM2.5 levels during heavy winter pollution episodes in the Yangtze River Delta, China. Chemosphere 2020, 239, 124678. [Google Scholar] [CrossRef]
  53. Chen, K.; Wang, M.; Huang, C.; Kinney, P.L.; Anastas, P.T. Air pollution reduction and mortality benefit during the COVID-19 outbreak in China. Lancet Planet. Health 2020, 4, e210–e212. [Google Scholar] [CrossRef]
  54. Li, L.; Li, Q.; Huang, L.; Wang, Q.; Zhu, A.; Xu, J.; Liu, Z.; Li, H.; Shi, L.; Li, R.; et al. Air quality changes during the COVID-19 lockdown over the Yangtze River Delta Region: An insight into the impact of human activity pattern changes on air pollution variation. Sci. Total Environ. 2020, 732, 139282. [Google Scholar] [CrossRef] [PubMed]
  55. Xian, T.; Li, Z.; Wei, J. Changes in air pollution following the COVID-19 epidemic in Northern China: The role of meteorology. Front. Environ. Sci. 2021, 1–9. [Google Scholar] [CrossRef]
  56. Wang, M.; Liu, F.; Zheng, M. Air quality improvement from COVID-19 lockdown: Evidence from China. Air Qual. Atmos. Health 2020, 1–14. [Google Scholar] [CrossRef] [PubMed]
  57. Mahato, S.; Pal, S.; Ghosh, K.G. Effect of lockdown amid COVID-19 pandemic on air quality of the megacity Delhi, India. Sci. Total Environ. 2020, 730, 139086. [Google Scholar] [CrossRef]
  58. Chauhan, A.; Singh, R.P. Decline in PM2.5 concentrations over major cities around the world associated with COVID-19. Environ. Res. 2020, 187, 109634. [Google Scholar] [CrossRef]
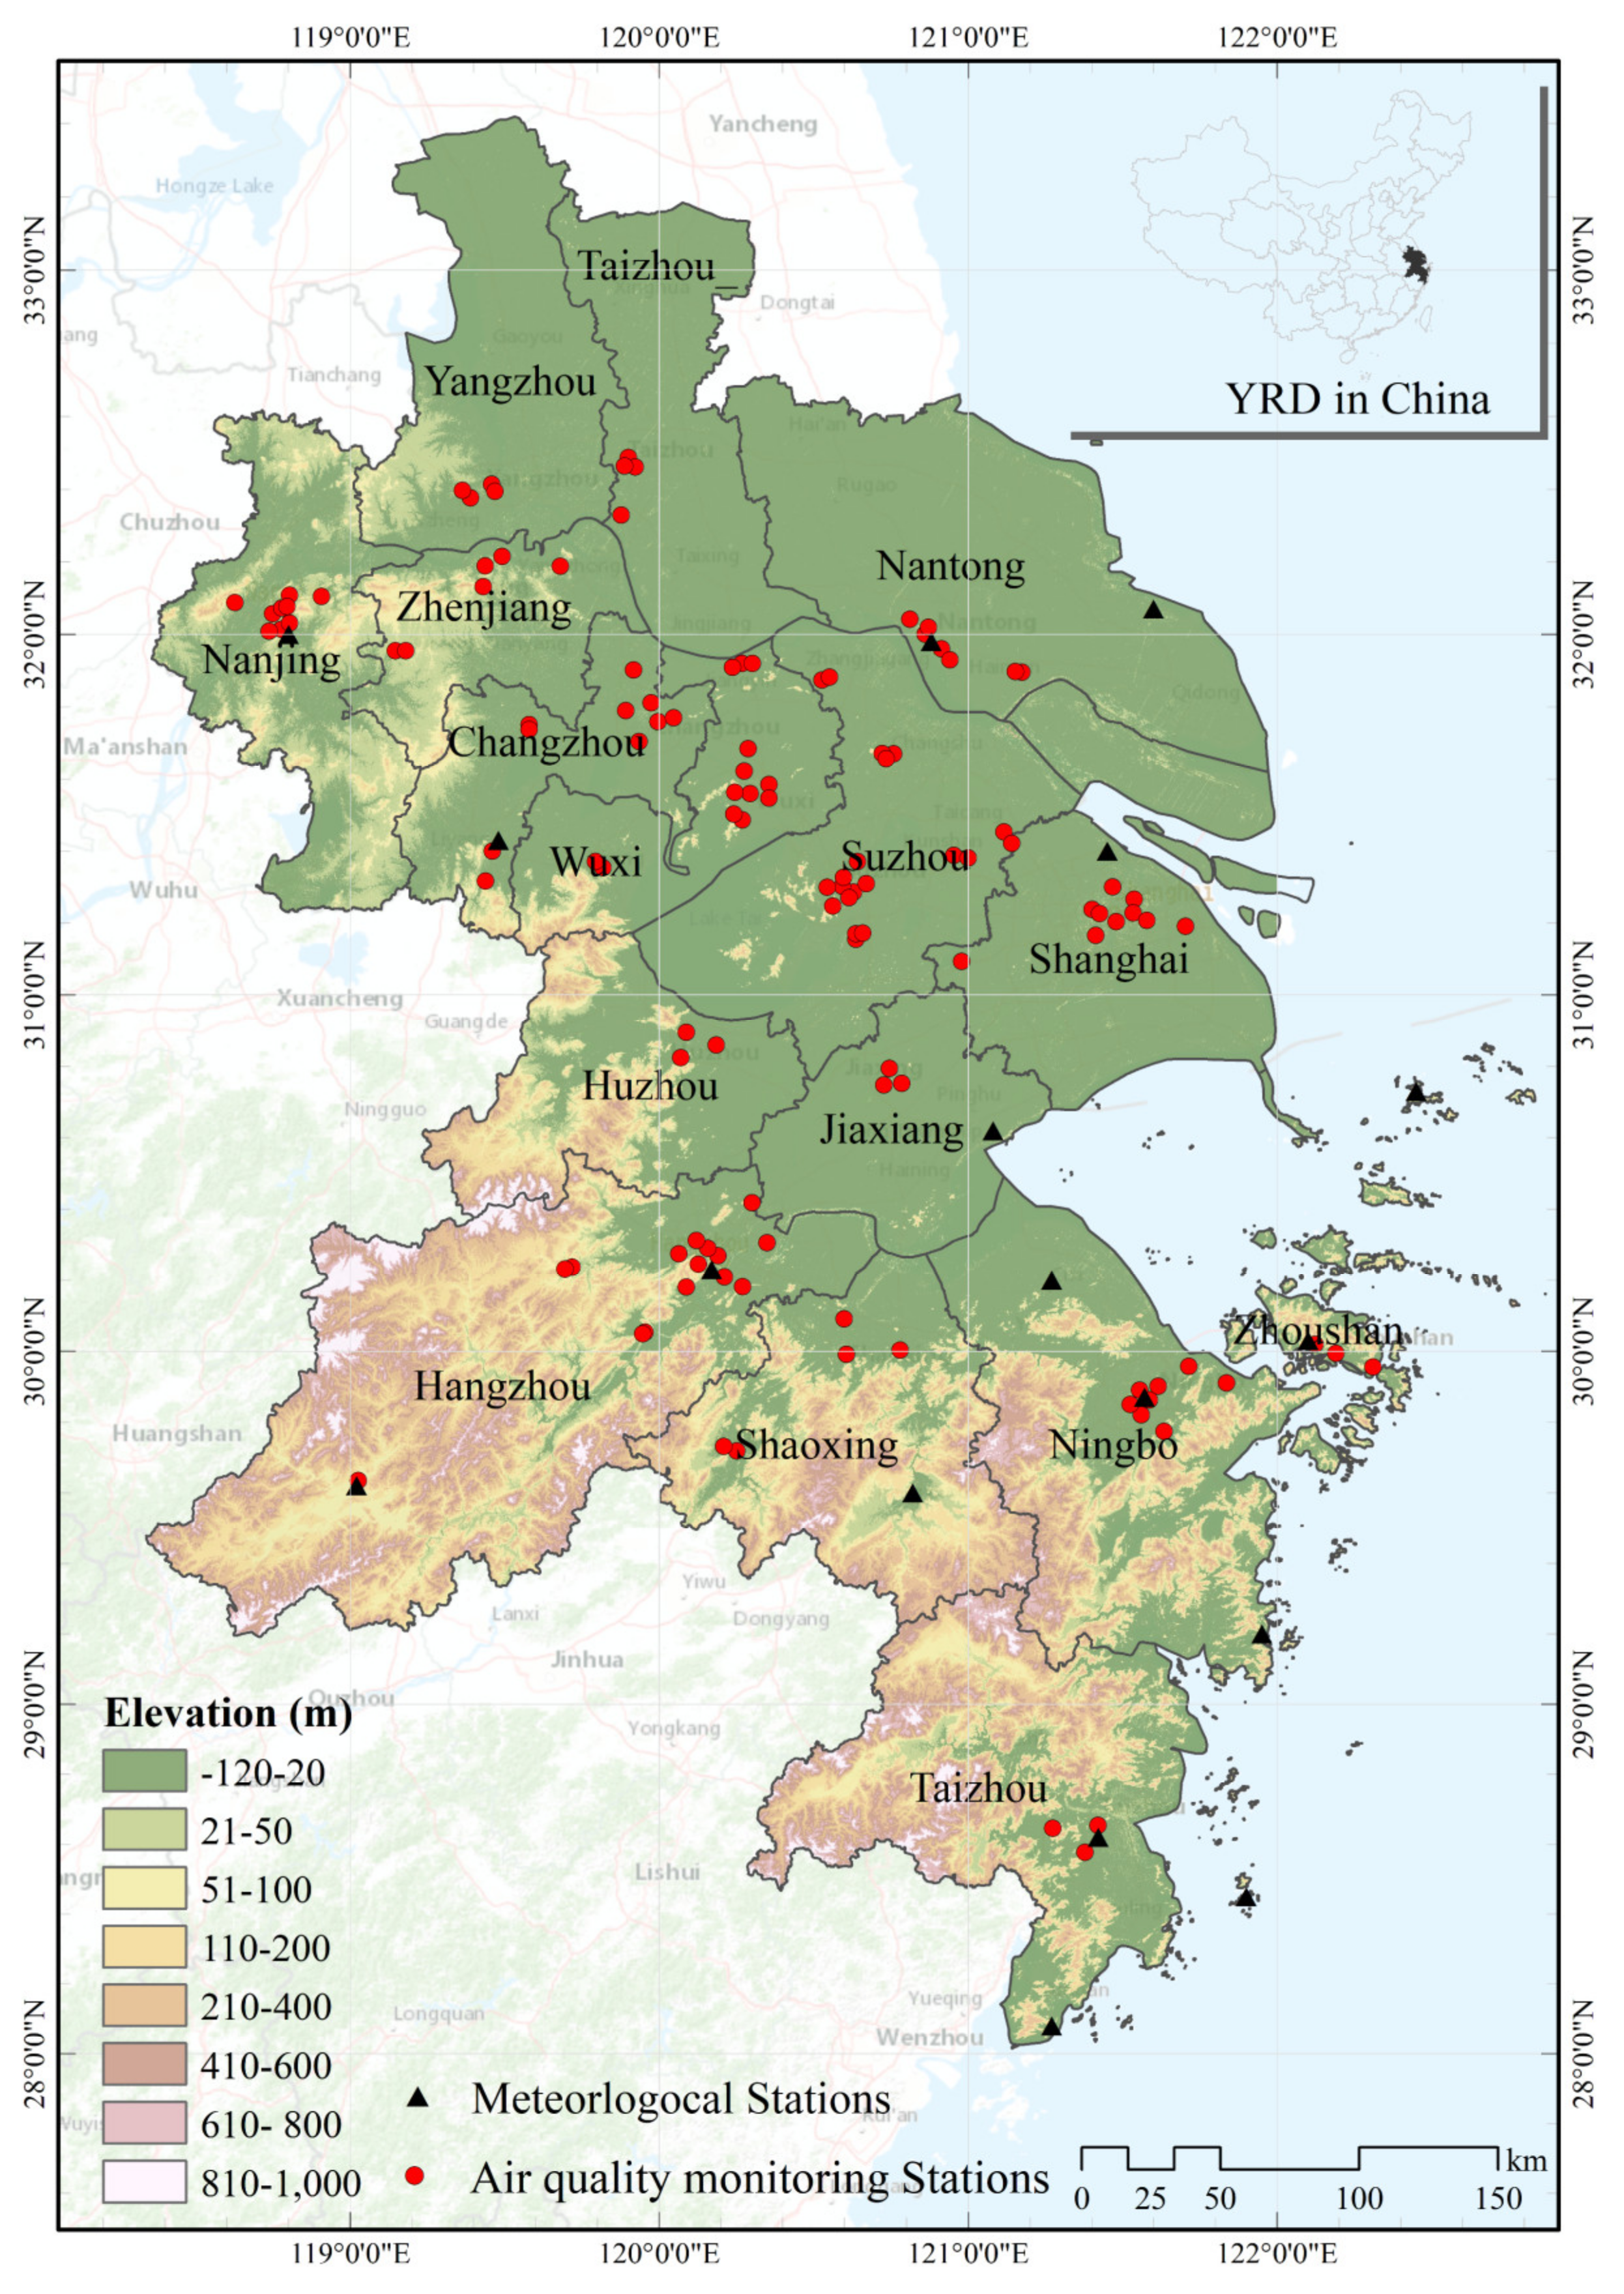
Figure 1. Location Map of the Yangtze River Delta.
Remotesensing 13 01423 g001
Figure 2. Flowchart for producing and assessing the accuracy of the PM2.5 map.
Remotesensing 13 01423 g002
Figure 3. Feature importance during 2019-I and 2020-I.
Remotesensing 13 01423 g003
Figure 4. Validation between predicted and measured PM2.5 by different methods.
Remotesensing 13 01423 g004
Figure 5. Regional mean measured/predicted PM2.5 average monitored concentrations and average simulated concentration of each city (a:2019-I; b:2020-I).
Remotesensing 13 01423 g005
Figure 6. Spatial distributions of estimated PM2.5 concentrations in Yangtze River Delta (a) The same period in 2019; (b) During COVID-19.
Remotesensing 13 01423 g006
Figure 7. Reduction of city PM2.5 in Yangtze River Delta during COVID-19.
Remotesensing 13 01423 g007
Table 1. Datasets used in this study.
DatasetsFormatSource
PM2.5Table Ministry of Ecology and Environment, China
AODGrid1-km MODIS MAIAC AOD
MeteorologicalTableChina Meteorological Administration
ElevationGridGeospatial data cloud of China
POIsPoint featuresGaode Map Services, China
Road networkLine featuresOpen Street Map
Boundary mapsLine featuresOpen Street Map
Table 2. Categories of Gaode Map POIs.
CategoryCountsCategoryCounts
Food & Beverages962,507Auto Service127,669
Road Furniture3619Auto Repair53,193
Tourist Attraction35,668Auto Dealers25,941
Public Facility79,557Commercial House242,212
Enterprises874,211Daily Life Service836,412
Shopping1,959,948Sports & Recreation109,452
Transportation Service349,160Pass Facilities393,393
Finance & Insurance Service85,445Medical Service138,940
Science/Culture & Education Service244,247Governmental Organization & Social Group232,836
Motorcycle Service10,517Accommodation Service106,669
Table 3. Modeling set the precision of estimated PM2.5 concentrations.
RFSVRANN
R2MAERMSER2MAERMSER2MAERMSE
2019-I0.9381.6632.6960.7402.1485.5220.7393.5825.538
2020-I0.9171.0261.4130.7051.5212.6630.5592.4763.258
Table 4. Statistics for the comparisons in performances of different regression models in Yangtze River Delta.
Related StudyModelModel Fitting Model Validation Spatial Resolution
R2MAERMSER2MAERMSE
Ma et al. (2016)LME 0.771-16.720.725-18.303 km
Jiang et al. (2017)GWR0.838 (spring)-12.840.753 (spring)-16.1210 km
0.85 (summer)-6.180.74 (summer)-8.29
0.915 (autumn)-9.860.882 (autumn)-12.33
0.867 (winter)-16.340.785 (winter)-21.15
Yang et al. (2018)STM0.86-8.150.63-4.223 km
She et al. (2020)T-SSM---0.72-236 km
Out studyRF0.938 (2019-I)1.6632.6960.77 (2019-I)3.9144.7561km
0.917 (2020-I)1.0261.4130.691 (2020-I)2.3533.1441km
Publisher’s Note: MDPI stays neutral with regard to jurisdictional claims in published maps and institutional affiliations.