
Effect of Ecological Construction Engineering on Vegetation Restoration: A Case Study of the Loess Plateau


Abstract
1. Introduction
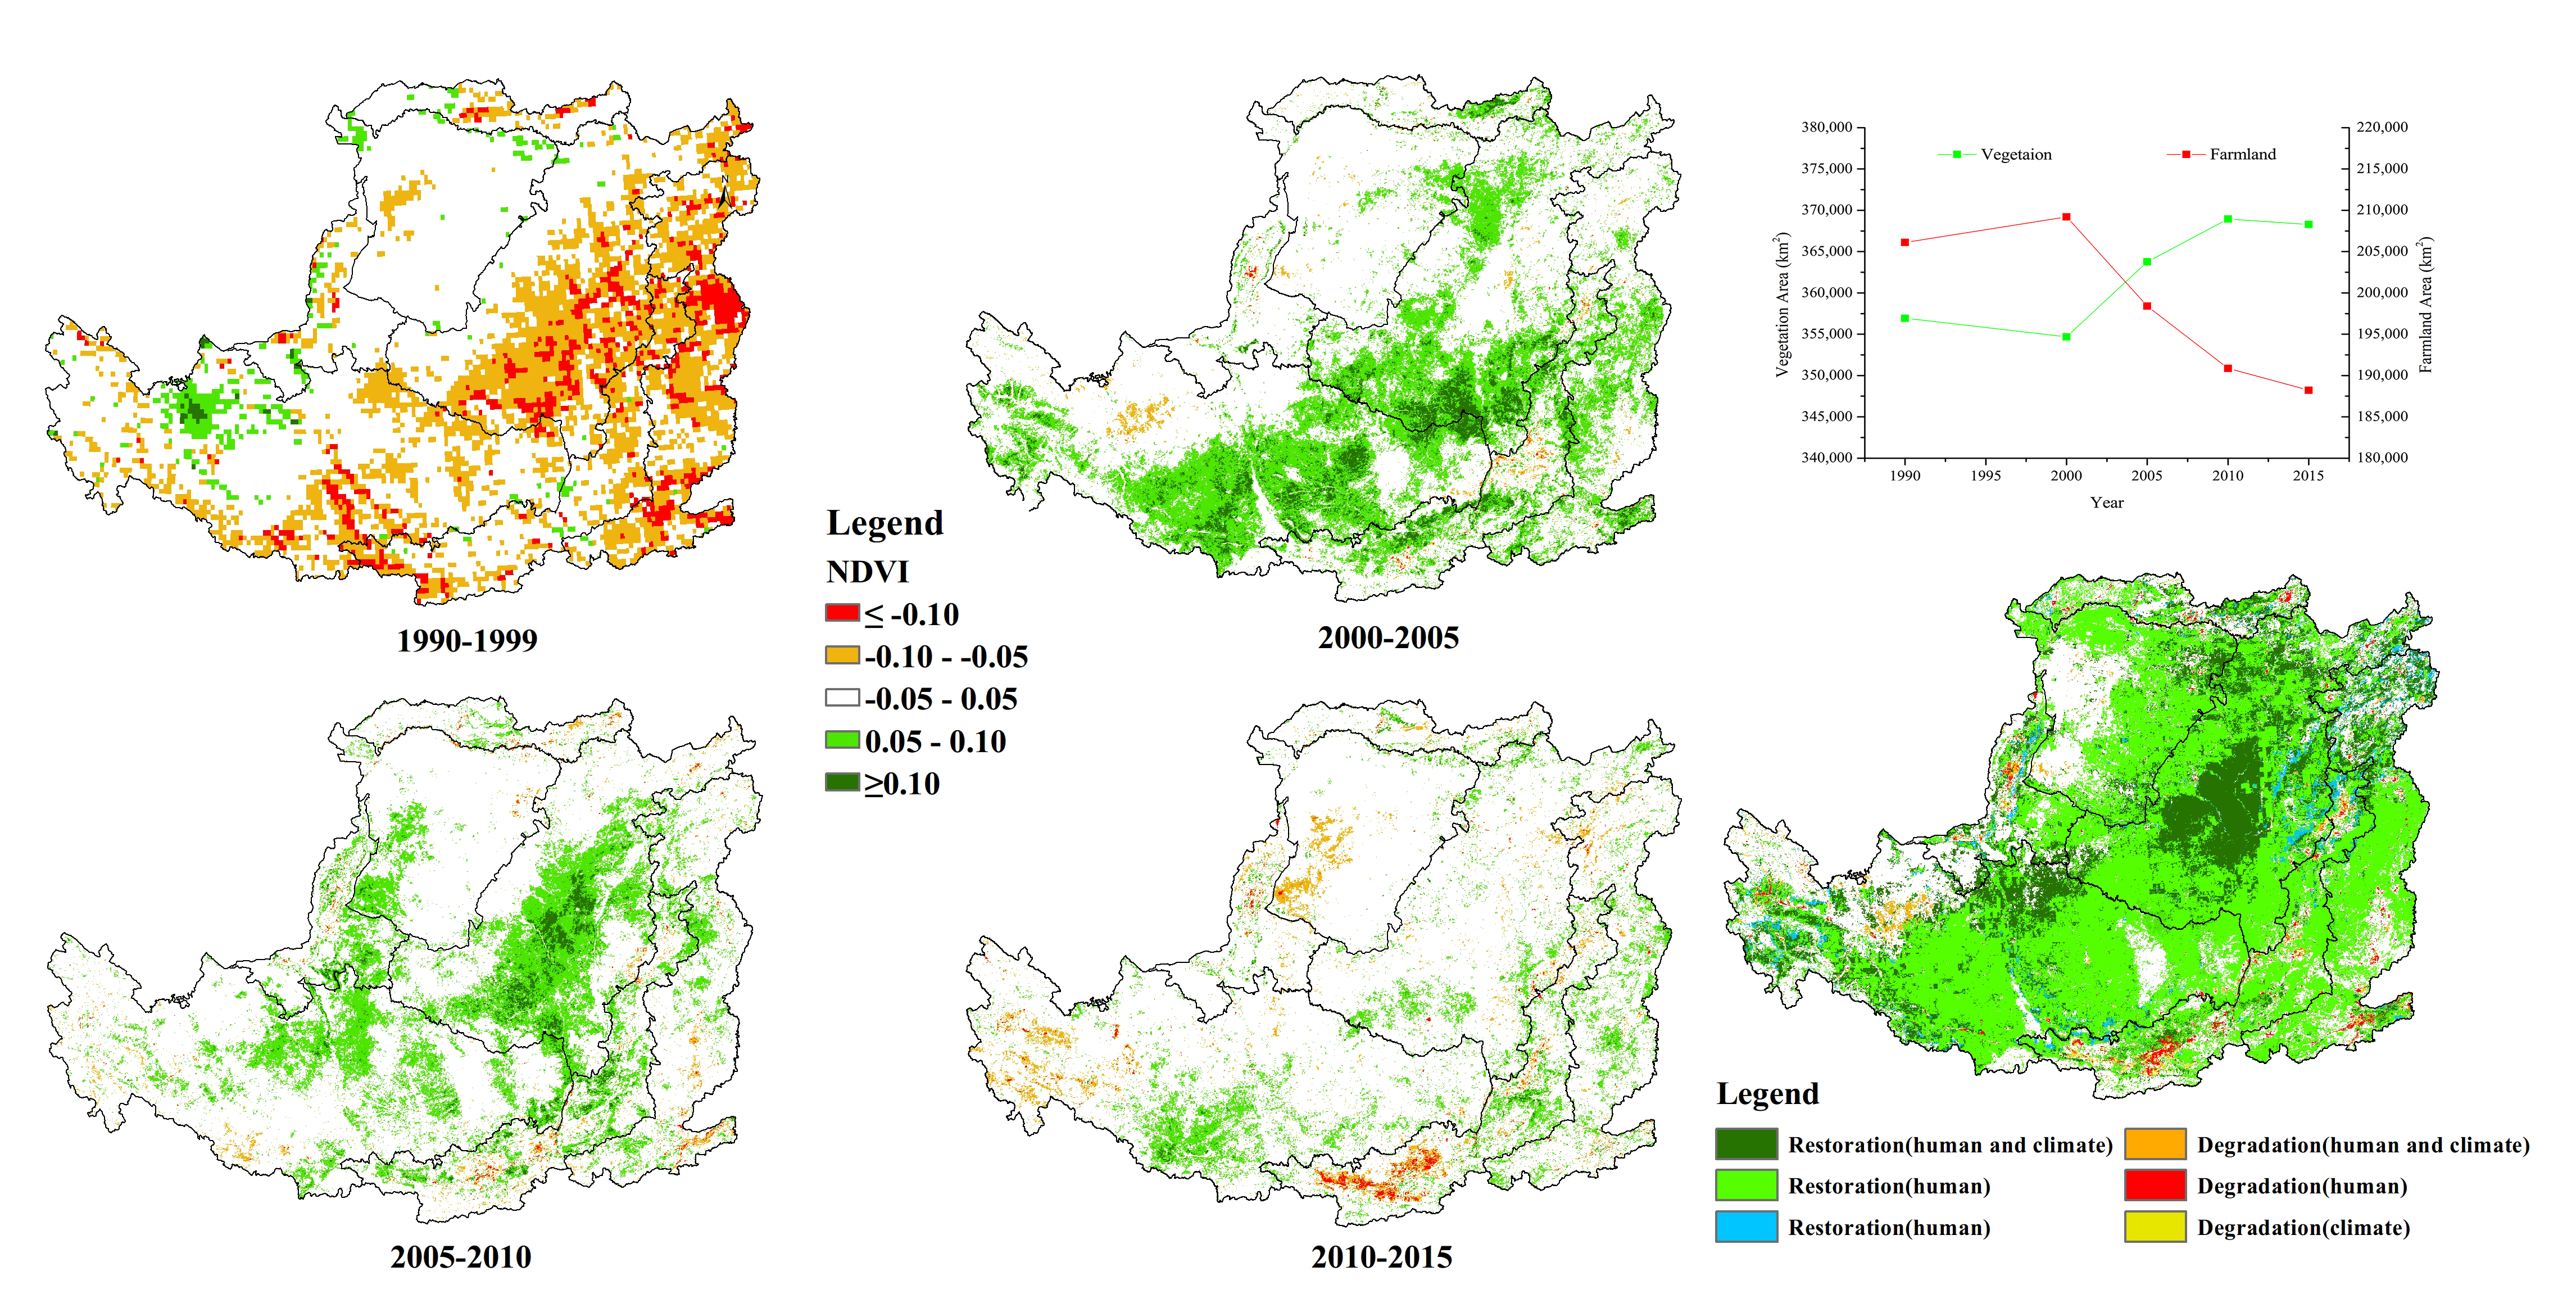
2. Study Area
3. Materials and Methods
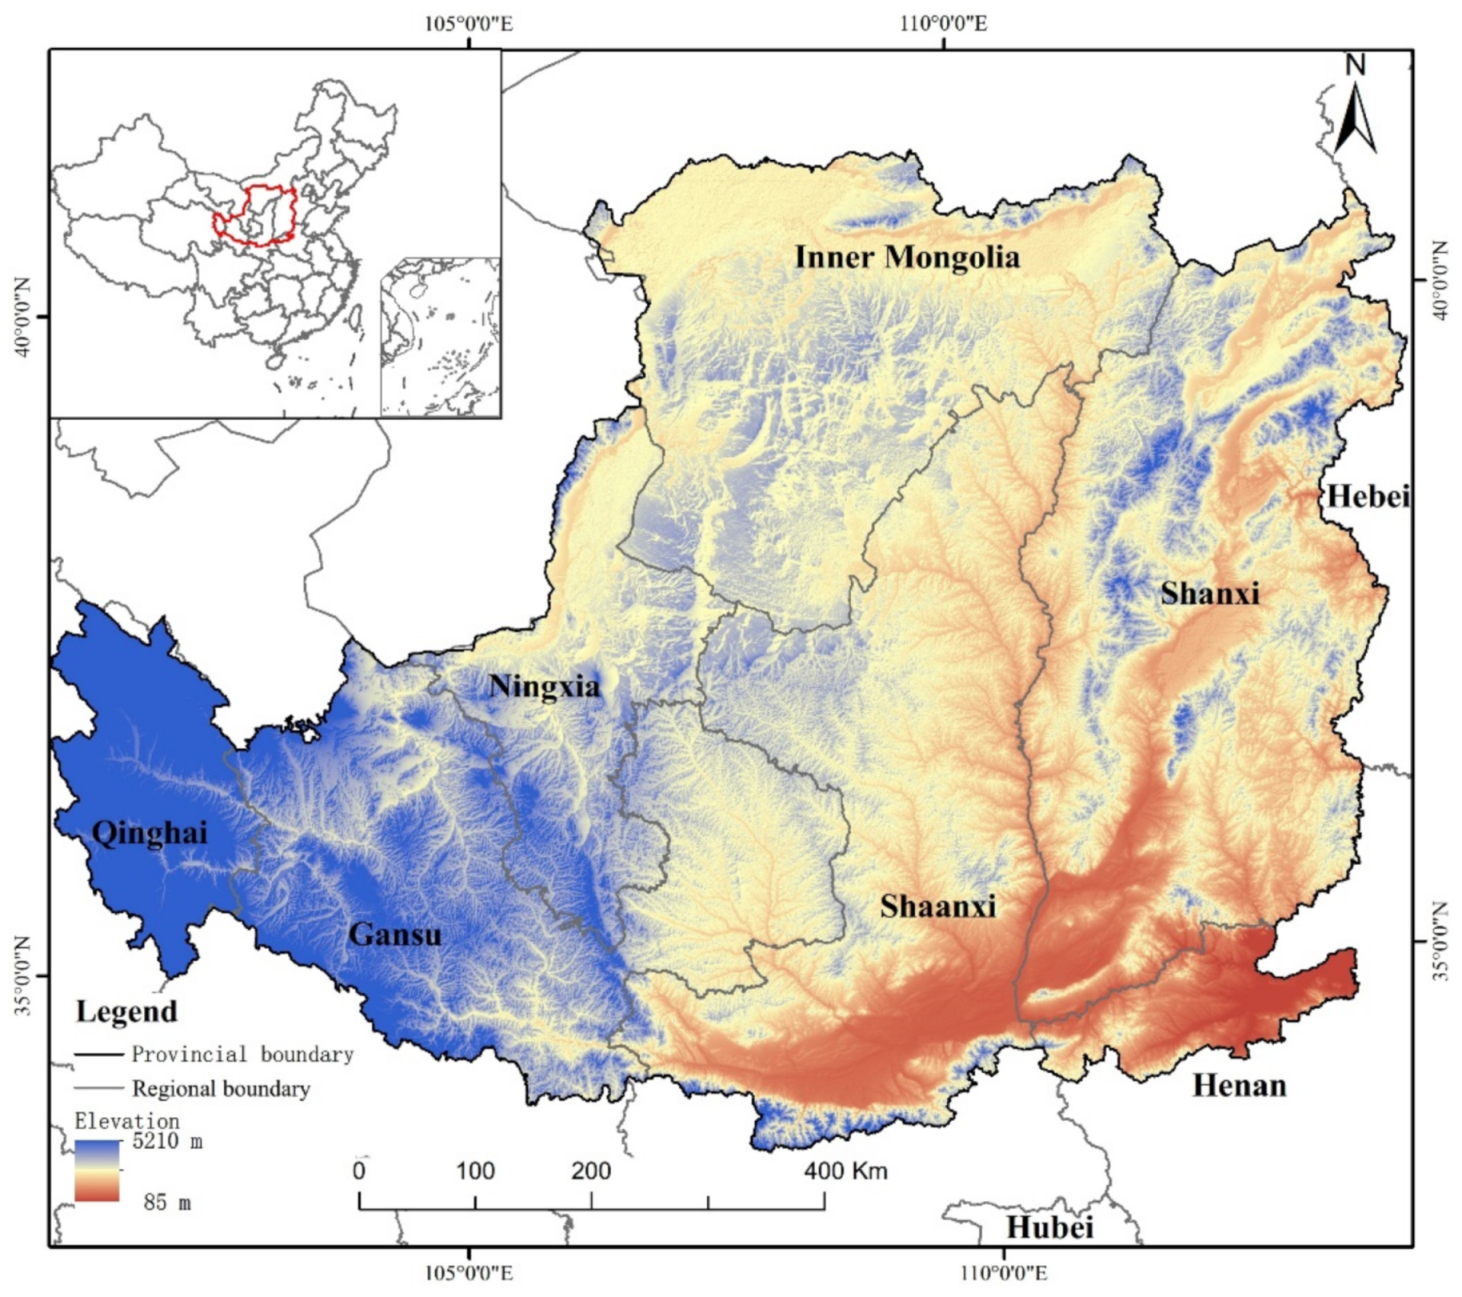
3.1. Ecosystem Classification
3.2. NDVI Data Sources and Preprocessing
3.3. Meteorological Data Sources and Preprocessing
3.4. Specific Research Methods
3.4.1. Net Change Rate and Transfer Matrix of Ecosystem Type
3.4.2. Mean and Difference of the NDVI
3.4.3. Linear Regression Method
3.4.4. Multiple Regression Analysis
3.4.5. Improved Residual Trend Analysis
4. Results
4.1. Ecosystem Changes Before and After the Implementation of Ecological Projects
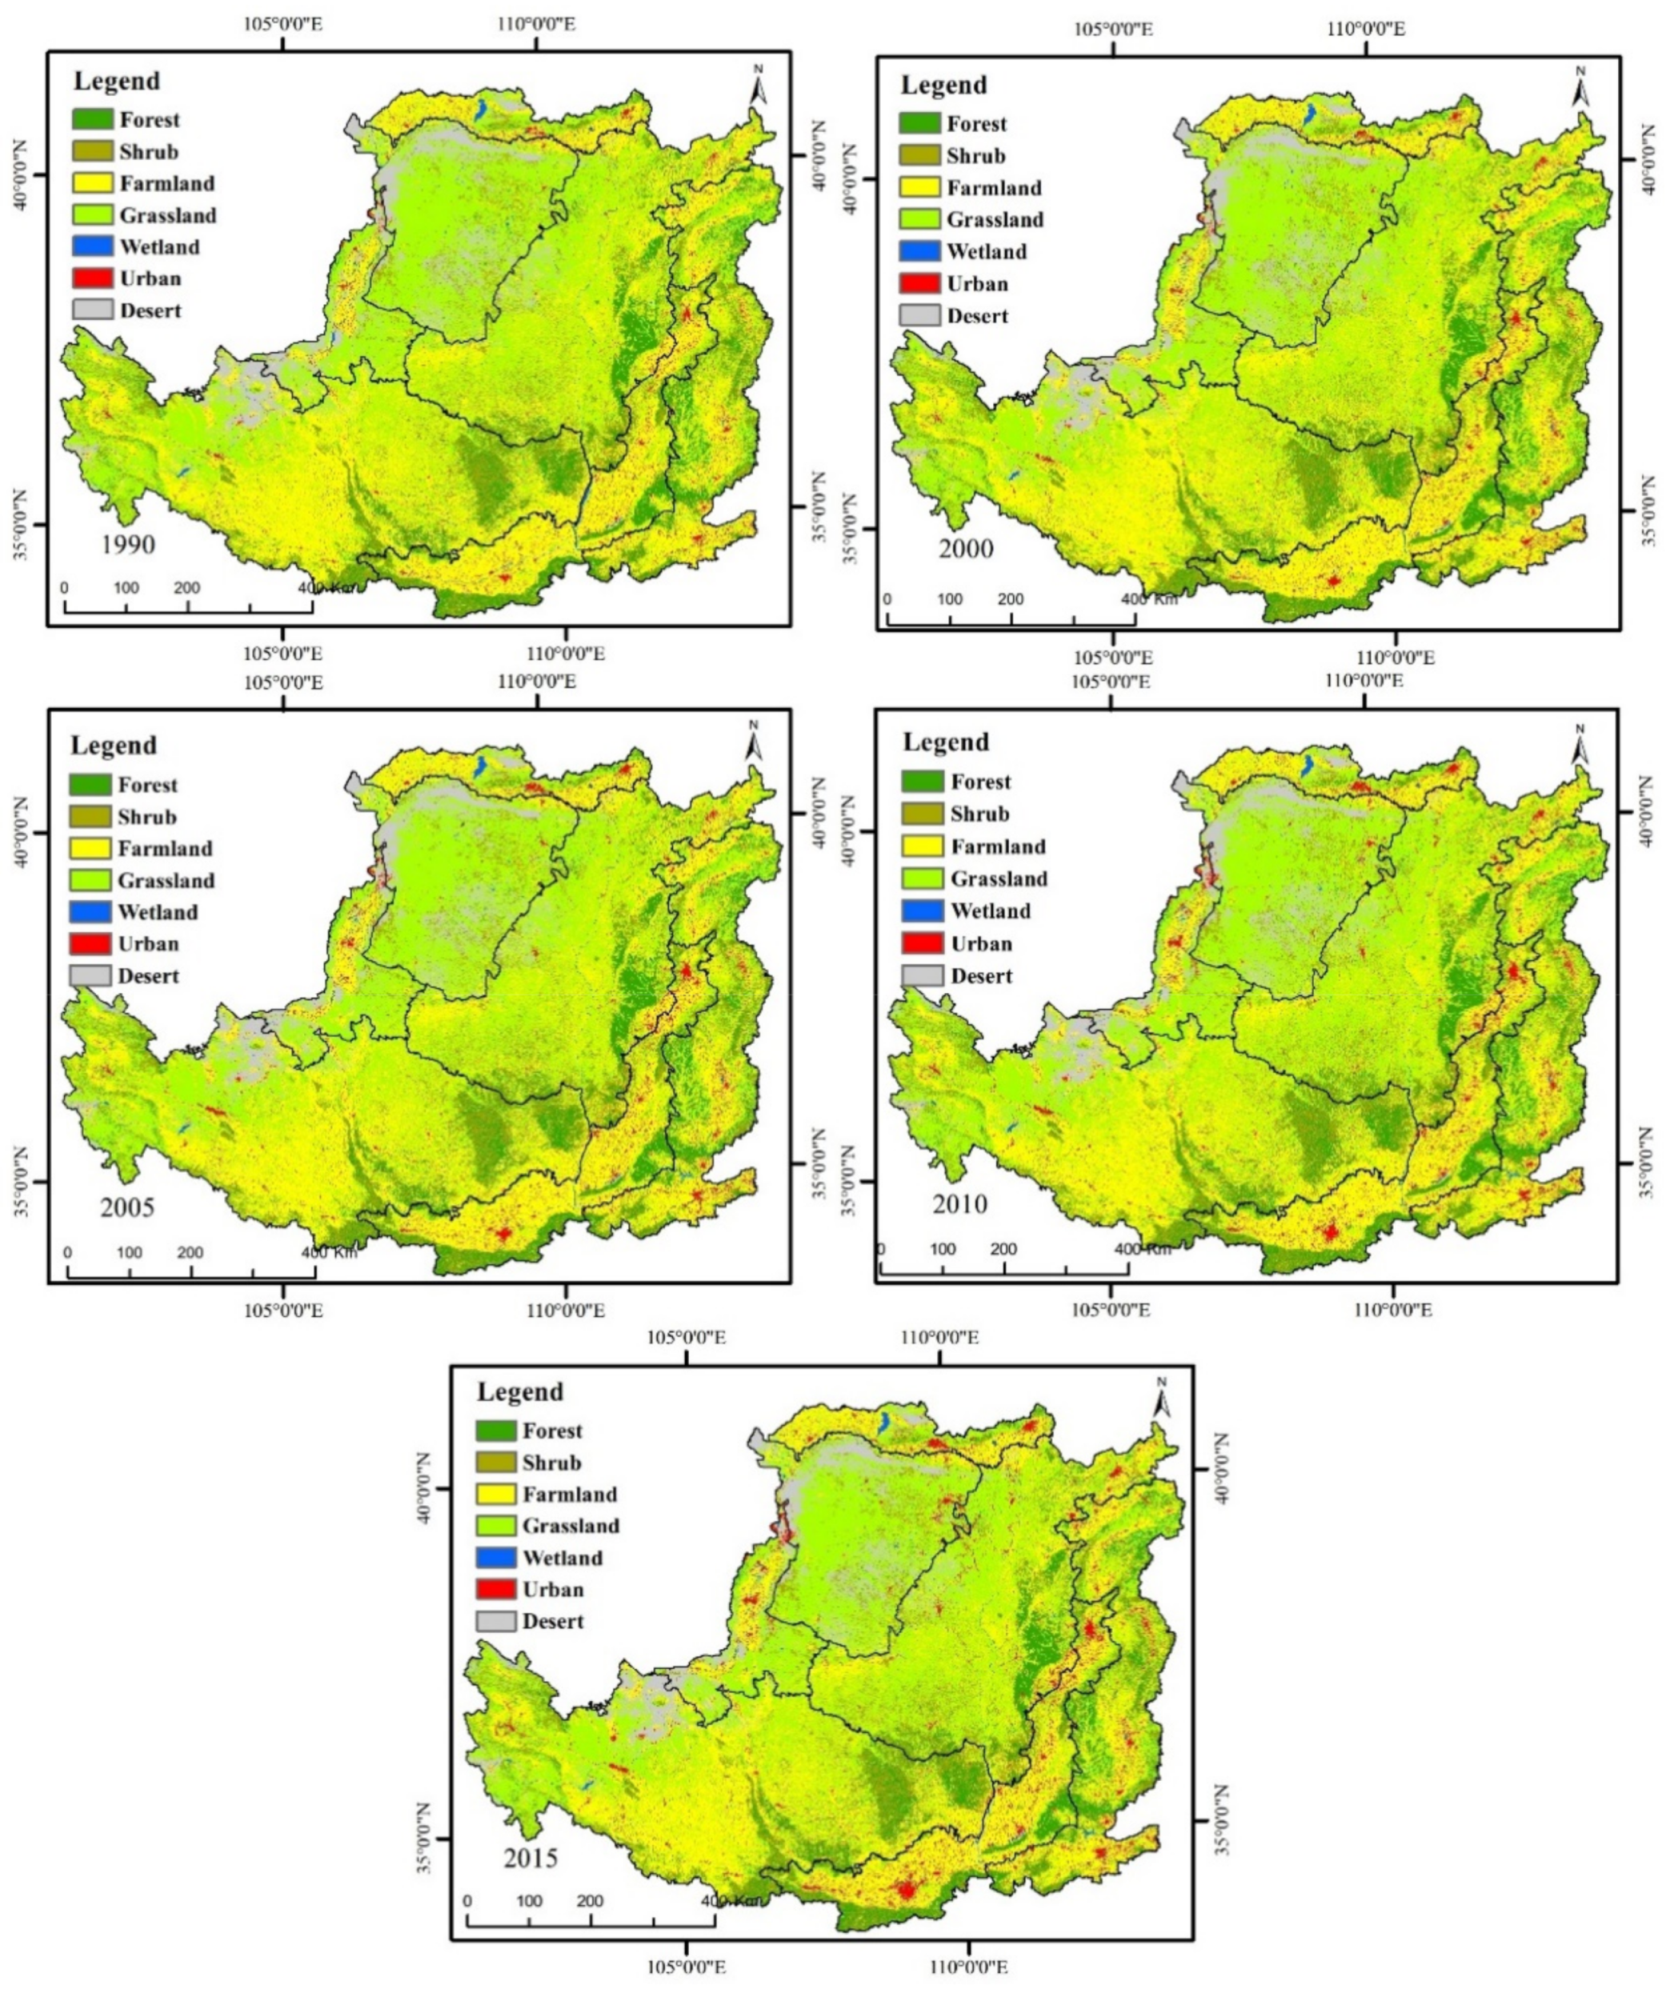
4.1.1. Overall Change in Ecosystem Pattern from 1990 to 2015
4.1.2. Changes in Ecosystems Before and After the Implementation of Ecological Engineering
4.2. Spatiotemporal Variation in Vegetation Quality
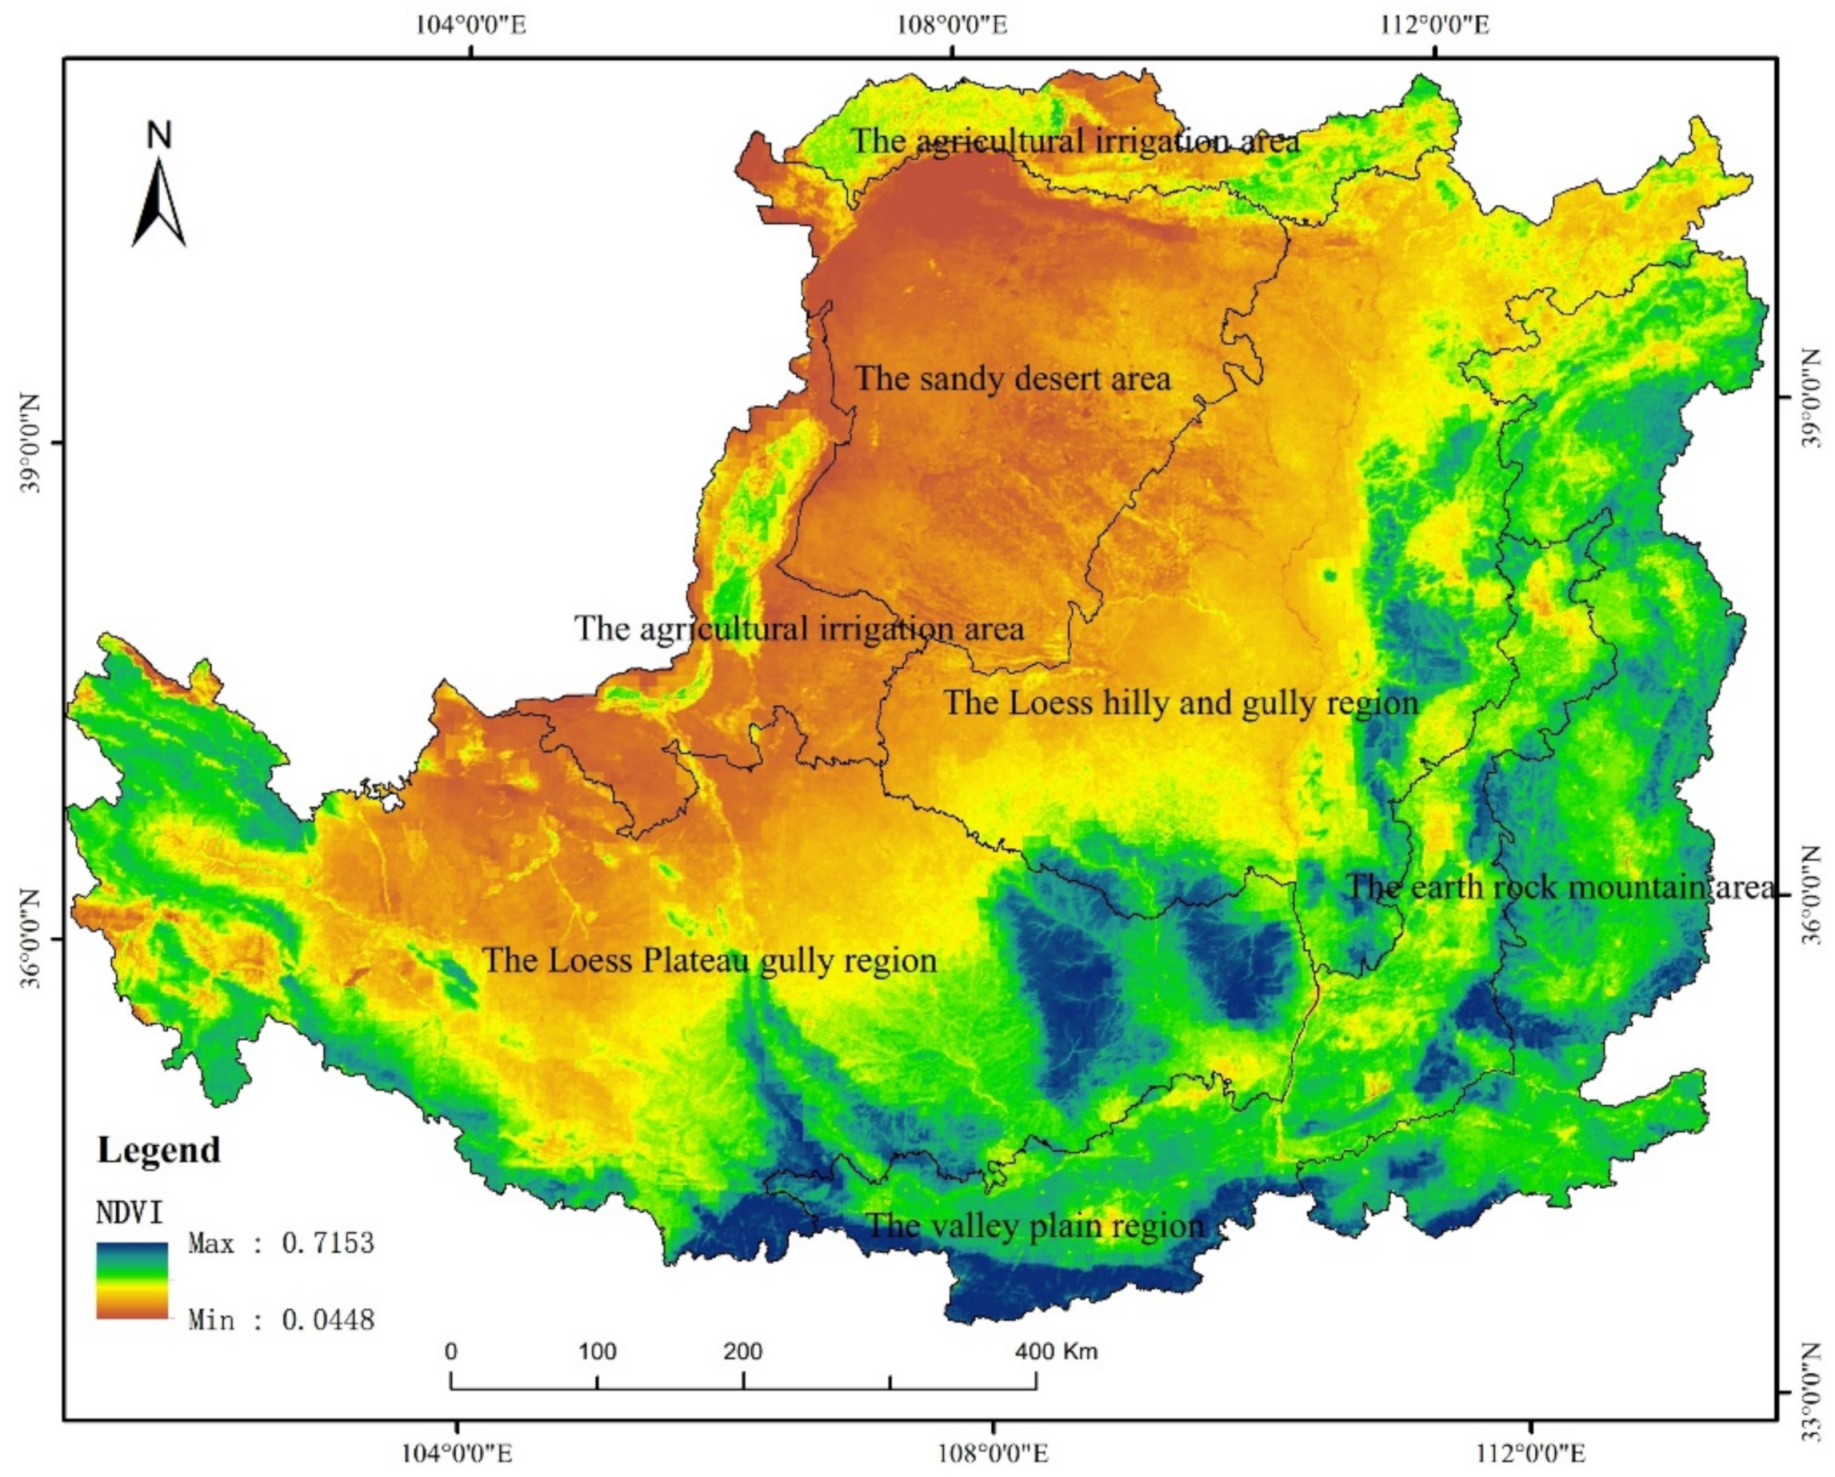
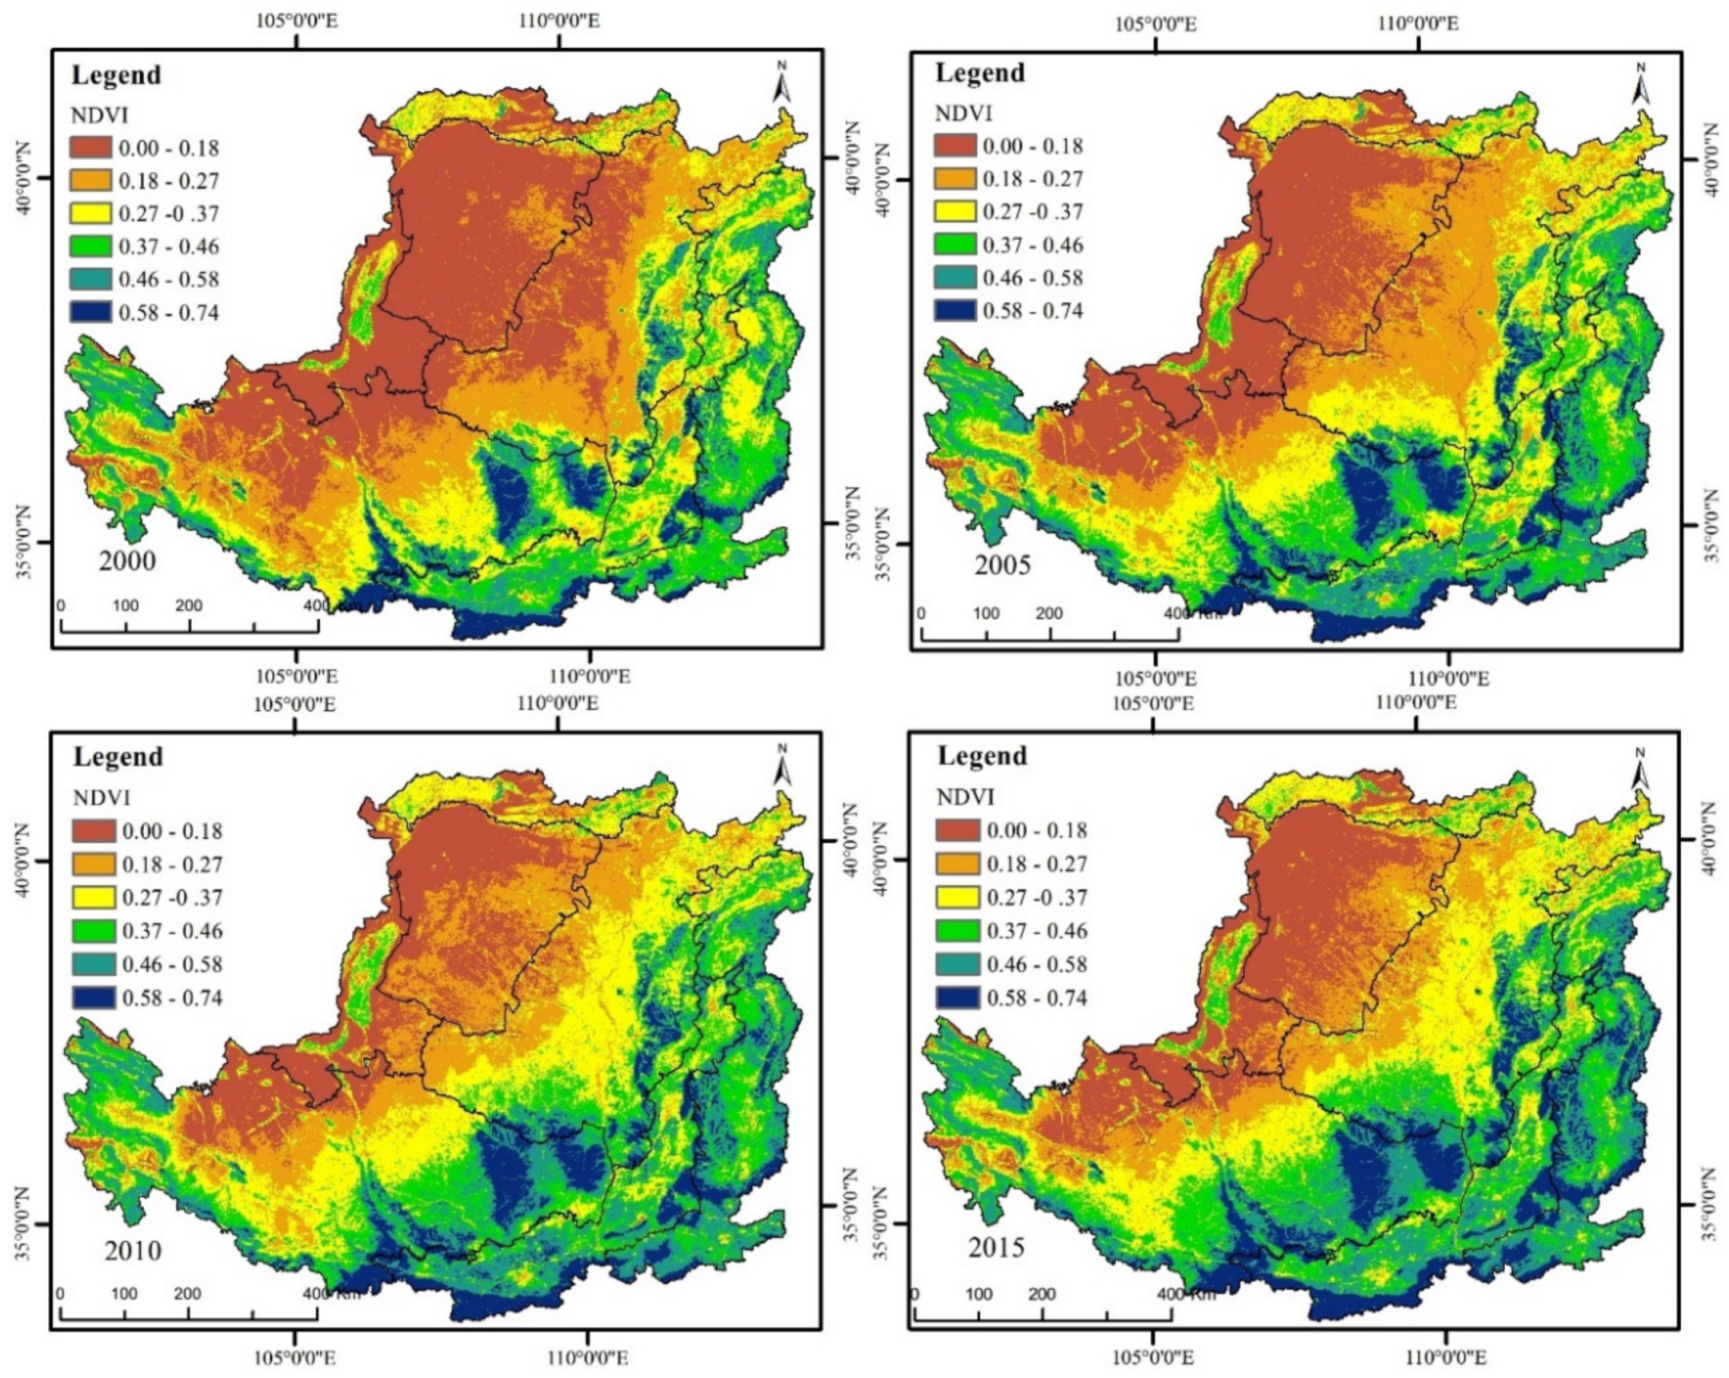
4.2.1. Distribution Characteristics of the NDVI
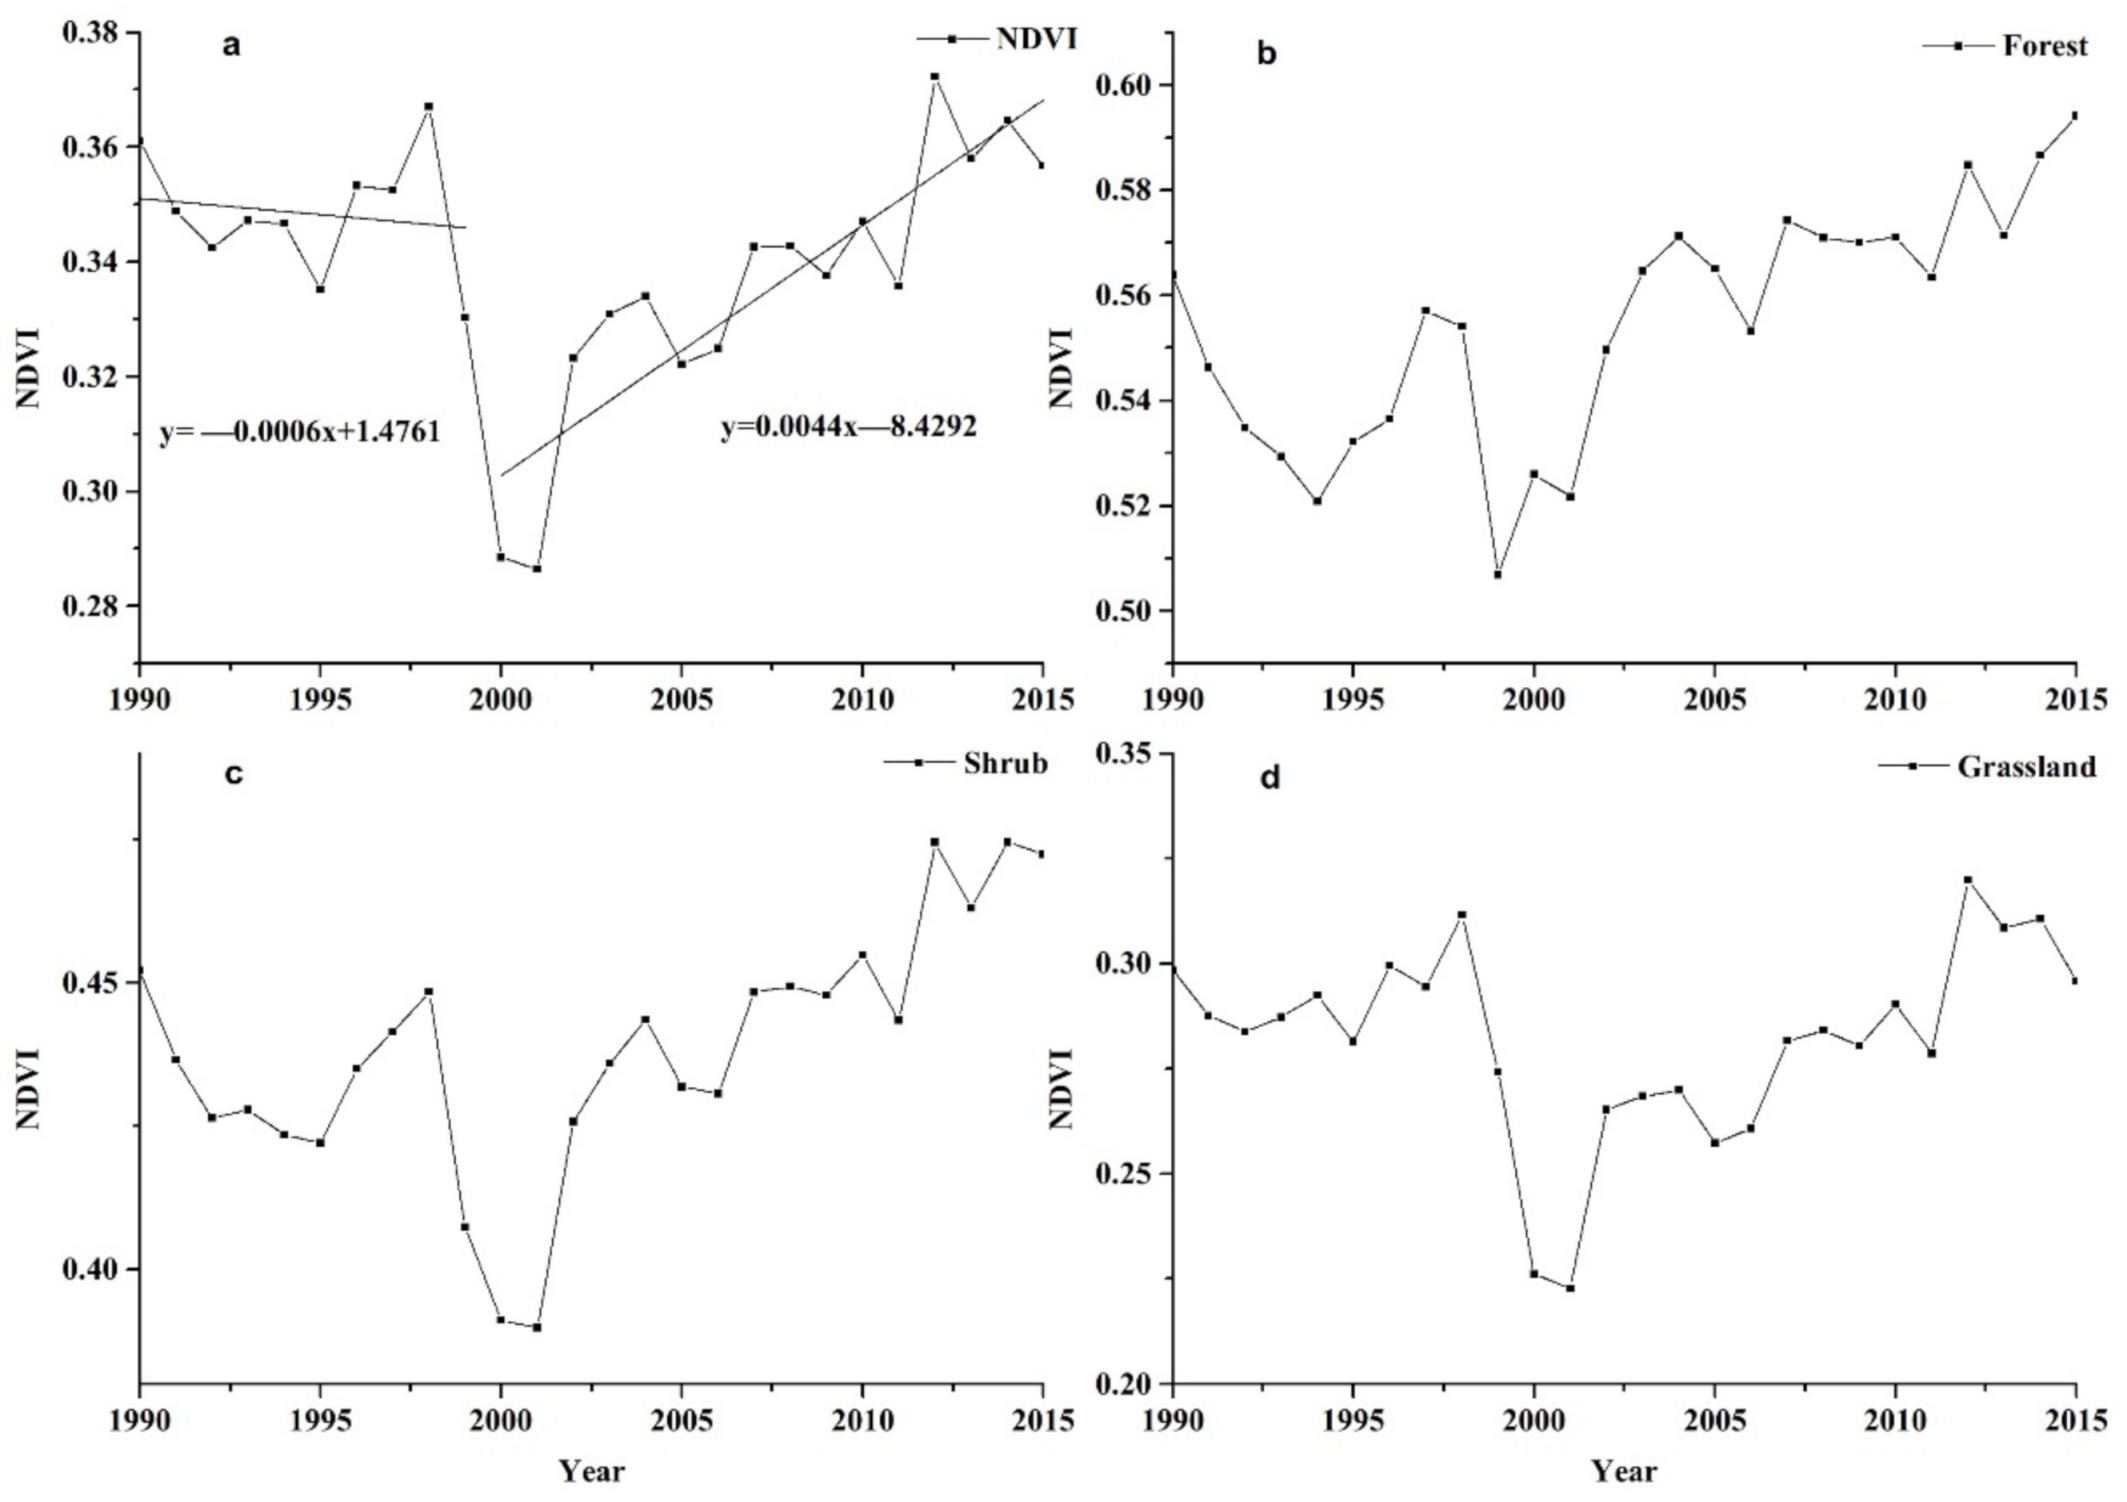
4.2.2. Interannual Variation in the NDVI
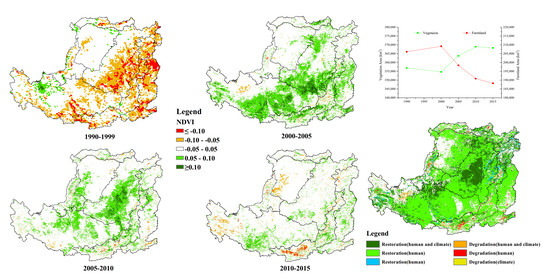
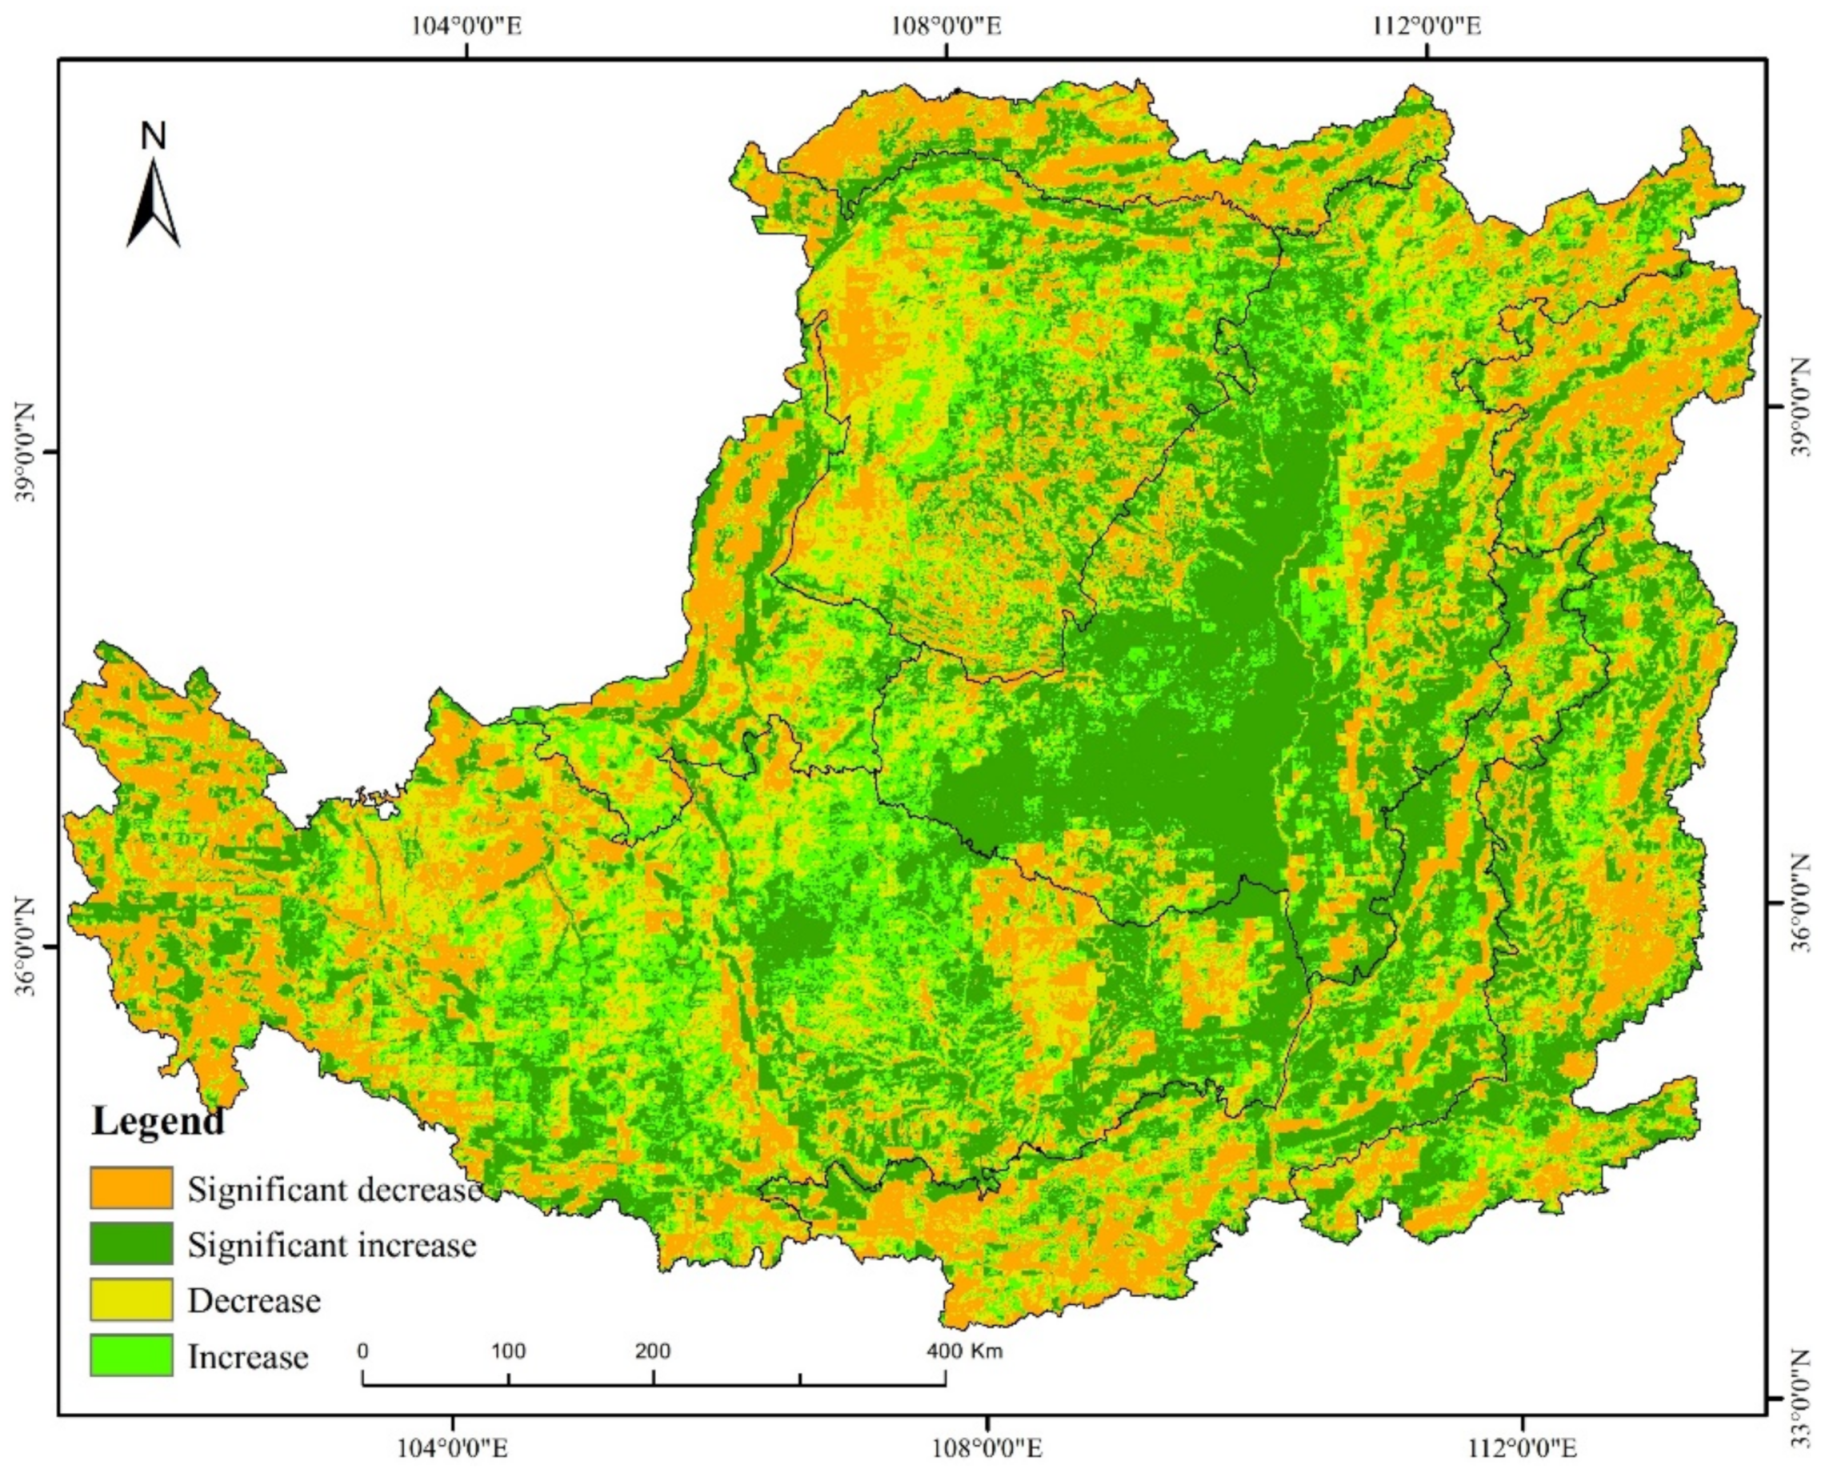
4.2.3. Spatial Variation in the NDVI
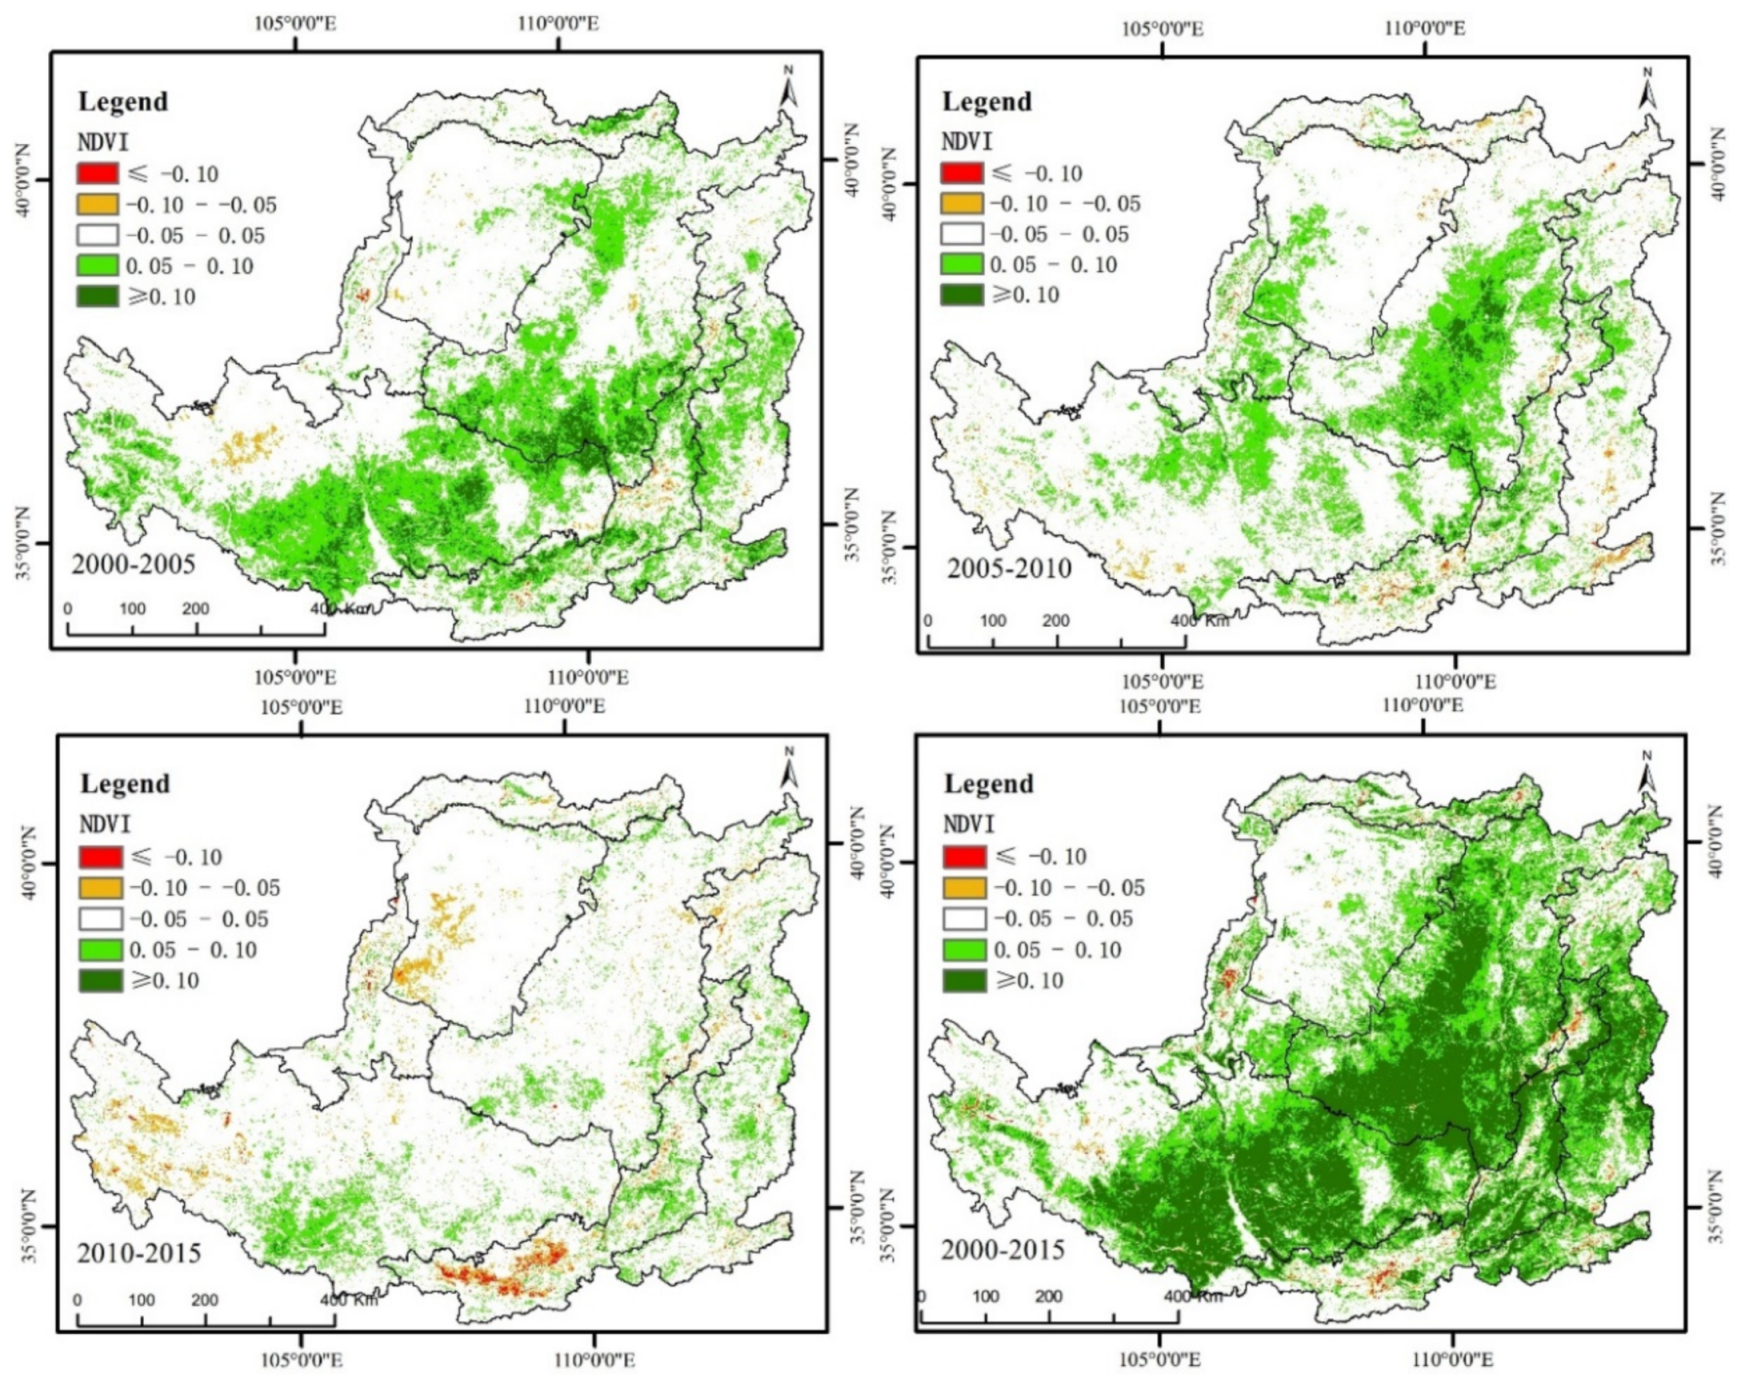
4.2.4. Changes in the NDVI in Different Periods of Ecological-Engineering Implementation
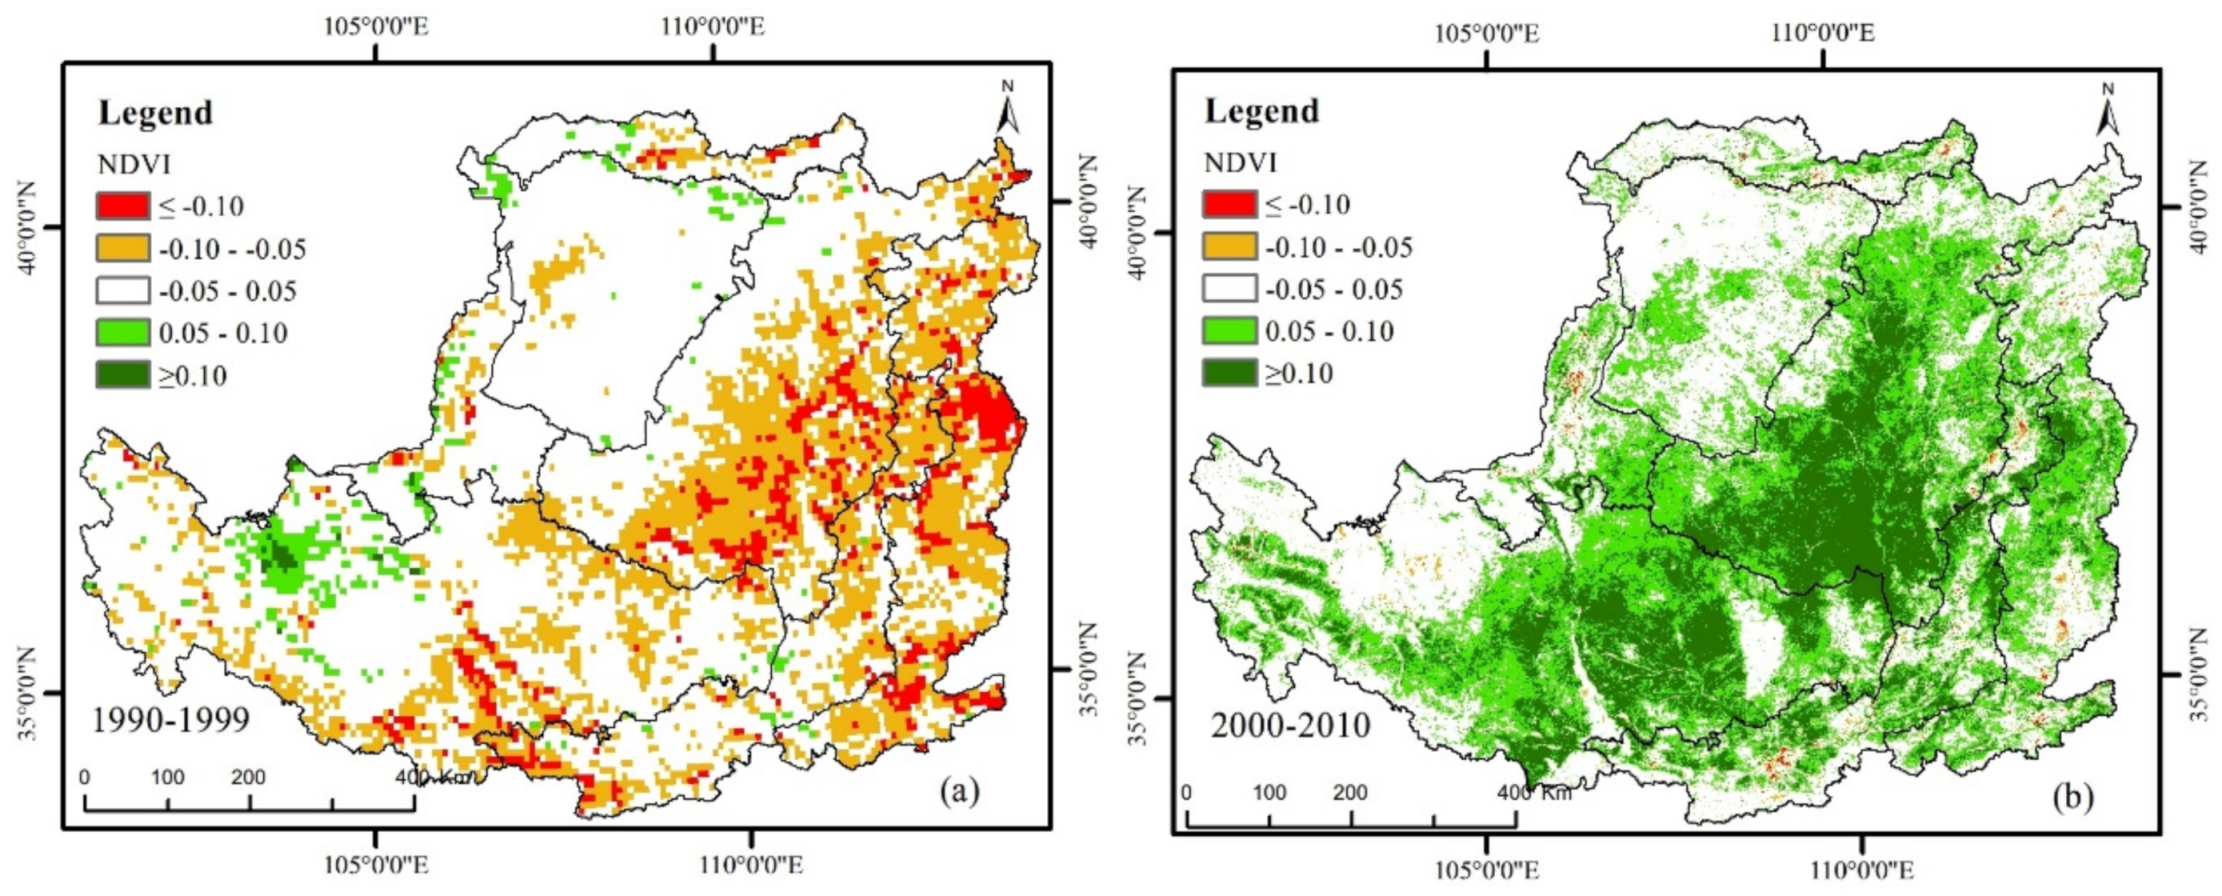
4.2.5. Comparison of the NDVI Changes Before and After the Implementation of Ecological Engineering
4.3. Determination of Influencing Factors of Vegetation Quality Change
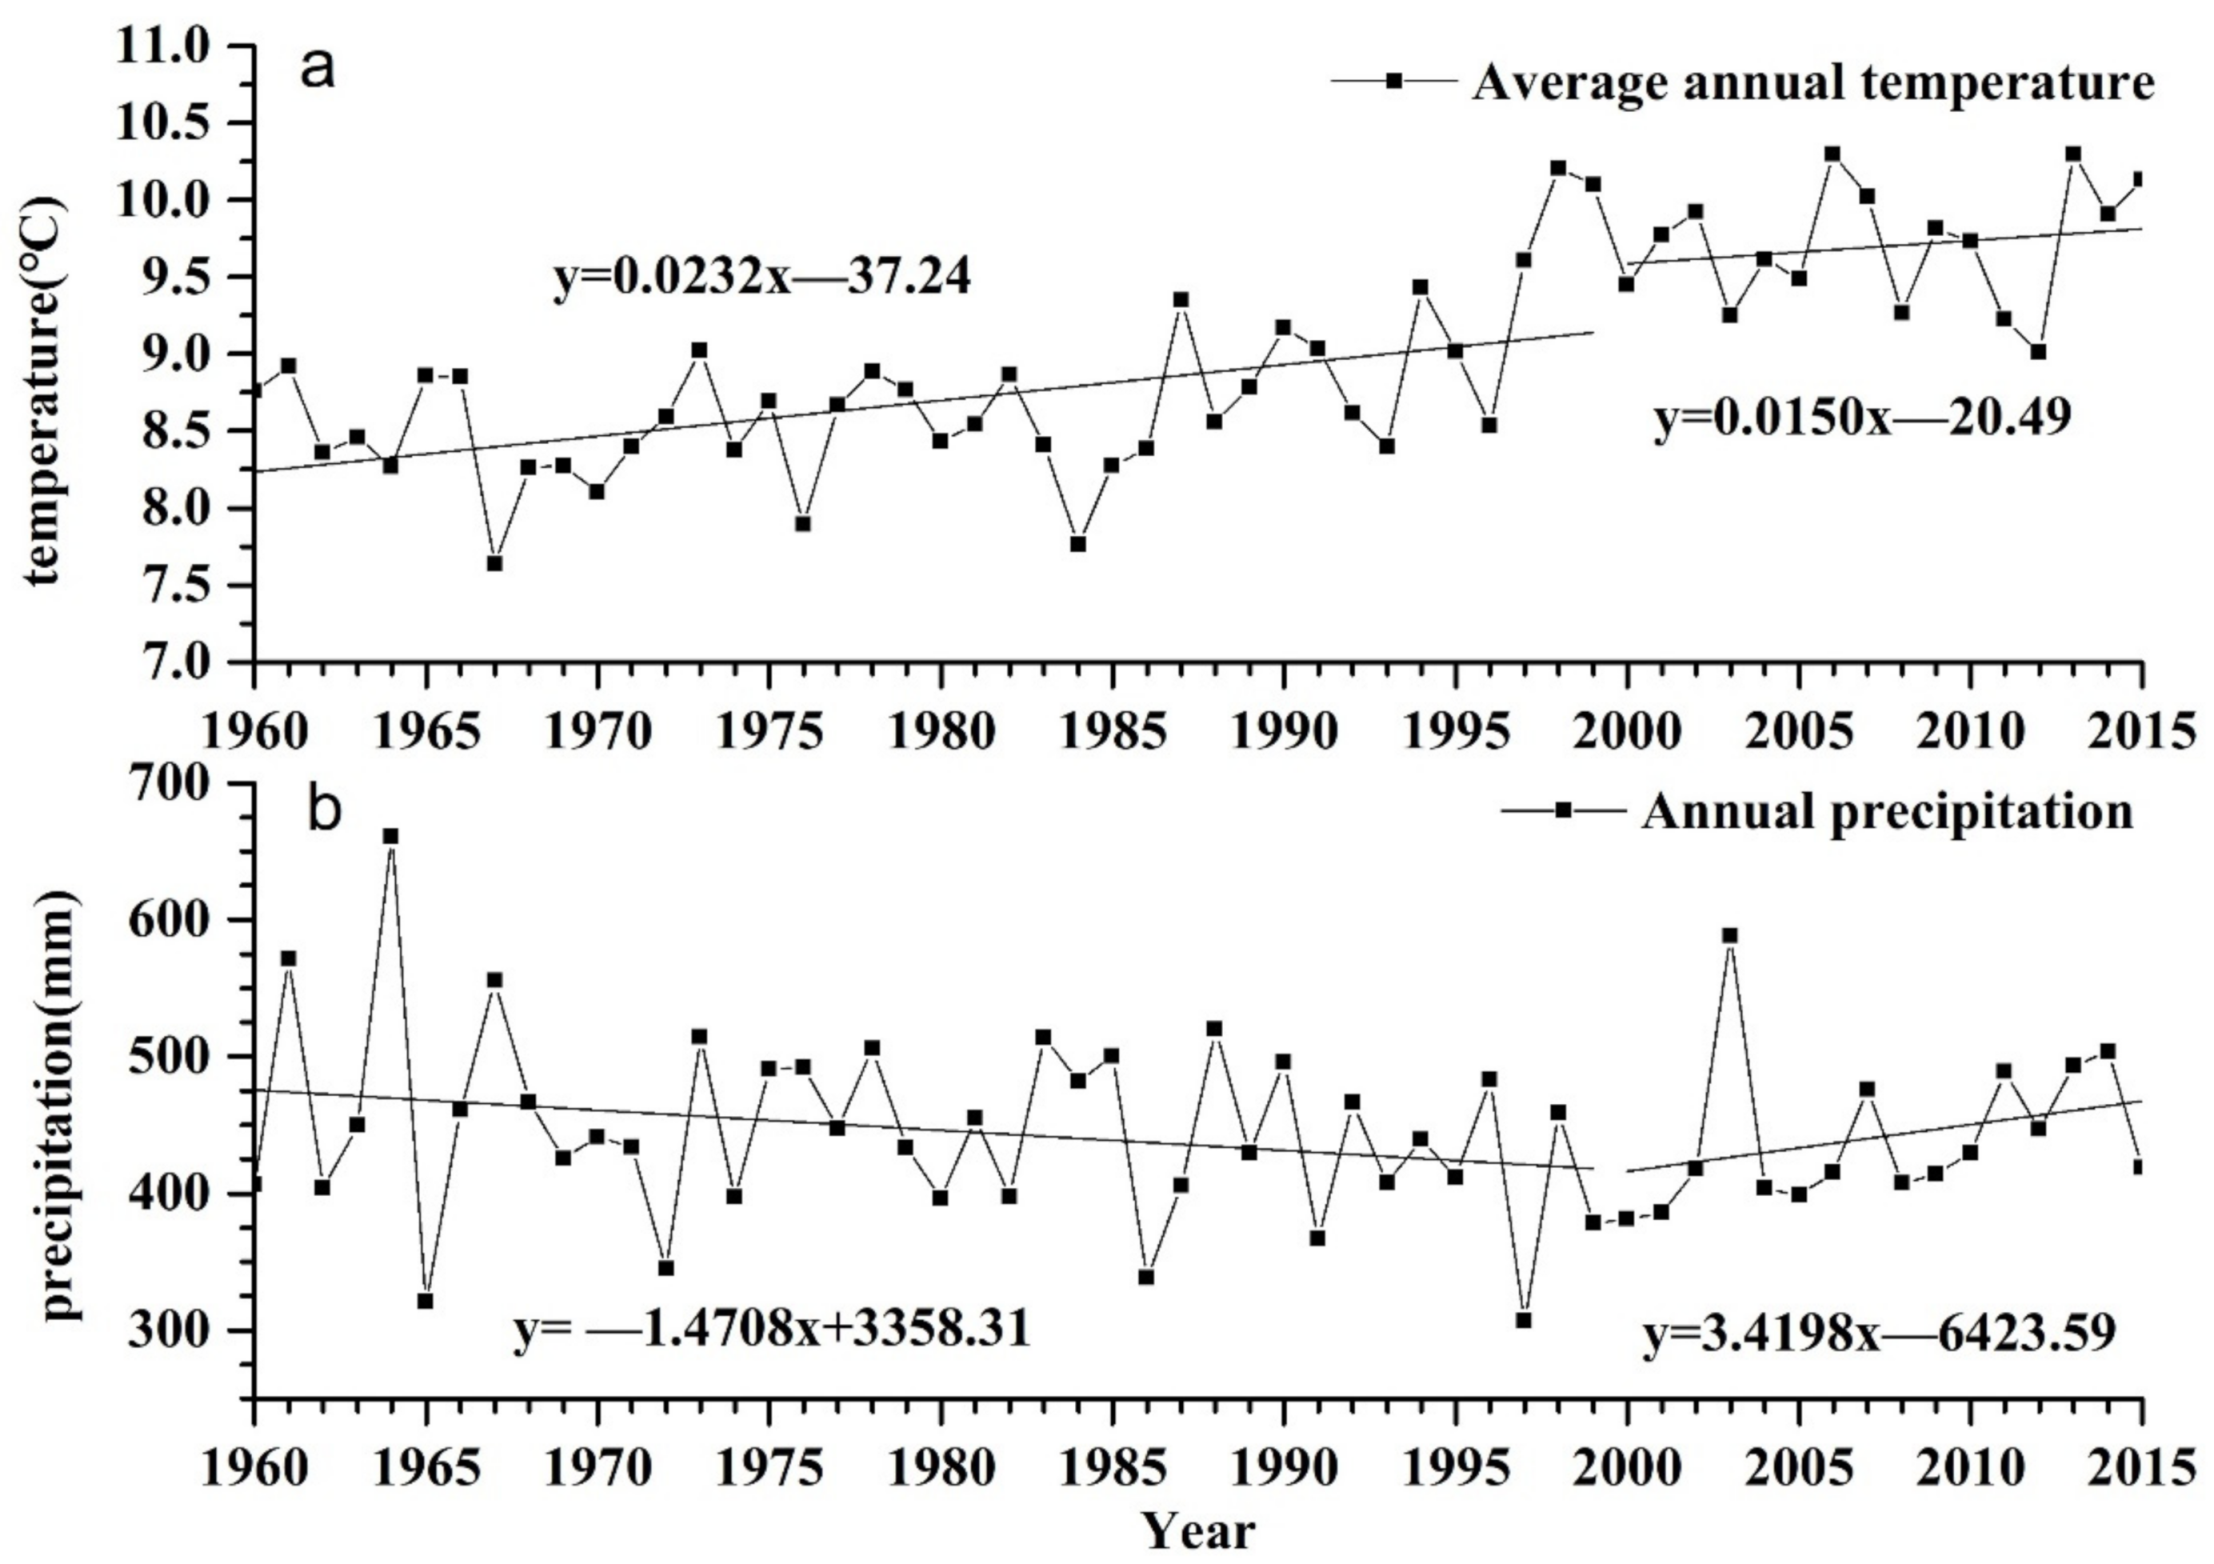
4.3.1. Changes in Temperature and Precipitation on the Loess Plateau from 1960 to 2015
4.3.2. Identification of Dominant Factors of Vegetation Quality Change from 1990 to 2015
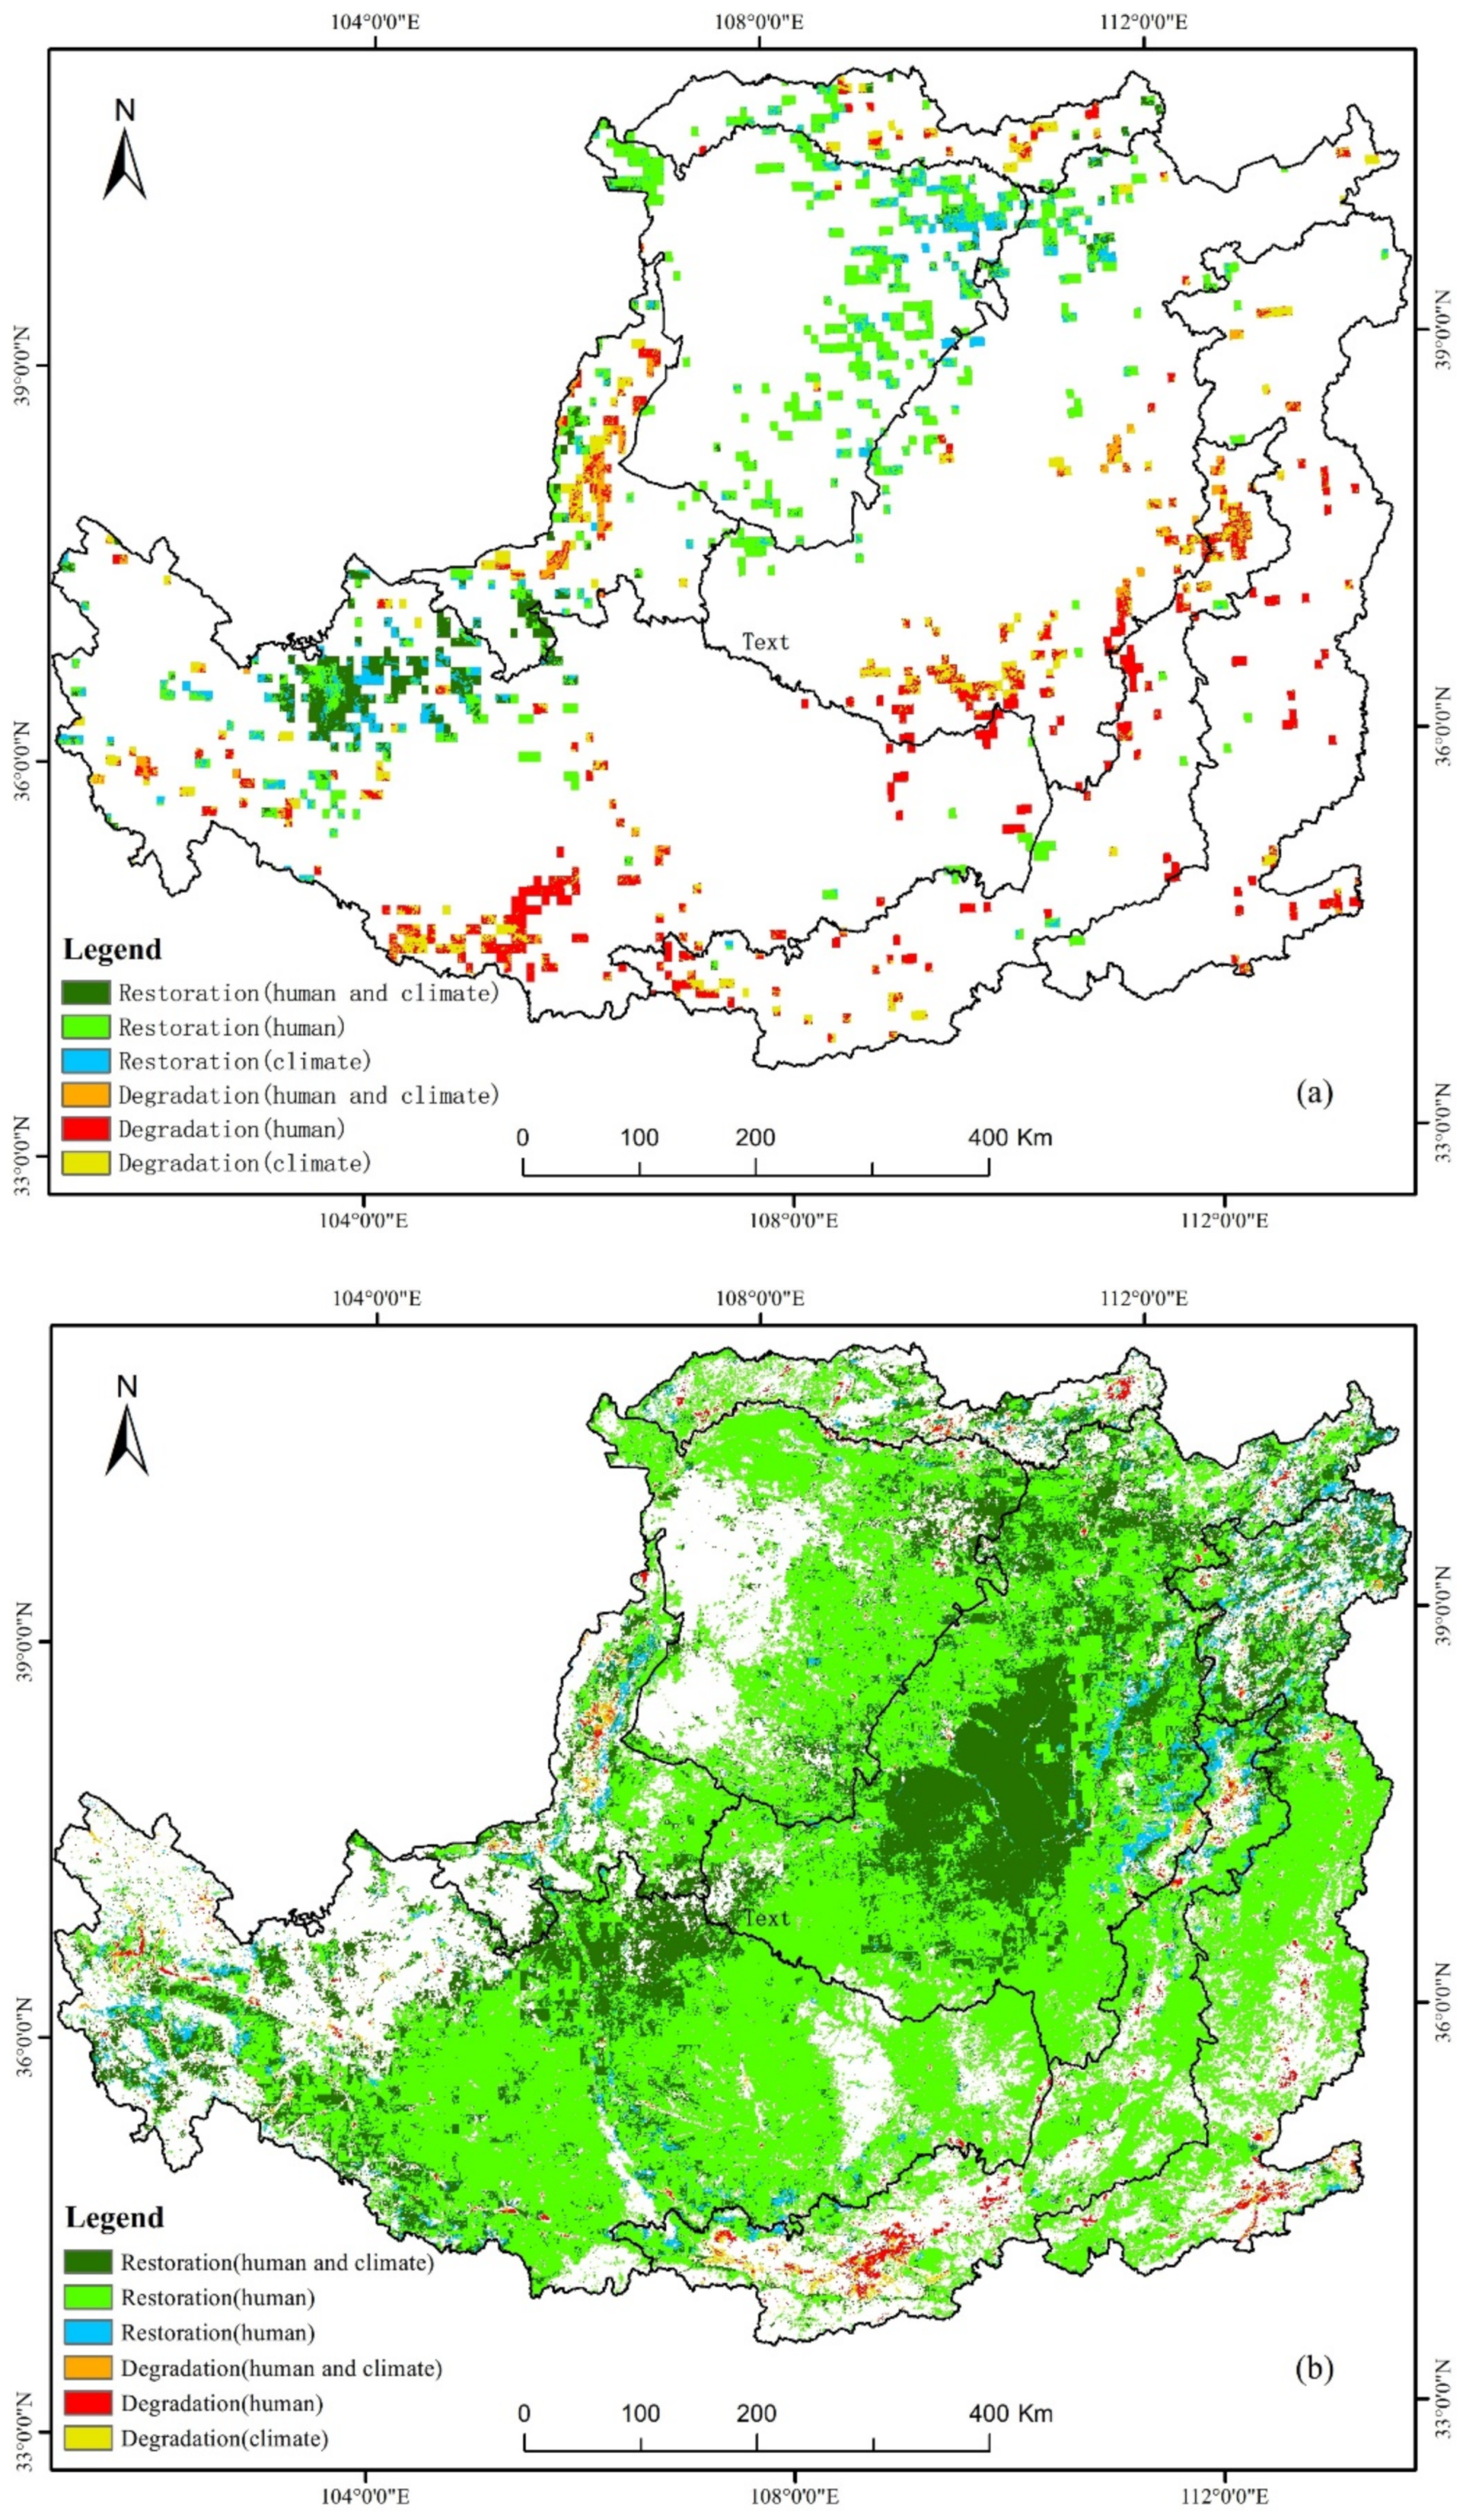
4.3.3. Identification of Dominant Factors of Vegetation Quality Change Before and After the Implementation of Ecological Engineering
5. Discussion
6. Conclusions
Author Contributions
Funding
Data Availability Statement
Conflicts of Interest
Abbreviations
| TNSDP | “Three-North” Shelterbelt Development Program |
| GFGP | Grain for Green Program |
| NFCP | Natural Forests Conservation Program |
| BSSCP | Beijing-Tianjin Sand Source Control Program |
| NDVI | Normalized Difference Vegetation Index |
| GIMMS | Global Inventory Modeling and Mapping Studies |
| GSFC | Goddard Space Flight Center |
| MVC | Maximum Value Composite |
| EVI | Enhanced Vegetation Index |
| IDW | Inverse Distance Weighting |
References
- Jiang, C.; Wang, F.; Zhang, H.; Dong, X. Quantifying changes in multiple ecosystem services during 2000–2012 on the Loess Plateau, China, as a result of climate variability and ecological restoration. Ecol. Eng. 2016, 97, 258–271. [Google Scholar] [CrossRef]
- Yin, R.; Yin, G. China’s Primary Programs of Terrestrial Ecosystem Restoration: Initiation, Implementation, and Challenges. Environ. Manag. 2010, 45, 429–441. [Google Scholar] [CrossRef] [PubMed]
- Li, M.; Liu, A.; Zou, C.; Xu, W.; Shimizu, H.; Wang, K. An overview of the “Three-North” Shelterbelt project in China. For. Stud. China 2012, 14, 70–79. [Google Scholar] [CrossRef]
- Yan, Q.L.; Zhu, J.J.; Hu, Z.B.; Sun, O.J. Environmental impacts of the shelter forests in Horqin Sandy land, northeast china. J. Environ. Qual. 1991, 40, 815–824. [Google Scholar] [CrossRef] [PubMed]
- Zheng, X.; Zhu, J. A new climatic classification of afforestation in Three-North regions of China with multi-source remote sensing data. Theor. Appl. Climatol. 2017, 127, 465–480. [Google Scholar] [CrossRef]
- Jia, X.; Fu, B.; Feng, X.; Hou, G.; Liu, Y.; Wang, X. The tradeoff and synergy between ecosystem services in the Grain-for-Green areas in Northern Shaanxi, China. Ecol. Indic. 2014, 43, 103–111. [Google Scholar] [CrossRef]
- Liu, D.; Chen, Y.; Cai, W.; Dong, W.; Xiao, J.; Chen, J.; Zhang, H.; Xia, J.; Yuan, W. The contribution of China’s Grain to Green Program to carbon sequestration. Landsc. Ecol. 2014, 29, 1675–1688. [Google Scholar] [CrossRef]
- Wu, S.; Li, J.; Zhou, W.; Joseph, B.; Yu, D.; Zhou, L.; Jiang, L.; Dai, L. A statistical analysis of spatiotemporal variations and determinant factors of forest carbon storage under China’s Natural Forest Protection Program. J. For. Res. 2017, 29, 415–424. [Google Scholar] [CrossRef]
- Wu, Z.; Wu, J.; Liu, J.; He, B.; Lei, T.; Wang, Q. Increasing terrestrial vegetation activity of ecological restoration program in the Beijing-Tianjin Sand Source Region of China. Ecol. Eng. 2013, 52, 37–50. [Google Scholar] [CrossRef]
- Adams, J.E.; Arkin, G.F. A light interception method for measuring row crop ground cover. Soil Sci. Soc. Am. J. 1977, 41, 789–792. [Google Scholar] [CrossRef]
- Joiner, J.; Yoshida, Y.; Anderson, M.; Holmes, T.; Hain, C.; Reichle, R.; Koster, R.; Middleton, E.; Zeng, F.W. Global relationships among traditional reflectance vegetation indices (NDVI and NDII), evapotranspiration (ET), and soil moisture variability on weekly timescales. Remote Sens. Environ. 2018, 219, 339–352. [Google Scholar] [CrossRef]
- Zoungrana, B.J.B.; Conrad, C.; Thiel, M.; Amekudzi, L.K.; Da, E.D. MODIS NDVI trends and fractional land cover change for improved assessments of vegetation degradation in Burkina Faso, West Africa. J. Arid Environ. 2018, 153, 66–75. [Google Scholar] [CrossRef]
- Meroni, M.; Fasbender, D.; Rembold, F.; Atzberger, C.; Klisch, A. Near real-time vegetation anomaly detection with MODIS NDVI: Timeliness vs. accuracy and effect of anomaly computation options. Remote Sens. Environ. 2019, 221, 508–521. [Google Scholar] [CrossRef]
- Zhou, Z.C.; Shangguan, Z.P.; Zhao, D. Modeling vegetation coverage and soil erosion in the Loess Plateau Area of China. Ecol. Modell. 2006, 198, 263–268. [Google Scholar] [CrossRef]
- Zhou, Y.; Fu, D.; Lu, C.; Xu, X.; Tang, Q. Positive effects of ecological restoration policies on the vegetation dynamics in a typical ecologically vulnerable area of China. Ecol. Eng. 2021, 159, 106087. [Google Scholar] [CrossRef]
- Qiao, Y.; Jiang, Y.; Zhang, C. Contribution of karst ecological restoration engineering to vegetation greening in southwest China during recent decade. Ecol. Indic. 2021, 121, 107081. [Google Scholar] [CrossRef]
- Li, Q.; Shi, X.; Wu, Q. Exploring suitable topographical factor conditions for vegetation growth in Wanhuigou catchment on the Loess Plateau, China: A new perspective for ecological protection and restoration. Ecol. Eng. 2020, 158, 106053. [Google Scholar] [CrossRef]
- Monroe, A.P.; Aldridge, C.L.; O’Donnell, M.S.; Manier, D.J.; Homer, C.G.; Anderson, P.J. Using remote sensing products to predict recovery of vegetation across space and time following energy development. Ecol. Indic. 2020, 110, 105872. [Google Scholar] [CrossRef]
- Hou, X.; Wu, T.; Yu, L.; Qian, S. Characteristics of multi-temporal scale variation of vegetation coverage in the Circum Bohai Bay Region, 1999–2009. Acta Ecol. Sin. 2012, 32, 297–304. [Google Scholar] [CrossRef]
- Carlson, T.N.; Ripley, D.A. On the relation between NDVI, fractional vegetation cover, and leaf area index. Remote Sens. Environ. 1997, 62, 241–252. [Google Scholar] [CrossRef]
- Ji, L.; Peters, A.J. A spatial regression procedure for evaluating the relationship between AVHRR-NDVI and climate in the northern Great Plains. Int. J. Remote Sens. 2004, 25, 297–311. [Google Scholar] [CrossRef]
- Maneja, R.H.; Miller, J.D.; Li, W.; El-Askary, H.; Flandez, A.V.B.; Dagoy, J.J.; Alcaria, J.F.A.; Basali, A.U.; Al-Abdulkader, K.A.; Loughland, R.A.; et al. Long-term NDVI and recent vegetation cover profiles of major offshore island nesting sites of sea turtles in Saudi waters of the northern Arabian Gulf. Ecol. Indic. 2020, 117, 106612. [Google Scholar] [CrossRef]
- Zhumanova, M.; Mönnig, C.; Hergarten, C.; Darr, D.; Wrage-Mönnig, N. Assessment of vegetation degradation in mountainous pastures of the Western Tien-Shan, Kyrgyzstan, using eMODIS NDVI. Ecol. Indic. 2018, 95, 527–543. [Google Scholar] [CrossRef]
- Zhou, H.; Van Rompaey, A.; Wang, J. Detecting the impact of the “Grain for Green” program on the mean annual vegetation cover in the Shaanxi province, China using SPOT-VGT NDVI data. Land Use Policy 2009, 26, 954–960. [Google Scholar] [CrossRef]
- Liu, Z.; Wang, J.; Wang, X.; Wang, Y. Understanding the impacts of ‘Grain for Green’ land management practice on land greening dynamics over the Loess Plateau of China. Land Use Policy 2020, 99, 105084. [Google Scholar] [CrossRef]
- Zhang, Y.; Peng, C.; Li, W.; Tian, L.; Zhu, Q.; Chen, H.; Fang, X.; Zhang, G.; Liu, G.; Mu, X.; et al. Multiple afforestation programs accelerate the greenness in the “Three North” region of China from 1982 to 2013. Ecol. Indic. 2015, 61, 404–412. [Google Scholar] [CrossRef]
- He, P.; Xu, L.; Liu, Z.; Jing, Y.; Zhu, W. Regional sustainability dynamics of NDVI and its in fluencing factors in the Chinese Loess Plateau during 2002–2018. Reg. Sustain. 2021, 2, 36–46. [Google Scholar] [CrossRef]
- Ye, L.; Fang, L.; Shi, Z.; Deng, L.; Tan, W. Spatio-temporal dynamics of soil moisture driven by ‘Grain for Green’ program on the Loess Plateau, China. Agric. Ecosyst. Environ. 2019, 269, 204–214. [Google Scholar] [CrossRef]
- Liu, G.; Shangguan, Z.; Yao, W.; Yang, Q.; Zhao, M. Ecological Effects of Soil Conservation in Loess Plateau. Bull. Chin. Acad. Sci. 2017, 32, 11–19. [Google Scholar] [CrossRef]
- Wen, Z.; Wu, S.; Chen, J.; Lü, M. NDVI indicated long-term interannual changes in vegetation activities and their responses to climatic and anthropogenic factors in the Three Gorges Reservoir Region, China. Sci. Total Environ. 2017, 574, 947–959. [Google Scholar] [CrossRef]
- Kong, D.; Miao, C.; Wu, J.; Zheng, H.; Wu, S. Time lag of vegetation growth on the Loess Plateau in response to climate factors: Estimation, distribution, and influence. Sci. Total Environ. 2020, 744, 140726. [Google Scholar] [CrossRef] [PubMed]
- Sun, W.; Song, X.; Mu, X.; Gao, P.; Wang, F.; Zhao, G. Spatiotemporal vegetation cover variations associated with climate change and ecological restoration in the Loess Plateau. Agric. For. Meteorol. 2015, 209–210, 87–99. [Google Scholar] [CrossRef]
- Li, S.; Yan, J.; Wan, J. The Spatial-temporal Changes of Vegetation Restoration on Loess Plateau in Shaanxi-Gansu-Ningxia Region. Acta Geogr. Sin. 2012, 67, 960–970. [Google Scholar]
- Evans, J.; Geerken, R. Discrimination between climate and human-induced dryland degradation. J. Arid Environ. 2004, 57, 535–554. [Google Scholar] [CrossRef]
- Wessels, K.J.; Prince, S.D.; Malherbe, J.; Small, J.; Frost, P.E.; VanZyl, D. Can human-induced land degradation be distinguished from the effects of rainfall variability? A case study in South Africa. J. Arid Environ. 2007, 68, 271–297. [Google Scholar] [CrossRef]
- Omuto, C.T.; Vargas, R.R.; Alim, M.S.; Paron, P. Mixed-effects modelling of time series NDVI-rainfall relationship for detecting human-induced loss of vegetation cover in drylands. J. Arid Environ. 2010, 74, 1552–1563. [Google Scholar] [CrossRef]
- Voltersen, M.; Berger, C.; Hese, S.; Schmullius, C. Remote Sensing of Environment Object-based land cover mapping and comprehensive feature calculation for an automated derivation of urban structure types at block level. Remote Sens. Environ. 2014, 154, 192–201. [Google Scholar] [CrossRef]
- Hulet, A.; Roundy, B.A.; Petersen, S.L.; Jensen, R.R.; Bunting, S.C. An Object-Based Image Analysis of Pinyon and Juniper Woodlands Treated to Reduce Fuels. Environ. Manag. 2014, 53, 660–671. [Google Scholar] [CrossRef]
- Qian, D.; Yan, C.; Xing, Z.; Xiu, L. Monitoring coal mine changes and their impact on landscape patterns in an alpine region: A case study of the Muli coal mine in the Qinghai-Tibet Plateau. Environ. Monit. Assess. 2017, 189, 559. [Google Scholar] [CrossRef]
- Ouyang, Z.; Zheng, H.; Xiao, Y.; Polasky, S.; Liu, J.; Xu, W.; Wang, Q.; Zhang, L.; Rao, E.; Jiang, L.; et al. Improvements in ecosystem services from investments in natural capital. Science 2016, 352, 1455–1459. [Google Scholar] [CrossRef]
- Ouyang, Z.; Wang, Q.; Zheng, H.; Zhang, F.; Hou, P. National Ecosystem Survey and Assessment of China (2000–2010). China Acad. J. 2014, 21, 7–25. [Google Scholar] [CrossRef]
- Wu, B.; Yuan, Q.; Changzhen, Y.; Wang, Z.; Yu, X.; Li, A.; Ma, R.; Huang, J.; Chen, J.; Chang, C.; et al. Land cover changes of China from 2000 to 2010. Quat. Sci. 2014, 34, 723–731. [Google Scholar]
- Holben, B.N. Characteristics of maximum-value composite images from temporal AVHRR data. Int. J. Remote Sens. 1986, 7, 1417–1434. [Google Scholar] [CrossRef]
- Guay, K.C.; Beck, P.; Berner, L.T.; Goetz, S.J.; Baccini, A.; Buermann, W. Vegetation productivity patterns at high northern latitudes: A multi-sensor satellite data assessment. Glob. Chang. Biol. 2014, 20, 3147–3158. [Google Scholar] [CrossRef] [PubMed]
- Xu, Y.; Yang, J.; Chen, Y. NDVI-based vegetation responses to climate change in an arid area of China. Theor. Appl. Climatol. 2016, 126, 213–222. [Google Scholar] [CrossRef]
- Xin, Z.; Xu, J.; Zheng, W. Spatiotemporal variations of vegetation cover on the Chinese Loess Plateau (1981–2006): Impacts of climate changes and human activities. Sci. China Ser. D Earth Sci. 2008, 51, 67–78. [Google Scholar] [CrossRef]
- Mao, D.; Wang, Z.; Luo, L.; Ren, C. Integrating AVHRR and MODIS data to monitor NDVI changes and their relationships with climatic parameters in Northeast China. Int. J. Appl. Earth Obs. Geoinf. 2012, 18, 528–536. [Google Scholar] [CrossRef]
- Hutchinson, M.F.; Xu, T. ANUSPLIN. 2013. Available online: https://fennerschool.anu.edu.au/research/products/anusplin (accessed on 1 April 2021).
- Hutchinson, M.F. Interpolating mean rainfall using thin plate smoothing splines. Int. J. Geogr. Inf. Syst. 1995, 9, 385–403. [Google Scholar] [CrossRef]
- Hijmans, R.J.; Cameron, S.E.; Parra, J.L.; Jones, P.G.; Jarvis, A. Very high resolution interpolated climate surfaces for global land areas. Int. J. Climatol. 2005, 25, 1965–1978. [Google Scholar] [CrossRef]
- Mandal, S.; Srivastav, R.K.; Simonovic, S.P. Use of beta regression for statistical downscaling of precipitation in the Campbell River basin, British Columbia, Canada. J. Hydrol. 2016, 538, 49–62. [Google Scholar] [CrossRef]
- Liu, S.; Kang, W.; Wang, T. Drought variability in Inner Mongolia of northern China during 1960–2013 based on standardized precipitation evapotranspiration index. Environ. Earth Sci. 2016, 75, 1–14. [Google Scholar] [CrossRef]
- Jiang, X.; Liu, X.; Huang, F.; Jiang, H.; Cao, W.; Zhu, Y. Comparison of spatial interpolation methods for daily meteorological elements. Chin. J. Appl. Ecol. 2010, 21, 624–630. [Google Scholar]
- Zhao, J.; Li, C.; Yang, T.; Tang, Y.; Yin, Y.; Luan, X.; Sun, S. Estimation of high spatiotemporal resolution actual evapotranspiration by combining the SWH model with the METRIC model. J. Hydrol. 2020, 586, 124883. [Google Scholar] [CrossRef]
- Guo, B.; Zhang, J.; Meng, X.; Xu, T.; Song, Y. Long-term spatio-temporal precipitation variations in China with precipitation surface interpolated by ANUSPLIN. Sci. Rep. 2020, 10, 1–17. [Google Scholar] [CrossRef] [PubMed]
- Jing, Y.; Zhang, S.; Kuang, W. Study on Land Cover/Land Use Change and Eco-environment Effects of Naiman Banner Since 1976s. J. Arid Land Resour. Environ. 2008, 22, 5–26. [Google Scholar]
- Takada, T.; Miyamoto, A.; Hasegawa, S.F. Derivation of a yearly transition probability matrix for land-use dynamics and its applications. Landsc. Ecol. 2010, 25, 561–572. [Google Scholar] [CrossRef]
- Coppedge, B.R.; Engle, D.M.; Fuhlendorf, S.D. Markov models of land cover dynamics in a southern Great Plains grassland region. Landsc. Ecol. 2007, 22, 1383–1393. [Google Scholar] [CrossRef]
- Stow, D.; Daeschner, S.; Hope, A.; Douglas, D.; Petersen, A.; Myneni, R.; Oechel, W. Variability of the Seasonally Integrated Normalized Difference Vegetation Index Across the North Slope of Alaska in the 1990s. Int. J. Remote Sens. 2003, 24, 1111–1117. [Google Scholar] [CrossRef]
- Zhang, G.; Zhang, Y.; Dong, J.; Xiao, X. Green-up dates in the Tibetan Plateau have continuously advanced from 1982 to 2011. Proc. Natl. Acad. Sci. USA 2013, 110, 4309–4314. [Google Scholar] [CrossRef]
- Liu, Y.; Lei, H. Responses of natural vegetation dynamics to climate drivers in China from 1982 to 2011. Remote Sens. 2015, 7, 10243–10268. [Google Scholar] [CrossRef]
- Sun, Y.; Yang, Y.; Zhang, L.; Wang, Z. The relative roles of climate variations and human activities in vegetation change in North China. Phys. Chem. Earth Parts A/B/C 2015, 87–88, 67–78. [Google Scholar] [CrossRef]
- Cai, H.; Yang, X.; Xu, X. Human-induced grassland degradation/restoration in the central Tibetan Plateau: The effects of ecological protection and restoration projects. Ecol. Eng. 2015, 83, 112–119. [Google Scholar] [CrossRef]
- Tian, H.; Cao, C.; Chen, W.; Bao, S.; Yang, B.; Myneni, R.B. Response of vegetation activity dynamic to climatic change and ecological restoration programs in Inner Mongolia from 2000 to 2012. Ecol. Eng. 2015, 82, 276–289. [Google Scholar] [CrossRef]
- Shugui, Z.; Quanqin, S.; Wei, C. Characteristics of Land Use and Land Cover Change in the Loess Plateau over the Past 20 Years. J. Geo.-Inf. Sci. 2016, 18, 190–199. [Google Scholar] [CrossRef]
- Zhou, D.; Zhao, S.; Zhu, C. The Grain for Green Project induced land cover change in the Loess Plateau: A case study with Ansai County, Shanxi Province, China. Ecol. Indic. 2012, 23, 88–94. [Google Scholar] [CrossRef]
- Zhao, A.; Zhang, A.; Lu, C.; Wang, D.; Wang, H.; Liu, H. Spatiotemporal variation of vegetation coverage before and after implementation of Grain for Green Program in Loess Plateau, China. Ecol. Eng. 2017, 104, 13–22. [Google Scholar] [CrossRef]
- Luo, J.; Yin, S.; Wang, Y. Analysis on dynamic change of land use in Shaanxi Province. J. Inn. Mong. For. Sci. Technol. 2004, 40, 5–9. [Google Scholar]
- Ma, T.; Zhang, X.; Ma, Q.; Lei, Y. Land use/cover changes in Liudaogou catchment in water-wind erosion crisscross region in Loess Plateau during the past 20 years. Sci. Soil Water Conserv. 2012, 10, 9–14. [Google Scholar] [CrossRef]
- Bian, H.; Pang, J.; Ren, Z.; Zhao, Y. Effects of soil erosion on land use and land cover change in southern Loess Plateau. Bull. Soil Water Conserv. 2013, 33, 11–16. [Google Scholar] [CrossRef]
- Fensholt, R.; Rasmussen, K.; Kaspersen, P.; Huber, S.; Horion, S.; Swinnen, E. Assessing land degradation/recovery in the african sahel from long-term earth observation based primary productivity and precipitation relationships. Remote Sens. 2013, 5, 664–686. [Google Scholar] [CrossRef]


| Ecosystem Types | Description |
|---|---|
| Forest | Land mainly covered by arbor plants (height > 5 m) |
| Shrub | Land mainly covered by shrub plants (height < 5 m) |
| Grassland | Land mainly covered by herbaceous plants |
| Farmland | Land mainly covered by crop vegetation |
| Wetland | Natural or artificial marshes and other shallow-water areas with static or flowing water bodies |
| Urban | Artificial surface of human living land |
| Desert | Land distributed in arid and semiarid areas with vegetation coverage of less than 4% |
| Month | N | Parameter Estimation | Regression Results | ||
|---|---|---|---|---|---|
| a | b | r2 | RMSE | ||
| January | 226,985 | 0.727 | 0.033 | 0.845 | 0.051 |
| February | 222,175 | 0.749 | 0.023 | 0.873 | 0.042 |
| March | 335,459 | 0.709 | 0.030 | 0.838 | 0.045 |
| April | 370,184 | 0.781 | 0.020 | 0.875 | 0.048 |
| May | 376,391 | 0.824 | 0.013 | 0.873 | 0.064 |
| June | 391,512 | 0.849 | 0.010 | 0.852 | 0.083 |
| July | 421,885 | 0.888 | 0.007 | 0.881 | 0.087 |
| August | 424,014 | 0.883 | 0.010 | 0.877 | 0.089 |
| September | 413,307 | 0.855 | 0.019 | 0.872 | 0.080 |
| October | 373,024 | 0.792 | 0.024 | 0.879 | 0.056 |
| November | 322,274 | 0.792 | 0.017 | 0.915 | 0.042 |
| December | 307,161 | 0.752 | 0.020 | 0.874 | 0.047 |
| Type | Area (km2) | Net Rate of Change (%) | |||||||
|---|---|---|---|---|---|---|---|---|---|
| 1990 | 2000 | 2005 | 2010 | 2015 | 90–00 | 00–05 | 05–10 | 10–15 | |
| Forest | 48,840.57 | 48,897.66 | 49,151.33 | 49,260.01 | 49,345.61 | 0.01 | 0.09 | 0.04 | 0.03 |
| Shrub | 77,199.21 | 77,387.99 | 79,462.53 | 80,610.79 | 80,291.49 | 0.02 | 0.45 | 0.24 | −0.07 |
| Grassland | 23,0887.19 | 228,391.86 | 235,166.71 | 239,083.15 | 238,644.53 | −0.10 | 0.49 | 0.28 | −0.03 |
| Farmland | 20,6118.87 | 209,203.68 | 198,396.38 | 190,861.18 | 188,217.51 | 0.14 | −0.86 | −0.63 | −0.23 |
| Wetland | 5370.87 | 4220.19 | 4438.66 | 4500.84 | 4591.87 | −1.95 | 0.86 | 0.23 | 0.34 |
| Urban | 14,497.14 | 16,401.55 | 18,293.95 | 21,229.60 | 24,644.91 | 1.19 | 1.92 | 2.67 | 2.68 |
| Desert | 39,978.76 | 38,326.21 | 37,848.96 | 37,249.20 | 37,018.42 | −0.38 | −0.21 | −0.26 | −0.10 |
| Type | Forest | Grassland | Farmland | Wetland | Urban | Desert | Shrub |
|---|---|---|---|---|---|---|---|
| Forest | 48,800.53 | 2.82 | 27.59 | 1.30 | 7.80 | 0.22 | 0.31 |
| Grassland | 4.86 | 226,100.37 | 4104.05 | 108.09 | 270.87 | 235.36 | 63.60 |
| Farmland | 84.78 | 1320.95 | 203,212.10 | 189.34 | 1492.86 | 156.89 | 385.95 |
| Wetland | 4.89 | 228.58 | 925.75 | 3772.63 | 23.56 | 394.82 | 20.64 |
| Urban | 1.13 | 0.12 | 0.00 | 0.24 | 14,495.65 | 0.00 | 0.00 |
| Desert | 1.36 | 690.11 | 1479.75 | 142.60 | 90.63 | 37,506.82 | 67.49 |
| Shrub | 0.10 | 48.91 | 241.89 | 6.01 | 20.18 | 32.10 | 76,850.00 |
| Period | Type | Forest | Grassland | Farmland | Wetland | Urban | Desert | Shrub |
|---|---|---|---|---|---|---|---|---|
| 2000–2015 | Forest | 48,793.92 | 8.23 | 19.13 | 2.20 | 47.49 | 14.99 | 11.69 |
| Grassland | 24.47 | 222,833.81 | 1930.85 | 300.52 | 2563.69 | 522.55 | 215.96 | |
| Farmland | 507.84 | 14,278.59 | 186,047.50 | 621.99 | 4838.25 | 481.51 | 3215.45 | |
| Wetland | 2.73 | 228.15 | 316.92 | 3299.38 | 74.44 | 266.22 | 32.36 | |
| Urban | 4.75 | 6.26 | 1.76 | 1.69 | 16,382.39 | 4.26 | 0.44 | |
| Desert | 6.24 | 1197.67 | 498.64 | 347.31 | 486.48 | 35,676.69 | 113.20 | |
| Shrub | 5.66 | 91.83 | 264.97 | 18.77 | 252.17 | 52.21 | 76,702.39 | |
| 2000–2005 | Forest | 48,872.42 | 2.74 | 3.54 | 1.51 | 6.00 | 0.26 | 11.19 |
| Grassland | 11.83 | 226,738.83 | 700.22 | 169.68 | 432.75 | 207.71 | 130.83 | |
| Farmland | 255.35 | 7829.17 | 198,081.38 | 260.21 | 1316.00 | 242.93 | 2006.08 | |
| Wetland | 1.83 | 122.27 | 180.67 | 3730.38 | 23.92 | 151.19 | 9.94 | |
| Urban | 2.61 | 5.31 | 1.66 | 1.11 | 16,389.80 | 0.62 | 0.44 | |
| Desert | 2.72 | 421.59 | 273.35 | 272.10 | 102.93 | 37,235.61 | 17.91 | |
| Shrub | 4.56 | 46.81 | 13.64 | 3.67 | 22.55 | 10.63 | 77,286.13 | |
| 2005–2010 | Forest | 49,134.21 | 2.62 | 3.00 | 0.76 | 7.55 | 2.59 | 0.61 |
| Grassland | 13.85 | 233,110.28 | 447.44 | 150.83 | 1114.90 | 225.71 | 103.70 | |
| Farmland | 104.64 | 5240.07 | 190,793.94 | 363.39 | 1480.77 | 173.96 | 1097.70 | |
| Wetland | 2.14 | 150.63 | 211.37 | 3800.82 | 40.65 | 215.73 | 17.33 | |
| Urban | 0.00 | 0.25 | 0.07 | 0.27 | 18,293.35 | 0.01 | 0.00 | |
| Desert | 4.43 | 558.19 | 206.75 | 178.20 | 219.54 | 36,622.03 | 59.82 | |
| Shrub | 0.75 | 21.12 | 20.43 | 6.57 | 72.85 | 9.17 | 79,331.64 | |
| 2010–2015 | Forest | 49,187.21 | 3.74 | 18.73 | 0.47 | 36.84 | 12.59 | 0.42 |
| Grassland | 6.81 | 236,441.71 | 1146.82 | 137.67 | 1087.77 | 233.86 | 28.51 | |
| Farmland | 144.23 | 1666.39 | 187,369.86 | 231.31 | 1959.52 | 208.23 | 103.46 | |
| Wetland | 0.53 | 136.48 | 123.98 | 4031.29 | 9.06 | 186.70 | 12.81 | |
| Urban | 1.90 | 1.24 | 0.03 | 1.61 | 21,216.09 | 8.72 | 0.00 | |
| Desert | 3.32 | 360.56 | 176.05 | 177.77 | 172.21 | 36,328.46 | 30.83 | |
| Shrub | 1.62 | 34.42 | 244.29 | 11.75 | 163.40 | 39.85 | 80,115.47 |
| Change | 1990–2015 | 1990–1999 | 2000–2015 | |||
|---|---|---|---|---|---|---|
| Number of Pixels | Percentage/% | Number of Pixels | Percentage/% | Number of Pixels | Percentage/% | |
| Significant increase | 20,6129 | 33.05 | 40,202 | 6.45 | 410,252 | 65.78 |
| Significant decrease | 15,3485 | 24.61 | 31,067 | 4.98 | 10,302 | 1.65 |
| Increase | 12,7219 | 20.40 | 239,937 | 38.47 | 162,891 | 26.12 |
| Decrease | 13,6822 | 21.94 | 312,449 | 50.10 | 40,210 | 6.45 |
| Rank | 2000–2005 | 2005–2010 | 2010–2015 | 2000–2015 | |||||
|---|---|---|---|---|---|---|---|---|---|
| Change | Change Rank | Number of Pixels | % | Number of Pixels | % | Number of Pixels | % | Number of Pixels | % |
| ≤−0.10 | Decreased severely | 689 | 0.11 | 1554 | 0.25 | 3681 | 0.59 | 2580 | 0.41 |
| −0.10~−0.05 | Decreased slightly | 6550 | 1.05 | 9789 | 1.57 | 22,327 | 3.58 | 6424 | 1.03 |
| −0.05~0.05 | unchanged | 415,527 | 66.63 | 471,964 | 75.68 | 537,672 | 86.21 | 257,144 | 41.23 |
| 0.05~0.10 | Increased slightly | 168,784 | 27.06 | 126,267 | 20.25 | 57,256 | 9.18 | 176,583 | 28.31 |
| ≥0.1 | Increase greatly | 32,105 | 5.15 | 14,081 | 2.26 | 2719 | 0.44 | 180,924 | 29.01 |
| Rank | 1990–1999 | 2000–2010 | |||
|---|---|---|---|---|---|
| Change | Change Rank | Number of Pixels | Percentage/% | Number of Pixels | Percentage/% |
| ≤−0.10 | Decreased severely | 39,553 | 6.34 | 1510 | 0.24 |
| −0.10~−0.05 | Decreased slightly | 168,866 | 27.08 | 5523 | 0.89 |
| −0.05~0.05 | unchanged | 394,201 | 63.21 | 281,124 | 45.08 |
| 0.05~0.10 | Increased slightly | 19,256 | 3.09 | 207,708 | 33.30 |
| ≥0.1 | Increase greatly | 1779 | 0.29 | 127,790 | 20.49 |
| Driving Factors | Number of Pixels | Percentage/% |
|---|---|---|
| Human and climate cause vegetation restoration together | 58,667 | 9.41 |
| Human-induced vegetation restoration | 135,569 | 21.74 |
| Climate-induced vegetation restoration | 11,893 | 1.91 |
| Human and climate cause vegetation degradation together | 29,346 | 4.71 |
| Human-induced vegetation degradation | 74,758 | 11.99 |
| Climate-induced vegetation degradation | 49,381 | 7.92 |
| Period | Driving factors | Number of Pixels | Percentage/% |
|---|---|---|---|
| 1990–1999 | Human and climate cause vegetation restoration together | 8103 | 1.30 |
| Human-induced vegetation restoration | 23,893 | 3.83 | |
| Climate-induced vegetation restoration | 8206 | 1.32 | |
| Human and climate cause vegetation degradation together | 3384 | 0.54 | |
| Human-induced vegetation degradation | 16,768 | 2.69 | |
| Climate-induced vegetation degradation | 10,915 | 1.75 | |
| 2000–2015 | Human and climate cause vegetation restoration together | 107,693 | 17.27 |
| Human-induced vegetation restoration | 287,599 | 46.12 | |
| Climate-induced vegetation restoration | 14,960 | 2.40 | |
| Human and climate cause vegetation degradation together | 2068 | 0.33 | |
| Human-induced vegetation degradation | 6282 | 1.01 | |
| Climate-induced vegetation degradation | 1952 | 0.31 |
Publisher’s Note: MDPI stays neutral with regard to jurisdictional claims in published maps and institutional affiliations. |
© 2021 by the authors. Licensee MDPI, Basel, Switzerland. This article is an open access article distributed under the terms and conditions of the Creative Commons Attribution (CC BY) license (https://creativecommons.org/licenses/by/4.0/).
Share and Cite
Xiu, L.; Yao, X.; Chen, M.; Yan, C. Effect of Ecological Construction Engineering on Vegetation Restoration: A Case Study of the Loess Plateau. Remote Sens. 2021, 13, 1407. https://doi.org/10.3390/rs13081407
Xiu L, Yao X, Chen M, Yan C. Effect of Ecological Construction Engineering on Vegetation Restoration: A Case Study of the Loess Plateau. Remote Sensing. 2021; 13(8):1407. https://doi.org/10.3390/rs13081407
Chicago/Turabian StyleXiu, Lina, Xiaojun Yao, Mengdie Chen, and Changzhen Yan. 2021. "Effect of Ecological Construction Engineering on Vegetation Restoration: A Case Study of the Loess Plateau" Remote Sensing 13, no. 8: 1407. https://doi.org/10.3390/rs13081407
APA StyleXiu, L., Yao, X., Chen, M., & Yan, C. (2021). Effect of Ecological Construction Engineering on Vegetation Restoration: A Case Study of the Loess Plateau. Remote Sensing, 13(8), 1407. https://doi.org/10.3390/rs13081407