Article

Shoreline Changes along Northern Ibaraki Coast after the Great East Japan Earthquake of 2011

Graduate School of Systems and Information Engineering, University of Tsukuba, Tsukuba 3058573, Japan
*
Author to whom correspondence should be addressed.
Remote Sens. 2021, 13(7), 1399; https://doi.org/10.3390/rs13071399
Submission received: 24 February 2021 / Revised: 31 March 2021 / Accepted: 3 April 2021 / Published: 5 April 2021

Abstract

:
In this study, we analyze the influence of the Great East Japan Earthquake, which occurred on 11 March 2011, on the shoreline of the northern Ibaraki Coast. After the earthquake, the area experienced subsidence of approximately 0.4 m. Shoreline changes at eight sandy beaches along the coast are estimated using various satellite images, including the ASTER (Advanced Spaceborne Thermal Emission and Reflection Radiometer), ALOS AVNIR-2 (Advanced Land Observing Satellite, Advanced Visible and Near-infrared Radiometer type 2), and Sentinel-2 (a multispectral sensor). Before the earthquake (for the period March 2001–January 2011), even though fluctuations in the shoreline position were observed, shorelines were quite stable, with the averaged change rates in the range of ±1.5 m/year. The shoreline suddenly retreated due to the earthquake by 20–40 m. Generally, the amount of retreat shows a strong correlation with the amount of land subsidence caused by the earthquake, and a moderate correlation with tsunami run-up height. The ground started to uplift gradually after the sudden subsidence, and shoreline positions advanced accordingly. The recovery speed of the beaches varied from +2.6 m/year to +6.6 m/year, depending on the beach conditions.

1. Introduction

The Great East Japan Earthquake, which occurred on 11 March 2011, with a magnitude of 9.0 on the Richter scale, was ranked among the five most powerful recorded earthquakes on Earth [1]. Crustal movements, the horizontal movement to the east–southeast, land subsidence, and a tsunami have been observed after the earthquake in eastern Honshu, Japan.
An inundation accompanying major land-subsidence caused by the earthquake and massive sediment transport caused by the tsunami resulted in a substantial loss of the coastal land in the eastern Honshu region [2,3]. According to the field measurement conducted by the Joint Survey Group, the tsunami inundation height was approximately 3.5–6.5 m based on T.P. (Tokyo Peil) data along the Ibaraki Coast, which is the area of interest of this study; the inundation height was approximately 19.5 m at the Sendai Plain in Miyagi Prefecture [4] (Figure 1). Many sea dikes and breakwaters along the coast were destroyed partially, or completely, due to the displacement caused by the earthquake and the tsunami [5].
The ground of eastern Honshu subsided abruptly during the earthquake and lifted gradually after the earthquake. The downward deformation of the ground (subsidence) was estimated to be approximately 0.4–0.5 m along the northern Ibaraki Coast and 0.2–0.4 m along the Sendai Coast (as shown in Figure 1 and later on in Figure 3). The rate of uplift along the northern Ibaraki Coast is different between the northern (+2.7 cm/year) and southern areas (+1.9 cm/year), based on the observed data from Global Navigation Satellite Systems (GNSS) observation stations at Kitaibaraki, Hitachi (Figure 1).
The shoreline positions along these regions were rapidly changing in different ways due to the subsidence, relative sea level rise, and the tsunami associated with the earthquake. There were many locations along the coast where serious erosion and breaching of the barriers was observed [1,5]. Tanaka et al., (2016) analyzed aerial photos to quantify the sudden shoreline retreat along the Sendai coast that occurred after the earthquake of 11 March 2011. After a while, the shoreline gradually advanced and reached a new equilibrium state over three years [6]. Overviews of coastal damage with respect to the morphology of the entire northern Honshu region are presented by Tojo and Udo (2016), wherein they discuss the effects of tsunamis and the relative sea level rise. However, a detailed study about the effects of the Great East Japan Earthquake on the northern Ibaraki Coast with regard to beach erosion and its recovery processes has not yet been done.
In this study, changes in the shoreline positions of eight sandy beaches along the northern Ibaraki Coast (Figure 1a), before and after the earthquake, are discussed. The beaches were selected based on the following criteria: (i) long stretch of sandy beach (≥500 m), and (ii) the beach width must be wide enough to detect shoreline variation (≥100 m). The shoreline positions were extracted from satellite images, and the amount of shoreline retreat for individual beaches as well as their recoveries are presented. Further, correlations between the changes in the shoreline position and initial subsidence (caused by the earthquake) and the uplift (observed after the earthquake) are determined and discussed to elucidate the effects of the earthquake on shoreline variations.

2. Materials and Methods
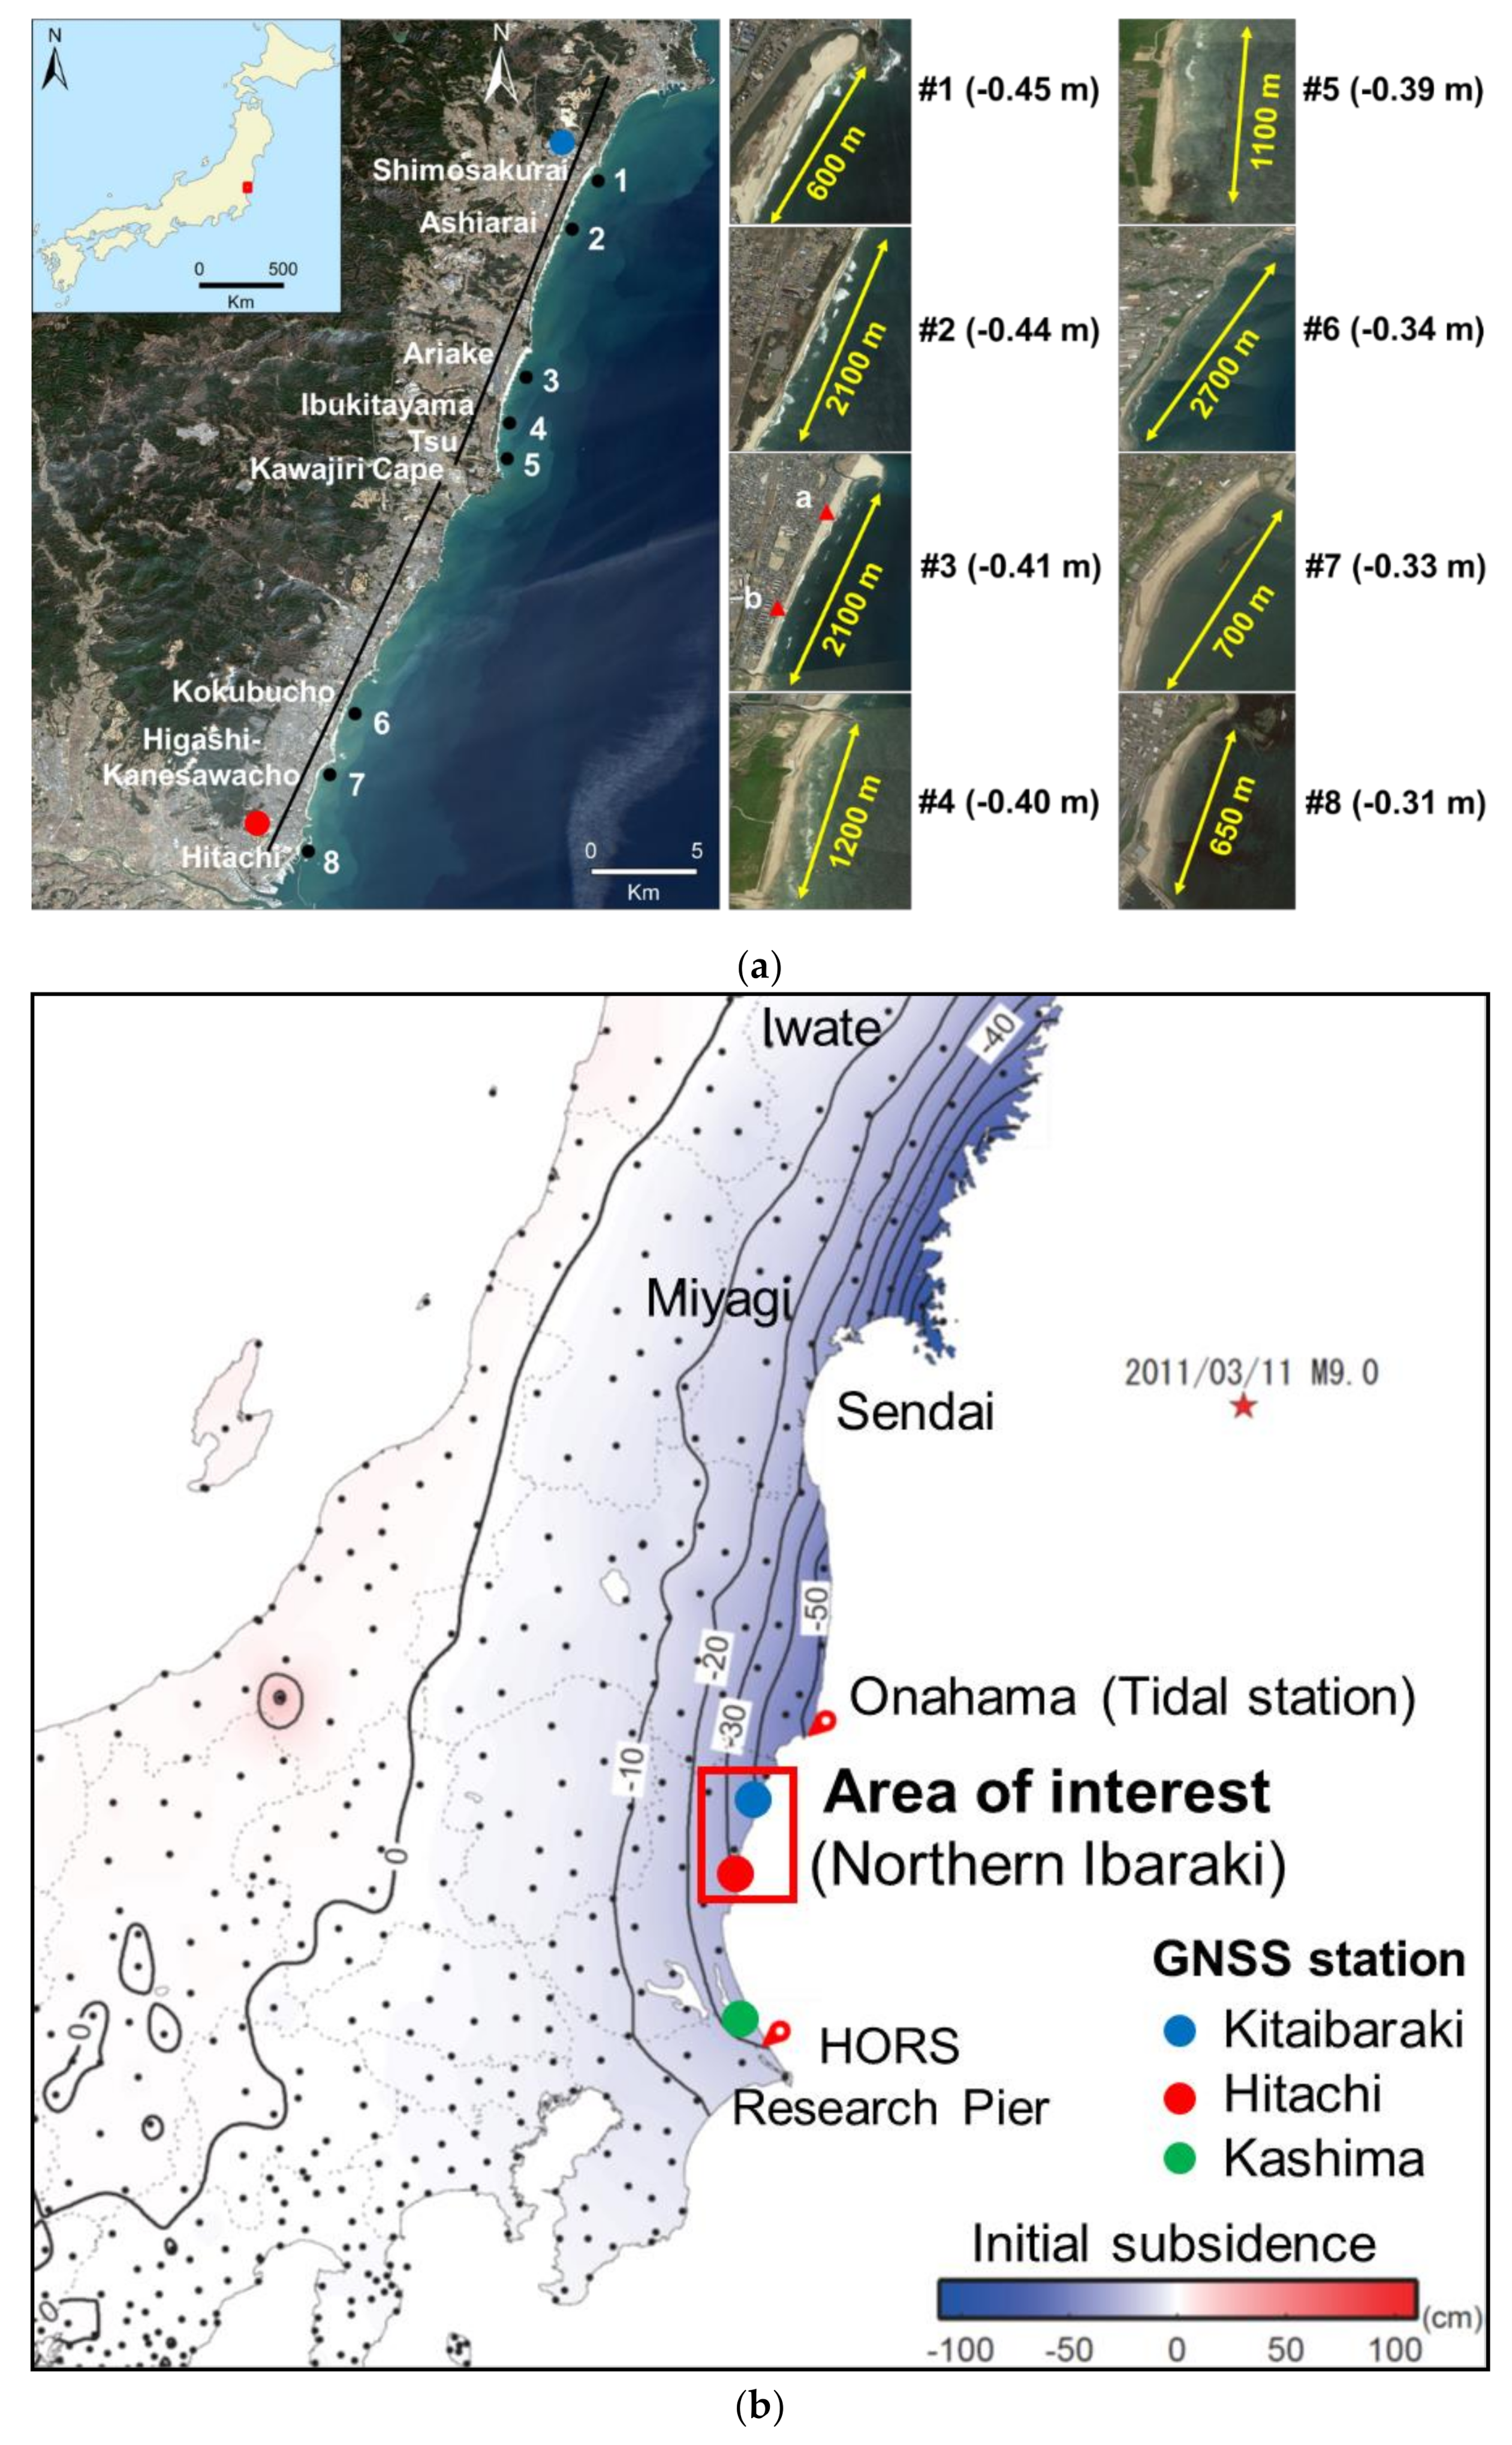
2.1. Study Area

The study area, which is the northern Ibaraki Coast, is shown in Figure 1. The coastline mainly consists of sandy beaches and rocky cliffs. The current study focuses on sandy beaches, including (1) Shimosakurai, (2) Ashiarai, (3) Ariake, (4) Ibukitayama, (5) Tsu, (6) Kokubucho, (7) Higashi-Kanesawacho, and (8) Hitachi, ordered from north to south (Figure 1a). Higashi-Kanesawacho and Hitachi are pocket beaches bordered by capes, while the rest are open beaches with or without breakwaters.
The entire study area can be divided into two sections: the northern portion, which stretches for about 15 km from Shimosakurai to Tsu (Figure 1, #1 to #5) and the southern portion, which stretches for about 18 km from Kokubucho to Hitachi (Figure 1, #6 to #8). The northern section is separated from the southern section by a rocky cliff headland (Kawajiri Cape), which is about 1.5 km long and interrupts longshore sediment transport.

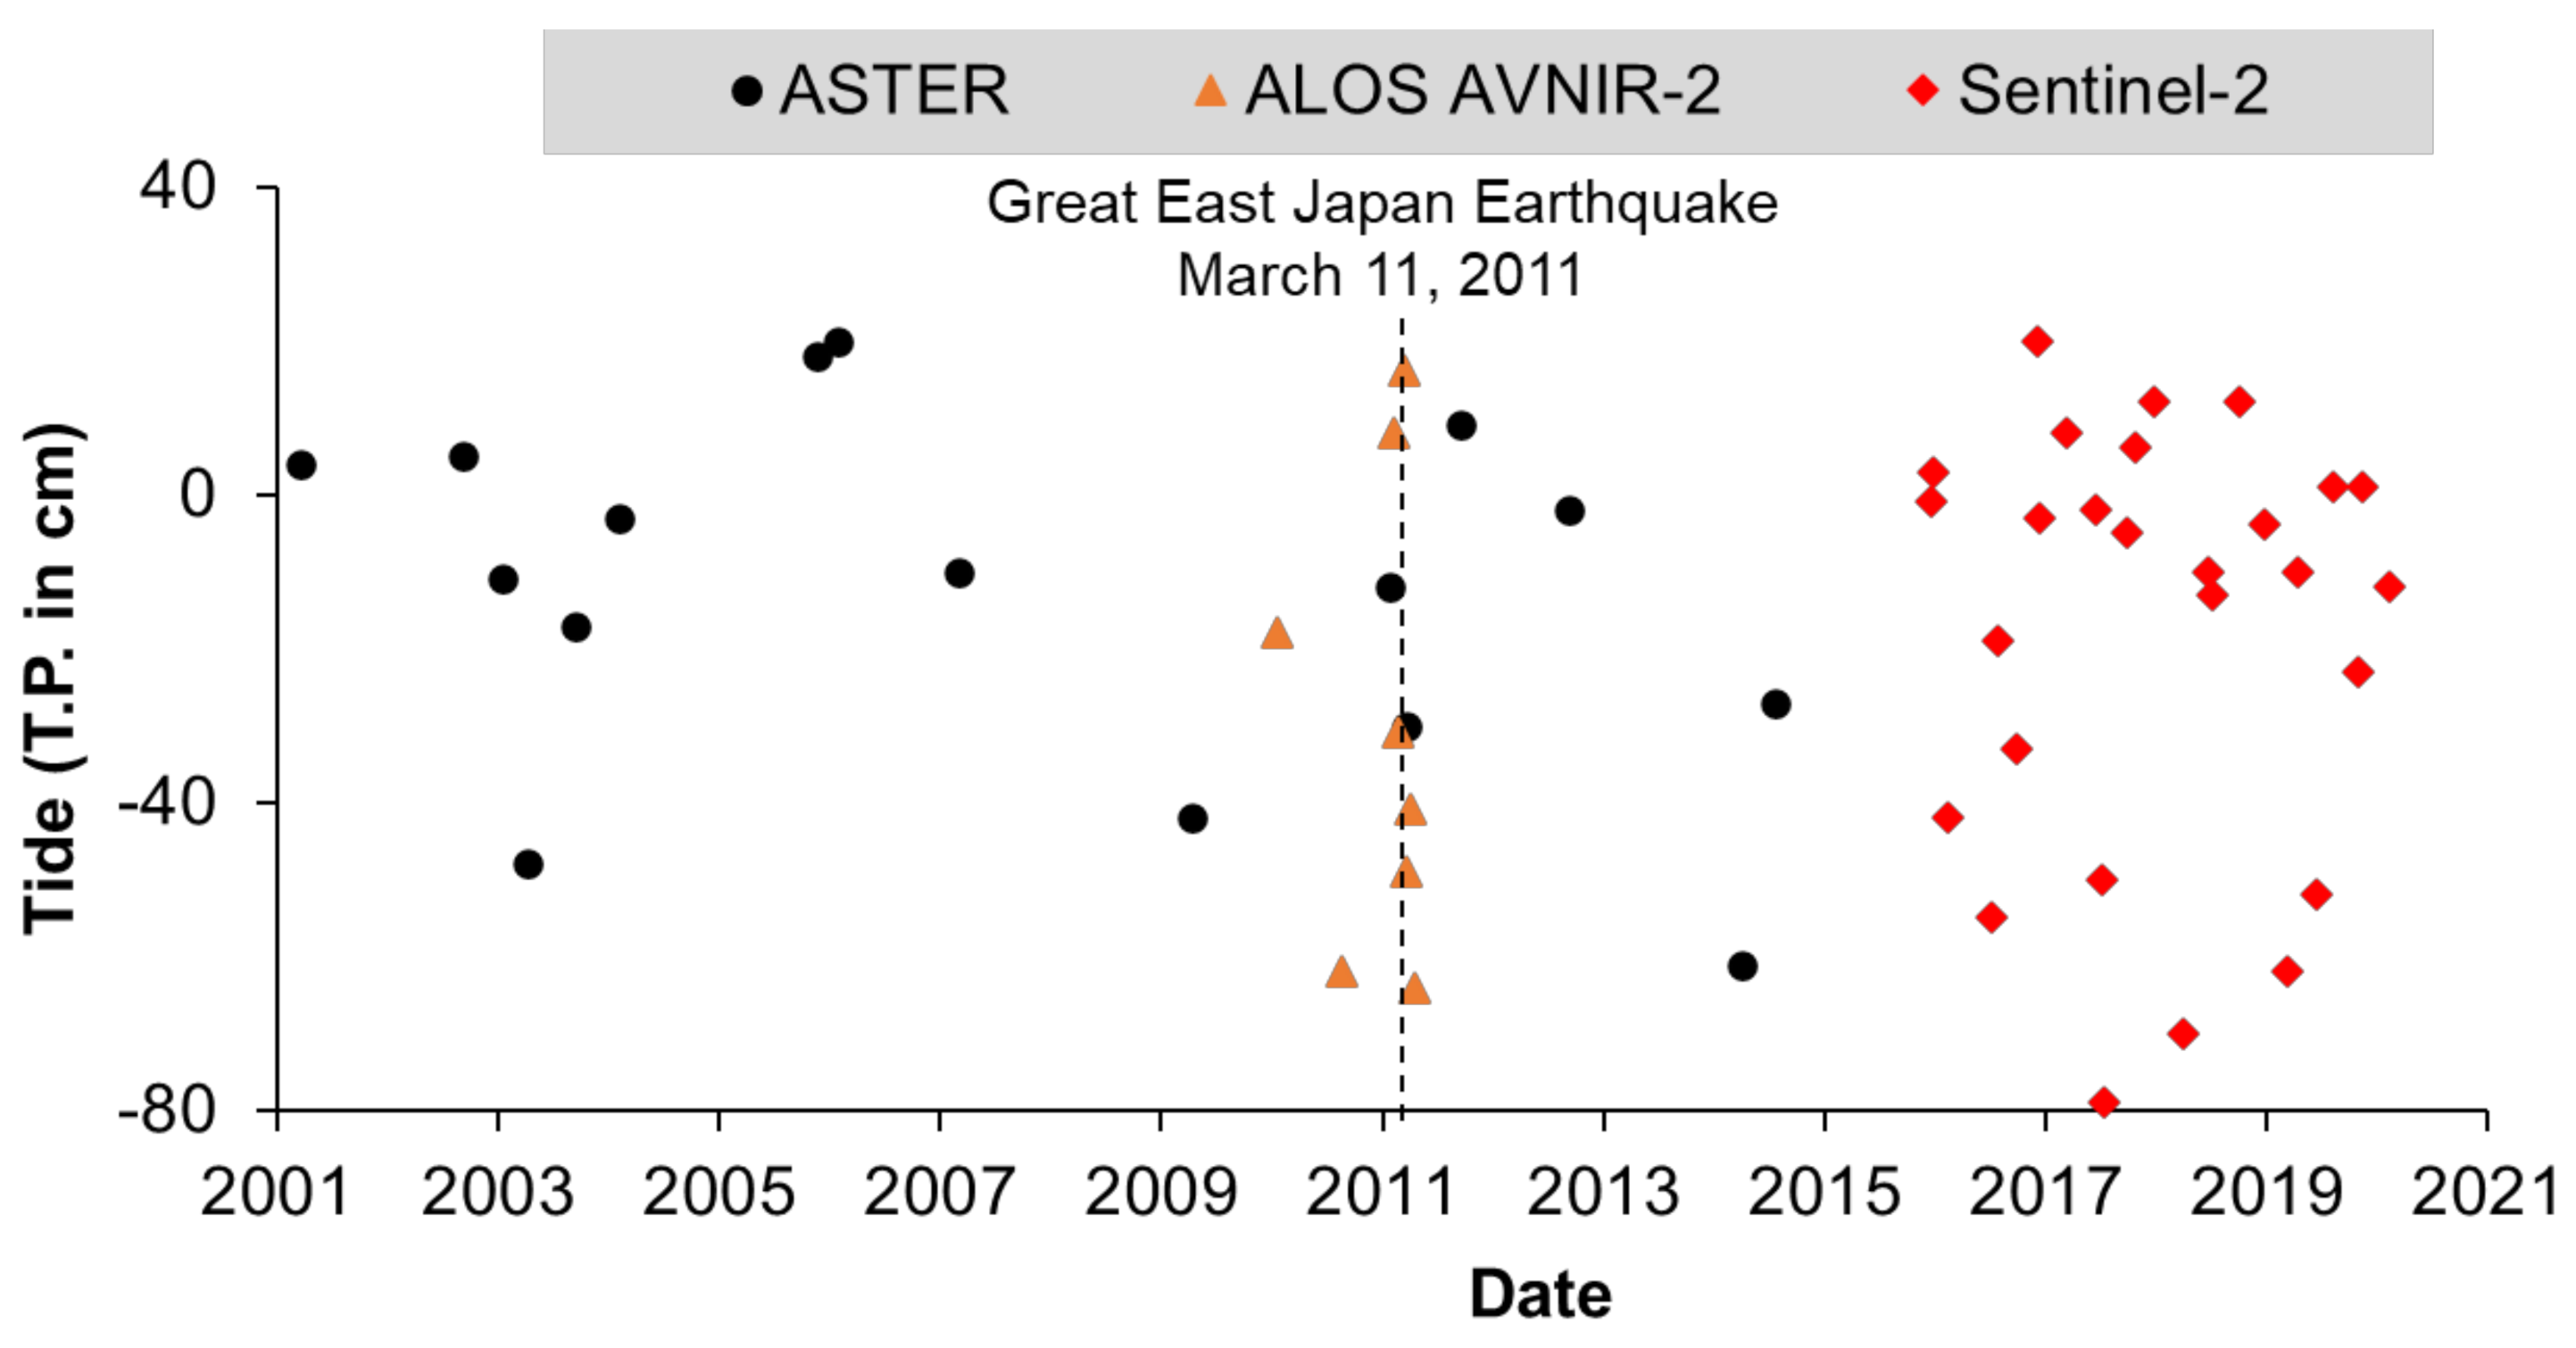
2.2. Data Collection

In the present study, shorelines, which are defined at T.P. 0 m (Tokyo Peil), were processed from 51 (northern section) and 53 (southern section) mid- or high-resolution satellite images using the ASTER (Advanced Spaceborne Thermal Emission and Reflection radiometer) (spatial resolution of 15 m), ALOS AVNIR-2 (Advanced Land Observing Satellite, Advanced Visible and Near-Infrared Radiometer type 2) (10 m), and Sentinel-2 (a multispectral sensor) (10 m). Figure 2 shows the year of acquisition of various images and the corresponding tide level respected to T.P. data measured at the Onahama tide station for the northern section (51 images).
Daily land elevation data (for January 2007–January 2020) were collected freely from the Geospatial Information Authority of Japan (GSI) (https://www.gsi.go.jp/ENLISH/index.html) (accessed on 5 April 2021), the data of which are based on GNSS measurements, for the three stations at Kitaibaraki, Hitachi, and Kashima (Figure 1). According to the observed data, the land surface subsided abruptly immediately after the earthquake. It started to recover gradually after a day, and kept stable during the next 20 days after the earthquake.
In this study, the amount of initial subsidence is defined as the average amount of subsidence for a set period (12 March 2011–31 March 2011) after the earthquake, as shown in Figure 3.
Hourly tidal data observed at the tide station of Onahama was downloaded from the website of Japan Meteorological Agency (JMA) (http://www.data.jma.go.jp/gmd/kaiyou/db/tide/genbo/index.php) (accessed on 5 April 2021), for the correction of the extracted waterline (obtained from satellite images) to determine the shoreline position, which is defined at T.P. 0 m. Note that T.P. 0 m is very close to mean water level of the study area.
Beach profiles surveyed annually along the northern Ibaraki Coast from 2002 to 2018 by the local government of Ibaraki Prefecture were used to estimate foreshore slopes. Accordingly, the beach slopes of the eight coastlines were calculated between the depth of 0 m and 8.5 m (closure depth, adopted from Udo et al., (2020)) for each year [7]. Since the surveyed beach profiles show fluctuations between years, the foreshore slope is averaged for further analysis, and they are 1/26 (Shimosakurai), 1/34 (Ashiarai), 1/40 (Ariake), 1/29 (Ibukitayama), 1/35 (Tsu), 1/52 (Kokubucho), 1/62 (Higashi-Kanesawacho), and 1/62 (Hitachi).
Along the northern Ibaraki Coast, waves come from the south-east direction in the summer and from the north-east direction in the winter season, based on the wave observation at Hitachinaka port, nearby the Hitachi Beach (Figure 1a, #8). The wave rose diagram in Figure 4 indicates that the waves come mostly from the south-east direction and that waves with a height greater than 1.0 m make up more than 54.4% of all the waves.
Data on the tsunami including inundation height and run-up height in the eight sandy beaches were collected from the Nationwide Post Event Survey and Analysis of the 2011 Tohoku Earthquake Tsunami [4], and were used in the present study. Note that tsunami run-up height was determined from the maximum landward extent of debris and seawater marks, whilst inundation height was the maximum water level, which was the result of a tsunami traveling a long distance inland [4].

2.3. Data Processing

Near-infrared (NIR) and short-wave infrared (SWIR) channels were used to calculate the Normalized Difference Water Index (NDWI), which distinguishes land from water. The methodology to extract the waterlines from satellite images can be summarized in two steps: (i) application of the NDWI; and (ii) delineation of the land–sea boundary using isocluster unsupervised classification of the enhanced NDWI images [8,9].
The next step is to remove the effect of tidal level on the waterline and determine shoreline position defined at T.P. 0 m level. Averaged foreshore slopes determined from the survey and tide level at the image acquisition were used in the tidal corrections. The amount of tidal correction is the difference between tide level at the moment of data acquisition and T.P. 0 m with the beach slope.
Shoreline positions were defined at every 10 m along the two baselines, shown in the Figure 1a, which are about 20 km long and stretch from north to south in each section. In total, 1860 and 1820 transects were established along the baselines for the northern and southern sections, respectively, by the DSAS tool (Digital Shoreline Analysis System tool, an extension of the ArcGIS software [10,11]). Because, for the eight sandy beaches, the maximum and mean shoreline angles to the baseline are approximately 15° and 7°, respectively, the difference in the estimation of the shoreline change rate with and without consideration of the shoreline angle is insignificant. Hence, it was not considered in the estimation of shoreline positions.
The sudden retreat of the shoreline that resulted from the subsidence caused by the earthquake was estimated in the following manner. The amount of retreat was calculated by subtracting the mean shoreline position estimated from the images acquired for the period of March 2001–January 2011 from the mean shoreline position estimated from the images taken on 18 and 19 March 2011, for the northern section, and 19 and 29 March 2011, for the southern one. Because of the cloud cover, the satellite image captured on 18 March 2011 could not be used for the southern section; there was also unavailable data on 12 March 2011, hence the images acquired on 29 March 2011 were utilized.
The shoreline change rates, before and after the earthquake, were estimated using linear regressions, which are based on the DSAS. The method considers linear regression rate-of-change (LRR) based on the determination of least-squares regression lines of all the shoreline points of the transects.
The amount of sudden subsidence as well as the uplift rate (of the land) at the beaches between the Kitaibaraki and Hitachi stations, shown in Figure 1a, was estimated from linear interpolation in relation to the alongshore location of the beaches.

3. Results

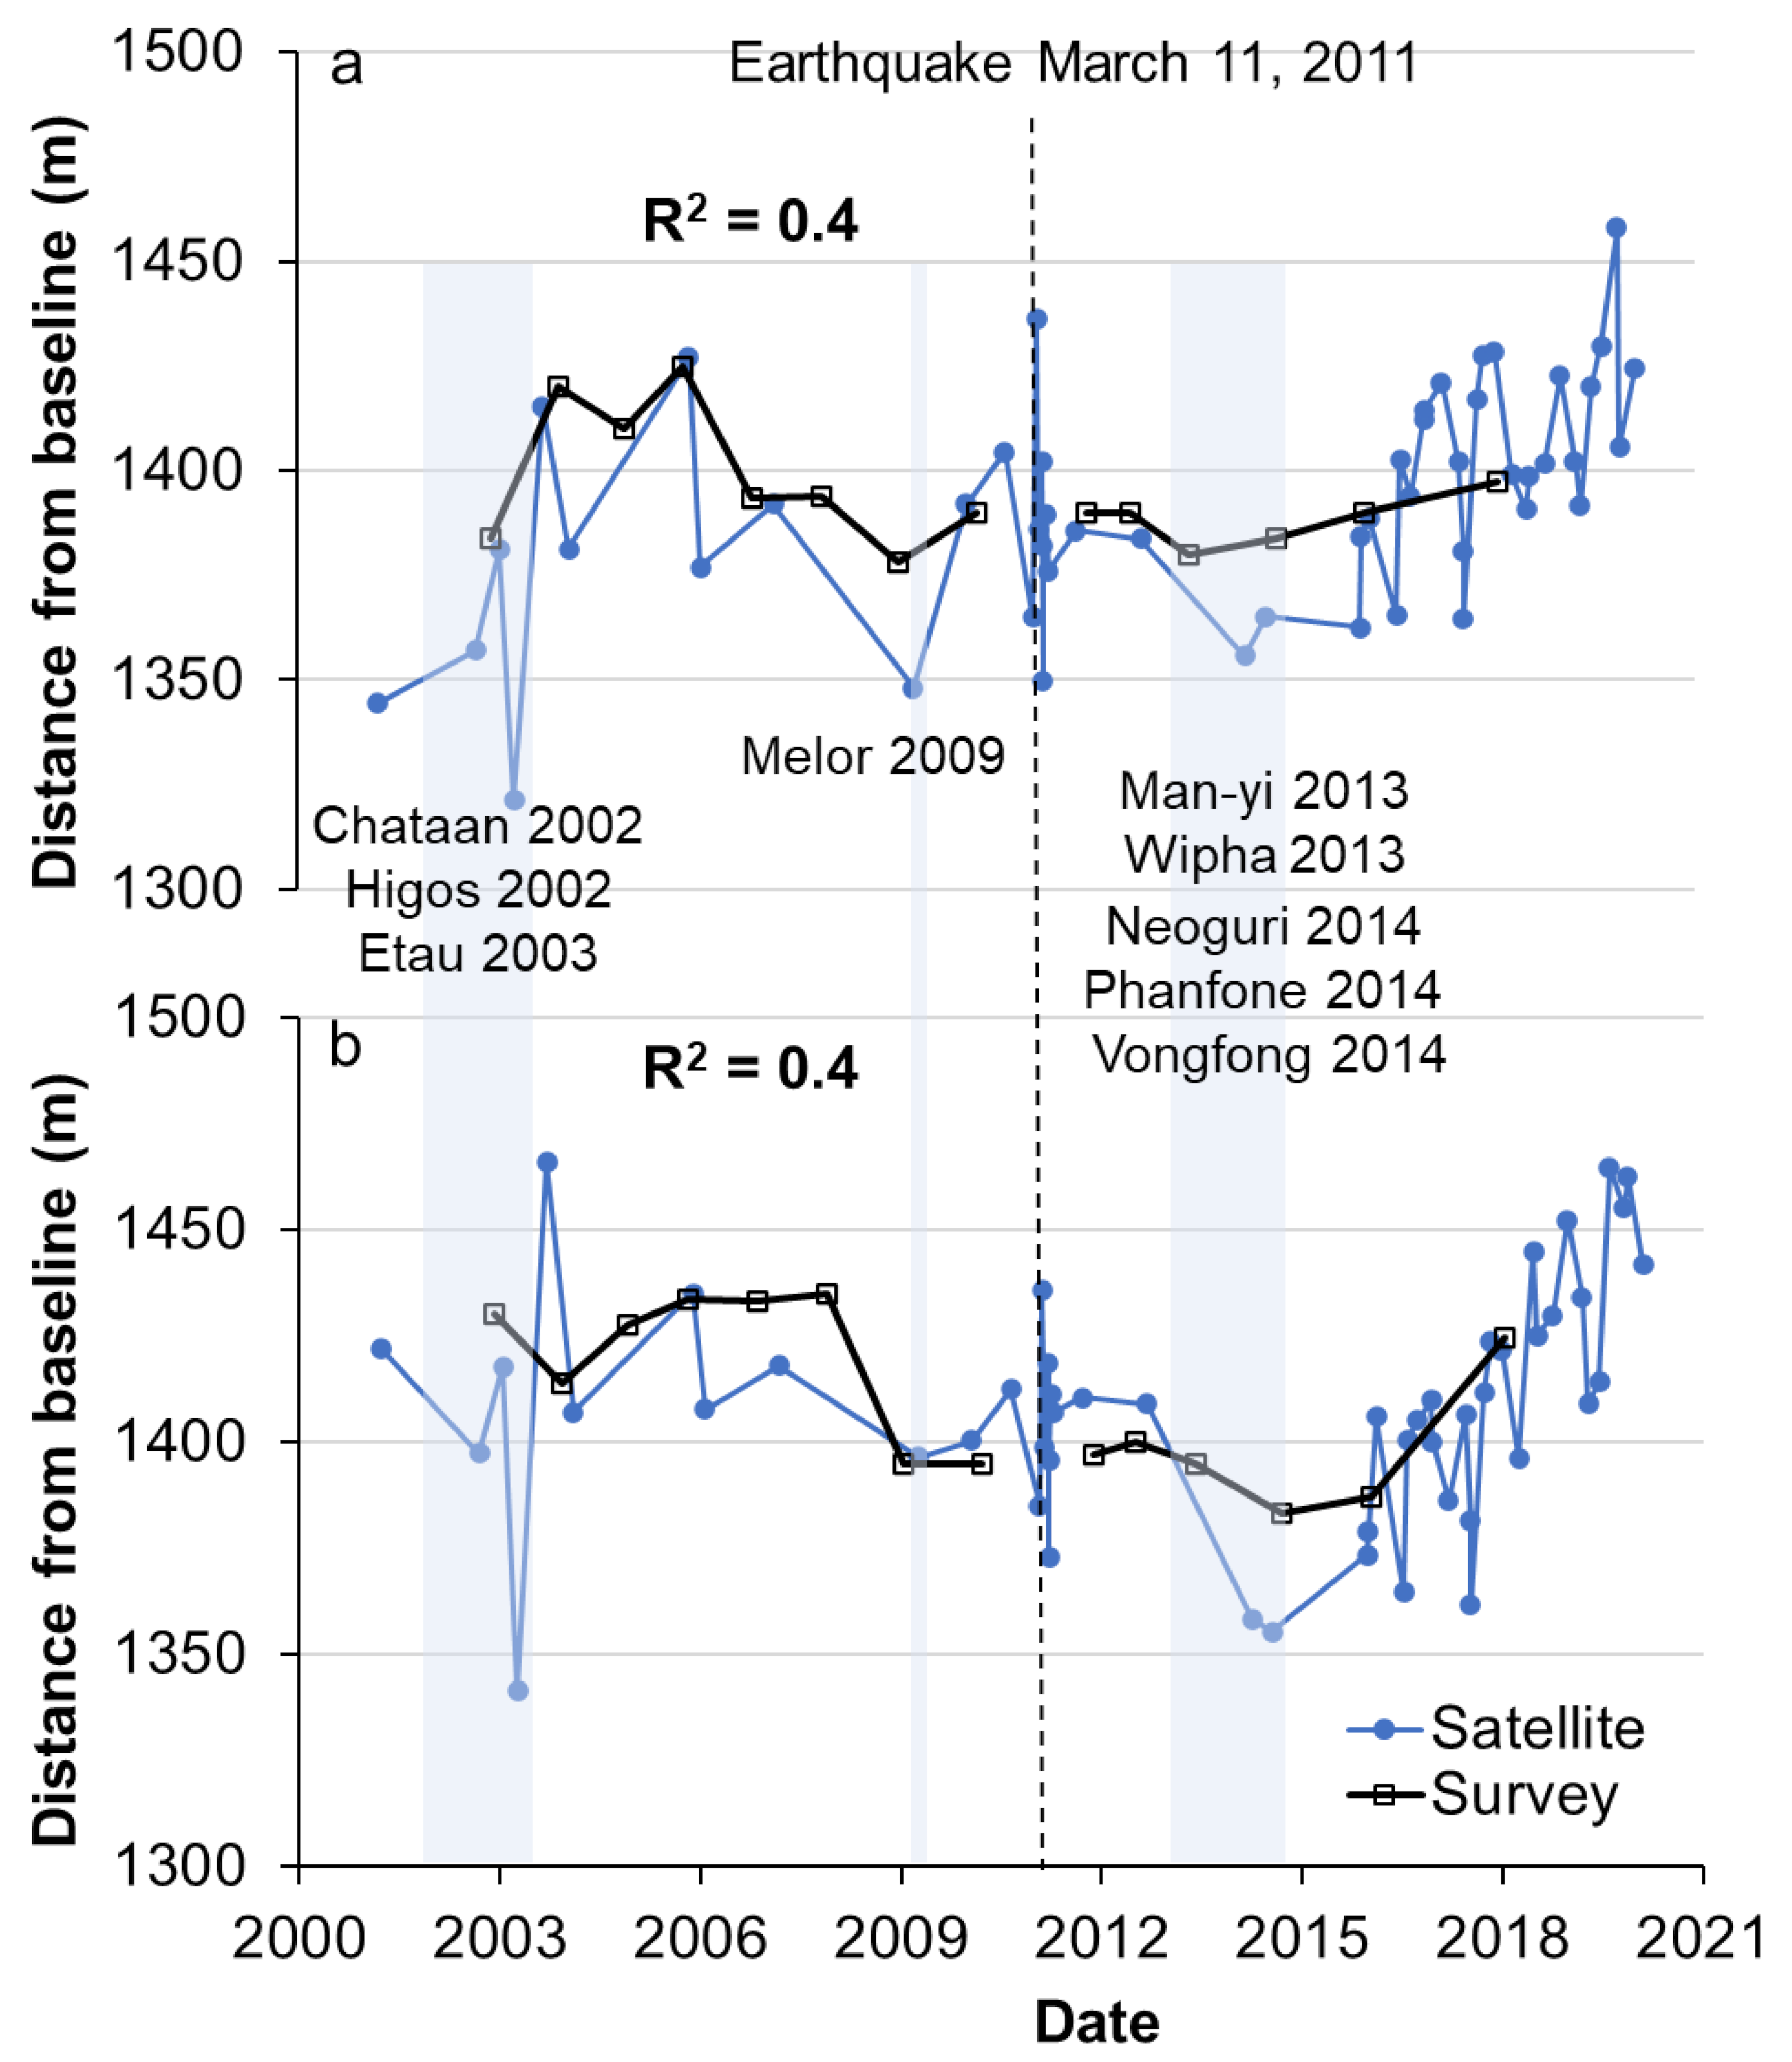
3.1. Validation of Shoreline Extraction

Figure 5 shows comparisons between shoreline positions extracted from satellite data and annual beach profile surveys of the Ariake Beach. The locations of the comparisons are shown in Figure 1a, #3, with the red triangles located in the north (a) and south (b) of the beach. Since the dates of field survey and satellite observation are generally different, polylines with markers are utilized to highlight the differences between them. Both survey and satellite-based shorelines used the same baseline (Figure 1a) to estimate the amount of shoreline movement. A similar trend in shoreline change behavior between the satellite-derived shoreline and the survey data was observed, and the maximum difference between the shorelines extracted from satellite and survey was less than 30 m. Thus, a fairly good agreement is observed between the survey result and shoreline position within the scatter range of spatial resolution of satellite images.

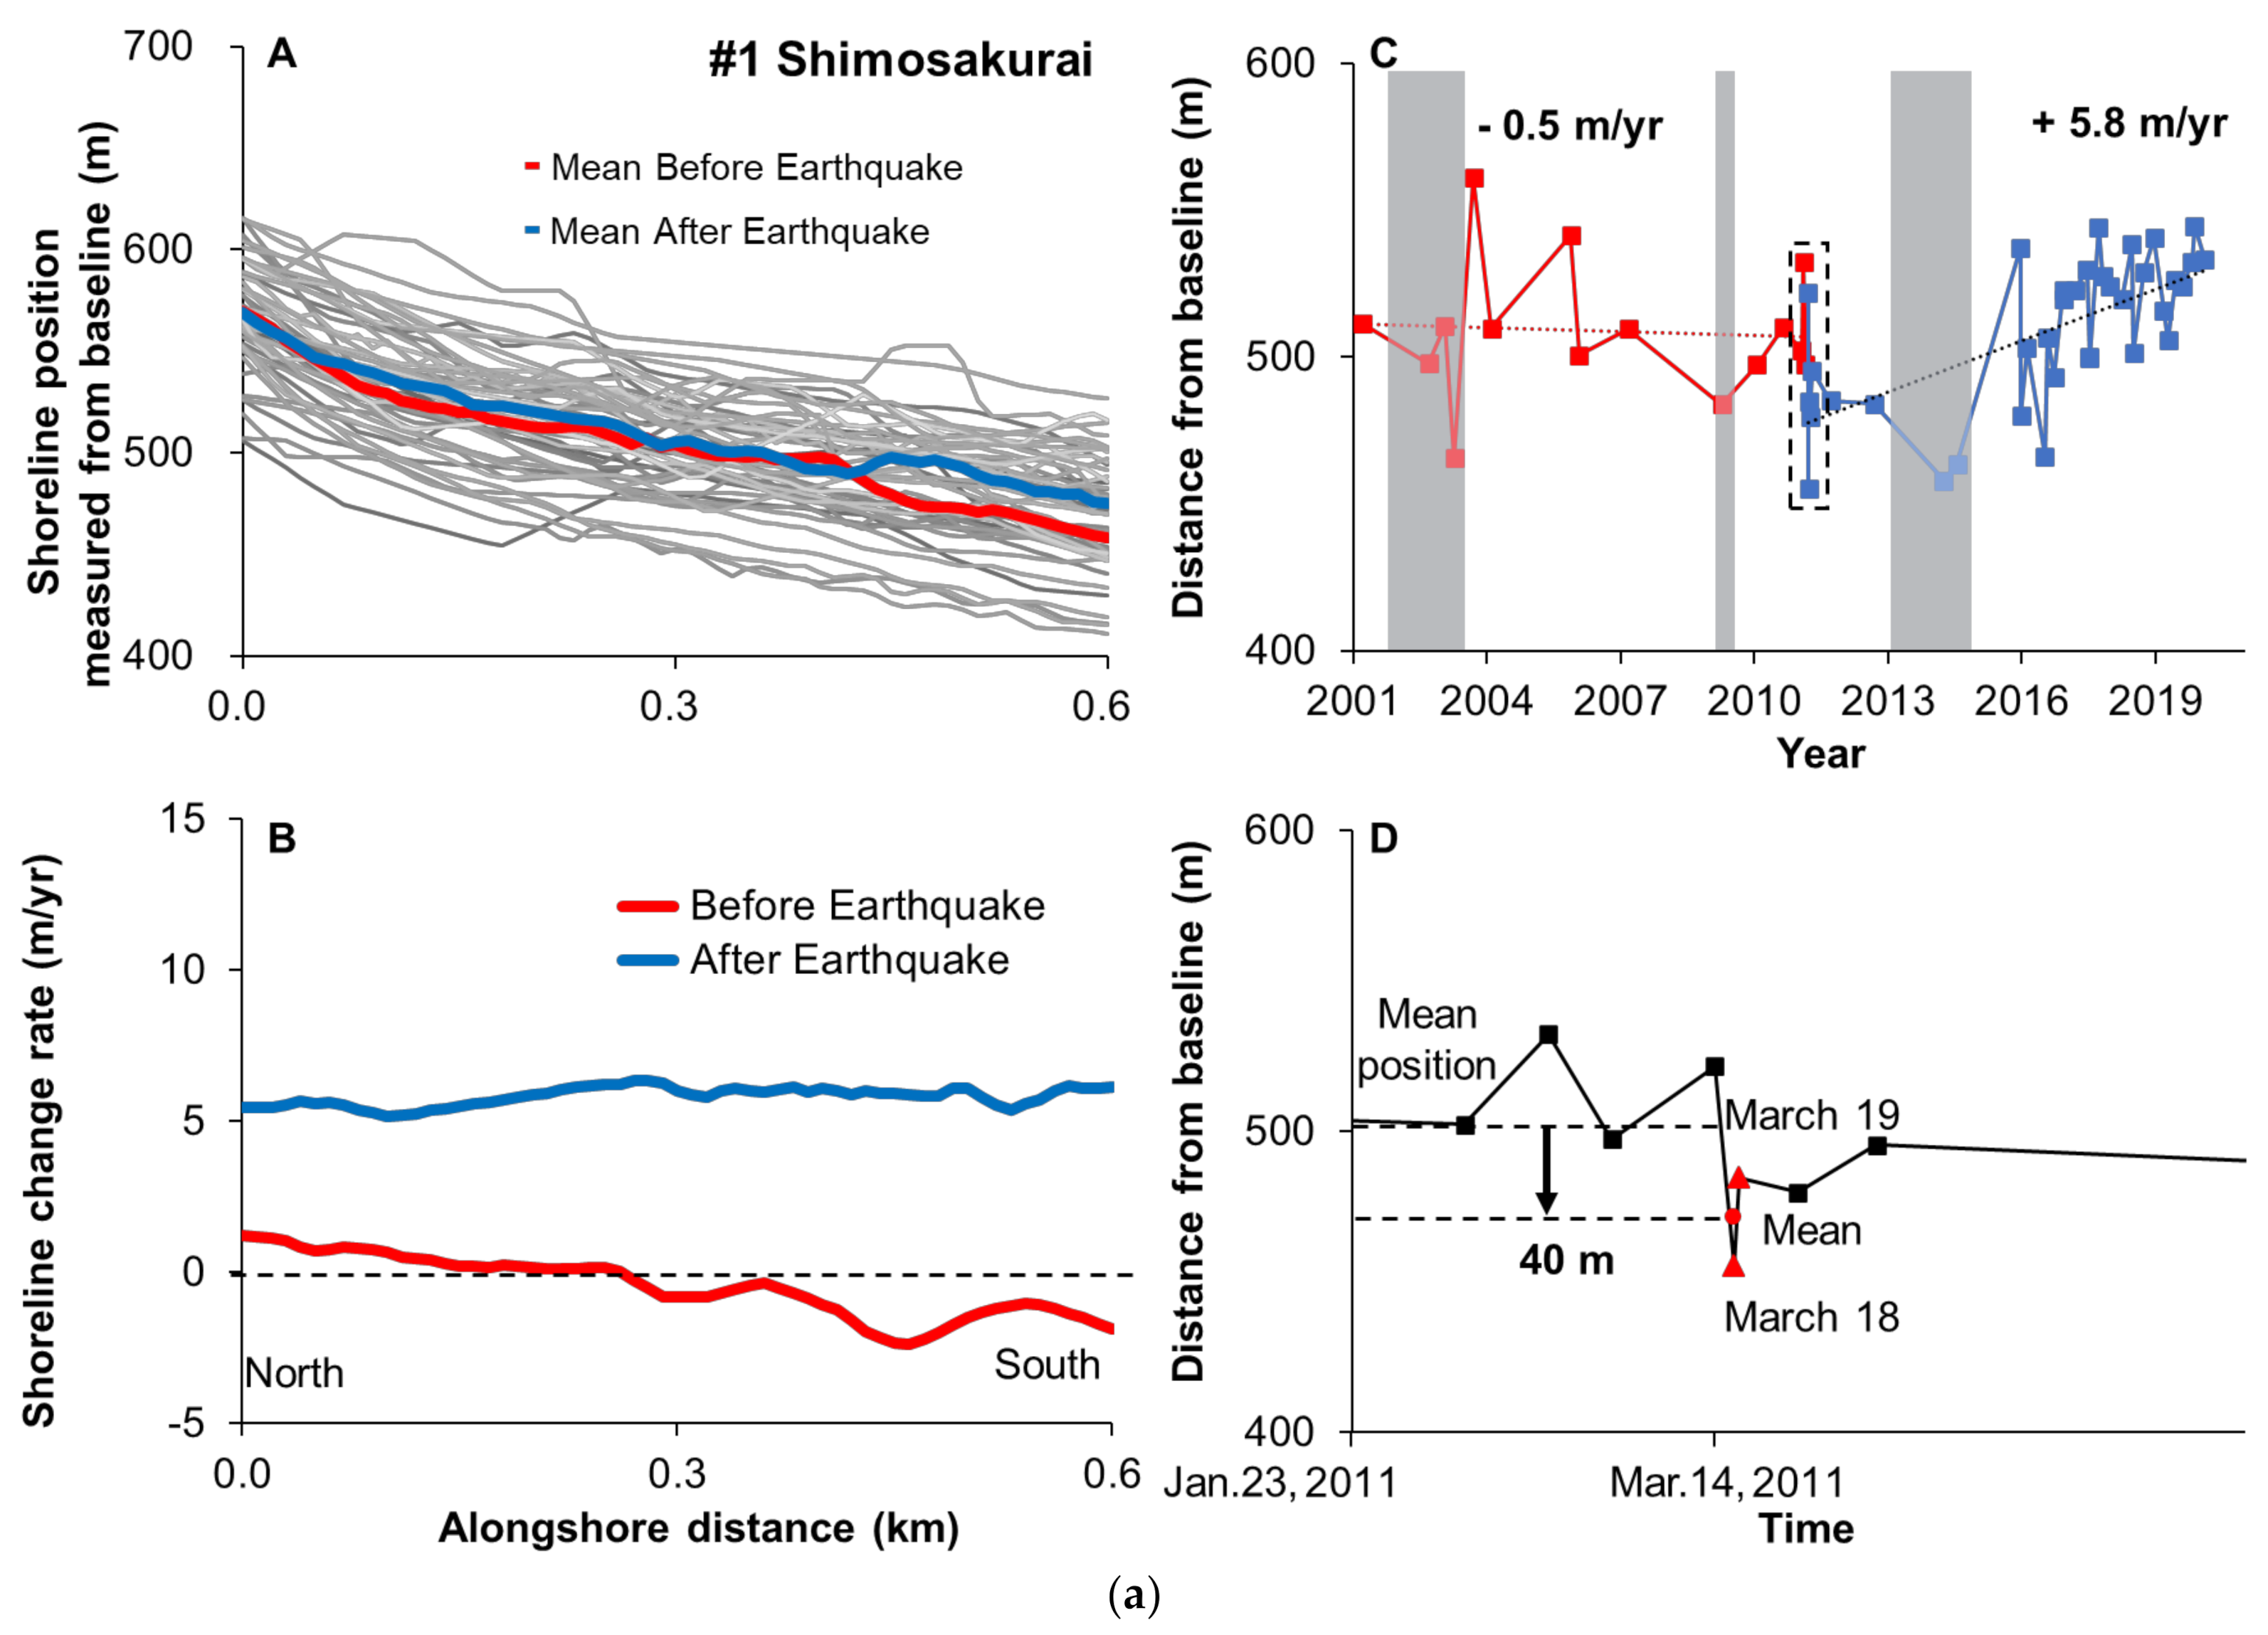
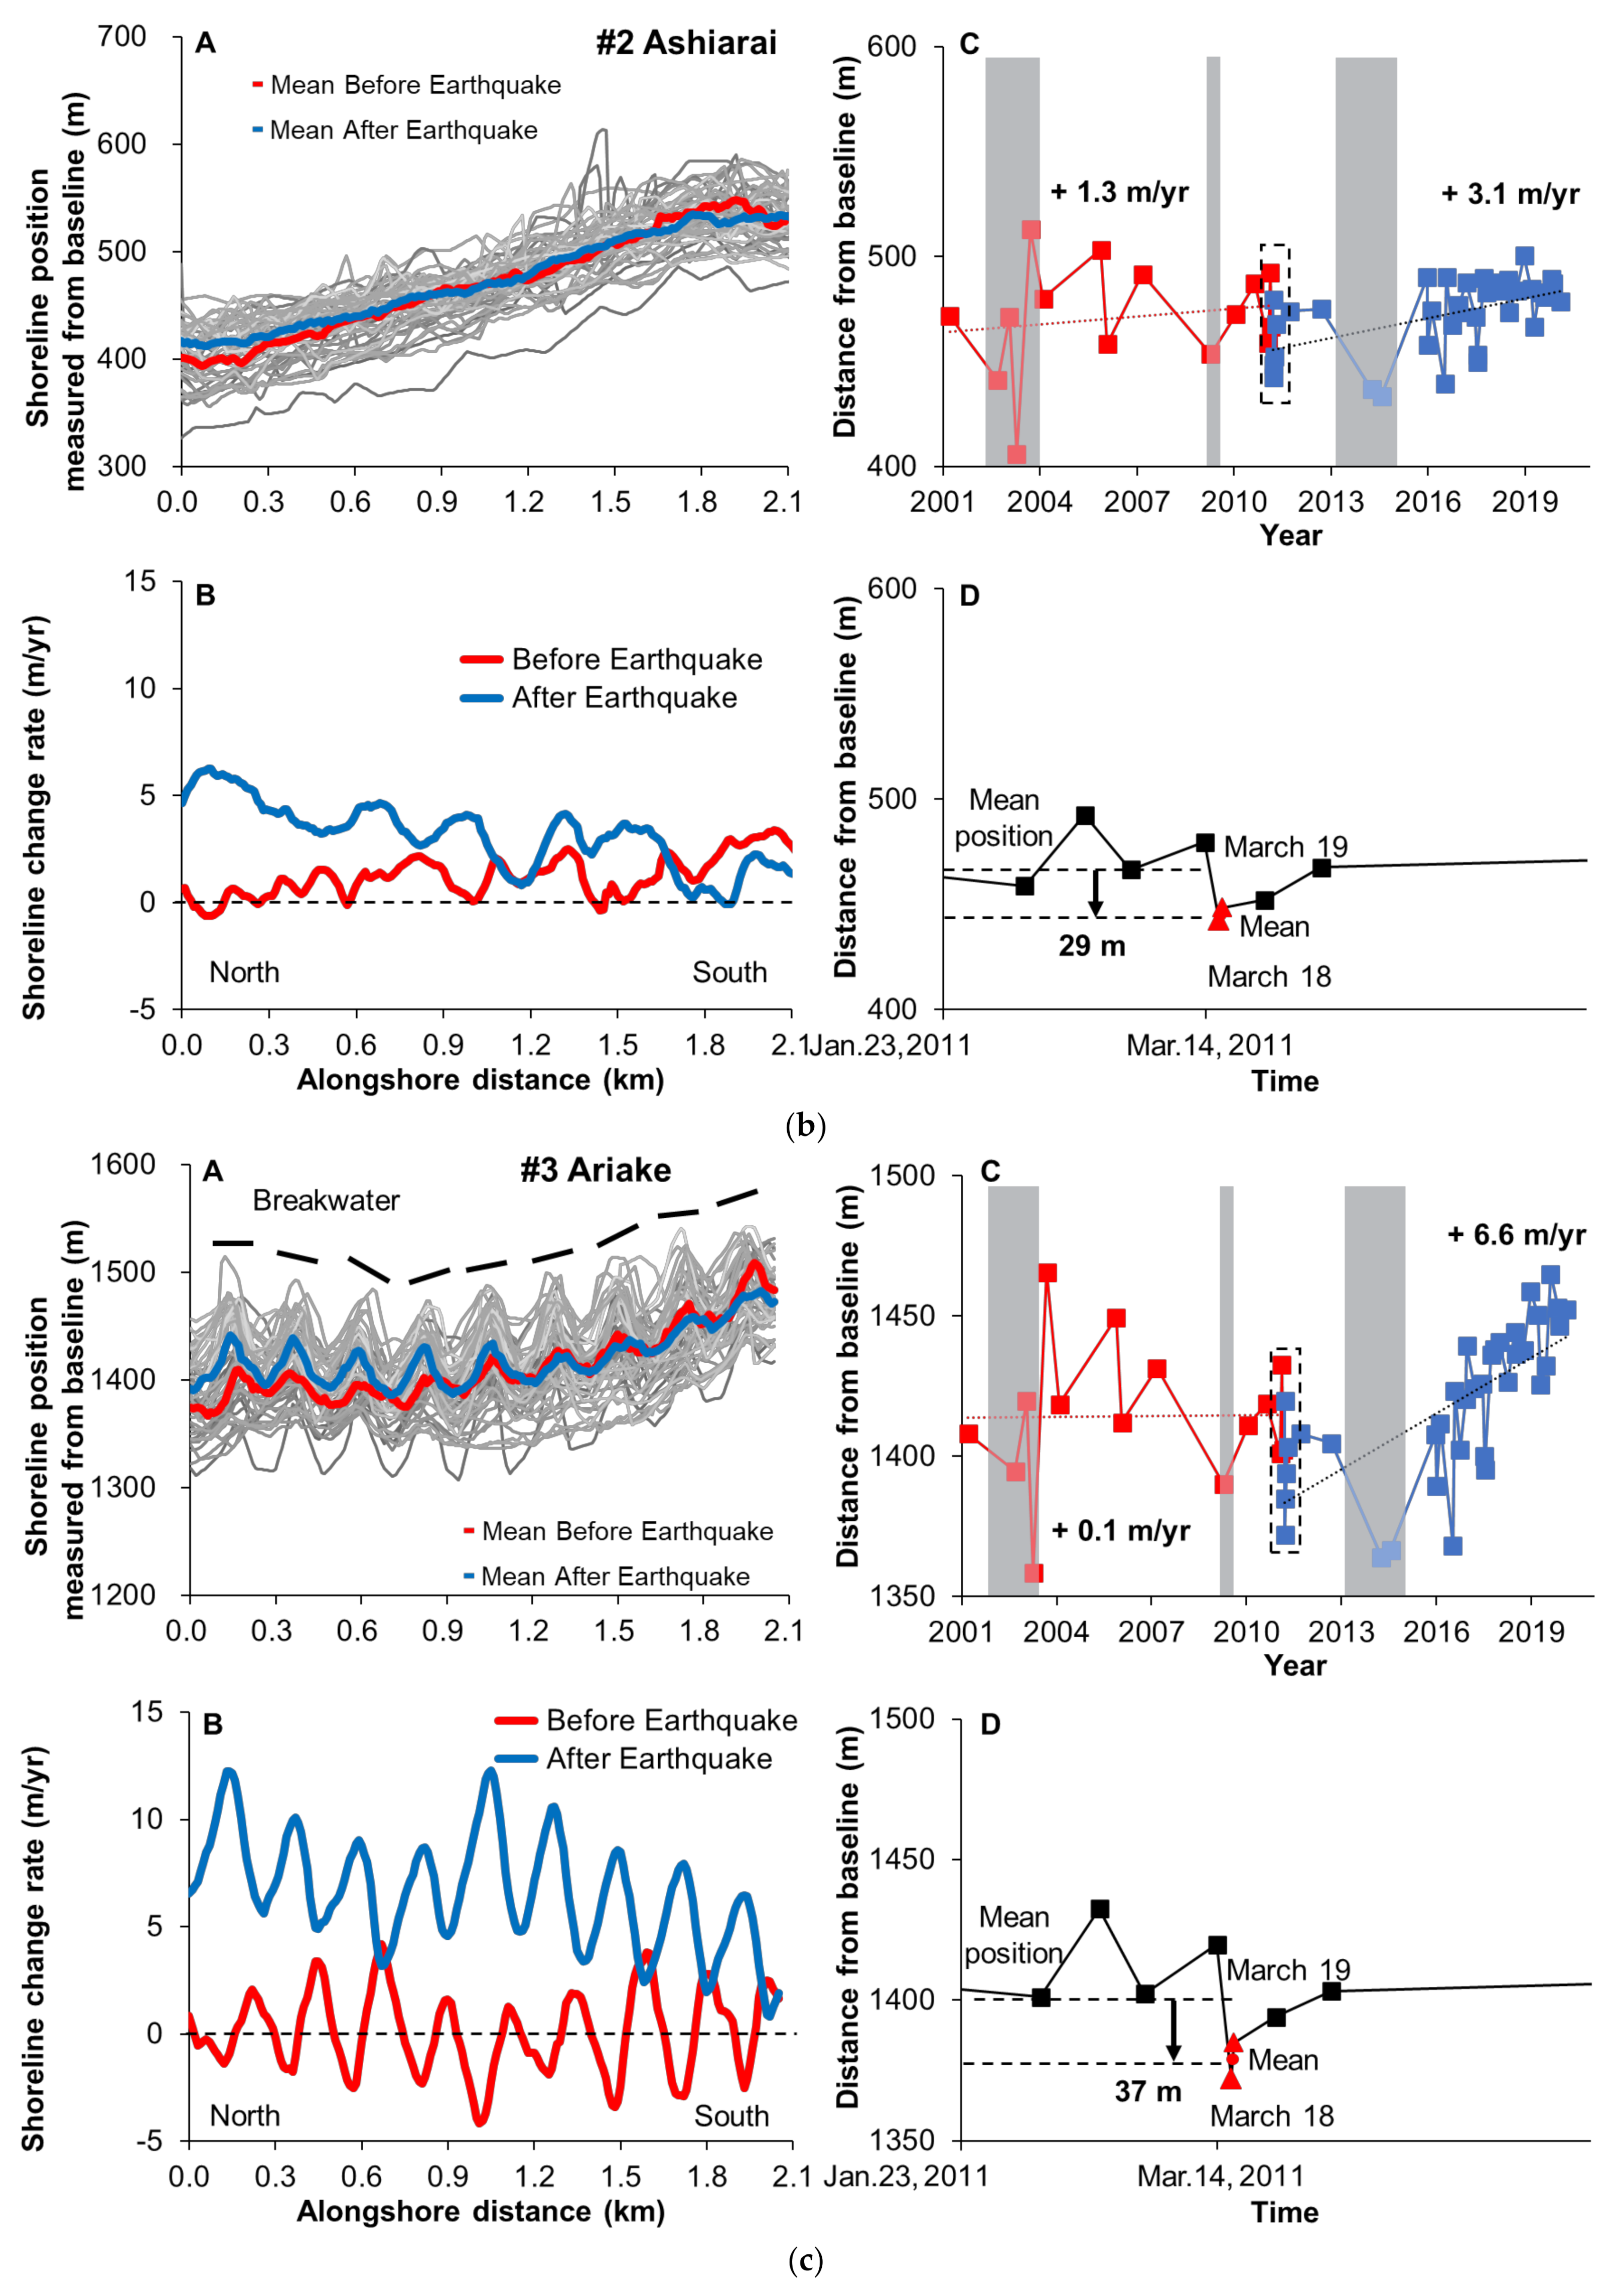
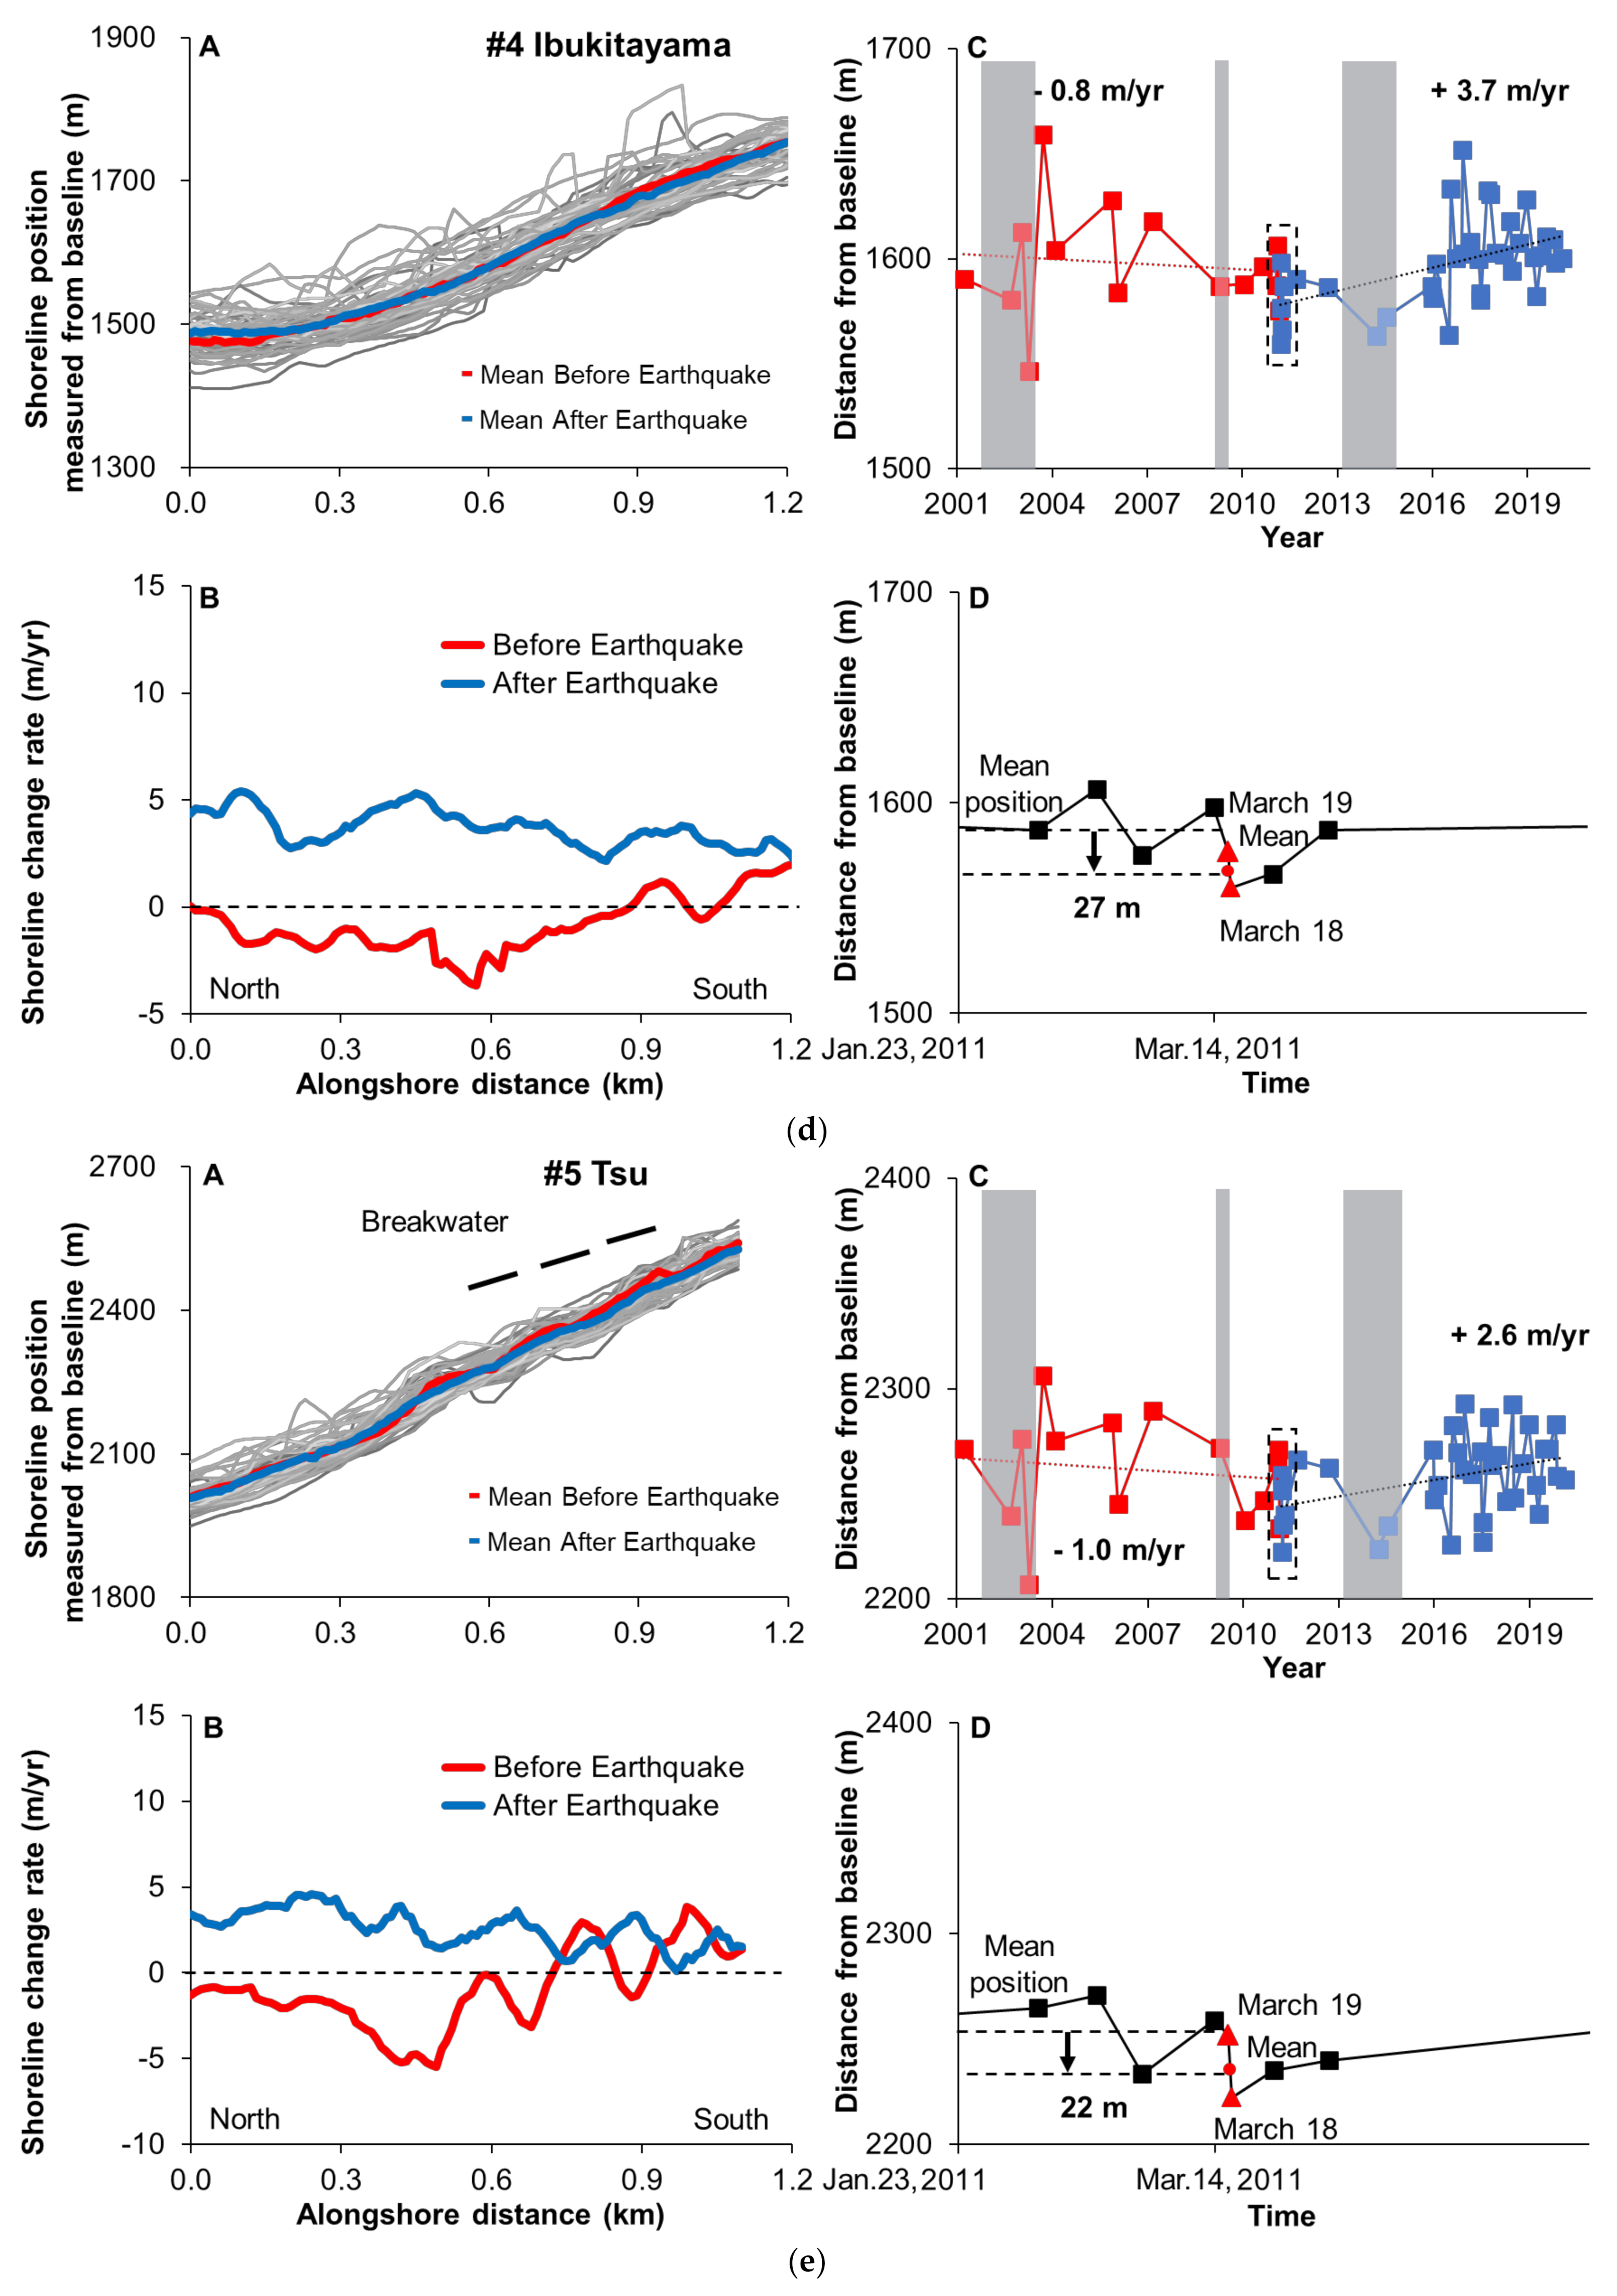
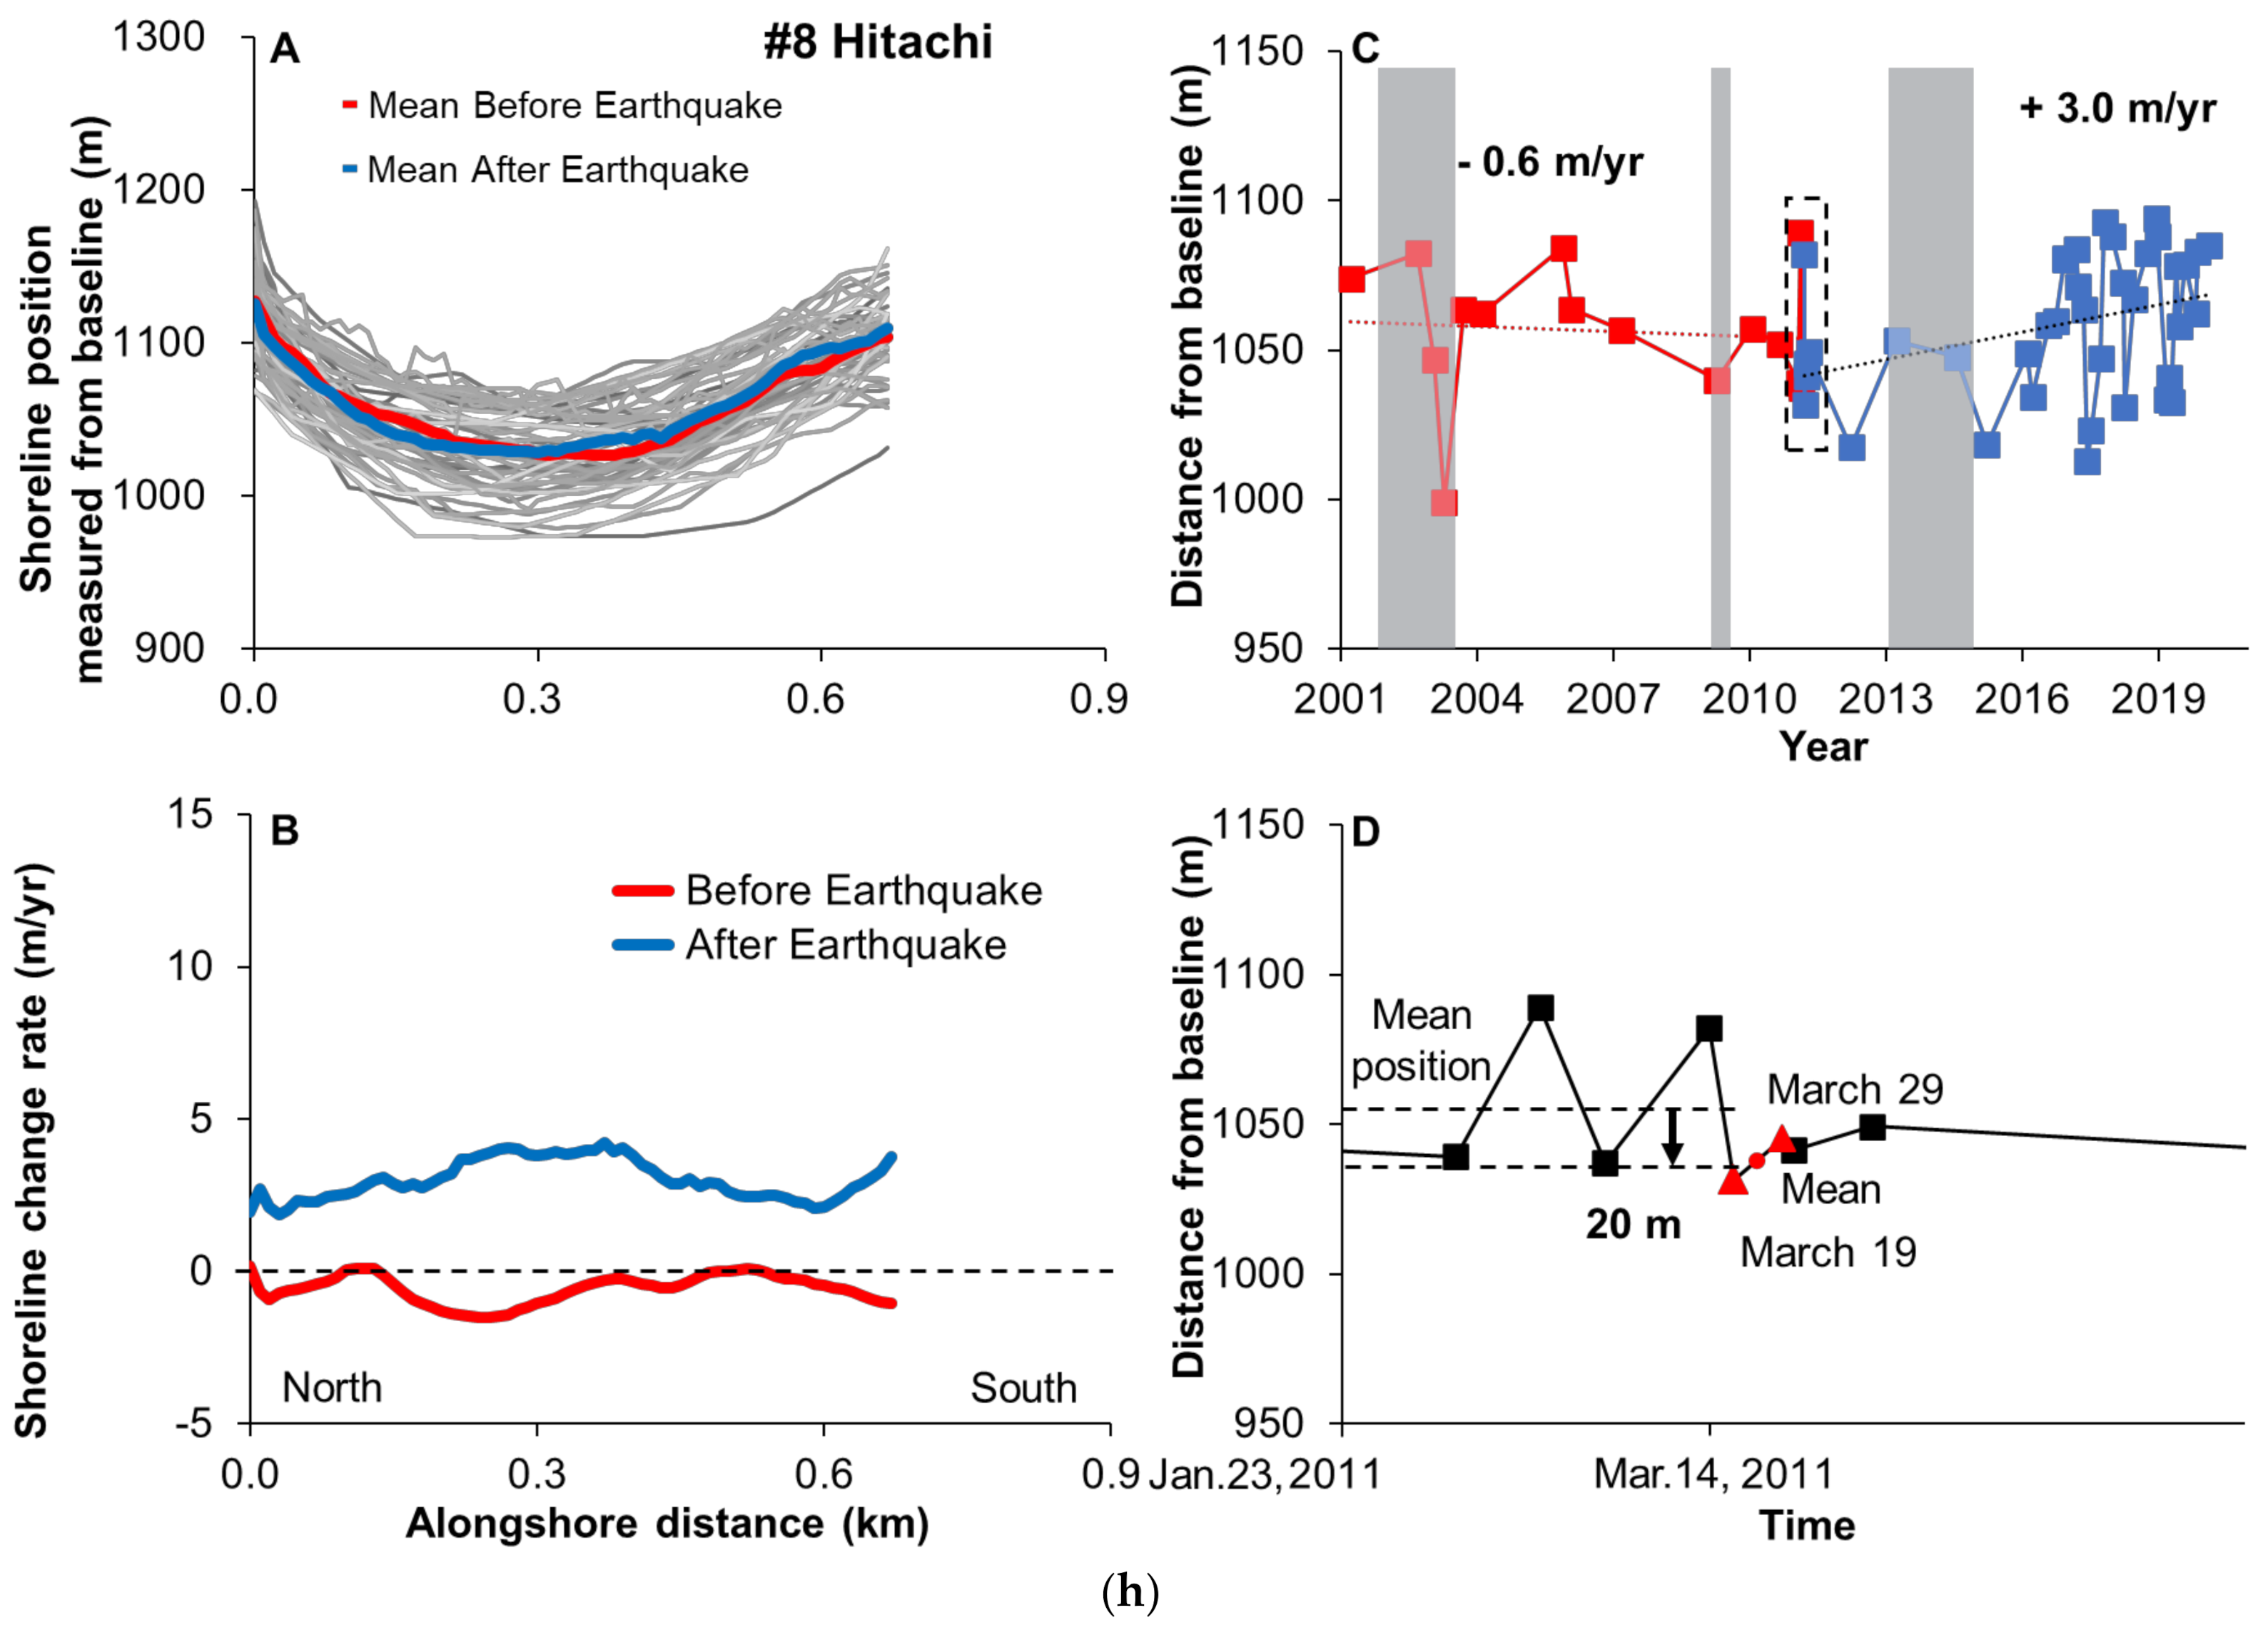
3.2. Shoreline Change before and after the Earthquake

The longshore distribution of shoreline positions determined from satellite images (Panel A) and shoreline change rates based on linear regressions (LRR technique), for periods before and after the earthquake (Panel B) is shown in Figure 6. Temporal variation of mean shoreline position of the whole beach is shown in Panel C, with several of the strongest typhoons recorded, and the enlarged view of the period surrounding the day of the earthquake is shown in Panel D, with the amount of sudden retreat caused by the earthquake.
The shoreline change behavior before and after the earthquake varied significantly. Before the earthquake, the shorelines of the eight sandy beaches were highly fluctuating among the observations, but the average change rates were less than ±1.5 m/year for the decade (2001–2011). Slight differences in the shoreline change rates were identified among the beaches, which were +1.3 m/year for Ashiarai (open beach), +0.1 m/year for Ariake (protected by detached breakwaters), and −0.6 m/year for Hitachi (pocket beach).
There is a substantial erosion (retreat of shoreline) observed in the period 2002–2003, which might be associated with storm response and recovery as the shoreline moved landward and seaward across the entire region. During this period, storm events such as typhoons, including Chataan (2002), Higos (2002), and Etau (2003), occurred, which traveled along the Honshu Island and possibly caused shoreline changes (see Panel C of Figure 6). After significantly retreating in the period of 2002–2003, most sandy beaches quickly recovered thereafter, as observed in 2004 (Panel C of Figure 6).
Shoreline positions obtained shortly before and after the earthquake (January 2011–April 2011) show high fluctuations, up to 50 m between observations (see Panel D of Figure 6). The amount of retreat decreases from north to south; it is about 40 m at the Shimosakurai (northern end), 27 m at the Ibukitayama (middle section), and 20 m at the Hitachi (southern end) (Figure 6).
After the sudden retreat, the shorelines started to recover at different speeds, as shown in Panels B and C of Figure 6. Shorelines have been advancing at speeds much higher than the rates before the earthquake in most of the beaches. The highest rate of shoreline recovery is identified at protected beaches (#3 and #7, except #5), followed by the open (#2, and #4, except #1 and #6) and pocket beaches (#8).
Specifically, the shoreline at Ariake (Figure 6c, #3) is strongly influenced by the group of detached breakwaters and shows a very high rate of shoreline change (+6.6 m/year), compared to other beaches. Higher rates of shoreline change along the coast were observed right behind each detached breakwaters and lower ones at the gaps (see Panel A of Figure 6c). It is notable that the subsided breakwaters of this beach were repaired (2016–2019) to regain the original crest heights. A similar trend was also observed at Higashi–Kanesawacho (#7, +4.6 m/year), where the beach is protected by a breakwater system. On the contrary, the rate of shoreline recovery at Tsu (#5, +2.6 m/year) is not as high as the other protected beaches, in spite of a group of breakwaters implemented. This might be related to the location of the beach, which is close to the rocky cape (Kawajiri Cape), located in the southern end of the beach. Note that the wave rose diagram in the Figure 4 indicates that the waves come mostly from the south-east direction. With such wave conditions, the direction of dominant longshore sediment transport is probably from the south to the north. We speculate this headland interrupts/reduces longshore sediment transport from the southern region, and the beach has no major sediment supply.
Lower shoreline change rates were observed at open beaches without sediment supply from rivers: +3.1 m/year and +3.7 m/year estimated at Ashiarai (Figure 6b, #2) and Ibukitayama (Figure 6d, #4), respectively. Similarly, the speed of shoreline recovery was +3.0 m/year observed at Hitachi (#8, Figure 6h), which is a pocket beach. It is noted that the shoreline change rate observed at Shimosakurai (#1, open beach) is higher (+5.8 m/year) than the other open beaches, which is maybe due to sediment supply from the Okita river, which flows into the northern end of the beach. The length of this river is approximately 30 km, and area of the catchment is approximately 195 km2. Although the catchment is developed to a certain extent, we think the river still supplies some sediment to the coast. Kokubucho (#6), an open beach, has the longest shoreline (2.7 km) among the eight sandy beaches with high rate of shoreline change (+5.1 m/year). The combined influences of a sea dike system along the coast, breakwaters implemented at the northern and southern ends, and sediment supplies from small channels are the possible factors governing the shoreline advancement.
As can be seen from Panel C of Figure 6, the shorelines affected by a single or a series of typhoons quickly recovered thereafter these events in periods lasting from few months to less than one year. However, most of the sandy beaches took a lengthier period for their recovery process, ranging from two to four years after the earthquake.
If we carefully inspect the temporal variation, the shorelines slightly recovered between 2011 and 2015, and then accelerated accretion was observed from 2015 to present.

4. Discussion

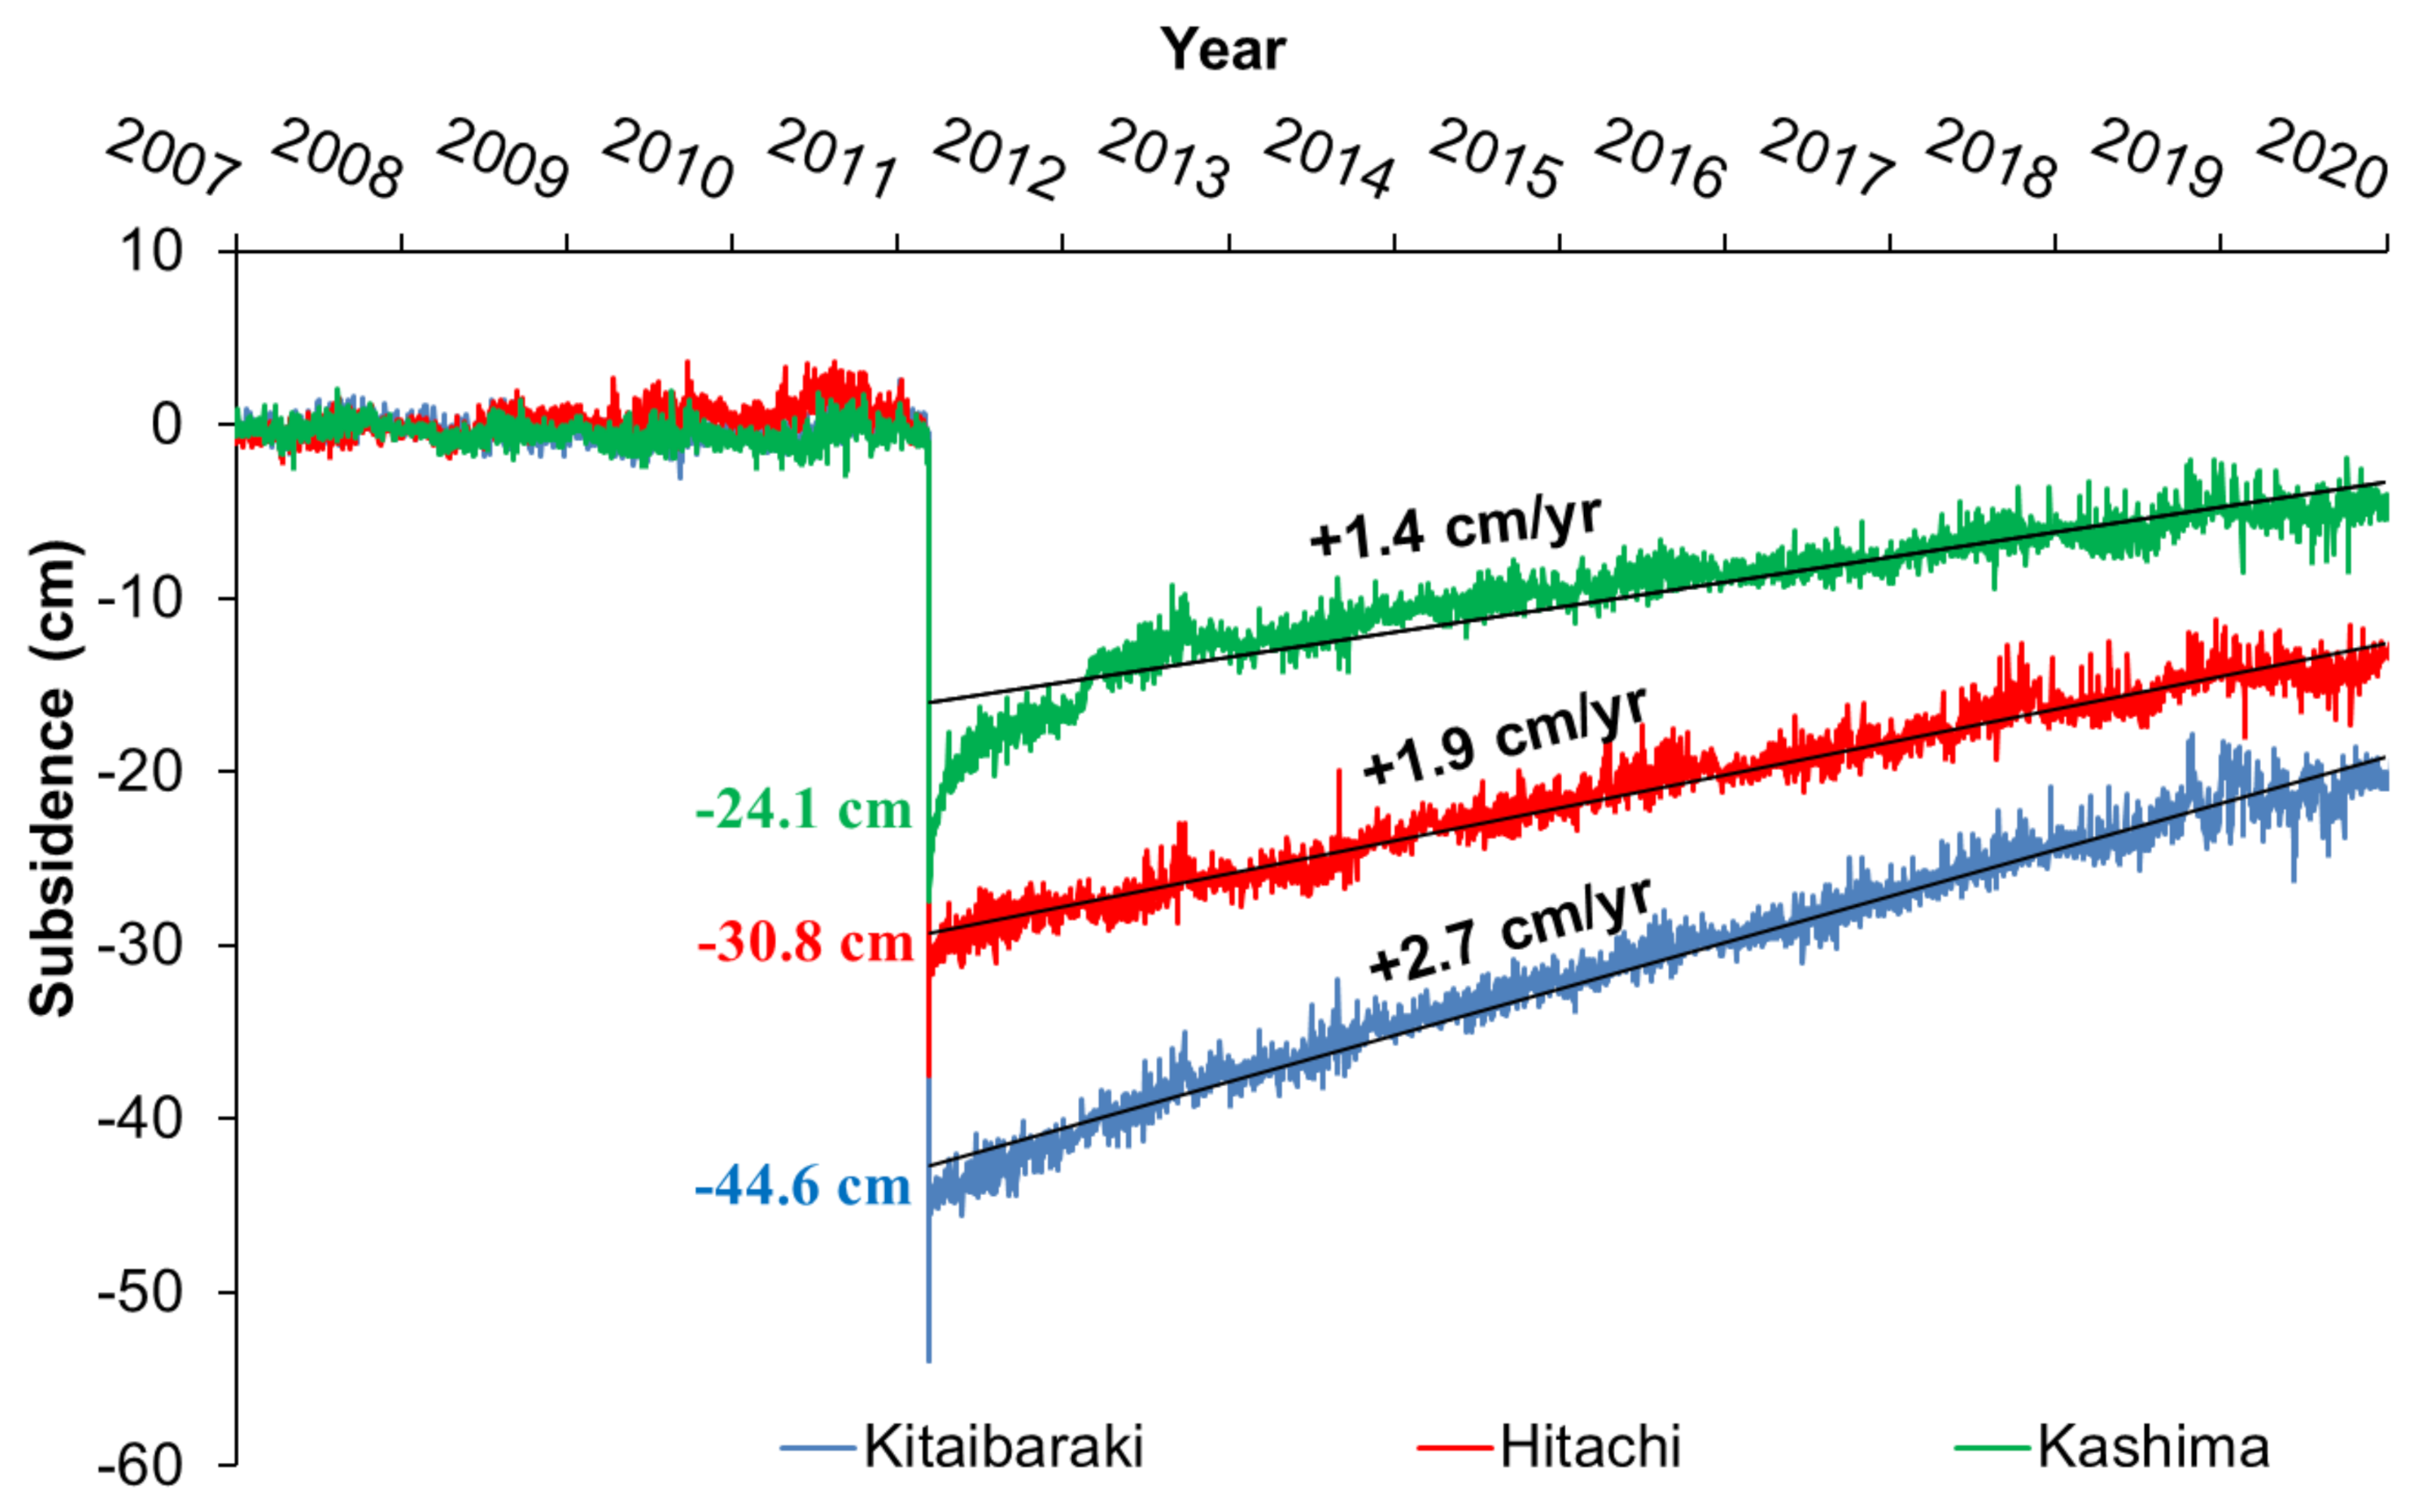
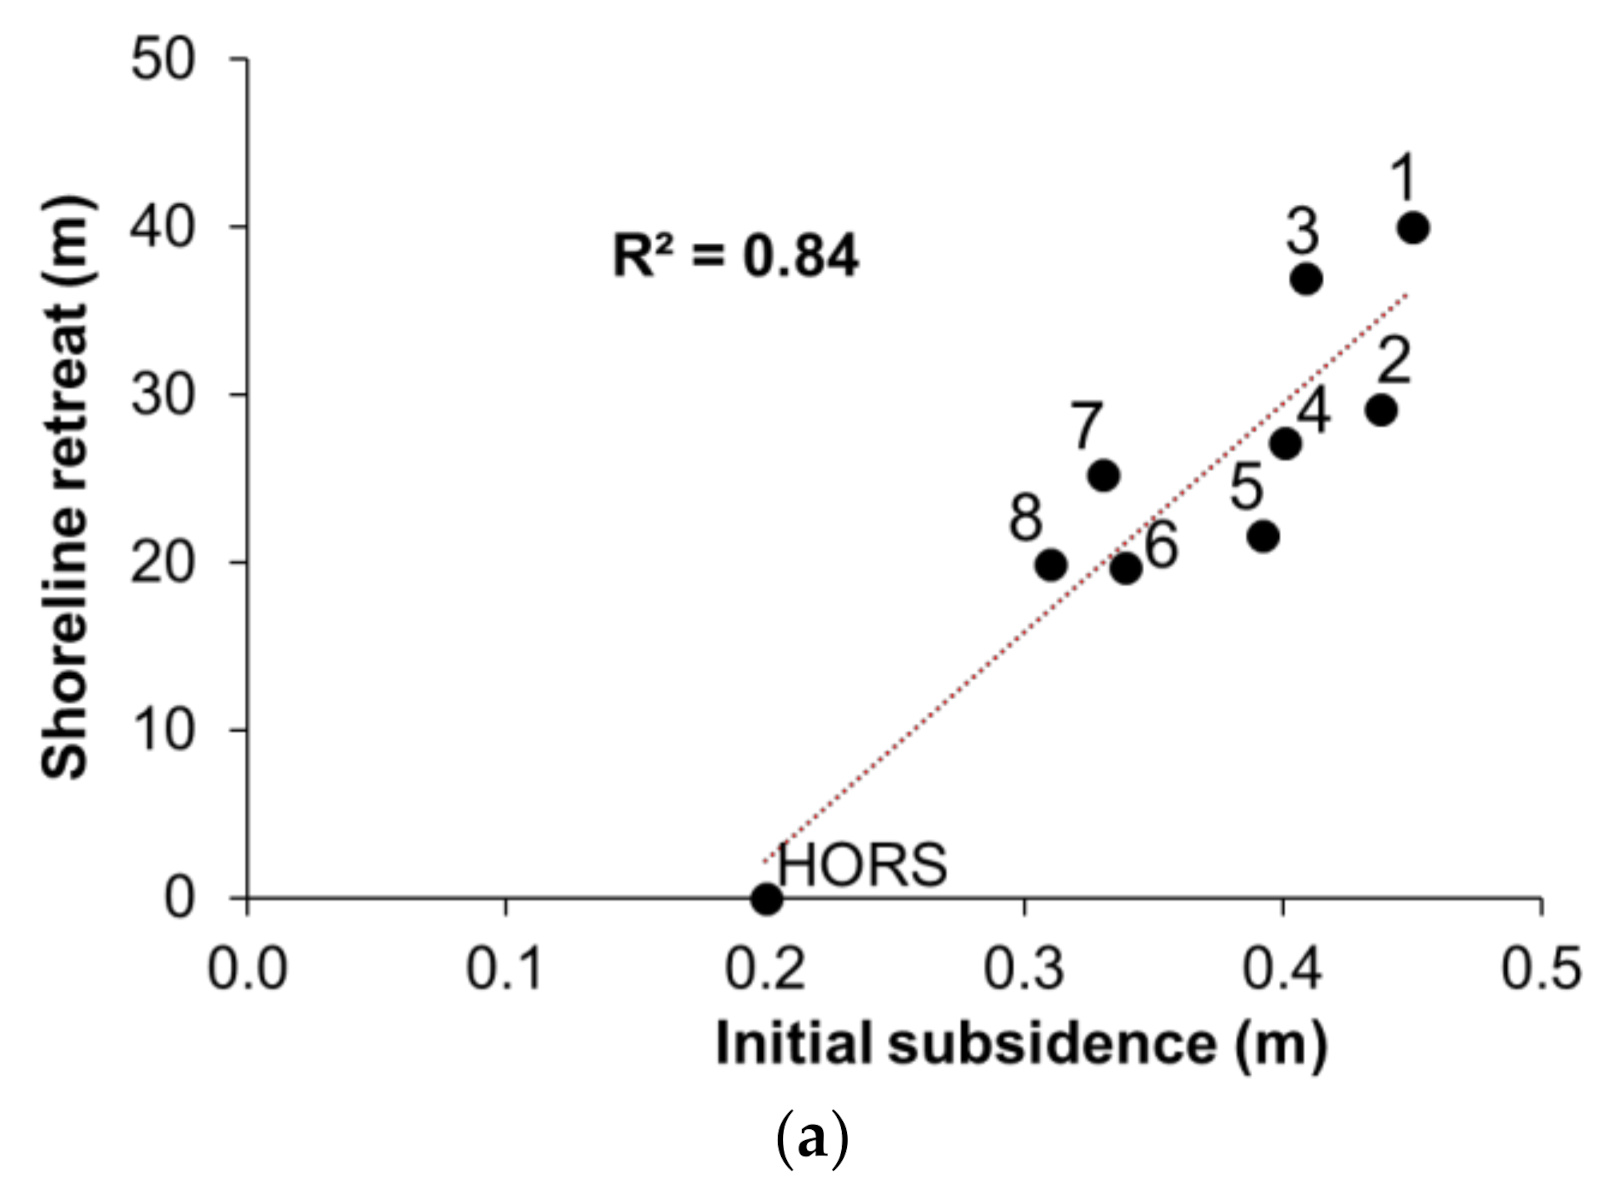
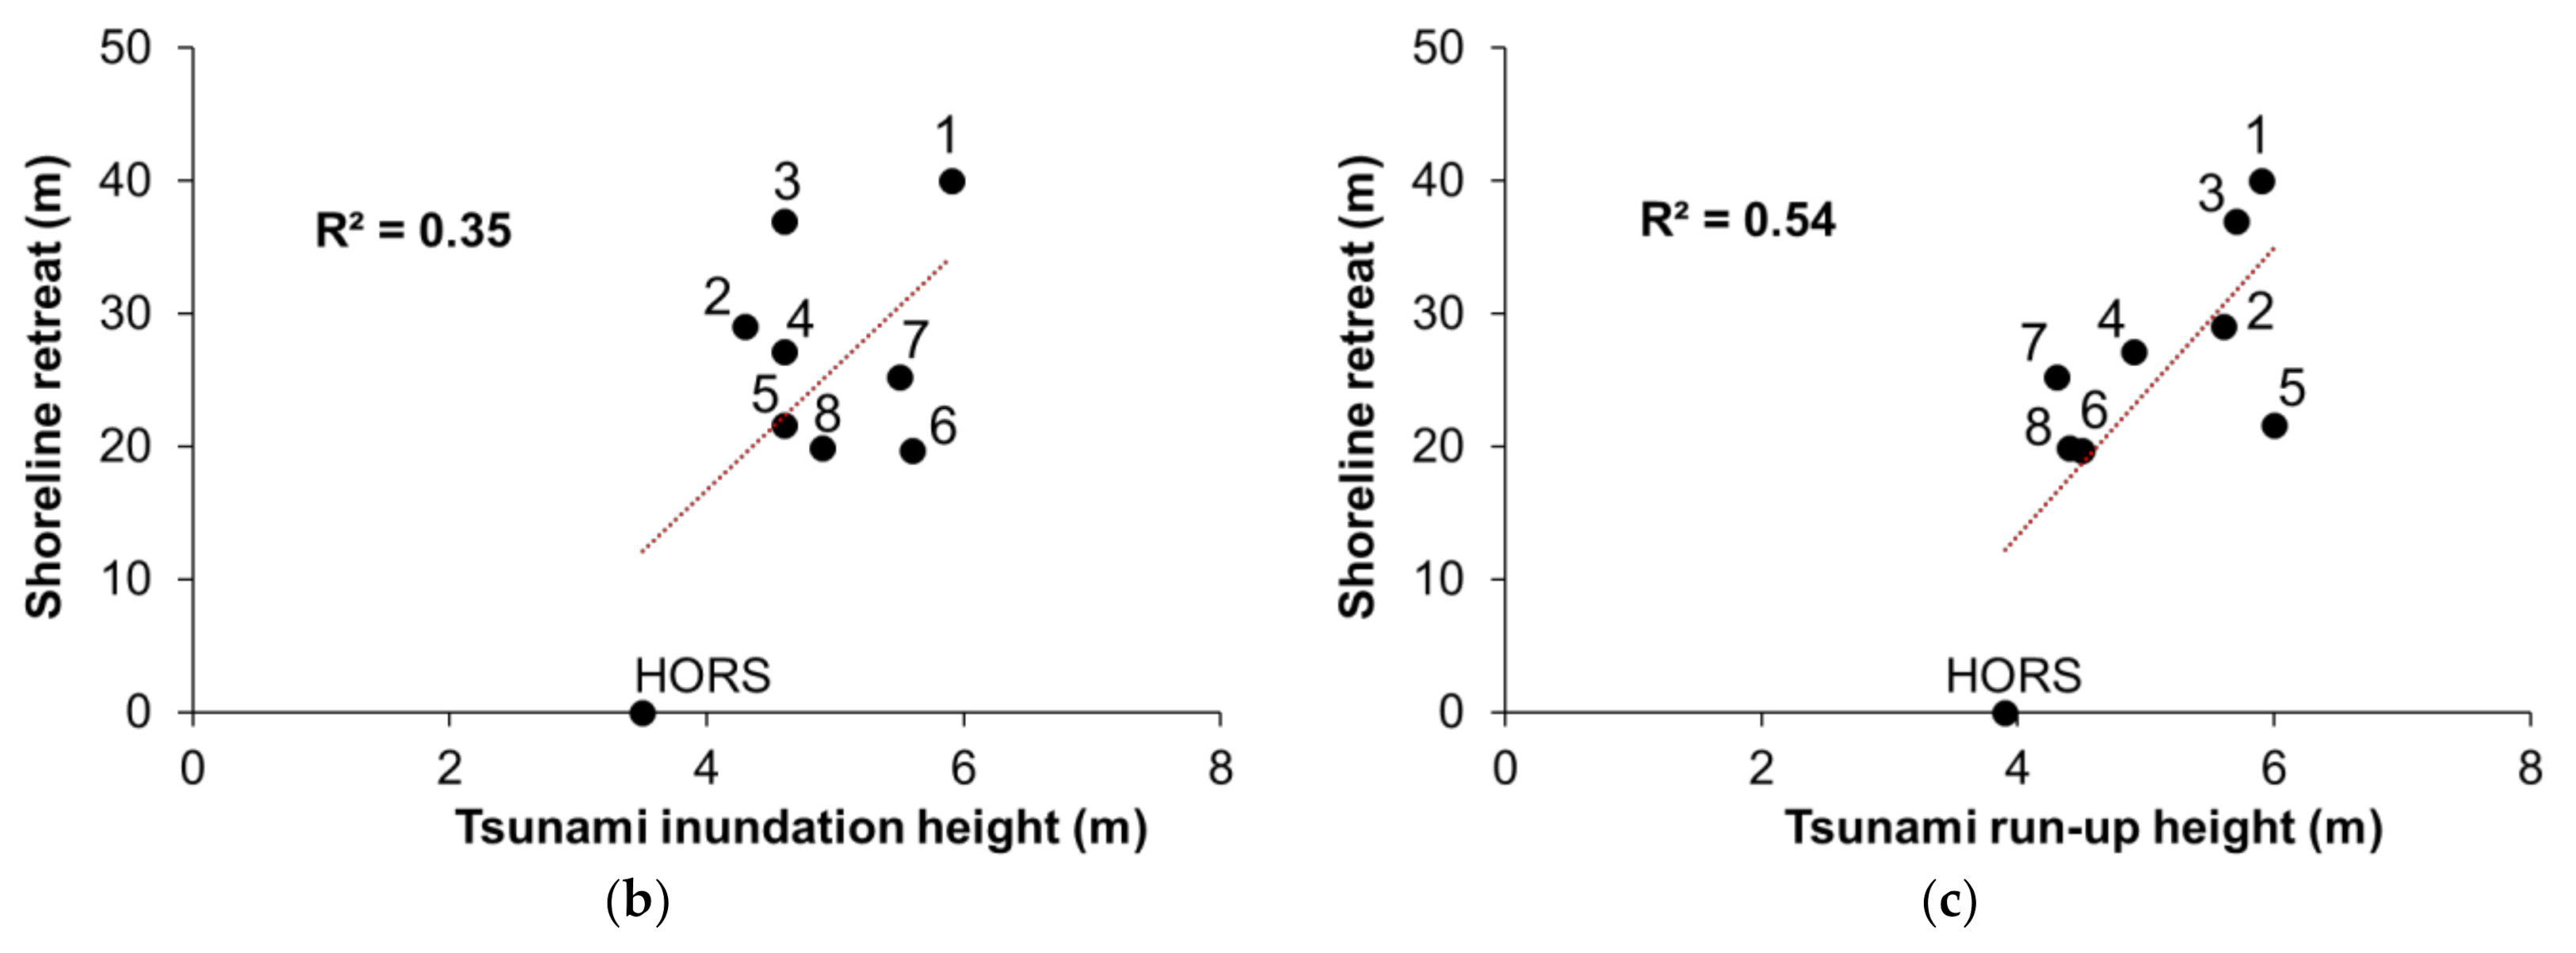
4.1. Shoreline Change: Retreat Due to Subsidence and Tsunami

In order to elucidate the major causes of the initial retreat of shoreline right after the earthquake, we discuss the relationships between sudden subsidence, tsunami, and shoreline change.
A very high correlation (squared correlation coefficient, R2 = 0.84) between the amount of sudden retreat and subsidence was observed, as shown in Figure 7a. Based on the estimation, the retreats were reducing from north to south (from #1 to #8, the Figure 7), which may be dependent on cross-shore sediment transport generated by sudden subsidence, or relative sea level rise, as reported in Hoang et al., (2019) [12]. A regular survey on shoreline position at the Hasaki Research Pier (HORS), located approximately 100 km south of Ibaraki, reports that the coast did not experience an obvious retreat, while subsidence caused by the earthquake was approximately 0.2 m [13].
Relationships between the tsunami inundation height as well as run-up height and the amount of shoreline retreat are presented in Figure 7b,c, respectively. A weak correlation between tsunami inundation height and shoreline retreat was observed, whilst a moderate correlation was found for the relationship between tsunami run-up height and the amount of retreat. From these comparisons, we regard that the coast was eroded mainly due to the initial subsidence.
An attempt was made to estimate the amount of shoreline retreat at every beach by dividing the initial subsidence by beach slope, which is based on the Bruun Rule’s concept [14]. The result, however, could not explain consistently the observed shoreline retreats. To establish a better correlation, we have to consider distribution of alongshore beach profiles, which is not available at this moment.
The amount of sudden shoreline retreats along the northern Ibaraki Coast is compared with previous studies conducted in Iwate and Miyagi Prefectures (see Figure 1). Tanaka et al., (2012) analyzed aerial photos to estimate the shoreline changes (generated by the earthquake) at the Nanakita River located in Sendai Coast and showed that the shoreline retreated up to 150 m. An inundation height of the tsunami around the Nanakita River mouth was about 15 m [1], while it was about 3.5–6.5 m in the northern Ibaraki Coast [4]. Udo et al., (2016) reported that the shoreline retreated up to 100 m at the Fudaihama Beach, located in Sendai Coast, mainly caused by the tsunami effect; the shoreline retreated to 500 m at the Takata Beach, located in Sendai Coast, caused by the effects of both subsidence and tsunami. In Iwate and Miyagi (Figure 1), the amount of shoreline retreat ranged from 100 m to 500 m, which is due to the effects of subsidence and tsunami [3].

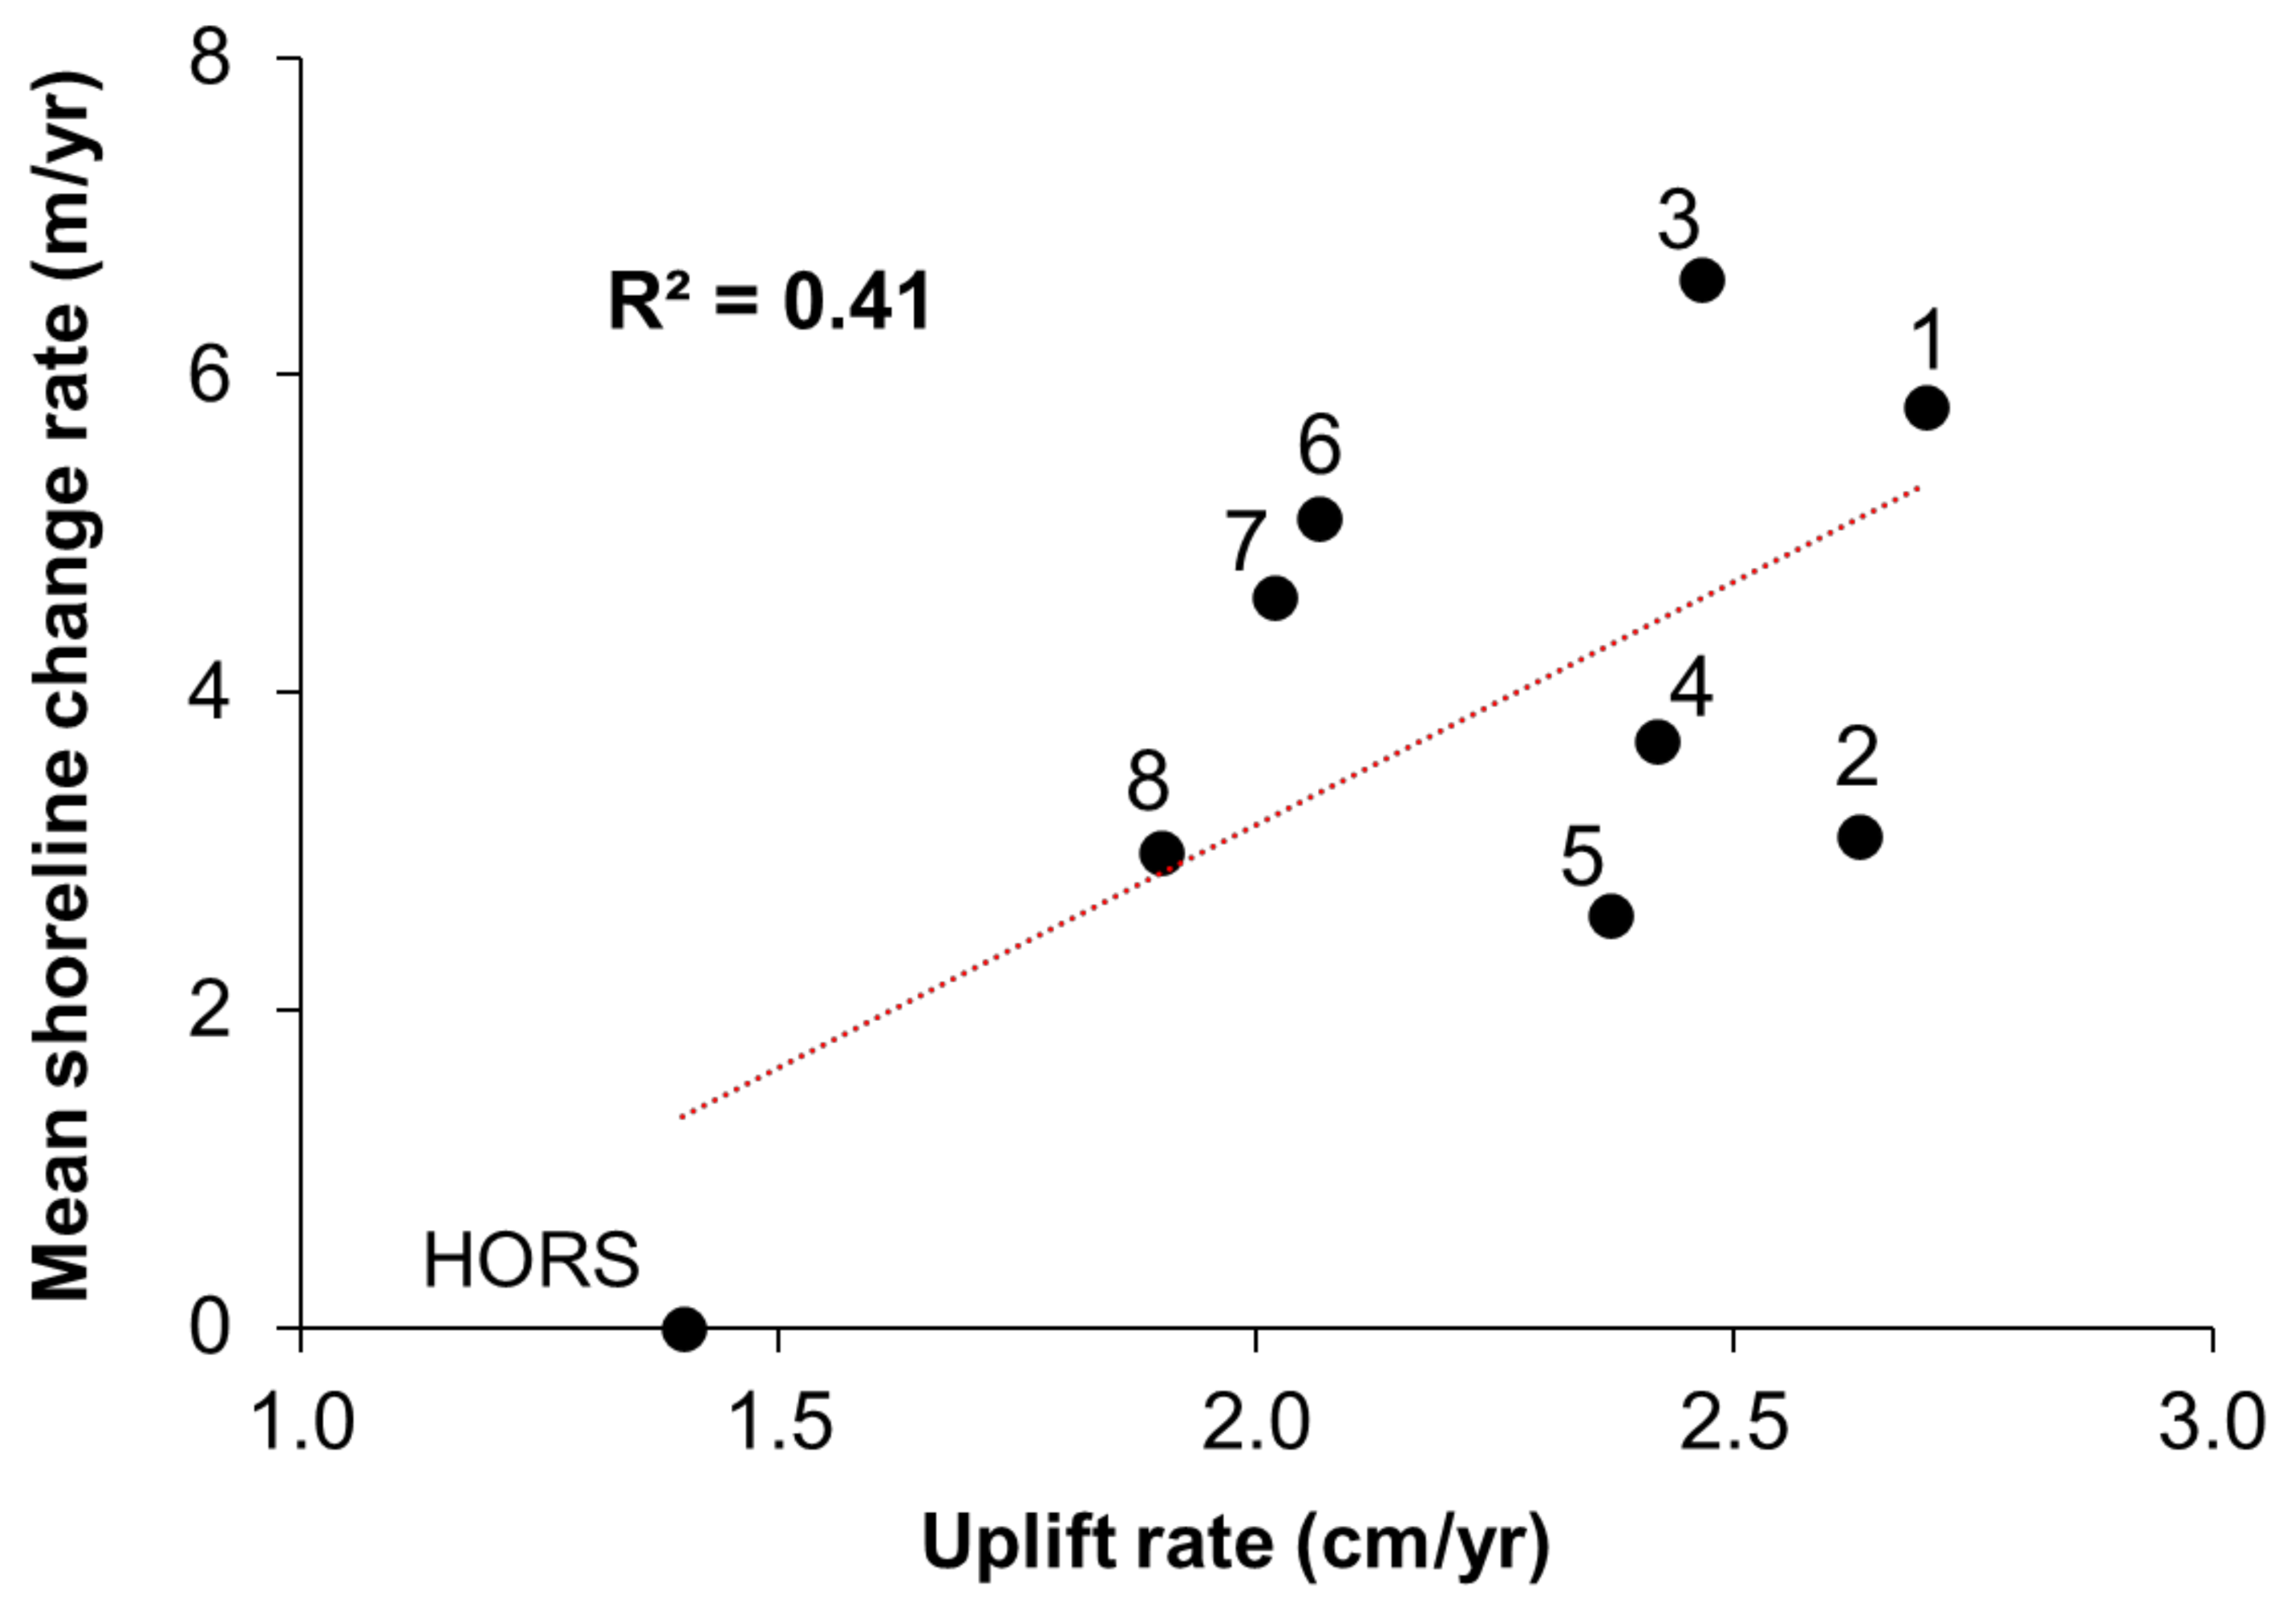
4.2. Shoreline Change: Recovery after the Earthquake

After the earthquake, the land surface along the Ibaraki Coast uplifted at different rates, which were +2.7 cm/year, +1.9 cm/year, and +1.4 cm/year measured at Kitaibaraki, Hitachi, and Kashima GNSS stations, respectively. Figure 8 shows a moderate correlation between the recovery speeds of the beaches after the earthquake and the uplift rates of the land. This implies that the land surface uplift is not the only factor governing the shoreline recovery process, and it is probably dependent on other coastal processes, and human-made structures such as seawalls, wave-dissipating blocks, detached breakwaters, etc. There is no major river flowing into the study area (except the Okita river in the Shimosakurai Beach), and the sediment supply from minor rivers (small channels) is probably insignificant. The beaches were changing into new states in different manners influenced by the cross-shore and/or longshore sediments, depending on various shore conditions, which is not yet fully understood.
As mentioned, there was an acceleration in the rate of shoreline change observed in the period between 2011 and 2015. Even though the reason for this is not known exactly, this may be due to complex coastal processes caused by cross and longshore sediment and a relative sea level drop. Specifically, most of the beaches had retreated landward in the period 2013–2014 and recovered thereafter. Similar to the period 2002–2003, several typhoons were recorded in the period 2013–2014, including Man-yi (2013), Wipha (2013), Neoguri (2014), Phanfone (2014), and Vongfong (2014) etc., that travelled along the Honshu Island. It is likely that the cross-shore variety of shoreline position in period 2013–2014 was mainly due to high waves induced during the typhoons. A quick recovery was observed in most of the sandy beaches in the period 2014–2015, after the retreat (Figure 6, Panel C).
Regarding the rate of shoreline recovery after the earthquake, a quick comparison was carried out between the study site and nearby locations in the Sendai area. In Miyagi Prefecture, the areas close to the Kitakamigawa and Natorigawa river mouths quickly recovered after the earthquake, with a recovery rate of approximately 17 m/year, and reached a new equilibrium state. The key natural factors for the recovery of the coasts in Miyagi are the upward crustal deformation after the earthquake and sediment supply from adjacent coasts or rivers after the tsunami [15]. These factors, except the uplift of the ground, could not be expected at the northern Ibaraki Coast. The sediment supply from the rivers and longshore sediment from adjacent areas is less since the beach lengths are relatively short and river mouths are distantly located. Therefore, the recovery speeds of the eroded coasts are slower (+2.6 m/year to +6.6 m/year), compared to the sandy beaches in the Sendai area (+17 m/year). After a decade from the earthquake event, all the shorelines along the northern Ibaraki Coast have recovered to their original positions and are moving seaward.

4.3. Shoreline Change: Remaining Issues

The movement of sediment is a complicated process, which has affected shoreline evolution. However, there is insufficient information on the alongshore and cross-shore sediment movements in the study area, the northern Ibaraki Coast. This leads to the lack of comprehensive and extensive analyses of all possible processes that could have potential impacts on the shoreline, shortly after the earthquake as well as the recovery process thereafter. Therefore, this needs to be further investigated in the future.
Attempting to help the recovery of the coast and reduce the effects of a future tsunami to the hinterland, local governments along the Honshu Island have proposed an earthquake disaster reconstruction plan [12]. For example, the repair of coastal structures (2016–2019), as seen at the Ariake, can be an important factor for shoreline advancement (see Figure 6c). The detached breakwaters may block the sediment being transported in and/or out on the coastal region being studied, and result in accumulation of sediment behind these. However, the exact amount of sediments caught by the detached breakwaters as well as where the sediment comes from (transported by cross or alongshore) are not known clearly.
Along the northern Ibaraki Coast, several portions are under reconstruction with various coastal structures (sea dikes, seawalls, wave-dissipating blocks, etc.) that protect the hinterland behind. Obviously, the recovery of beaches after the earthquake is a complex process with influences of not only cross or alongshore sediment transport, but also human-made structures.

5. Concluding Remarks

This paper has shown the effects of the 2011 Great East Japan Earthquake on shoreline change along the northern Ibaraki Coast, based on various satellite imagery sources (ASTER, ALOS AVNIR-2, and Sentinel 2). Sudden retreats, ranging from 40 to 20 m, were observed along the coast significantly depending on the amount of initial subsidence (−0.45 to −0.31 m). There was no obvious correlation found with tsunami inundation height, while moderate correlation with tsunami run-up height was observed. The sudden retreat was primarily a quick response to land subsidence or an abrupt rise in relative sea level, and secondary to the tsunami caused by the earthquake. After the earthquake, the land started to uplift, with different rates (+2.7 cm/year to +1.9 cm/year). The rates of shoreline recoveries (+2.6 m/year to +6.6 m/year) showed a moderate correlation with the uplift rate. Beach recovery occurred over several years, and is a complex process responding to cross and alongshore sediment transport and the presence of human-made structures that behave as obstacles, and it cannot be understood solely by ground uplift or relative sea level changes.

Author Contributions

The conceptualization of the study and the structuring of the methodology was performed by S.T. and Q.N.H. The manuscript was written by Q.N.H. and edited by S.T. All authors have read and agreed to the published version of the manuscript.

Funding

The study was conducted under The Social Implementation Program on Climate Change Adaptation Technology (SI-CAT) and KAKENHI, both supported by the Ministry of Education, Culture, Sports, Science and Technology, Japan (MEXT).

Institutional Review Board Statement

Not applicable.

Informed Consent Statement

Not applicable.

Data Availability Statement

The data presented in this study are available on request from the corresponding author.

Acknowledgments

We thank two anonymous reviewers and the editor for their insightful comments in narrowing the gap between our claims and the actual content of the present work. In particular, the authors express sincere gratitude to Aggeliki Georgiopoulou for her constructive comments and suggestions that significantly improved the quality of the manuscript. We would like to thank Hiroki Kameda for his support at the beginning of this research.

Conflicts of Interest

No potential conflict of interest was reported by the authors.

References

  1. Tanaka, H.; Tinh, N.X.; Umeda, M.; Hirao, R.; Pradjoko, E.; Mano, A.; Udo, K. Coastal and Estuarine Morphology Changes Induced by the 2011 Great East Japan Earthquake Tsunami. Coast. Eng. J. 2012, 54, 1250010. [Google Scholar] [CrossRef]
  2. Udo, K.; Tojo, K.; Takeda, Y.; Tanaka, H.; Mano, A. Characteristics of shoreline retreat due to the 2011 Tohoku Earthquake and Tsunami and its recovery after three years. In Tsunamis and Earthquakes in Coastal Environments; Springer: Cham, Switzerland, 2016; pp. 113–123. [Google Scholar]
  3. Tojo, K.; Udo, K. Characteristics of Beach Erosion due to the 2011 Tohoku Earthquake and Tsunami and Its Recovery across the Entire Inundated Area. J. Coast. Res. 2016, 75, 1252–1256. [Google Scholar] [CrossRef]
  4. Mori, N.; Takahashi, T. The 2011 Tohoku Earthquake Tsunami Joint Survey Group (2012) Nationwide post event survey and analysis of the 2011 Tohoku earthquake tsunami. Coast. Eng. J. 2012, 54, 1250001. [Google Scholar]
  5. Dao, N.X.; Adityawan, M.B.; Tanaka, H.; Sundar, V. Sensitivity analysis of relationship between tsunami disaster and coastal embankment structure. J. Jpn. Soc. Civ. Eng. Ser. B1 Hydraul. Eng. 2014, 70, I_43–I_48. [Google Scholar] [CrossRef] [Green Version]
  6. Tanaka, H.; Mitobe, Y.; Mori, A. Impact of the 2011 tsunami on the littoral system around offshore breakwaters on Sendai Coast. In Proceedings of the 8th International Conference on Scour and Erosion, Oxford, UK, 12–15 September 2016; CRC Press: Boca Raton, FL, USA, 2016; p. 349. [Google Scholar]
  7. Udo, K.; Ranasinghe, R.; Takeda, Y. An assessment of measured and computed depth of closure around Japan. Sci. Rep. 2020, 10, 1–8. [Google Scholar] [CrossRef] [PubMed] [Green Version]
  8. Do, A.T.; De Vries, S.; Stive, M.J. Beach Evolution Adjacent to a Seasonally Varying Tidal Inlet in Central Vietnam. J. Coast. Res. 2018, 34, 6–25. [Google Scholar] [CrossRef] [Green Version]
  9. Maglione, P.; Parente, C.; Vallario, A. Coastline extraction using high resolution WorldView-2 satellite imagery. Eur. J. Remote Sens. 2014, 47, 685–699. [Google Scholar] [CrossRef]
  10. Himmelstoss, E.A.; Henderson, R.E.; Kratzmann, M.G.; Farris, A.S. Digital Shoreline Analysis System (DSAS) version 5.0 user guide. Open-File Rep. 2018, 2018, 110. [Google Scholar] [CrossRef] [Green Version]
  11. Nassar, K.; Mahmod, W.E.; Fath, H.; Masria, A.; Nadaoka, K.; Negm, A. Shoreline change detection using DSAS technique: Case of North Sinai coast, Egypt. Mar. Georesources Geotechnol. 2019, 37, 81–95. [Google Scholar] [CrossRef]
  12. Hoang, V.C.; Tanaka, H.; Mitobe, Y. Morphological recovery of beach severely damaged by the 2011 great east Japan tsuna-mi. Estuar. Coast. Shelf Sci. 2019, 226, 106274. [Google Scholar] [CrossRef]
  13. Yanagishima, S.-I. Reason why topography change by tsunami run-up of 2011 Tohoku earthquake is small in Hasaki coast. J. Jpn. Soc. Civ. Eng. Ser. B2 Coast. Eng. 2012, 68, I_706–I_710. [Google Scholar] [CrossRef] [Green Version]
  14. Bruun, P. The Bruun rule of erosion by sea-level rise: A discussion on large-scale two-and three-dimensional usages. J. Coast. Res. 1988, 4, 627–648. [Google Scholar]
  15. Udo, K.; Takeda, Y.; Tanaka, H. Coastal Morphology Change Before and After 2011 Off the Pacific Coast of Tohoku Earthquake Tsunami at Rikuzen-Takata Coast. Coast. Eng. J. 2016, 58, 1640016-1. [Google Scholar] [CrossRef] [Green Version]
Figure 1. (a) Locations of the study area (left panel) and eight sandy beaches: #1 Shimosakurai, #2 Ashiarai, #3 Ariake, #4 Ibukitayama, #5 Tsu, #6 Kokubucho, #7 Higashi-Kanesawacho, and #8 Hitachi, with the amount of subsidence due to the earthquake (right panel). The black line behind the coast represents the baselines (left panel). Red triangles shown in the panel of Ariake (#3) represent locations of beach profile surveys. Detached breakwaters have been implemented in the Ariake, Tsu, and Higashi-Kanesawacho. (b) Crustal deformation after the Great East Japan Earthquake (M9.0); GNSS observation stations at Kitaibaraki, Hitachi, and Kashima by Geospatial Information Authority of Japan (GSI) (blue, red, and green points, respectively). The contour lines represent the amount of initial subsidence caused by the earthquake (unit: cm). The red star represents the earthquake epicenter.
Remotesensing 13 01399 g001
Figure 2. Acquisition date and tide level for each satellite observation for the northern portion (51 images).
Remotesensing 13 01399 g002
Figure 3. Land surface deformation measured at GNSS observation stations at Kitaibaraki, Hitachi, and Kashima by GSI (blue, red, and green points, respectively, as given in Figure 1). The amount of initial subsidence is defined as the mean subsidence shortly after the earthquake (12 March 2011–31 March 2011). Recovery rates are estimated by linear regressions.
Remotesensing 13 01399 g003
Figure 4. Significant wave height and its direction in the period from January 2001 to December 2018 observed at Hitachinaka port, nearby the Hitachi Beach (#8).
Remotesensing 13 01399 g004
Figure 5. Variation of shoreline positions between observed and satellite-derived shorelines for locations at the north (a) and south (b) of Ariake. Locations of beach profile survey are depicted in the sub-panel of Figure 1a. The time-series of satellite-derived shoreline variability and trends exhibit reasonable agreement with the in-situ surveys (R2 = 0.4). Names and years of typhoons travelled along the Honshu Island are attached.
Remotesensing 13 01399 g005
Figure 6. Variations of shoreline positions of the eight sandy beaches, from sub-figures (ah). Panel A represents shoreline positions determined from the images. Panel B shows shoreline change rates based on linear regressions, for periods before and after the earthquake. Panel C shows temporal variation of mean shoreline position of the beach and shoreline change rates based on linear regressions of the periods before (red dotted line) and after (blue dotted line) the earthquake. Light blue stripes represent the periods recorded when strong typhoons occurred, as shown in the Figure 5. Panel D represents an enlarged view of the period shortly before and after the earthquake (January 2011–April 2011). Red triangles denote the data acquisitions taken shortly after the earthquake, and the red dot is their average.
Remotesensing 13 01399 g006aRemotesensing 13 01399 g006bRemotesensing 13 01399 g006cRemotesensing 13 01399 g006dRemotesensing 13 01399 g006e
Figure 7. (a) Sudden shoreline retreats due to initial subsidence caused by the earthquake. Data at Hasaki Research Pier (HORS) were used in the regression procedure because the beach is sandy, with available information about initial subsidence, tsunami height, and land uplifting rate. (b,c) Correlation between amount of sudden retreat and tsunami inundation height and tsunami run-up height. Number in the circle denotes sandy beach, and the radius of the circle is proportional to the amount of retreat.
Remotesensing 13 01399 g007aRemotesensing 13 01399 g007b
Figure 8. Shoreline recovery rate and rate of uplift along the coast after the earthquake (numbers represent sandy beaches).
Remotesensing 13 01399 g008
Publisher’s Note: MDPI stays neutral with regard to jurisdictional claims in published maps and institutional affiliations.

