Article

Monitoring and Evaluating Restoration Vegetation Status in Mine Region Using Remote Sensing Data: Case Study in Inner Mongolia, China

1
China Aero Geophysical Survey and Remote Sensing Center for Natural Resources, Beijing 100083, China
2
School of Earth Sciences and Resources, China University of Geosciences-Beijing, Beijing 100083, China
3
School of Geoscience and Surveying Engineering, China University of Mining and Technology-Beijing, Beijing 100083, China
*
Author to whom correspondence should be addressed.
Remote Sens. 2021, 13(7), 1350; https://doi.org/10.3390/rs13071350
Submission received: 9 February 2021 / Revised: 17 March 2021 / Accepted: 25 March 2021 / Published: 1 April 2021

Abstract

:
The ecological restoration of mining areas is very important, and repeated field surveys are inefficient in large-scale vegetation monitoring. The coal mining industry is currently facing the challenge of the lack of appropriate methods for monitoring restoration processes. This study used an open pit coal mine in Dongsheng District, Inner Mongolia, China as an example, and used the 2011–2018 Landsat TM/ETM+ and OLI images to monitor and evaluate vegetation restoration activity of the coal mine. The average value of the monthly maximum value of vegetation index in the growing season was selected as the basic indicator for studying vegetation and bare soil changes. The growth root normalized differential vegetation index (GRNDVI) and GRNDVI anomaly method indicated that the constructed land type change factor was used to study the growth of mine vegetation and change of the range of bare land in the entire mining region. We found that westward mining activities started from 2012, and vegetation was restored in the eastern original mining region from 2013. The restoration vegetation areas from 2015 to 2016 and from 2017 to 2018 were larger than those in the other restoration years. Moreover, areas of expanded bare land from 2011 to 2012, and from 2017 to 2018 were larger than those in the other expansion years. The restoration vegetation growth changes were compared with those of the natural vegetation growth. Results showed that the restoration vegetation growth trend was considerably similar with that of the natural vegetation. Inter-annual restoration effects were analyzed by constructing the effect of the area-average factor and using vegetation growth data. Accordingly, the restoration vegetation effects were best in 2014 and 2016. Comprehensive restoration effect was analyzed using the weighted evaluation method to obtain the overall restoration effects of the coal mine. Results showed that the comprehensive restoration effect is inclined to the inferior growth state. This study conducted a preliminary evaluation of mine restoration vegetation, thereby providing a promising way for the future monitoring and evaluation of such processes.

1. Introduction

Coal is an important natural resource of China, and the coal mining industry is an indispensable back-up force for the country’s economic development, thereby playing an important role in social development in China [1]. Open pit mine is considered as a degradation of the environment through pit, spoil tip, and water plate damage [2,3]. Consequently, mining can further endanger the health of people and animals [4]. The recovery and management of mines are crucial and have attracted lots of attentions from Chinese government [5]. The most common methods for such restoration involves chemical and phytoremediation measures [6], although while there exist various methods of mine management, including slag reuse, reclamation, greening and mine geoparks. Until the end 2018, over 7000 mines had been managed in China [7]. Restoration vegetation is particularly important for the restoration and recycling of the mining region’s ecosystems [8]. While repeated field surveys are costly and inefficient in the large and inaccessible areas, remote sensing data and methods are found as a promising tool for monitoring ecological restoration of degraded coal mining areas.
Normalized difference vegetation index (NDVI) is mostly used in vegetation growth research, including the application of vegetation index. Some studies [9,10,11] have used NDVI to monitor vegetation growth changes at different times, and analyzed the potential factors related to vegetation growth. Based on long-term Landsat series data, some studies [12,13,14,15] explored the changes in NDVI in the study region, monitored their vegetation coverage and growth, and analyzed ecological changes in various conditions. Tote et al. [16] used the NDVI time series from the SPOT/VEGETATION satellite data to evaluate the vegetation status and analyze the impact of mining on soil characteristics. They also applied the standard deviation vegetation index (SDVI) to reduce the impact of climate factors on mining on time series [16]. The use of vegetation coverage to explore vegetation is another commonly used method. Zhao et al. [17] took the Malanzhuang Iron Mine of Tangshan Shougang as their research region, and utilized Landsat TM/ETM+ data and the difference analysis method to explore the ecological restoration effects of the mining region based on vegetation coverage. Eventually, they obtained the ecological restoration effect. Qiao et al. [18] used long-term Landsat image data to analyze the fraction of vegetation coverage (FVC) and vegetation condition index (VCI) in the Daliuta mine, and evaluated the temporal and spatial characteristics of vegetation coverage and vegetation growth. In addition, some literatures [19,20,21] studied the relevant types of mine vegetation, and the relationship between the growth of the mine vegetation and the surrounding soil and heavy metals, and monitored the ecological restoration of the mine.
The Chinese government has put a lot of manpower, resources and money to restore the mine ecological environment, and one of the most important ways is the planting of vegetation as forest and grassland. However, due to the influence of mining environmental pollution and anthropogenic factors, the restoration vegetation in mining areas did not grow at the same pace as the natural vegetation. Some planted vegetation died after a few years, and then were re-planted in place again and again, which contributed to high expenses and waste of resources in restoration process. Therefore, in order to monitor the complex restoration vegetation growth status and its changes, we collect the images of remote sensing satellites covering the process of mining and restoration, and use a typical vegetation index method to estimate the area of land cover type and vegetation growth level. Finally, an analysis model is constructed to evaluate the restoration effect, which can intuitively indicate the input-output efficiency of the mine area at the pixel level.
Previous studies also showed that the ecological restoration monitoring of mining region is particularly important [22]. From this point of view, taking the Bayin Mengkenayuan coal mine in Dongsheng as an example, this study aims at conducting a specific investigation on the growth of restoration vegetation, monitoring the situation of restoration in different years, and checking whether the restored vegetation grew normally.

2. Study Area and Remote Sensing Images Collection

2.1. Study Area

The Bayin Mengkenayuan coal mine in Dongsheng District was taken as this research region. Dongsheng District is located in the middle and eastern regions of Ordos Plateau in Inner Mongolia, and has a temperate continental climate and distinct seasons. The Bayin Mengkenayuan coal mine in Dongsheng District was selected as an example to study restoration vegetation and it was an open pit, as shown in Figure 1. The study region has long winters and short summers and alternating seasons. Dongsheng District has long-term stable large-scale sedimentary basins. The stratum structure is simple and the stratum development conditions are complete. No magma activity is observed and the majority of the minerals are sedimentary minerals. These factors have provided the region with a high quality mineral resource and energy environment, which has rich and diverse mineral resources. The most abundant mineral resource in Dongsheng District is coal, followed by oil shale, gas, pyrite, peat, and other mineral resources [23].
The Bayin Mengkenayuan coal mine locates at 39°46′18″–39°48′58″ N latitude and 110°16′1″–110°20′30″ E longitude, and is about 25 km far from the Dongsheng downtown. The area of the coal mine is approximately 32.36 km2, with a length of 6.42 km, and a width of 5.04 km. This coal mine included evident restoration vegetation process characteristics. However, since this region is generally lacking of precipitation (annuals average 381.8 mm), the land covers are mainly shrubland, grass and barren land, while the background is pedocal soil. According to the records of this coal mining area, this coal got the mining permission license from the government in 2012 and then started mining operations at the same year. The Bayin Mengkenayuan mine is an open pit coal mine and its mining activity destroys the surrounding vegetation that consequently reduces the vegetation cover in this region, and then the mining company was required by the government to restore the vegetation cover artificially since 2103 in order to maintain the ecological environment. Therefore, this coal mine is suitable to be used for monitoring the restoration vegetation status along with the coal mining activity.

2.2. Data Collection

The Landsat series imageries were used over the study area. All images were captured with a spatial resolution of 30 m and contain blue, green, red, near-infrared, and other two short-wave infrared bands. Since vegetation growth is sensitive to seasonal changes, this study selected all Landsat images during the vegetation growing season from April to October of each year in the study region to explore the yearly vegetation changes [24,25]. As shown in Table 1, about ten images per year, and a total of eighty-seven remote sensing images from 2011 to 2018 were used. We firstly calculated the maximum value of monthly vegetation index, and then used their average value to monitor the expansion of the mining area and the changes in vegetation restoration in growing season [26,27]. Due to the interference of cloud and other atmospheric conditions, the Landsat data has different degrees of noise [28,29]. In order to eliminate those potential noise, the above images were all chosen under cloud-free condition and the atmospheric correction [15] was consequently performed to reduce the atmospheric effect and obtain the surface reflectance for the calculation of the vegetation index. Moreover, the maximum value composite method (MVC) was utilized to get the monthly vegetation index value [28,29]. The eighty-seven images mainly covered three important mining periods: before mining stage (BMS), undergoing mining stage (UMS), and after mining stage (AMS), and all of them were cropped to the same study region according to the boundary of the coal mine. Finally, the average value of the monthly maximum value in the growing season was taken to monitor the vegetation growth of the mining region.

3. Methods for Restoration Vegetation Monitoring and Evaluation

Figure 2 shows the workflow of the proposed method. We selected a vegetation index GRNDVI of growing season images from Landsat dataset to obtain the dynamic changes of the inter-annual vegetation growth and the spatial and temporal changes in land types. The restoration vegetation region and surrounding natural vegetation region were identified by the analysis of land type changes, and were compared the mean GRNDVI of them. Furthermore, the annual dynamic changes of vegetation growth for the restoration region was conducted. The comprehensive restoration effect was estimated by calculating the average growth of restored vegetation and analyzing their effects each year finally.

3.1. Vegetation Growth Monitoring Methods

The open pit and underground mining can cause a change in surface cover type, thereby damaging the neighboring ecosystems and render the temporal and spatial changes in vegetation conditions [30]. Three common methods are often used for monitoring the long-term vegetation growth. The first method uses vegetation physiological elements and ecological parameters to determine vegetation growth trends and classify vegetation growth grades. The second method plots the growth process curve of the vegetation index and other parameters obtained from remote sensing data in each period, for getting a long-term growth trend change in time according to the curve shape. The third method uses vegetation in the same growing season of different years to evaluate the temporal and spatial distribution of vegetation growth, for reflecting the change of growth in a long-term sequence [31]. The first method can determine the characteristics and correlations of the physiological and ecological parameters of vegetation to observe vegetation growth trends, but it is more complicated than the other two. The second is simple, intuitive, and clear, and is often used in practical applications. However, it has some difficulties in classifying vegetation growth. Meanwhile, the growth obtained by the third method adopted in this study can reflect the change of growth accurately in time and space. Moreover, the calculation is not complicated and can efficiently obtain the spatial and temporal changes of vegetation in the mining region.

3.1.1. Vegetation Index and Growth Monitoring Methods

To monitor vegetation trends, firstly we need to select a suitable vegetation index. Vegetation index has been proved to be an effective method of capturing the vegetation growth. As the most commonly used vegetation index, NDVI has been used in monitoring vegetation growth using the mathematical combination of the near-red and red bands of remote sensing images. Although NDVI is related to vegetation coverage, this indicator is affected by atmospheric conditions, soil background, and becomes saturated at high vegetation coverage [32]. Meanwhile, the Simple Ratio index (SR) is another well-known vegetation index that has improved soil background, but its sensitivity will decrease when the leaf area index value is high and vegetation is dense [33]. The growth root normalized differential vegetation index (GRNDVI) combines the advantages of SR and NDVI [34]. As seen in Equation (1), the characteristics of the SR × NDVI mathematical quadratic expression cause this vegetation index to be strengthened in low value part and weakened in the high value part, respectively. A square root operation is performed on SR × NDVI to reduce the impact of this shortcoming [34]. The value range of NDVI is [−1, 1] and the term 1 is added to the part of the GRNDVI equation to retain a positive value [34]. Figure 3 shows the comparison example of NDVI, SR and GRNDVI, and finds that GRNDVI provides an improved interpretation of the vegetation comprising woodland, grassland, and other vegetation types, which will be used for vegetation status analysis in the study region. As stated above, the related equation of GRNDVI is as follows:
G R N D V I = ρ N I R ρ r e d × ( ρ N I R ρ r e d ρ N I R + ρ r e d + 1 )
where, ρNIR and ρred are land surface reflectance of Landsat red and NIR bands after atmospheric correction, respectively.
Furthermore, three trend methods based on vegetation index were compared to select the best trend change analysis method: (1) vegetation index difference, which can express the differences of vegetation growth directly, is generally used to monitor vegetation growth [35]. (2) vegetation index ratio of two dates, which is available for analyzing growth situation, is used less than the vegetation index difference method [31]. (3) vegetation index anomaly that involves the normalization of the vegetation index differences to obtain vegetation growth changes circumstances [36]. After extensive tests, the GRNDVI anomaly method can highlight the change in vegetation growth in the mining region. Equation (2) defines the GRNDVI anomaly (RGRNDVI) and the value is theoretically within [−1.0, 1.0]:
R G R N D V I = G R N D V I m G R N D V I r G R N D V I m + G R N D V I r
In Equation (2), GRNDVIm is the GRNDVI value in the monitoring year and GRNDVIr is the GRNDVI value in the reference year. A negative value of RGRNDVI indicates that vegetation suffers a degeneration trend from the reference year to the monitoring year. By contrast, a positive value means that vegetation grows better and captures a restoration trend between the two years.

3.1.2. The Estimated Method of the Land Cover Type Change (LTC) Factor

The use of various remote sensing image processing and analysis of the bare ground and vegetation in the mining region can facilitate the monitoring of the recovery status of the mining region [37]. The current study combined the inter-annual GRNDVI and GRNDVI anomaly values to construct a land type change factor LTC to investigate the area of the mining region, area of the restoration vegetation, and dynamic change of vegetation growth.
The land type change (LTC) factor using GRNDVIm, GRNDVIr, and RGRNDVI can be calculated as follows:
L T C = G R N D V I m × G R N D V I r × R G R N D V I
The LTC was then recognized as six different values using the preceding classification. If L stands for bare land, V stands for vegetation, B means that the growth becomes better than the reference year, and W means that the growth becomes worse than the reference year, then there will be six groups of their composition in two adjacent monitoring and reference years: L-L-W, V-L-W, V-V-W, L-L-B, L-V-B, and V-V-B. For example, L-V-B represents that bare land in the reference year changes to vegetation in the monitoring year, and its growing condition is improved.

3.1.3. Annual Variation of Restoration Vegetation Growth

The vegetation index and trend method were used to determine the overall vegetation growth and ground feature coverage category of the mining area from 2013 to 2018, and the annual ground feature category changes were obtained by analyzing the LTC results. The LTC factor can be used to determine the region of vegetation restoration. In this study area, the region from bare soil to vegetation is the region of vegetation restoration by observing the images, which can form a vector diagram of the restoration region. Combined with the growth image, through the superposition of the growth image and the restoration region image, the annual growth of the restored vegetation can be analyzed every year.
At the same time, based on the results of the LTC factor, natural vegetation was obtained by superimposing all the regions of land type change images from vegetation to vegetation. The region that has always been vegetation is natural vegetation by observing the images. The annual dynamic contrast change of restored vegetation and natural vegetation can be obtained by calculating the average value of the total growth year.

3.2. Evaluation Method of Restoration Vegetation Effects

3.2.1. Annual Restoration Vegetation Effect Factor E

Since the overall growth of the vegetation cannot represent the growth of the restoration vegetation, and the area and the growth time of the restoration vegetation are different annually, and therefore, it is necessary to separately analyze the region of inter-annual restoration vegetation to get the different effects of inter-annual restoration vegetation and exclude the influence of above conditions (i.e., the area and the growth time of the restoration vegetation) on the monitoring of restoration effects to mitigate the interference of human activity factors and vegetation itself.
According to the specific conditions of the study region, the GRNDVI values were re-classified into specific values to facilitate subsequent calculations according to a new term as calculated in Equation (4):
E = k = 1 m G R N D V I k m
where, k represents the kth growth year of restoration vegetation annually and GRNDVIk represents the value after the reclassification of the vegetation index in the kth year, which is the upper limit m of the growth year of the restoration vegetation during the study period. For example, for the restoration vegetation beginning from 2014, m is equal to 5 by 2018. Equation (4) was used to calculate the average vegetation index value to represent the effects of restoration vegetation annually.

3.2.2. Restoration Effect of Area-Average Factor EAA

The area of restoration vegetation varied in different years, and the factors of the area exclusion were determined using the effect statistics of the restoration vegetation to calculate the total EAA (effect of area-average) restoration vegetation and analyze the restoration effects annually. Among these factors, the EAA value is the total effect of area-average restoration vegetation annually and calculated using Equation (5) as follows:
E A A = i = 1 5 G r i × ( S i / 0.0009 ) S
where, Gri is the restoration vegetation level, Si is the area occupied by the restoration level, 0.0009 km2 (=0.03 km × 0.03 km) is the size of the pixel area, and S is the total restoration area annually.

3.2.3. The Comprehensive Restoration Effect Factor CE

In addition, the overall repair level of the mining region in all years also needs investigation to view the comprehensive repair effect of the mining region. This study used the weighted average method to consider various level factors comprehensively and provide a quantitative evaluation of restoration vegetation effects [38,39]. The weights of 0, 1, 2, 3, and 4 in each level were utilized to calculate the comprehensive restoration effects, and the overall situation of restoration vegetation was analyzed.
C E = n = 1 6 i = 1 5 W i × S i S S
where, CE is the comprehensive restoration effect, Wi is the weight of each level, Si is the area occupied by the restoration level, and SS is the total area of restoration vegetation in all years.

4. Restoration Vegetation Monitoring and Evaluation Results

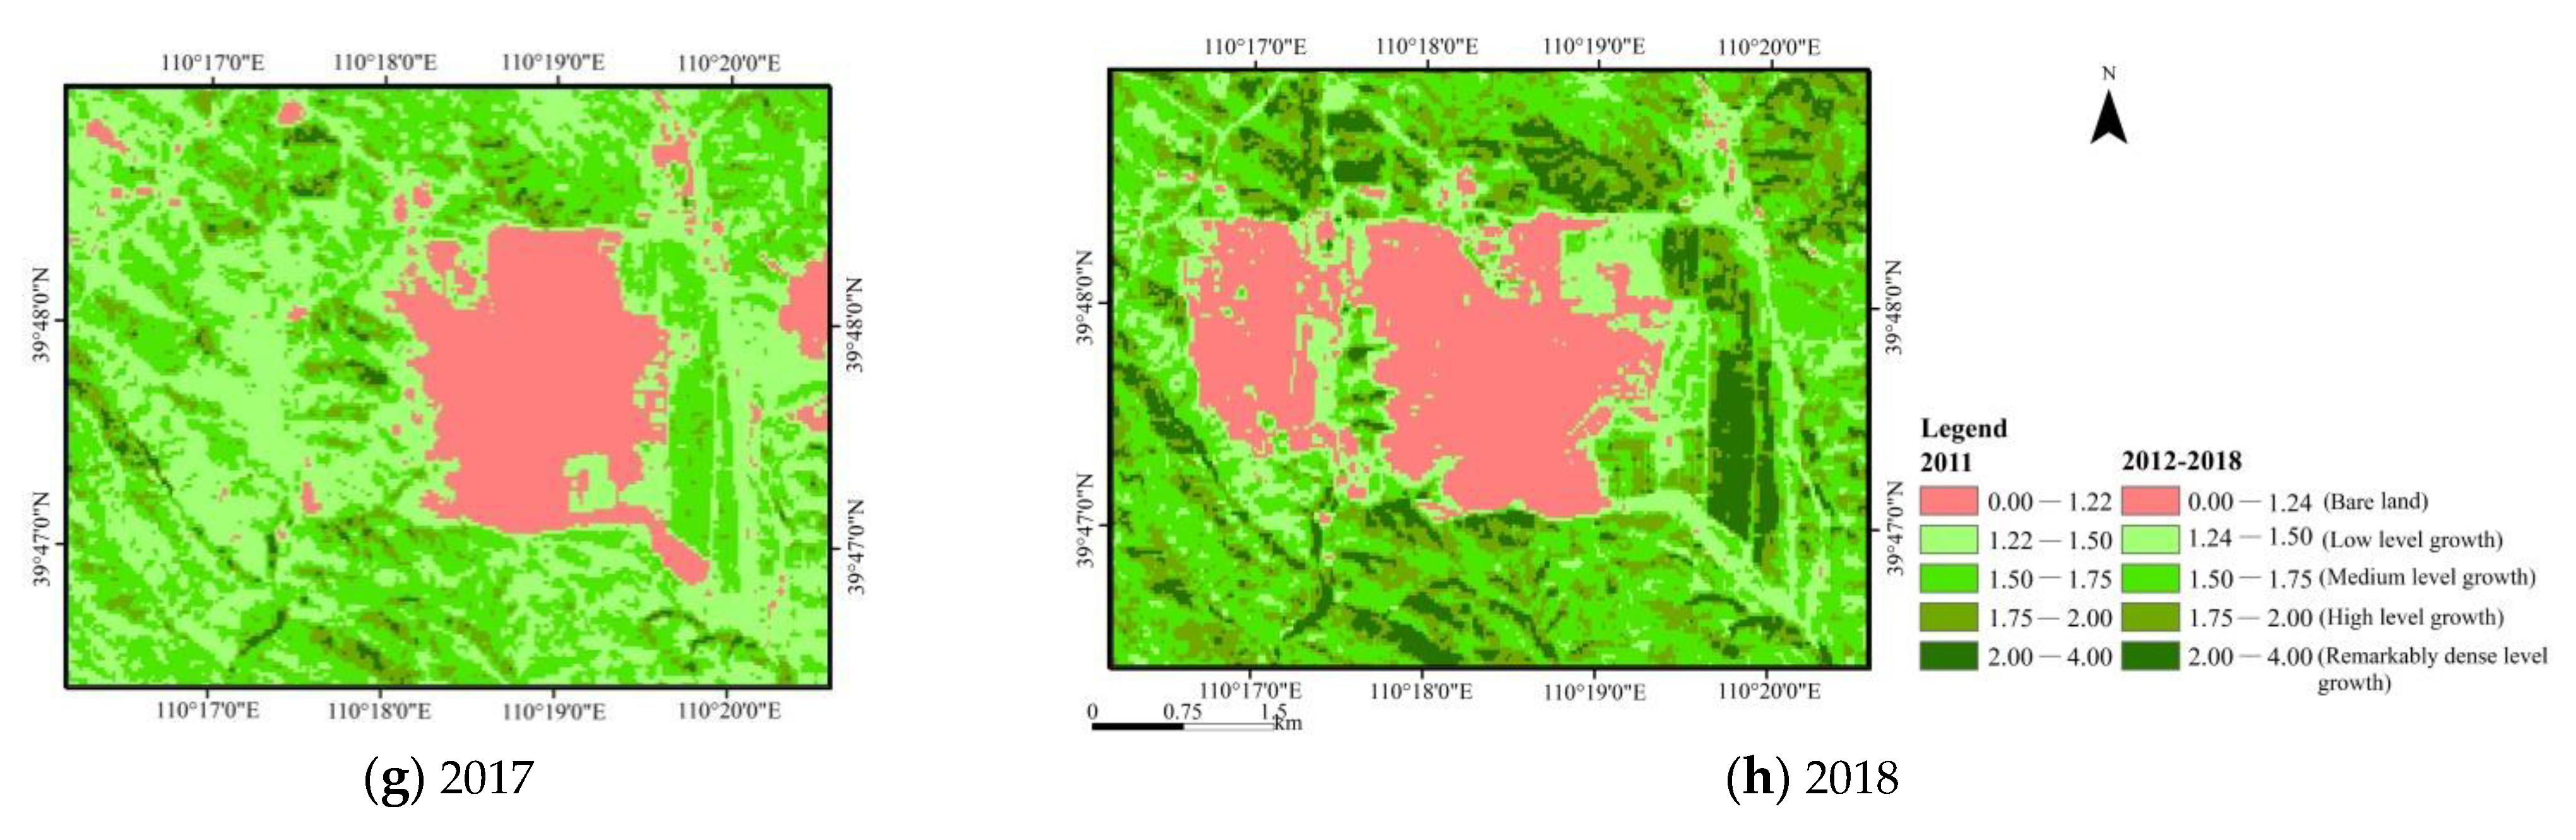
4.1. Inter-Annual Vegetation Growth Results and Cross-Validation

Vegetation indices in different dates can provide effective information for the inter-annual vegetation growth in a mining region [40]. As shown in Figure 4, remote sensing images used to calculate the vegetation index were displayed in false colors (near infrared band, red band and green band), highlighting various ground features and vegetation growth. It was found that the vegetation growth in 2011 was generally poorer than other years. We calculated GRNDVI according to Equation (1). By considering the authenticity of the results, the threshold 1.22 of GRNDVI for 2011 and 1.24 for other years were respectively adopted to identify vegetation pixels (i.e., GRNDVI > the threshold). Moreover, in order to make the spatial pattern of the vegetation growth substantially clear [40], the GRNDVI images of each year were divided into five levels with reference to the division of NDVI, as follows: (1) 0.00–1.24 (0–1.22 for 2011) for bare land, including pits, pumping regions, roads, and other places without vegetation coverage; (2) 1.24–1.50 (1.22–1.50 for 2011) for low-level vegetation growth; (3) 1.50–1.75 for medium-level vegetation growth; (4) 1.75–2.00 for high-level vegetation growth; and (5) 2.00–4.00 for remarkably dense-level vegetation growth. Figure 5 presents the GRNDVI levels images of the mining region from 2011 to 2018, while Figure 6 shows the percentage statistics of GRNDVI levels. Table A1 lists the areas and pixel percentages of the different GRNDVI levels in those years.
According to Figure 5, the area of bare land (red pixels in the figures) was found to increase from 2011 to 2018, and the mining region was expanding and generally continuing to develop in the western part. The GRNDVI was generally small in 2011, thereby indicating that vegetation did not grow well in this period. Vegetation growth improved in 2012 and vegetation growth status was significantly enhanced. The majority of the GRNDVI values from 2012 to 2018 around the mining region were around 1.5 or above 1.5, thereby indicating that vegetation growth was mostly higher than the low level. After expanding the range of bare land westward, in the eastern of the mining region, restoration vegetation was implemented to expand the vegetation range. Therefore, the study region was generally in a state of exploitation and reclamation from 2011 to 2018, in which the ecosystem environment was better than the mining regions with only mining but without reclamation [41].
Table A1 and Figure 6 show that vegetation grew poorly (GRNDVI level: 1.22–1.50) in 2011, which accounts for 98.18% (31.301 km2). Vegetation growth was poor (GRNDVI level: 1.24–1.50) in 2012, accounting for 68.82% (21.941 km2). In 2013 and 2014, vegetation growth was medium (GRNDVI level 1.50–1.75), accounting for 57.79% (18.427 km2) and 45.60% (14.539 km2), respectively. Thus, the overall vegetation growth improved. Vegetation growth was relatively uniform from 2015 to 2018 but was generally medium (GRNDVI level: 1.50–1.75), accounting for more than 30%. Poor (GRNDVI level: 1.24–1.50) vegetation growth accounted for more than 40% in 2017. High (GRNDVI level: 1.75–2.00) and remarkable vegetation growth (GRNDVI level: 2.00–4.00) had the high proportion in 2016 and 2018, accounting for 37.96% (12.103 km2), and 29.96% (9.552 km2), respectively. Some factors, such as climate, soil, and topography, are critical to the changes for the inter-annual vegetation growth [42,43,44]. The area of bare land increased from 0.414 km2 in 2011 to 6.236 km2 in 2018 and the area of bare land had been basically expanding.
The classification of years 2016 (Figure 5f) and 2018 (Figure 5h) were taken as examples for checking the accuracy of the GRNDVI level results. Because we used historical images and there was no field verification data, we used remote sensing images with higher resolution than Landsat images for cross validation. The Sentinel 2 images were used as the cross-validation image with a higher spatial resolution of 10m than Landsat images. Since the Landsat images were mainly from April to October, this study selected three images in spring, summer and autumn of Sentinel images to ensure inspection reliability of results of the annual classification. A uniform sampling of 100 sample points for each Sentinel image was used to calculate the overall accuracy [45], as shown in Figure 7. The overall classification accuracy is the ratio of the total number of correctly classified vegetation and bare soil pixels to the total number of category pixels. The overall accuracy results are shown in Table 2, and the overall accuracy is greater than 90%, which represents that the classification accuracy is reliable.

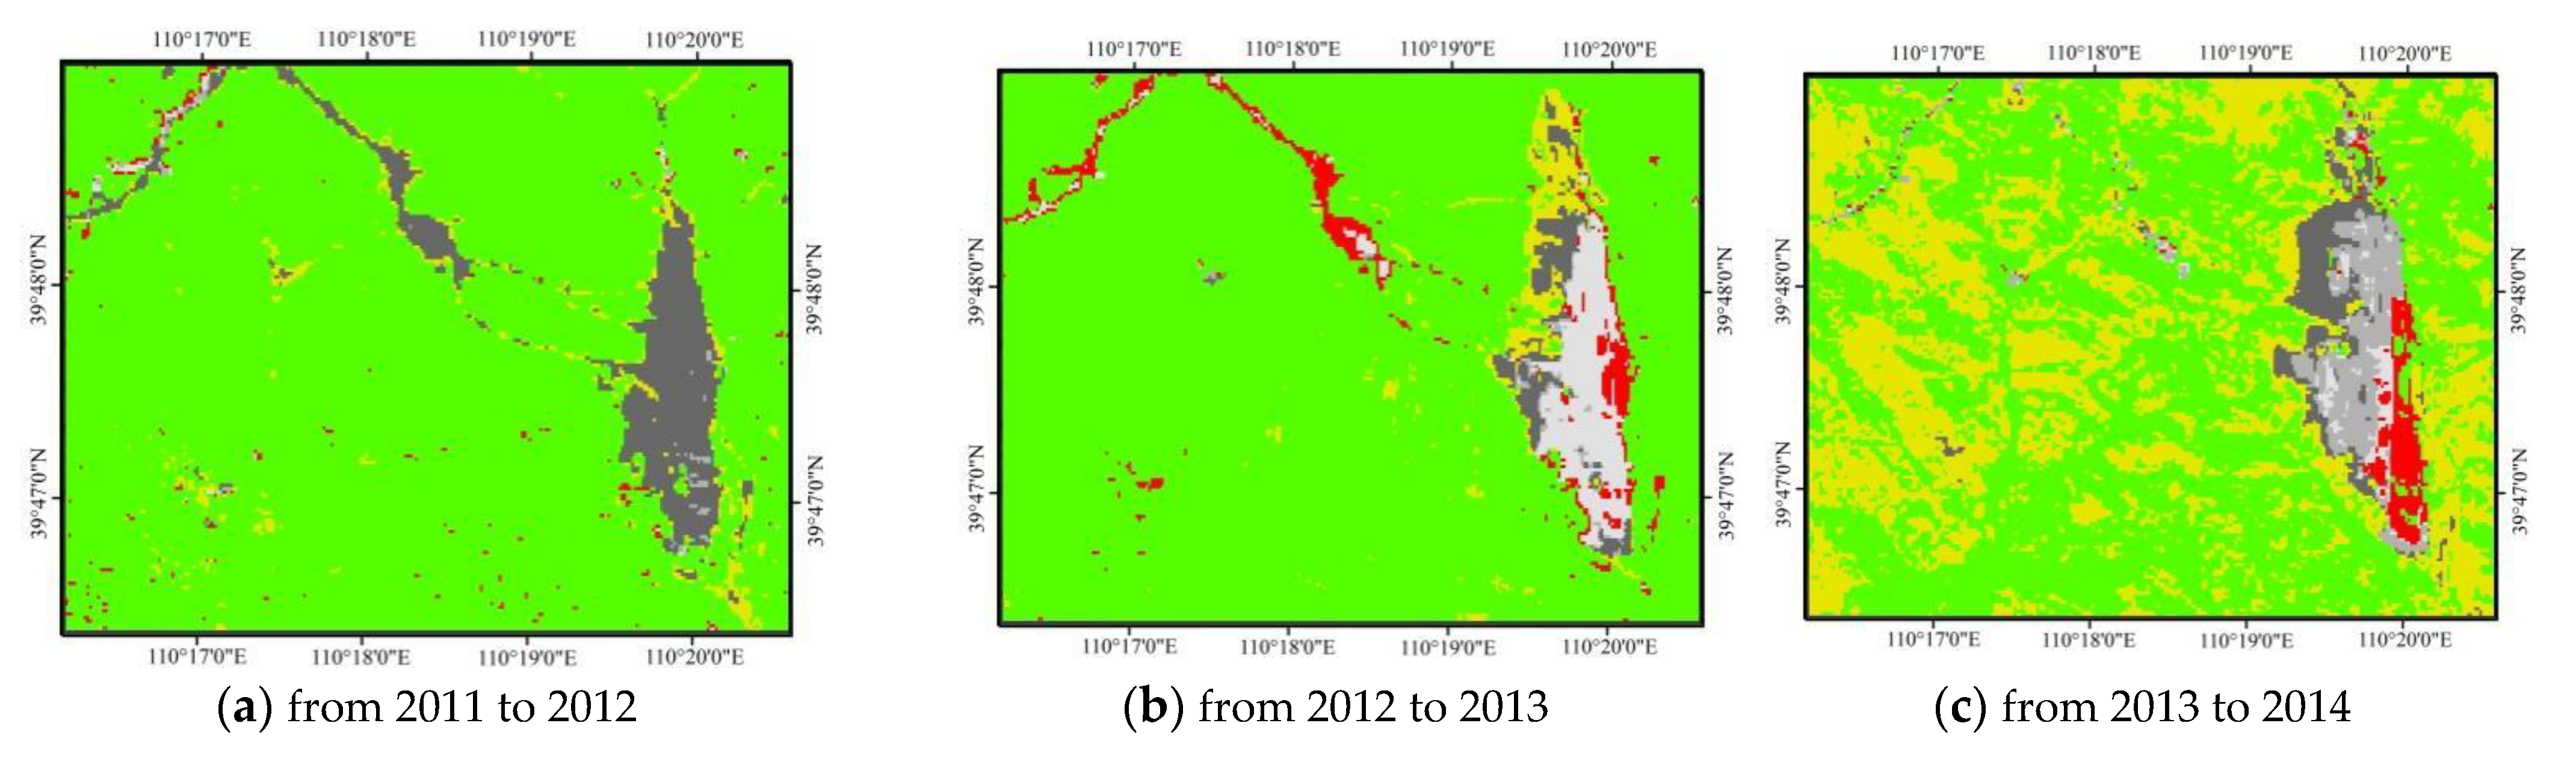
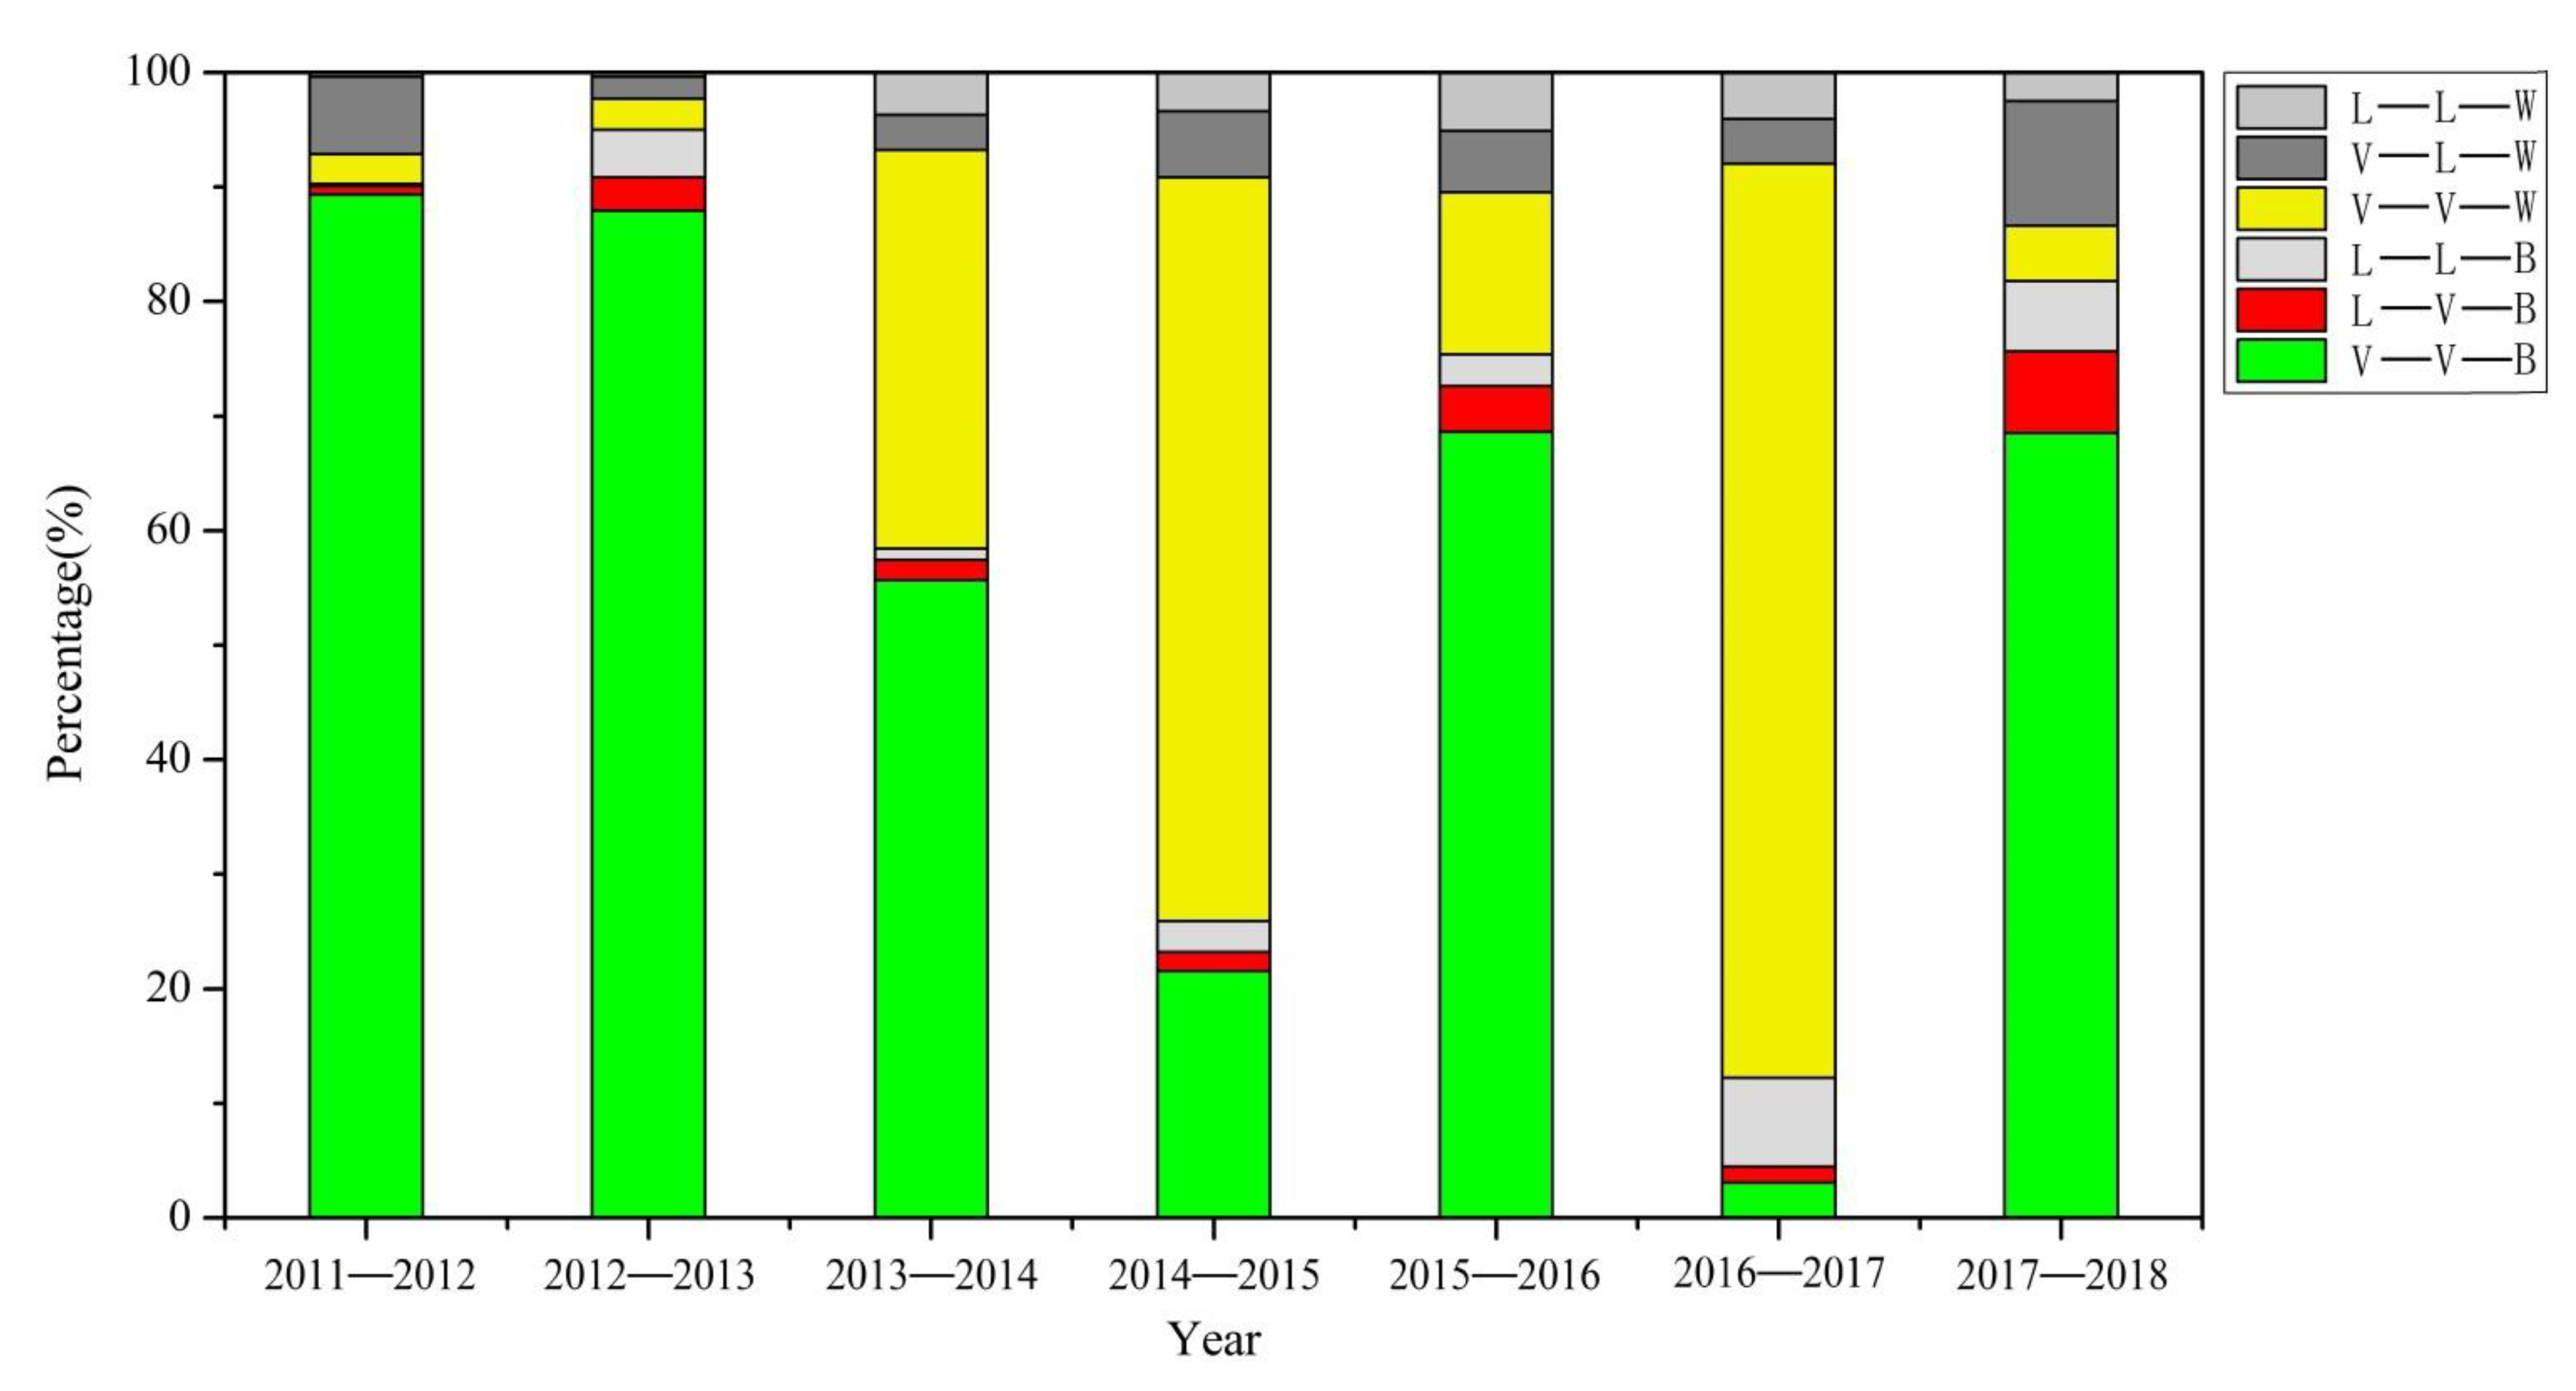
4.2. Land Type Change Results

The GRNDVI data shown in Figure 6 indicate that a threshold value (i.e., 1.24) of GRNDVI was used to distinguish vegetation (GRNDVI ≥ 1.22 for 2011(GRNDVI ≥ 1.24 for other years)) and bare land (GRNDVI < 1.22 for 2011(GRNDVI < 1.24 for other years)). Moreover, the results of RGRNDVI were applied by Equation (2) to determine the growth levels, with RGRNDVI < 0 and RGRNDVI > 0 meaning poor and good growth, respectively.
Thus, LTC in Equation (3) can be traced back to the category of the factor through the result of the product to determine the LTC results as shown in Figure 8, and the statistics of LTC results were shown in Figure 9 and Table A2.
In the LTC results, V-L-W stands for expanding the range of bare land in the mining region, L-V-B stands for restoration vegetation, V-V (V-V-B and V-V-W) stands for vegetation growth, and L-L (L-L-B and L-L-W) means a place is consistently bare soil.
The bare land in the mining region includes pits, pumping regions, roads, and other places without vegetation coverage, and changes of these types are extremely complicated [46]. Given the preceding reasons, the change of bare land is not the key point of the current study that actually focuses on the current restoration vegetation. Thus, we only specifically analyzed the changes related to vegetation and have to temporarily disregard the results of the bare land (i.e., L-L-B and L-L-W).
The condition of vegetation cover is considerably affected by climate and human factors [47]. Figure 8 shows that the mining activity started from 2011 to 2012, and vegetation was removed (V-L-W) in this period. The mining region gradually expanded on the west side from 2012 to 2015, and vegetation was restored on the east side of the original mining region. From 2015 to 2016, the scope of restoration (L-V-B) was expanded from its mining region to the west. From 2016 to 2018, vegetation was gradually restored (L-V-B) on the east side of the original mining region, and the mining region was expanded to the west. Moreover, a vegetation covered region appeared in the middle area of the mining region. Vegetation growth around the mining region improved annually from 2011 to 2014, but its changes showed some fluctuations from 2014 to 2018. Moreover, the inter-annual restoration vegetation and surrounding vegetation growth were generally consistent and mainly affected by the climate factors rather than the mining activity in the study region. The preceding results determined that the current coal mine was under expansion (V-L-W) along with significant restoration vegetation (L-V-B) in the study period. That is, the eastern area of the mine was gradually restored for vegetation, while the mining region was continuously expanded in the west, thereby causing an increase in the mining region. The mining region began to be mined in 2012, and formal restoration work began in 2013.
Table A2 shows that in 2011–2012, 2014–2015, 2015–2016, and 2017–2018, the areas from vegetation to bare land (expanding the range of bare land, V-L-W) were relatively large at 2.16, 1.84, 1.71, and 3.48 km2, respectively. The degree of expansion was also relatively large (Figure 9). The expanding range of bare land areas (V-L-W) in 2012–2013, 2013–2014, and 2016–2017 were smaller than those in 2011–2012, 2014–2015, 2016–2017, and 2017–2018 with 0.61, 0.98, and 1.26 km2, respectively. In terms of restoration vegetation in the mining region, the areas from bare land to vegetation (restoration vegetation, L-V-B) were larger in 2015–2016 and 2017–2018 with 1.28 and 2.26 km2, respectively. Restoration vegetation (L-V-B) in 2011–2012, 2012–2013, 2013–2014, 2014–2015, and 2016–2017 is relatively smaller, as 0.23, 0.92, 0.56, 0.53, and 0.45 km2, respectively. For the growth of vegetation around the mining region, the overall vegetation in 2011–2012, 2012–2013, 2013–2014, 2015–2016, and 2017–2018 was gradually improved (V-V-B) to 28.48, 28.04, 17.75, 21.88 and 21.85 km2, respectively. Moreover, vegetation growth was generally better than that in the previous reference year. The vegetation growth in the monitoring year was worse than that in the reference year (V-V-W) in 2014–2015 and 2016–2017, and vegetation poorly grew with areas of 20.71 and 25.43 km2, as shown in Figure 8. Changes in vegetation growth may be related to climate [48,49,50]. In general, the restoration vegetation area was fluctuating, thereby indicating that the mine management substantially focused on environmental governance. Note that mining in 2012 began to be affected by a series of ecological and environmental protection plans and measures of China’s government [51]. Moreover, Figure 9 illustrates that the roads in the mining region in 2012 showed the information of plant vegetation and restoration. The mining region has also been generally under restoration vegetation in 2018, and the impact probably was influenced by the implementation of China’s 2018 policy [52].

4.3. Restoration Vegetation and Surrounding Natural Vegetation Growth

As reported previously [12,13,14,15], the remote sensing images are very helpful data resource to monitor the biological status. It was found that formal restoration vegetation started since 2013 in the mining region, and was implemented for the six years from 2013 to 2018. The surrounding areas of the mining region with vegetation cover during the all periods from 2013 to 2018 (hereafter called natural vegetation), and the inter-annual restoration vegetation of the mining region were compared. The inter-annual average growth changes were analyzed as shown in Figure 10. It shows that the annual variation line shapes are similar between the restoration vegetation and natural vegetation growth, and the changes in restoration vegetation were consistent with natural vegetation growth.
Figure 10 shows that the restoration vegetation GRNDVI values in most of years were less than the natural vegetation, meaning the restoration vegetation grew not well as the natural vegetation, perhaps due to vegetation type, vegetation age and the potential influence of the mining activity on the background soil quality and soil moisture. Restoration vegetation from 2014 and 2016 was better than natural vegetation in 2016 and 2018, and in 2018 respectively, and the average fluctuation range was large. Restoration vegetation from 2013 was generally inferior in growth, but its value range was relatively stable. Restoration vegetation from 2014 and 2015 were in the middle, and that from 2017 and 2018 were poor. Vegetation growth was affected by vegetation type, planting density and the surrounding soil and topography [53]. In general, Figure 10 shows that the total growing trend of restoration vegetation was substantially similar with that of the natural vegetation, and mainly affected by climatic factors [54,55,56], which means that the restoration vegetation grows normally. Fluctuation was the change in growth and corresponded to the results in Figure 9. The inter-annual vegetation growth from 2013 to 2018 in the study region completely fluctuated between long-term deterioration and growth.

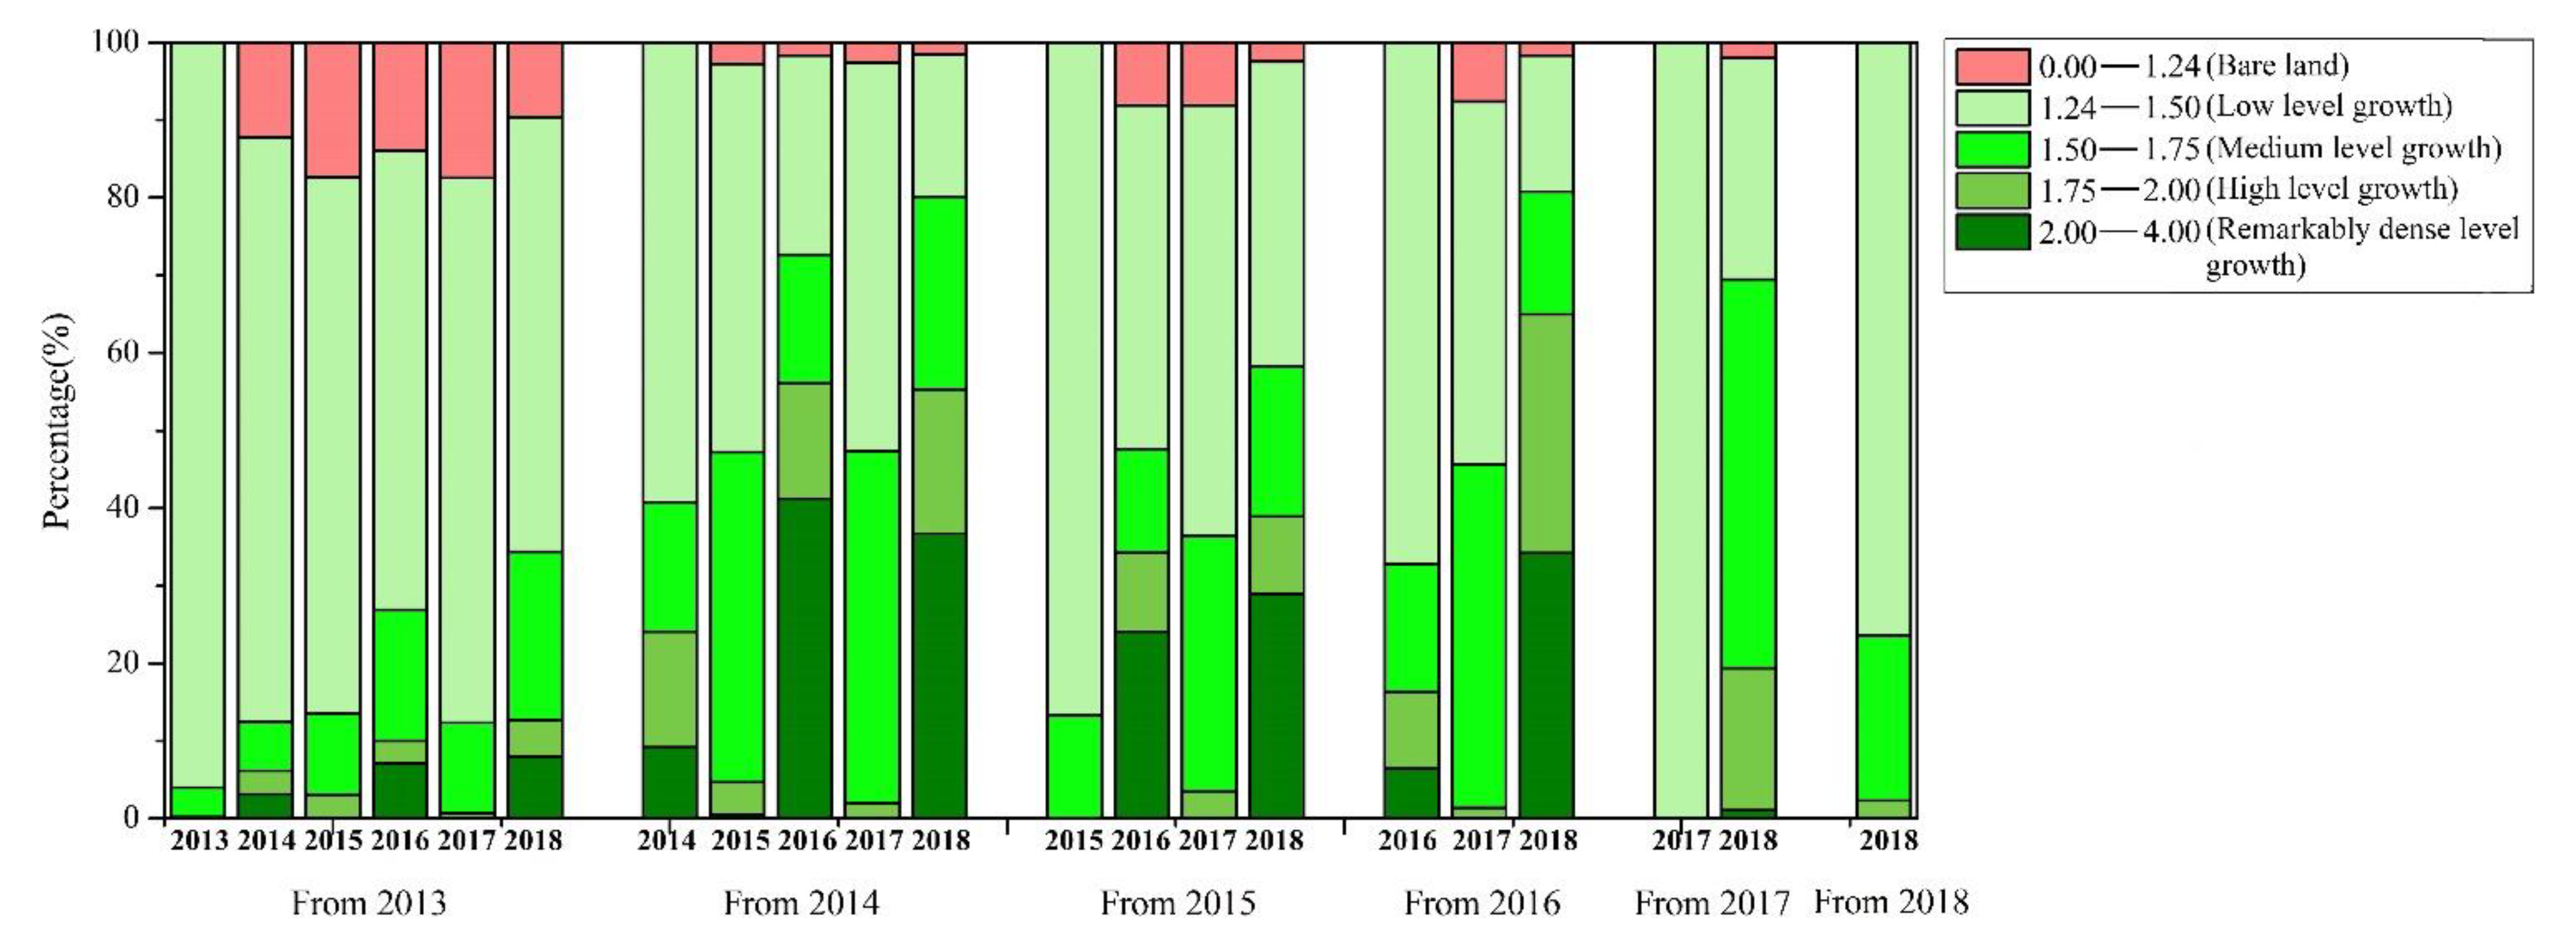
4.4. Growth of Restoration Vegetation with Different Restoration Beginning Years

Long-term monitoring of vegetation growth can effectively reflect the changes in the ecological environment of the mine [11,16,17,18]. The current study analyzed the inter-annual dynamic changes of restoration vegetation in the mining region with different beginning years in the study years 2013 to 2018. On the basis of the restoration region obtained in Figure 8 and the eight-year GRNDVI spatial distribution images in Figure 5, this study analyzed the growth trend of restoration vegetation with different restoration beginning years to determine the inter-annual vegetation growth. The results are shown in Table A3 and Figure 11.
Figure 11 and Table A3 show that restoration vegetation growth from 2013 was generally low. Up to 2014, some of the restoration vegetation beginning from 2013 began to change to bare land (GRNDVI level: 0.00–1.24), accounting for 9.59% (0.088 km2) by 2018. Restoration vegetation growth beginning from 2014 was within the low (GRNDVI level: 1.24–1.5), medium (GRNDVI level: 1.5–1.75), and remarkable (GRNDVI level: 2.00–4.00) conditions from 2014 to 2018. Up to 2015, the restoration vegetation beginning from 2014 also became bare land, and approximately 1.59% (0.009 km2) eventually changed to bare land by 2018. Thus, the vitality of restoration vegetation beginning from 2014 was tenacious, and the environment was suitable. Restoration vegetation growth beginning from 2015 was mostly low in 2015. Eventually, restoration vegetation became bare land at 2.47% (0.013 km2) by 2018. Restoration vegetation growth beginning from 2016 was mostly low in 2016. Up to 2017, vegetation beginning from 2016 grew moderately (GRNDVI level: 1.5–1.75) and poorly (GRNDVI level: 1.24–1.5), and eventually became 1.68% (0.021 km2) of bare land by 2018. Restoration vegetation beginning from 2017 was also mostly low in 2017, but growth was medium by 2018. Restoration vegetation in 2017 became 2.00% (0.009 km2) of bare land by 2018, and the restoration vegetation beginning from 2018 was low and medium by 2018. Overall, the results shown in Table A3 and Figure 11 show that vegetation growth improved annually, and an increasing trend of vegetation growth was observed.

4.5. Evaluation of Restoration Vegetation Effects

Based on Equation (4), the annual restoration effect was calculated. The annual restoration vegetation effect was studied separately by comparing the results of E with the GRNDVI reclassification values in Section 4.1. Moreover, the results of E were divided into 5 levels, which were set to the level values of 0, 1, 2, 3, and 4, which represent poor, inferior, medium, good, and excellent restoration effects, respectively. Figure 12 shows the percentage statistics of restoration vegetation effects of each year. Table A4 indicates the statistical area and percentage of each level of effects of restoration vegetation annually. Figure 13 displays the color expression of the restoration vegetation effects using a high-resolution image as the base image, and the transparency of the level layers was not 100% to view the surface categories of the image.
Table A4 and Figure 12 show that among the overall restoration vegetation effects in 2013, 2017, and 2018, inferior effects (level 1) reached 64.00% (0.590 km2), 78.64% (0.352 km2) and 76.40% (1.726 km2), respectively. The overall restoration vegetation effect in 2014, 2015, and 2016 was generally inferior and medium (level 2) and accounted for 78.17% (0.441 km2), 76.31% (0.405 km2) and 77.44% (0.99 km2), respectively. The overall restoration vegetation in 2013–2018 shows that the restoration effect of the middle area was mostly medium (level 2) and good (level 3), the surrounding part of the restoration effect was mostly inferior (level 1), and the remainder had a small amount of restoration vegetation with poor (level 0) and excellent (level 4) effects (Figure 13). The inter-annual variation of the restoration vegetation area was generally increased. The growth of the restoration vegetation should be related to the soil environment, restoration vegetation type and climate.
The total EAA restoration vegetation annually was determined using Equation (5), and the values of 2013, 2014, 2015, 2016, 2017, and 2018 are 936.87, 1871.72, 1534.78, 1751.85, 1303.89, and 1399.02, respectively. The restored area in 2014 was not the largest, with 0.56km2 (Table A2). The overall vegetation growth in 2014 was mostly medium (GRNDVI level: 1.50–1.75), accounting for 45.60% (14.539 km2) (Table A1). The restoration area in 2013 was 0.92 km2, and the vegetation growth was mostly medium, accounting for 57.79% (18.427 km2). According to EAA, the best restoration was determined in 2014, followed by 2016, 2015, 2018, and 2017. The worst restoration was obtained in 2013, which may be related to factors, such as the type of restoration vegetation, planting density, and surrounding environment. For the analysis of restoration effects, it is not enough to analyze the overall vegetation growth.
The calculated comprehensive restoration effect is 1.31 using Equation (6). That is, the overall effect was the second levels, and the restoration effect was inferior. The overall effect was inclined to the medium growth state. As the restoration vegetation growth throughout the growing season, the overall effect of restoration vegetation continued to be ordinary.

5. Conclusions and Discussions

Previous studies of vegetation have used extensive vegetation coverage and NDVI, even though vegetation coverage and NDVI are susceptible to soil background. The current research calculated GRNDVI (growth root normalized differential vegetation index) and LTC (land type change) factor to conduct restoration vegetation monitoring using Landsat 5/TM, Landsat 7/ETM+, and Landsat 8/OLI data from 2011 to 2018 of a coal mine in Inner Mongolia of China. This study constructed the LTC factor, which can immediately and simultaneously obtain the changes of land type and vegetation growth in the study region, and results show the dynamic changes of expansion and restoration in the coal mine. Moreover, different from previous studies, we also compared the growth trend of the natural vegetation with the restoration vegetation, in order to check whether the restoration vegetation was growing normally. In addition, we constructed the EAA (effect of area-average) factor using vegetation index data to obtain the inter-annual restoration vegetation effects. Thereafter, we compared the restoration results of different years and found that the years 2014 and 2016 had highest restoration vegetation effects while the year 2013 captured the lowest effects. Finally, we used the weighted evaluation method to determine the comprehensive restoration vegetation effect and checked the overall restoration results of coal mining.
This study aims to use the multiple-year vegetation index GRNDVI to monitor the variation of restoration vegetation and mining area in the coal mine. Although only one coal mine was analyzed, but this study tried to provide an effective way for the reader and local government to help them operate the restoration vegetation monitoring in mining regions using remote sensing data like Landsat or even higher spatial resolution images. Besides, this study also provides data support for ecological protection and mine development supervision.
However, some points should be paid attention to improve the work in the future. Firstly, the resolution of Landsat is 30 m. In the future higher spatial-resolution images from different satellites, such as Sentinel-2 and Chinese Gaofen (high-resolution) satellite series [57], can be used to classify the types of restored vegetation. Combining the growth results of different types of vegetation will get more accurate evaluation results. Secondly, based on the principle of unified consideration, the GRNDVI threshold value used in this study was basically fixed as 1.24, and the method of adaptive threshold value may improve the accuracy of ground object classification monitoring [58]. Moreover, the annual best-available-pixel (BAP) composite method proposed by White et al. [59] can also be considered to generate more reliable reflectance image and vegetation index from time-series Landsat images for a better application of monitoring vegetation growth status. Lastly, this study only used the vegetation index GRNDVI for monitoring because GRNDVI was reported to reduce the influence of soil background and dense vegetation saturation. Actually, the combination of various vegetation indices like NDVI, NBR (normalized burn ratio) [60], and SAVI (soil adjusted vegetation index) [61] to make the monitoring result more robust.

Author Contributions

Formal analysis, W.W., X.Z. and L.D.; methodology, W.W. and R.L.; project administration, F.G.; supervision, R.L.; validation, W.W.; writing—original draft, W.W.; writing—review and editing, R.L., F.G. and P.Z. All authors have read and agreed to the published version of the manuscript.

Funding

This research was funded by the National key research and development program of China, grant number 2017YFB0503903-3; Natural Science Foundation of China, grant number 41701434; project of china geological survey, grant number DD20190705; and the Major Projects of High-resolution Earth Observation System, grant number 04-Y30B01-9001-18/20, 30-Y20A010-9007-17/18.

Acknowledgments

The Landsat images were downloaded from the USGS with https://earthexplorer.usgs.gov/ (accessed on 1 September 2019).

Conflicts of Interest

The authors declare no conflict of interest.

Appendix A

Table A1. The areas and percentages of different GRNDVI levels from 2011 to 2018 in the study region (1.22 is the threshold for 2011, and 1.24 is the threshold for other years.).
GRNDVI LevelYear20112012201320142015201620172018
(0.00–1.22 for 2011
(0.00–1.24 for other years))
(Bare land)
Area/km20.4142.3652.0592.4713.7784.2065.0176.236
Percentage1.30%7.42%6.46%7.75%11.85%13.19%15.74%19.56%
(1.22–1.50 for 2011
(1.24–1.50 for other years))
(Low-level vegetation growth)
Area/km231.30121.9413.2103.8848.7453.57512.7955.685
Percentage98.18%68.82%10.07%12.18%27.43%11.21%40.13%17.83%
1.50–1.75
(Medium-level vegetation growth)
Area/km20.1627.33718.42714.53912.41111.99911.42710.410
Percentage0.51%23.01%57.79%45.60%38.93%37.63%35.84%32.65%
1.75–2.00
(High-level vegetation growth)
Area/km20.0060.2367.5348.5464.8488.4902.2606.185
Percentage0.02%0.74%23.63%26.80%15.21%26.63%7.09%19.40%
2.00–4.00
(Remarkably dense-level vegetation growth)
Area/km20.0000.0040.6542.4432.1003.6130.3843.367
Percentage0.00%0.01%2.05%7.66%6.59%11.33%1.21%10.56%
Table A2. Areas and percentages of different land type changes in two adjacent years from 2011 to 2018 in the study region.
LTCYear2011–20122012–20132013–20142014–20152015–20162016–20172017–2018
L-L-WArea/km20.110.121.181.081.621.290.79
Percentage0.34%0.38%3.69%3.38%5.09%4.03%2.48%
V-L-WArea/km22.160.610.981.841.711.263.48
Percentage6.78%1.93%3.06%5.77%5.35%3.95%10.91%
V-V-WArea/km20.820.8611.1020.714.5125.431.53
Percentage2.58%2.71%34.82%64.95%14.16%79.77%4.81%
L-L-BArea/km20.071.320.320.860.882.471.97
Percentage0.22%4.15%1.00%2.71%2.75%7.76%6.17%
L-V-BArea/km20.230.920.560.531.280.452.26
Percentage0.73%2.89%1.77%1.66%4.01%1.40%7.09%
V-V-BArea/km228.4828.0417.756.8721.880.9921.85
Percentage89.34%87.94%55.66%21.54%68.64%3.09%68.55%
(L-V-B)-
(V-L-W)
Area/km2−1.930.31−0.41−1.31−0.43−0.81−1.22
Table A3. Interannual vegetation growth of restoration vegetation of each year from 2013 to 2018 in the study region.
Restoration Beginning YearAnalysis Year0.00–1.24
(Bare Land)
1.24–1.75
(Low-Level Vegetation Growth)
1.50–1.75
(Medium-Level Vegetation Growth)
1.75–2.00
(High-Level Vegetation Growth)
2.00–4.00
(Remarkably Dense-Level Vegetation Growth)
Area/km2PercentageArea/km2PercentageArea/km2PercentageArea/km2PercentageArea/km2Percentage
201320130.0000.00%0.88596.03%0.0353.82%0.0010.15%0.0000.00%
20140.11312.26%0.69475.30%0.0586.30%0.0283.00%0.0293.15%
20150.16017.37%0.63769.08%0.09710.55%0.0272.92%0.0010.07%
20160.12813.94%0.54559.17%0.15616.92%0.0262.85%0.0667.12%
20170.16117.46%0.64770.17%0.10811.69%0.0060.67%0.0000.00%
20180.0889.59%0.51656.02%0.20021.72%0.0444.72%0.0737.95%
201420140.0000.00%0.33559.26%0.09416.64%0.08414.93%0.0529.18%
20150.0162.75%0.28350.03%0.24042.57%0.0234.16%0.0030.49%
20160.0101.71%0.14525.62%0.09416.64%0.08414.80%0.23341.23%
20170.0152.60%0.28350.06%0.25645.39%0.0111.96%0.0000.00%
20180.0091.59%0.10318.28%0.14024.83%0.10518.60%0.20736.70%
201520150.0000.00%0.46086.73%0.07013.27%0.0000.00%0.0000.00%
20160.0438.07%0.23544.30%0.07113.40%0.05410.15%0.12824.07%
20170.0438.07%0.29555.50%0.17532.92%0.0193.51%0.0000.00%
20180.0132.47%0.20839.23%0.10319.39%0.05310.02%0.15328.89%
201620160.0000.00%0.85867.19%0.21116.54%0.1269.89%0.0826.38%
20170.0987.63%0.59746.74%0.56544.22%0.0171.30%0.0010.11%
20180.0211.68%0.22417.51%0.20215.84%0.39330.76%0.43734.22%
201720170.0000.00%0.448100.00%0.0000.00%0.0000.00%0.0000.00%
20180.0092.00%0.12828.52%0.22450.12%0.08218.28%0.0051.08%
201820180.0000.00%1.72676.40%0.48121.30%0.0522.31%0.0000.00%
Table A4. Statistics on the effects of restoration vegetation from 2013 to 2018 in the study region.
Effect LevelYear201320142015201620172018
0 (Poor effect)Area/km20.2470.0220.0590.0910.0090.000
Percentage26.85%3.97%11.19%7.09%2.00%0.00%
1 (Inferior effect)Area/km20.5900.2340.2760.5590.3521.726
Percentage64.00%41.47%51.98%43.71%78.64%76.40%
2 (Medium effect)Area/km20.0660.2070.1290.4310.0870.481
Percentage7.12%36.70%24.33%33.73%19.35%21.30%
3 (Good effect)Area/km20.0190.1010.0660.1960.0000.052
Percentage2.02%17.86%12.49%15.35%0.00%2.31%
4 (Excellent effect)Area/km20.0000.0000.0000.0010.0000.000
Percentage0.00%0.00%0.00%0.11%0.00%0.00%
The total area/km20.9210.5650.5311.2780.4482.259

References

  1. Rijimoleng, S.; Pei, M. Empirical analysis of the influence of natural resources on regional economic growth: Based on the sample of key coal cities in China from 2000 to 2016. J. Nat. Res. 2019, 34, 2491–2503, (In Chinese with English Abstract). [Google Scholar]
  2. Soni, A.K. Estimation of Mine Water Quantity: Development of Guidelines for Indian Mines. Mine Water Environ. 2020, 39, 397–406. [Google Scholar] [CrossRef]
  3. Paulina, L.; Artur, D. Thermal digital terrain model of a coal spoil tip—A way of improving monitoring and early diagnostics of potential spontaneous combustion areas. Ecol. Eng. 2016, 17, 170–179. [Google Scholar]
  4. Batino, C.; Alegado, S. New Environment Chief for Philippines Decries Mining Industry’s ‘Pathetic Record’. Int. Environ. Report. 2016, 39, 910–911. [Google Scholar]
  5. Qin, X.; Chen, H.K. Research status and trend of mine geological environment protection. Yangtze River 2017, 48, 74–79, (In Chinese with English Abstract). [Google Scholar]
  6. Lebrun, M.; Miard, F.; Nandillon, R.; Hattab, H.N.; Scippa, G.S.; Sylvain, B.; Morabito, D. Eco-restoration of a mine technosol according to biochar particle size and dose application: Study of soil physico-chemical properties and phytostabilization capacities of Salix viminalis. J. Soils Sediments 2018, 18, 2188–2202. [Google Scholar] [CrossRef]
  7. Ministry of Natural Resources of the People’s Republic of China. Available online: http://www.mnr.gov.cn (accessed on 1 January 2020).
  8. Hernandez, S.L.; Erskine, P.D.; Bartolo, R.E. A review of revegetation at mine sites in the Alligator Rivers Region, Northern Territory, and the development of a state and transition model for ecological restoration at Ranger uranium mine. J. Clean. Prod. 2020, 246, 119079. [Google Scholar] [CrossRef]
  9. Brück, Y.; Overberg, P.; Pohle, I.; Hinz, C. NDVI (Normalized Difference Vegetation Index) signatures of transient ecohydrological systems: The case of post-mining landscapes. In Proceedings of the EGU General Assembly 2017, Vienna, Austria, 27 April 2017; p. 5353. [Google Scholar]
  10. Ma, C.; Guo, Z.Z.; Zhang, X.K.; Han, R.M. Annual integral changes of time serial NDVI in mining subsidence area. Trans. Nonferrous Met. Soc. China 2011, 21, 583–588. [Google Scholar] [CrossRef]
  11. Yu, H.Y.; Cheng, G.; Ge, X.S.; Lu, X.P. Object oriented land cover classification using ALS and GeoEye imagery over mining area. Trans. Nonferrous Met. Soc. China 2011, 21, 733–737. [Google Scholar] [CrossRef]
  12. Kalabin, G.V. Qualitative assessment of vegetation in disturbed mining-and-metallurgical areas by the remote and surface monitoring. J. Min. Sci. 2011, 47, 538–546. [Google Scholar] [CrossRef]
  13. ShiveshK, K.; SukhaR, S.; Subodh, K.M. Assessment of the capability of remote sensing and GIS techniques for monitoring reclamation success in coal mine degraded lands. J. Environ. Manag. 2016, 182, 272–283. [Google Scholar]
  14. Erener, A. Remote sensing of vegetation health for reclaimed areas of Seyitömer open cast coal mine. Int. J. Coal Geol. 2010, 86, 20–26. [Google Scholar] [CrossRef]
  15. Narayan, K.; Khanindra, P.; Abhisek, C.; Subodh, K.; Chowdary, V.M.; Singh, C.P.; Satiprasad, S.; Samrat, B. Assessment of foliar dust using Hyperion and Landsat satellite imagery for mine environmental monitoring in an open cast iron ore mining areas. J. Clean. Prod. 2019, 218, 993–1006. [Google Scholar]
  16. Tote, C.; Swinnen, E.; Goossens, M.; Reusen, I.; Delalieux, S. Assessment of the environmental effects of mining using SPOT-Vegetation NDVI. In Proceedings of the EGU General Assembly 2012, Vienna, Austria, 22–27 April 2012; p. 9234. [Google Scholar]
  17. Zhao, J.J.; Lu, M.X.; Gu, H.H.; Yuan, X.T.; Li, F.P. Study on the ecological restoration of mining area based on the change of vegetation coverage. Min. Res. Dev. 2018, 38, 115–118, (In Chinese with English Abstract). [Google Scholar]
  18. Qiao, Z.Y.; Liu, D.W.; Wei, T.T.; Jiang, S.; Chen, Y.K.; Zeng, J.Y. Dynamic monitoring of vegetation coverage in Daliuta mine based on ENVI and GIS technology. Adv. Mat. Res. 2014, 1010, 377–380. [Google Scholar] [CrossRef]
  19. Ni, S.B.; Li, X.W.; Shan, J.L.; Na, L. Scale parameter optimization through high-resolution imagery to support mine rehabilitated vegetation classification. Ecol. Eng. 2016, 97, 130–137. [Google Scholar]
  20. Cai, X.H.; He, B.H.; Li, X.G. An Investigation of Plants and Vegetation in Some Mine Slag Disposal Yards. J. Southwest Univ. 2010, 32, 101–106. [Google Scholar]
  21. Nastasia, W.; Emmanuel, J.; Marilyne, S.; Jean, F.L. Arsenic (As), antimony (Sb), and lead (Pb) availability from Au-mine Technosols: A case study of transfer to natural vegetation cover in temperate climates. Environ. Geochem. Health 2014, 36, 783–795. [Google Scholar]
  22. Li, Y.L.; Zhang, C.K.; Liu, J.Y.; Li, J. Visualization of Mining Monitoring Is the Development Direction of Coal Mine Safety Production. Adv. Mat. Res. 2012, 524, 391–395. [Google Scholar] [CrossRef]
  23. Er, D. Study on Suitability Evaluation of Urban and Rural Construction Land in Dongsheng District of Ordos City. Master’s Thesis, Inner Mongolia Normal University, Hohhot, Inner Mongolia, China, 27 June 2017. (In Chinese with English Abstract). [Google Scholar]
  24. Ren, S.; Yi, S.; Peichl, M.; Wang, X. Diverse Responses of Vegetation Phenology to Climate Change in Different Grasslands in Inner Mongolia during 2000–2016. Remote Sens. 2018, 10, 17. [Google Scholar] [CrossRef] [Green Version]
  25. Lanhui, W.; Rasmus, F. Temporal Changes in Coupled Vegetation Phenology and Productivity are Biome-Specific in the Northern Hemisphere. Remote Sens. 2017, 9, 1277. [Google Scholar] [CrossRef] [Green Version]
  26. Wang, H.; Liu, G.H.; Li, Z.S.; Ye, X.; Fu, B.J.; Lv, Y.H. Impacts of Drought and Human Activity on Vegetation Growth in the Grain for Green Program Region, China. Chin. Geogra. Sci. 2018, 28, 470–481. [Google Scholar] [CrossRef] [Green Version]
  27. Shan, L.S.; Yu, X.; Sun, L.X.; He, B.; Wang, H.Y.; Xie, T.T. Seasonal differences in climatic controls of vegetation growth in the Beijing–Tianjin Sand Source Region of China. J. Arid Land 2018, 10, 850–863. [Google Scholar] [CrossRef] [Green Version]
  28. Zhao, A.Z.; Pei, T.; Cao, S.; Zhang, A.B.; Fan, Q.Q.; Wang, J.J. Impacts of urbanization on vegetation growth and surface urban heat island intensity in the Beijing-Tianjin-Hebei. China Environ. Sci. 2020, 40, 1825–1833. [Google Scholar]
  29. Zhang, Y.X.; Wang, Y.K.; Fu, B.; Dixit, A.M.; Chaudhary, S.; Wang, S. Impact of climatic factors on vegetation dynamics in the upper Yangtze River basin in China. J. Mt. Sci. 2020, 17, 1235–1250. [Google Scholar] [CrossRef]
  30. Du, Z.W.; Yang, H.Z. Gangue-Cemented Fill in Goaf to Control Surface Subsidence during Longwall Mining: A Case Study from the Huaheng Coal Mine, China. Geotech. Geol. Eng. 2018, 37, 2453–2461. [Google Scholar] [CrossRef]
  31. Yu, H.D.; Yang, X.C.; Xu, B.; Jin, Y.X.; Gao, T.; Li, J.Y. The progress of remote sensing monitoring for grassland vegetation growth. Prog. Geogr. 2012, 31, 885–894, (In Chinese with English Abstract). [Google Scholar]
  32. Gamon, J.A.; Huemmrich, K.F.; Stone, R.S.; Tweedie, C.E. Spatial and temporal variation in primary productivity (NDVI) of coastal Alaskan tundra: Decreased vegetation growth following earlier snowmelt. Remote Sens. Environ. 2013, 129, 144–153. [Google Scholar] [CrossRef] [Green Version]
  33. Brown, L.; Chen, J.M.; Leblanc, S.G.; Cihlar, J. A shortwave infrared modification to the simple ratio for LAI retrieval in boreal forests—Geography, ecology and silviculture. Med. Phys. 2010, 37, 3115. [Google Scholar]
  34. Zhao, H.; Yang, Z.W.; Li, L.; Di, L.P. Improvement and comparative analysis of remote sensing monitoring indicators for crop growth. Trans. CSAE 2011, 27, 243–249, (In Chinese with English Abstract). [Google Scholar]
  35. Gu, Z.H.; Chen, J.; Shi, P.J.; Xu, M. Correlation analysis of Normalized Different Vegetation Index (NDVI) difference series and climate variables in the Xilingole steppe, China from 1983 to 1999. Front. Biol. China 2007, 2, 218–228. [Google Scholar] [CrossRef]
  36. Yu, H.; Yang, X.; Xu, B.; Jin, Y.; Li, J. Changes of grassland vegetation growth in Xilin Gol League over 10 years and analysis on the influence factors. Geo-Inf. Sci. 2013, 15, 270. [Google Scholar] [CrossRef]
  37. Yang, Z.; Li, W.; Pei, Y.; Qiao, W.; Wu, Y. Classification of the type of eco-geological environment of a coal mine district: A case study of an ecologically fragile region in Western China. J. Clean. Prod. 2018, 174, 1513–1526. [Google Scholar] [CrossRef]
  38. Hufkens, K.; Bogaert, J.; Dong, Q.H.; Lu, L.; Huang, C.L.; Mingguo, M.; Che, T.; Li, X.; Veroustraete, F.; Ceulemans, R. Impacts and uncertainties of upscaling of remote-sensing data validation for a semi-arid woodland. J. Arid Environ. 2008, 72, 1490–1505. [Google Scholar] [CrossRef]
  39. Huang, C.; Bao, W. A Remote Sensing Image Fusion Algorithm Based on the Second Generation Curvelet Transform and DS Evidence Theory. J. Indian Soc. Remote Sens. 2014, 42, 645–650. [Google Scholar] [CrossRef]
  40. Ma, W.; Ma, C.; Zhao, P.; Liu, W. Variation Trend and Climate Response of NDVI3g in Lu’an Mining Area from 1982 to 2013. Res. Environ. Sci. 2017, 30, 1050–1058. [Google Scholar]
  41. Jose, A.N.; Miguel, V.; Goberna, M. Trait-based selection of nurse plants to restore ecosystem functions in mine tailings. J. Appl. Ecol. 2018, 55, 1195–1206. [Google Scholar]
  42. Zhang, G.; Su, X.; Singh, V.P.; Ayantobo, O.O. Modeling NDVI Using Joint Entropy Method Considering Hydro-Meteorological Driving Factors in the Middle Reaches of Hei River Basin. Entropy 2017, 19, 502. [Google Scholar] [CrossRef] [Green Version]
  43. Shary, P.A.; Sharaya, L.S. Change in NDVI of forest ecosystems in Northern Caucasus as a function of topography and climate. Contemp. Probl. Ecol. 2015, 7, 855–863. [Google Scholar] [CrossRef]
  44. Hou, X.Y.; Liu, S.L.; Zhao, S.; Beazley, R.E.; Cheng, F.Y.; Wu, X.; Xu, J.W.; Dong, S.K. Selection of adequate species as a key factor for vegetation restoration of degraded areas in an open-pit manganese ore mine in southern china using multivariate analysis methods. Land Degrad. Dev. 2019, 30, 942–950. [Google Scholar] [CrossRef]
  45. Blanco, M.P.; Fidalgo, E.; Alegre, E.; Vasco, R.A.; Jañez, M.F.; Villar, V.F. Detecting Vulnerabilities in Critical Infrastructures by Classifying Exposed Industrial Control Systems Using Deep Learning. Appl. Sci. 2021, 11, 367. [Google Scholar] [CrossRef]
  46. Propastin, P.A.; Kappas, M.; Muratova, N.R. A remote sensing based monitoring system for discrimination between climate and human-induced vegetation change in Central Asia. Manag. Environ. Qual. 2008, 19, 579–596. [Google Scholar] [CrossRef] [Green Version]
  47. Ranjan, V.; Sen, P.; Kumar, D.; Sarsawat, A. Enhancement of mechanical stability of waste dump slope through establishing vegetation in a surface iron ore mine. J. Min. Sci. 2017, 53, 377–388. [Google Scholar] [CrossRef]
  48. Wu, X.; Liu, H.; Li, X.; Piao, S.; Ciais, P.; Guo, W.; Yin, Y.; Ben, P.; Peng, C.; Nicolas, V.; et al. Higher temperature variability reduces temperature sensitivity of vegetation growth in Northern Hemisphere. Geophys. Res. Lett. 2017, 44, 6173–6181. [Google Scholar] [CrossRef]
  49. Zhu, L.; Gong, H.; Dai, Z.; Xu, T.; Su, X. An integrated assessment of the impact of precipitation and groundwater on vegetation growth in arid and semiarid areas. Environ. Earth Sci. 2015, 74, 5009–5021. [Google Scholar] [CrossRef] [Green Version]
  50. Li, L.; Zha, Y.; Zhang, J.; Li, Y.; Lyu, H. Effect of terrestrial vegetation growth on climate change in China. J. Environ. Manag. 2020, 262, 110321. [Google Scholar] [CrossRef] [PubMed]
  51. Wang, H.Q.; Chen, L. Analysis of the effect of environmental restoration and management of Xigaze mine in Tibet. Min. R D 2018, 38, 111–114, (In Chinese with English Abstract). [Google Scholar]
  52. Sanaei, A.; Li, M.; Ali, A. Topography, grazing, and soil textures control over rangelands’ vegetation quantity and quality. Sci. Total Environ. 2019, 697, 134153. [Google Scholar] [CrossRef] [PubMed]
  53. Wang, J.M.; Wang, H.D.; Cao, Y.G.; Bai, Z.; Qin, Q. Effects of soil and topographic factors on vegetation restoration in opencast coal mine dumps located in a loess area. Sci. Rep. 2016, 6, 22058. [Google Scholar] [CrossRef] [PubMed] [Green Version]
  54. Ding, Y.; Li, Z.; Peng, S. Global analysis of time-lag and -accumulation effects of climate on vegetation growth. Int. J. Appl. Earth Obs. Geoinf. 2020, 92, 102179. [Google Scholar] [CrossRef]
  55. Zhang, D.; Jia, Q.; Xu, X.; Yao, S.; Chen, H.; Hou, X. Contribution of ecological policies to vegetation restoration: A case study from Wuqi county in Shaanxi Province, China. Land Use Policy 2018, 73, 400–411. [Google Scholar] [CrossRef]
  56. Pei, T.; Wu, X.; Li, X.; Zhang, Y.; Fang, Z.; Ma, Y.; Wang, P.; Zhang, C. Seasonal divergence in the sensitivity of evapotranspiration to climate and vegetation growth in the Yellow River Basin, China. J. Geophys. Res. Biogeosci. 2017, 122, 103–118. [Google Scholar] [CrossRef]
  57. Zhang, L.; Liu, Z.; Ren, T.; Liu, D.; Ma, Z.; Tong, L.; Zhang, C.; Zhou, T.; Zhang, X.; Li, S. Identification of seed maize fields with high spatial resolution and multiple spectral remote sensing using random forest classifier. Remote Sens. 2020, 12, 362. [Google Scholar] [CrossRef] [Green Version]
  58. Jang, E.; Kang, Y.; Im, J.; Lee, D.-W.; Yoon, J.; Kim, S.-K. Detection and Monitoring of Forest Fires Using Himawari-8 Geostationary Satellite Data in South Korea. Remote Sens. 2019, 11, 271. [Google Scholar] [CrossRef] [Green Version]
  59. White, J.C.; Wulder, M.A.; Hobart, G.W.; Luther, J.E.; Hermosilla, T.; Griffiths, P.; Coops, N.C.; Hall, R.J.; Hostert, P.; Dyk, A.; et al. Pixel-based image compositing for large-area dense time series applications and science. Can. J. Remote Sens. 2014, 40, 192–212. [Google Scholar] [CrossRef] [Green Version]
  60. Hermosilla, T.; Wulder, M.; White, J.; Coops, N.; Hobart, G.; Campbell, L. Mass data processing of time series Landsat imagery: Pixels to data products for forest monitoring. Int. J. Digit. Earth 2016, 9, 1035–1054. [Google Scholar] [CrossRef] [Green Version]
  61. Adamu, B.; Tansey, K.; Ogutu, B. Remote sensing for detection and monitoring of vegetation affected by oil spills. Int. J. Remote Sens. 2018, 39, 3628–3645. [Google Scholar] [CrossRef] [Green Version]
Figure 1. Image of the Bayin Mengkenayuan coal mine in Dongsheng District, Erdos City, Inner Mongolia of China (at 0.23 m, true color, Google Earth image in August 2019).
Remotesensing 13 01350 g001
Figure 2. Main workflow of the proposed method.
Remotesensing 13 01350 g002
Figure 3. Comparison of the vegetation index NDVI, SR and GRNDVI on 15 August 2014.
Remotesensing 13 01350 g003
Figure 4. Landsat false-color images of study region from 2011 to 2018.
Remotesensing 13 01350 g004
Figure 5. Spatial distribution of the GRNDVI levels from 2011 to 2018 in the study region.
Remotesensing 13 01350 g005aRemotesensing 13 01350 g005b
Figure 6. Statistics of changes in vegetation growth from 2011 to 2018 in the study region.
Remotesensing 13 01350 g006
Figure 7. The spatial distribution of sample points in 2016 and 2018.
Remotesensing 13 01350 g007
Figure 8. Change of land type in two adjacent years from 2011 to 2018 in the study region.
Remotesensing 13 01350 g008aRemotesensing 13 01350 g008b
Figure 9. Percentage of different land type changes in two adjacent years from 2011 to 2018 in the study region.
Remotesensing 13 01350 g009
Figure 10. Comparison of the restoration and natural vegetation growths from 2013 to 2018 in the study region.
Remotesensing 13 01350 g010
Figure 11. Inter-annual variation of restoration vegetation growth of each year from 2013 to 2018 in the study region.
Remotesensing 13 01350 g011
Figure 12. Restoration vegetation effects of each year from 2013 to 2018 (0, 1, 2, 3, and 4 represent poor, inferior, medium, good, and excellent restoration effects, respectively).
Remotesensing 13 01350 g012
Figure 13. Overall restoration vegetation effects from 2013 to 2018 (from 0.23 m, true color, Google Earth image in August 2019).
Remotesensing 13 01350 g013
Table 1. The information of using Landsat images (from April to October).
YearImage NumberSensor and Image Date List
20119TM: From 17 April 2011 to 24 September 2011
20129ETM+: From 27 April 2012 to 18 September 2012
201310OLI: From 3 April 2013 to 29 September 2013
201410OLI: From 9 April 2014 to 2 October 2014
201512OLI: From 12 April 2015 to 5 October 2015
201613OLI: From 14 April 2016 to 23 October 2016
201712OLI: From 1 April 2017 to 26 October 2017
201812OLI: From 20 April 2018 to 29 October 2018
Table 2. Accuracy evaluation of GRNDVI classification results in years 2016 and 2018.
Sentinal 2 Image DataClassification Result DateOverall Accuracy
19 May 2016201693%
7 August 2016201692%
26 October 2016201694%
24 May 2018201892%
28 June 2018201893%
11 October 2018201891%
Publisher’s Note: MDPI stays neutral with regard to jurisdictional claims in published maps and institutional affiliations.

