Article

Satellite-Derived Variation in Burned Area in China from 2001 to 2018 and Its Response to Climatic Factors

1
State Key Laboratory of Earth Surface Processes and Resource Ecology, Faculty of Geographical Science, Beijing Normal University, Beijing 100875, China
2
State Key Laboratory of Remote Sensing Science, Jointly Sponsored by Beijing Normal University and Institute of Remote Sensing and Digital Earth of Chinese Academy of Sciences, Beijing 100875, China
*
Author to whom correspondence should be addressed.
Remote Sens. 2021, 13(7), 1287; https://doi.org/10.3390/rs13071287
Submission received: 5 March 2021 / Revised: 23 March 2021 / Accepted: 25 March 2021 / Published: 28 March 2021
(This article belongs to the Special Issue Remote Sensing Images Processing for Disasters Response)

Abstract

:
Fire is one of the most widespread and destructive disasters, which causes property losses, casualties, and disruption of the balance of ecosystems. Therefore, it is highly necessary for firefighting to study the variations in fire and its climatic attributions. This study analyzed the characteristics of fire-burned area (BA) and its response to climatic factors in seven subregions of China from 2001 to 2018 using satellite remote sensing BA products. The results show that the BA in China and most of its subregions shows a decreasing trend. In general, it is negatively correlated with precipitation and positively correlated with air temperature and wind speed based on the regression and correlation analyses. Based on Pearson correlation and random forest methods, it is also found that the temperature is commonly an important factor contributing to BA in China, except for R2 (Inner Mongolia region), where wind speed is more important, and R5 (South China), where precipitation is more important, which coexists at annual and seasonal scales. Besides temperature, precipitation in spring and summer is the main driving factor, such as in R1 (Northeast China), R5, R6 (Northwest China) and R7 (Qinghai–Tibet Plateau) in spring and R4 (Central China), R5 and R7 in summer; and wind speed in autumn and winter is the main driving factor, such as in R2 and R4 in autumn and R2, R3, R5, R6 and R7 in winter. Finally, the distributions of BA with respect to each climatic factor were also analyzed to quantify the range of climatic factors with maximum BA occurrence.

Graphical Abstract

1. Introduction

Fire is a destructive and sudden natural disaster [1]. It is mainly caused by natural or human factors and has an important influence on ecological succession [2]. Small and medium-sized fires burn excess combustible material and can promote forest regeneration [3,4,5], while large fires can destroy the ecological balance, cause loss of ecological resources [6,7,8] and bring a series of environmental pollution problems, such as an increase in aerosols and greenhouse gases [9,10,11,12]. In particular, the percentage of forest area lost due to fires is up to 6.5% per year in China [13].
There are several million hectares of forests burned around the world every year, accounting for around 0.1% of the world forest area [14]. China is one of the major countries in the world where fires occur frequently. From 1950 to 1990, there were 6.26 × 10⁵ fires and 8.2 × 10⁵ hectares (ha) of burned area (BA) in China [13]. According to research statistics, most of the hotspots in China from 2008 to 2012 were caused by prescribed, agricultural burning and forest fires [15].
Severe fires mainly occur in large areas of forests and grasslands; therefore, remote sensing monitoring is a very useful fire detection method. The application of meteorological satellites in fire monitoring has the advantages of wide range, high time frequency and high accuracy. It can not only detect the fire as soon as possible, but also continuously track and monitor the dynamics of heavy fire. Therefore, it is a relatively effective fire monitoring method, especially for collecting a wide range of fire data.
At present, there are some common fire remote sensing products in BA throughout the world, such as the MCD45 [16] and MCD64 [17] products based on NASA’s Moderate Resolution Imaging Spectroradiometer (MODIS). In 2010, the European Space Agency (ESA) launched Climate Change Initiative (CCI) projects. As part of the ESA-CCI project, the fire_cci project produced a set of global BA products based on the European sensor MERIS and the highest-resolution channels of MODIS (250 m). The former covers the period from 2005 to 2011 (named FireCCI41) and the latter covers the period from 2001 to 2016 (named FireCCI50). Although FireCCI50 has better performance than FirecCCI41, it has still high commission and omission errors, similar to other BA products [18]. To overcome this, Lizundia-Loiola et al. [19] proposed a two-phase hybrid approach to seed detection and region growing based on MODIS’ highest-resolution (250 m) near-infrared band and active fire information from its thermal channels. This approach obtains higher accuracy in the global BA dataset (named FireCCI51) covering the 2001−2018 period.
In recent years, climate change has increased the frequency of extreme weather events [20,21] and, correspondingly, the occurrence probability of fires [22,23]. Climate change affects the occurrence and dynamics of fire by changing meteorological factors such as air temperature (abbreviated as temperature), precipitation, humidity, evaporation and wind speed [24,25]. Pausas et al. [26] found that the summer temperature and precipitation were significantly correlated with the number and BA of forest fires in the Iberian Peninsula. Westerling et al. [22] found that the increase in forest fires in the northern Rocky Mountains is strongly correlated with the warming in spring and summer and the advance of snow melting time. Heyerdahl et al. [27] found that the forest fires in the Northwest America were synchronous with the dry and wet changes in spring and summer. Lehmann et al. [28] found that when precipitation exceeded 500 mm, the BA in Australia had a strong correlation with the average precipitation.
There are also many studies on the impact of climate change on fire throughout China. Chang et al. [29] found that climate variables and meteorological conditions were the main determinants of natural forest fires in Heilongjiang Province, which lies in the northeastern region of China and experiences a sub-frigid continental climate. Its annual average temperature is around 2.6 °C and precipitation is around 515 mm. Ying et al. [30] explored the effect of instantaneous and local environmental factors on wildfires in Yunnan Province, Southwest China using three MODIS fire products. Yunnan Province experiences a subtropical monsoon climate and its annual average temperature is around 15 °C and precipitation is around 1000 mm. Pan et al. [31] assessed the influences of land surface temperature and other vegetation indices on fire events occurring in Shanxi Province, China. Shanxi Province experiences a temperate continental climate and its annual average temperature is around 12 °C and precipitation is around 600 mm. The attribution results found that the land temperature and normalized difference vegetation index significantly affect fire occurrence. Wu et al. [32] assessed the relative effects of climate and local factors (such as vegetation, topography and human activity) on fire occurrence in the boreal forest landscapes of Northeastern China and finally found that climate was the primary fire occurrence factor and human activity factors were secondary. More research on fire associated with climate factors also focused on Chinese boreal forests [33,34]. In addition, smaller fire events were detected to analyze their dynamics and climate effects in a mountainous area in Northwest Yunnan Province [35] and eastern agricultural regions in China [36]. Notably, these studies focused on the relationship between climatic factors and fire at provincial or subregional scale rather than national scale. Different climate characteristics have different fire attributions.
Additionally, there are some studies conducted at national scale, but some limitations exist: (1) The fire data of these studies are from historical ground survey data rather than remote sensing products. In addition, the fire data for the 21st century in China are not evaluated. For example, Ying et al. [5] analyzed China’s forest fires and relevant factors including climate, fuel and topography based on 1989–1991 survey data. Zhong et al. [13] revealed the statistical features of fire regimes in China from 1950 to 1990; (2) More studies only assessed the effect of precipitation and temperature on China’s forest fire regimes [37,38,39], but other climatic factors (e.g., wind speed, etc.) that may also affect the fire BA were rarely considered; (3) We also noted that some satellite fire products have been used to evaluate the fire characteristics and its climate attribution in China. For example, Ma et al. [40] assessed the impact of climate, topographic, vegetation and socioeconomic variables on forest fire occurrence using a reasonable random forest model and mapped forest fire occurrence likelihood using the model; however, they focused on the analysis of fire occurrence (or fire number) rather than fire BA, and the data period of 2010–2016 was relatively short.
In contrast with previous work, this study will not only analyze the distributions and trends of fire BA from 2001 to 2018 in seven subregions of China using the advanced FireCCI51 BA product, but also evaluate the effects of three climatic factors (precipitation, temperature and wind speed) on BA, aiming to provide a reference for future fire management policies in China.

2. Materials and Methods

2.1. Study Area

This paper divides China into seven ecological geographical subregions according to the geographical zoning and climatic characteristics. These subregions include R1 (humid and semi-humid regions of Northeast China), R2 (semiarid region of Inner Mongolia), R3 (humid and semi-humid regions of North China), R4 (humid region of Central China), R5 (humid region of South China), R6 (arid region of Northwest China) and R7 (arid and semiarid regions in the Qinghai–Tibet Plateau). Their ranges are shown in Figure 1. Forests are mainly distributed in R1, R4 and R5, grasslands are mainly distributed in R2, R6 and R7, while crops are mainly distributed in R1, R3 and R4. Additionally, there are larger areas of desert in southern R6 and northwestern R2.

2.2. Data Sources

The BA dataset comes from the Fire_CCI versions 5.1 (FireCCI51) grid product, derived from the data website of the ESA-CCI [41]. The BA product includes the total BA within each grid, the standard error estimated by BA, BA in vegetation class within each grid, fraction of burnable area, fraction of observed area and the number of different burn patches. The spatial resolution of the product is 0.25°, and the temporal resolution is monthly. The data covered 18 years from 2001 to 2018. In this paper, the total BA data within each grid were selected to analyze the temporal and spatial variation in fire in China. The BA unit is ha.
The climate data were obtained from the fifth-generation European Centre for Medium-Range Weather Forecasts (ERA5) reanalysis product [42]. The ERA5 (available online: https://cds.climate.copernicus.eu accessed on 17 February 2019) provides a relatively accurate estimation of the composition of atmospheres, oceans and land surfaces using the laws of physics and data assimilation methods. The spatial resolution of the product is 0.25°, and the temporal resolution is monthly. In this paper, the ERA5 products of temperature (2-m temperature), precipitation (total precipitation) and wind speed (10-m wind speed) from 2001 to 2018 in China were selected as the main climatic factors. The units of temperature and precipitation are Celsius (°C) and millimeter (mm), respectively. The unit of wind speed is m/s. Note that there are some more accurate climate data available from the China Meteorological Data Service Centre (CMDSC), but either the time period is inconsistent with the fire data or there are no comprehensive climate variable data (such as lack of wind speed data) for multivariate impact analysis, and therefore the data from CMDSC were not used in this study. However, ERA5 has a consistent spatial resolution and time length with BA data, and some studies have demonstrated that it shows good consistency with the site data from CMDSC at monthly, seasonal or even annual scale in China [43,44,45,46]. Therefore, the climate data of ERA5 were used.
The land cover maps were obtained from the MODIS Land Cover Type Product (MCD12Q1) [47]. They were created based on the spectral–temporal feature classification derived from MODIS data. The spatial resolution is 500 m. The MCD12Q1 product offers six different classification schemes and its first classification scheme, named the International Geosphere–Biosphere Programme (IGBP) land cover classification [48], was used here.

2.3. Correlation Analysis

Multivariable linear regression is a statistical method that uses a regression equation to determine the degree of influence of independent variables on dependent variables. The regression equation established in this study is expressed as follows.
BA = aT + bP + cW + d
where a, b, c are partial regression coefficients of temperature, precipitation and wind speed, respectively, and d is the residual term. The regression coefficients of the independent climatic variable are used to analyze the positive or negative correlation between BA and the independent climatic variable. At annual scale, the coefficients are obtained based on the annual sequences of four variables. At seasonal scale, the variable values at each season of one year are averaged, and then the average values in the same season from different years are ranked as a year sequence. Finally, the annual sequences for four variables at a certain season are combined to obtain a seasonal regression coefficient.
Pearson correlation analysis was used to analyze the correlation relationship between BA and each of the three climatic factors in each subregion. The usage of the Pearson correlation analysis method not only can examine the reasonability of the multivariable regression results but also provides a significance test of the regional correlation results between BA and the climatic factors. Note that three significance levels (p < 0.1, p < 0.05 and p < 0.01) were defined as a significant trend or correlation, and the significance level range (0.1 < p < 0.3) was referred to as a weak trend or correlation.
The random forest algorithm was also used to assess the contributions of the climatic factors to BA. Unlike multivariable linear regression, the random forest model is a nonlinear multivariable statistic model built using a modern machine learning algorithm of classification or regression trees (CART). Two thirds of the sampling data (e.g., the climatic variable and BA values at all grids) are used to train a reasonable random forest model using the CART method and the remaining one third of the sampling data for model validation. Variable importance is measured in the validation process by the following formula [49,50]:
V I ( X j ) = 1 n t r e e t ( e r r O O B t j e r r O O B t j )
where X j is the jth variable, ntree is the number of trees, e r r O O B t j is the error of each tree t in the validated dataset, e r r O O B t j is a new error for each tree t when its variable j is removed while other variables remain unchanged. The V I ( X j ) is also called the increase in mean squared error (IncMSE) for jth variable. The percentage of IncMSE represents its contribution ratio.
Both Pearson linear correlation analysis and random forest nonlinear algorithm can determine the main driving factors. However, there are some differences between them: (1) the Pearson correlation shows a positive/negative correlation between BA and climatic factor directly, while the random forest offers the contribution ratio of each factor by residual decomposition; therefore, it does not directly distinguish between positive and negative correlations; (2) the contribution ratio of random forest is a relative concept, and it is subject to the determination of the threshold value distinguishing between high and low contributions. Meanwhile, a significant correlation in the Pearson method has strong statistical significance and thus its correlation is usually considered to be objective. Therefore, we should make full use of the advantages of the two methods to analyze the climate attributions of BA more comprehensively.
In addition, monthly-scale data of BA and climatic factors were analyzed to quantify the critical range of climatic factors with maximum BA. Specifically, the climate data (e.g., monthly average temperature, precipitation or wind speed in 18 years) were firstly divided into several intervals by magnitude of values, and then the average BA in each interval was calculated. Finally, a histogram of average BA with different interval climatic factors was obtained.

3. Results

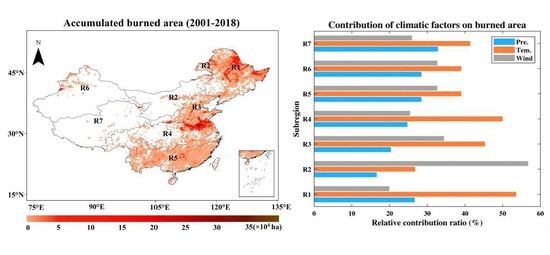
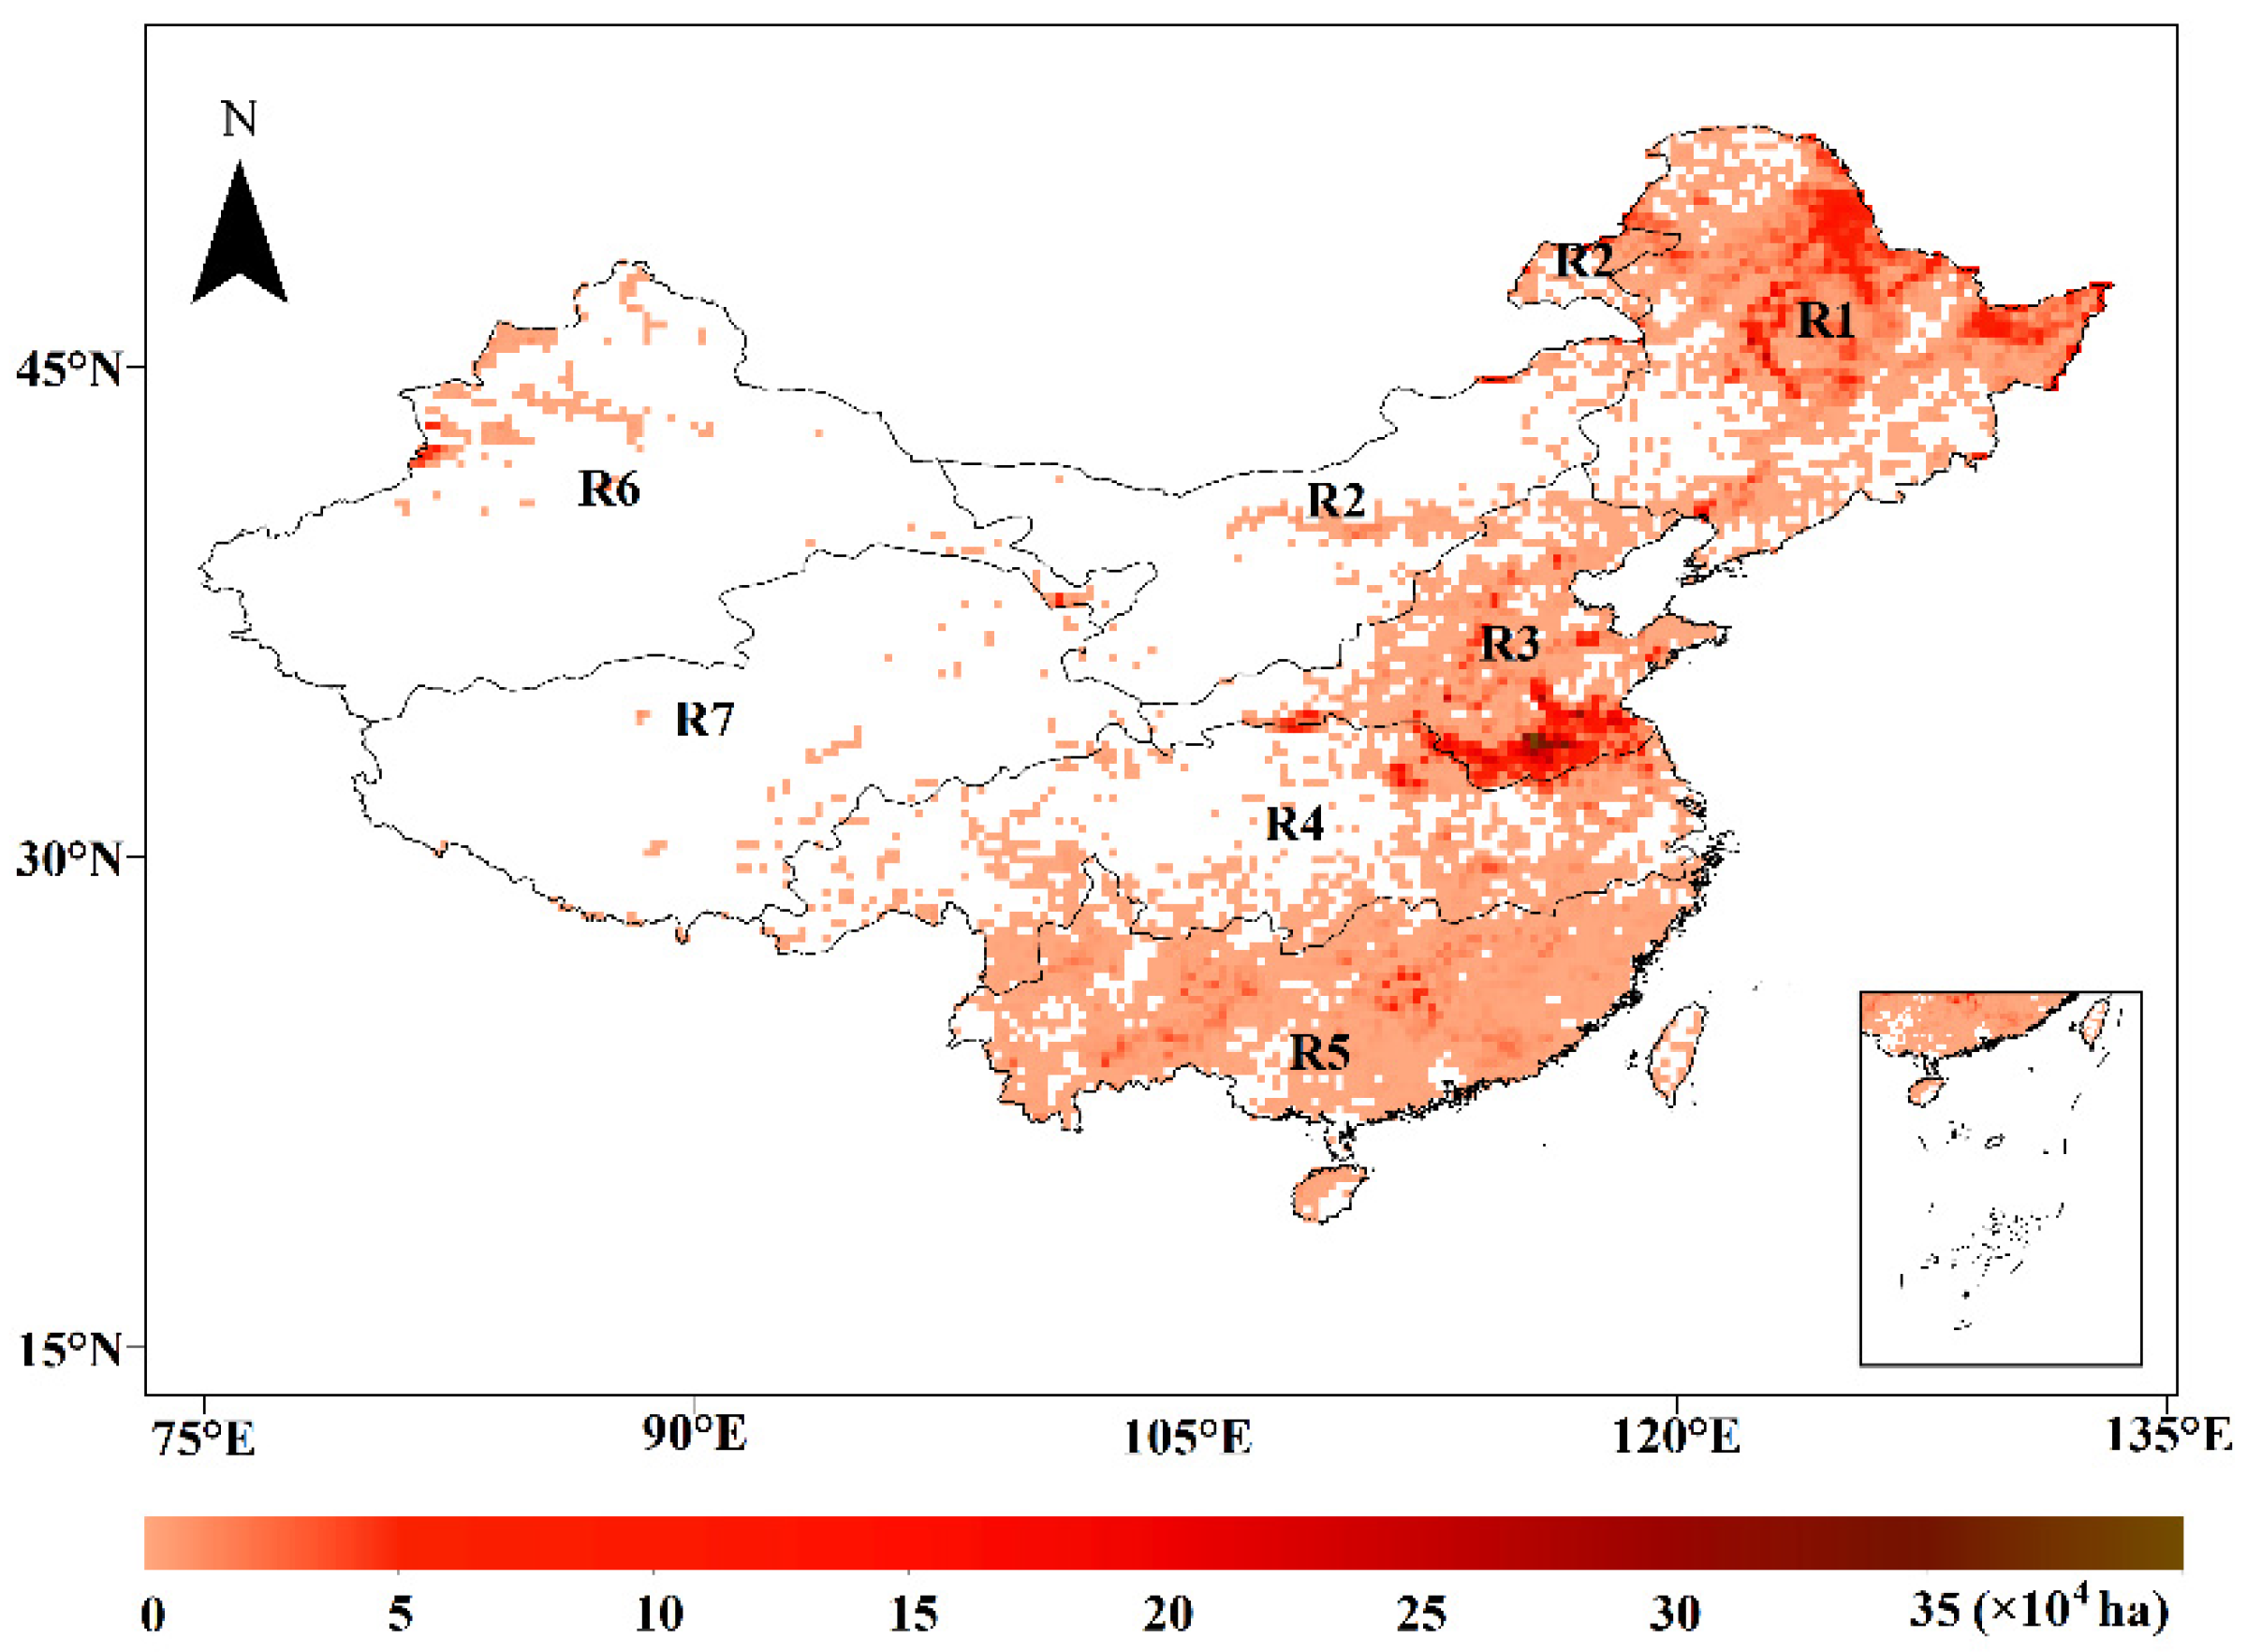
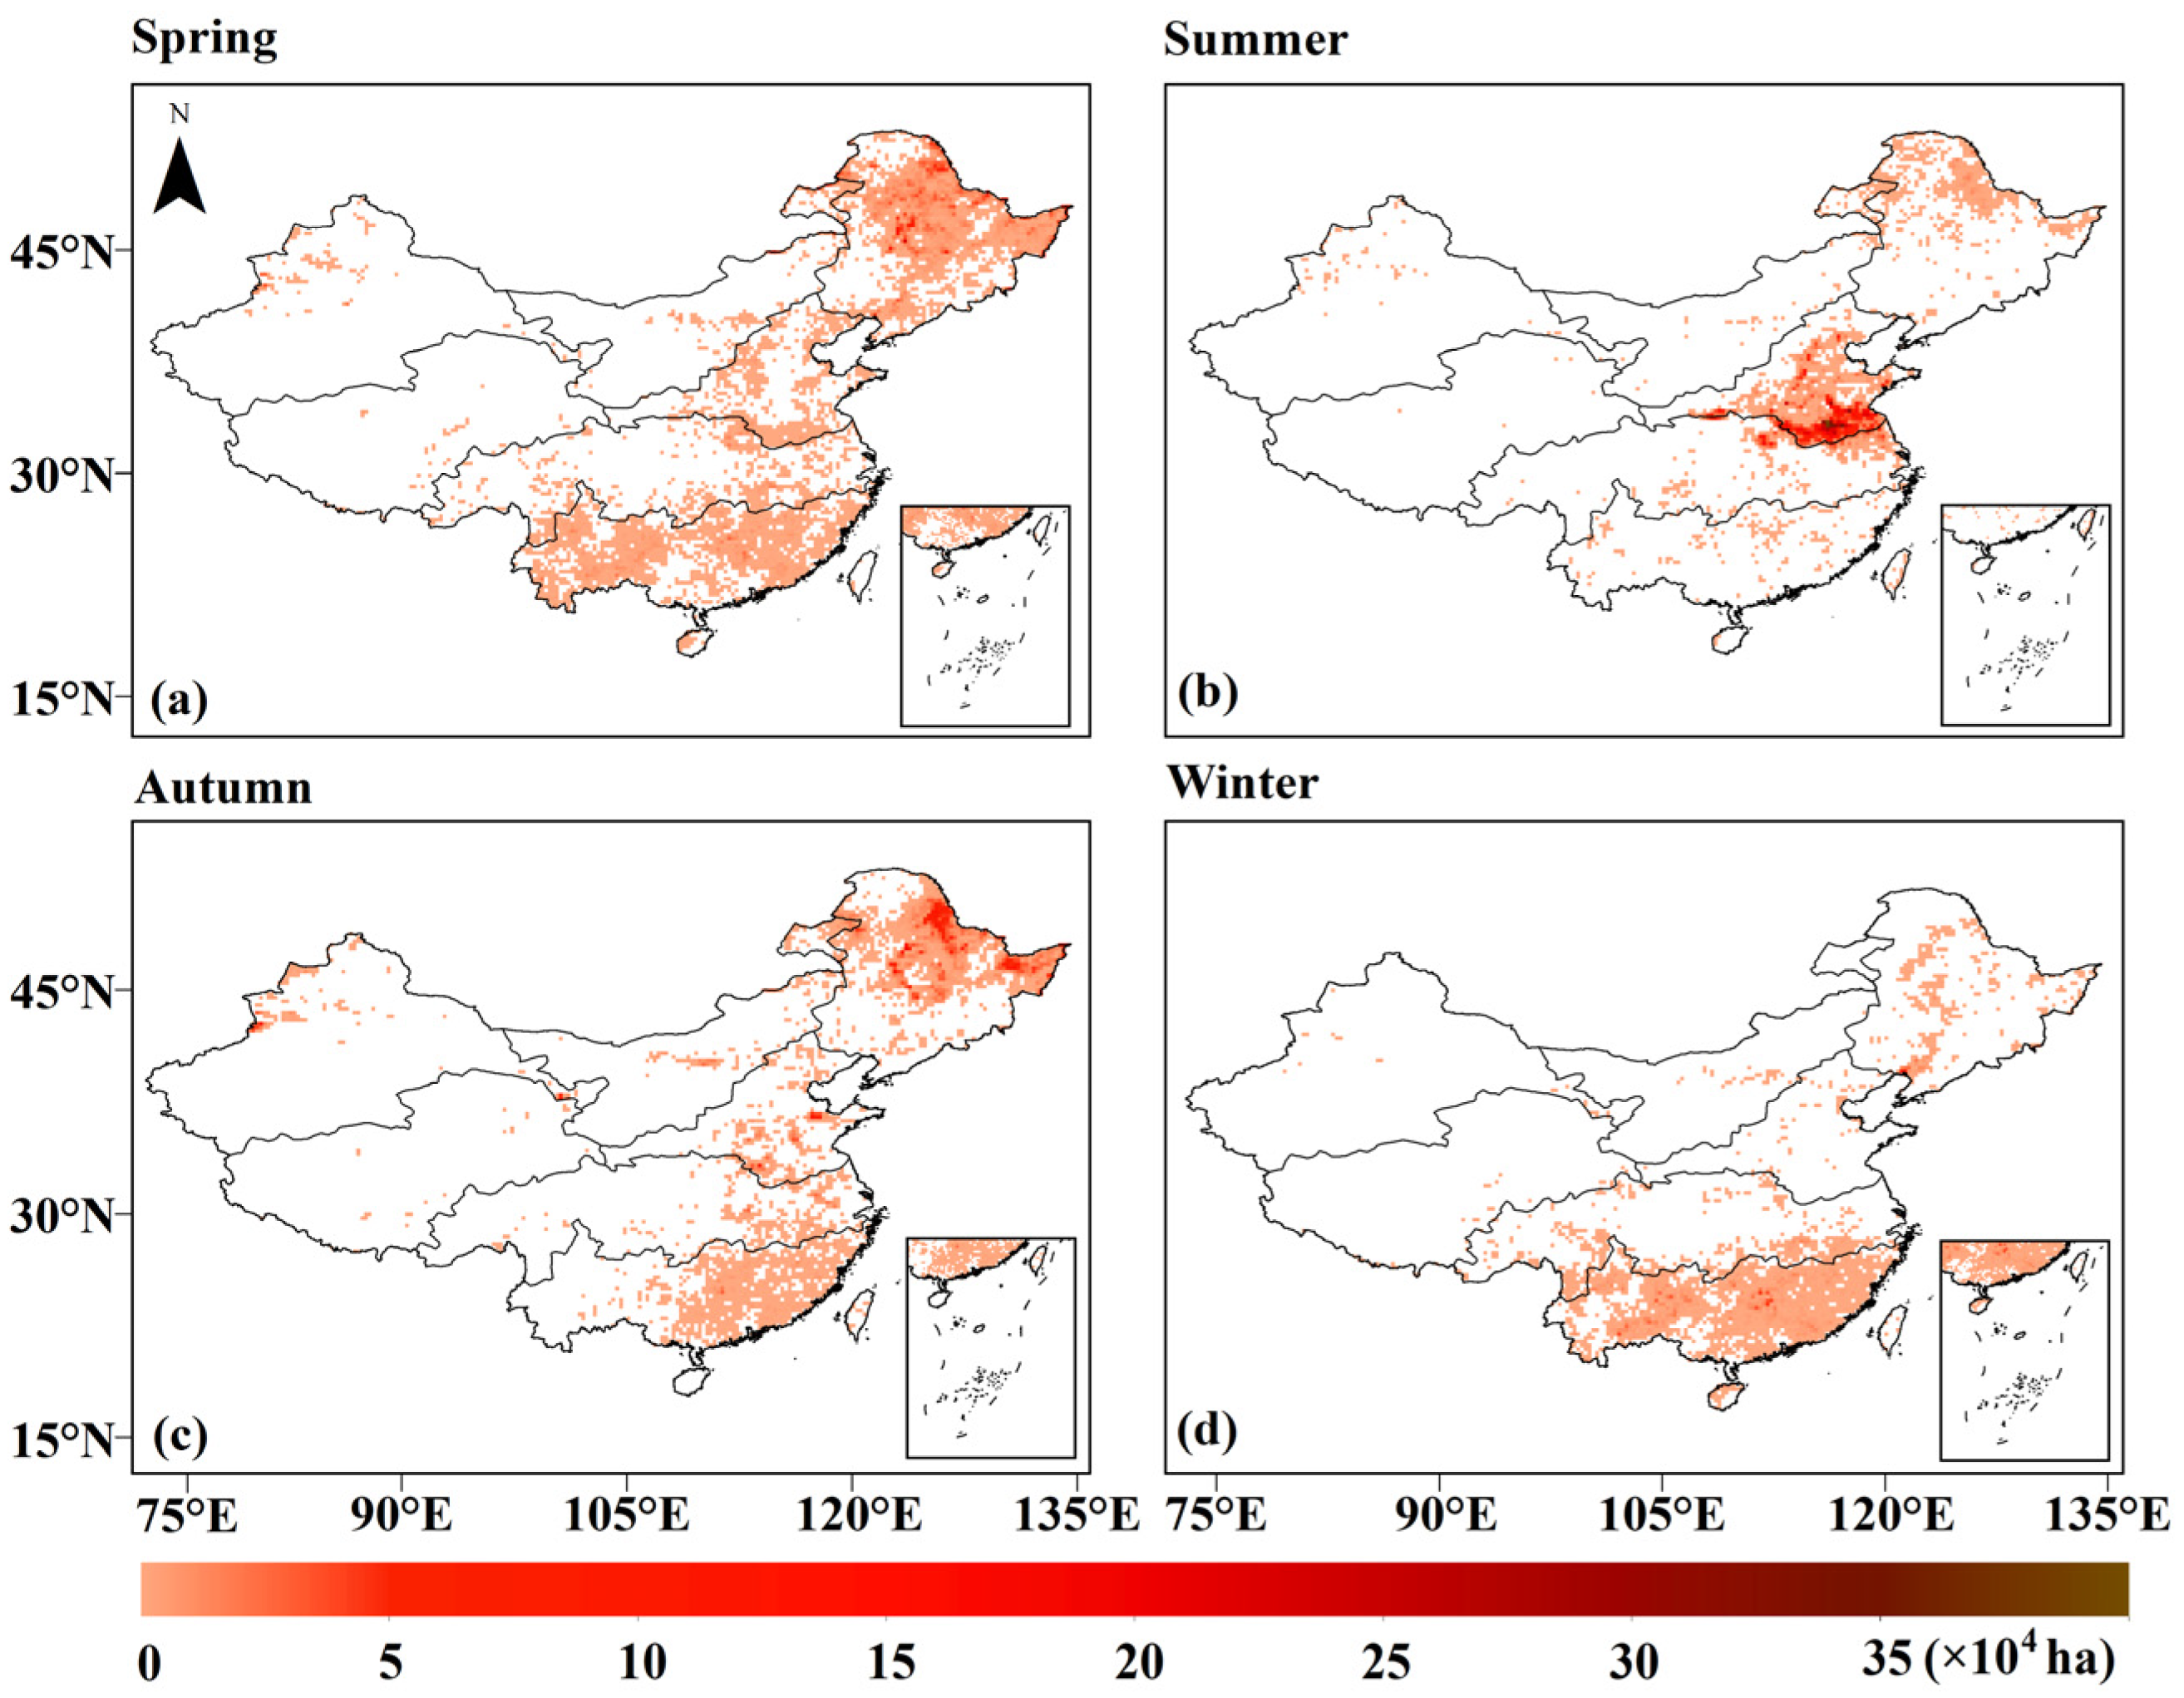
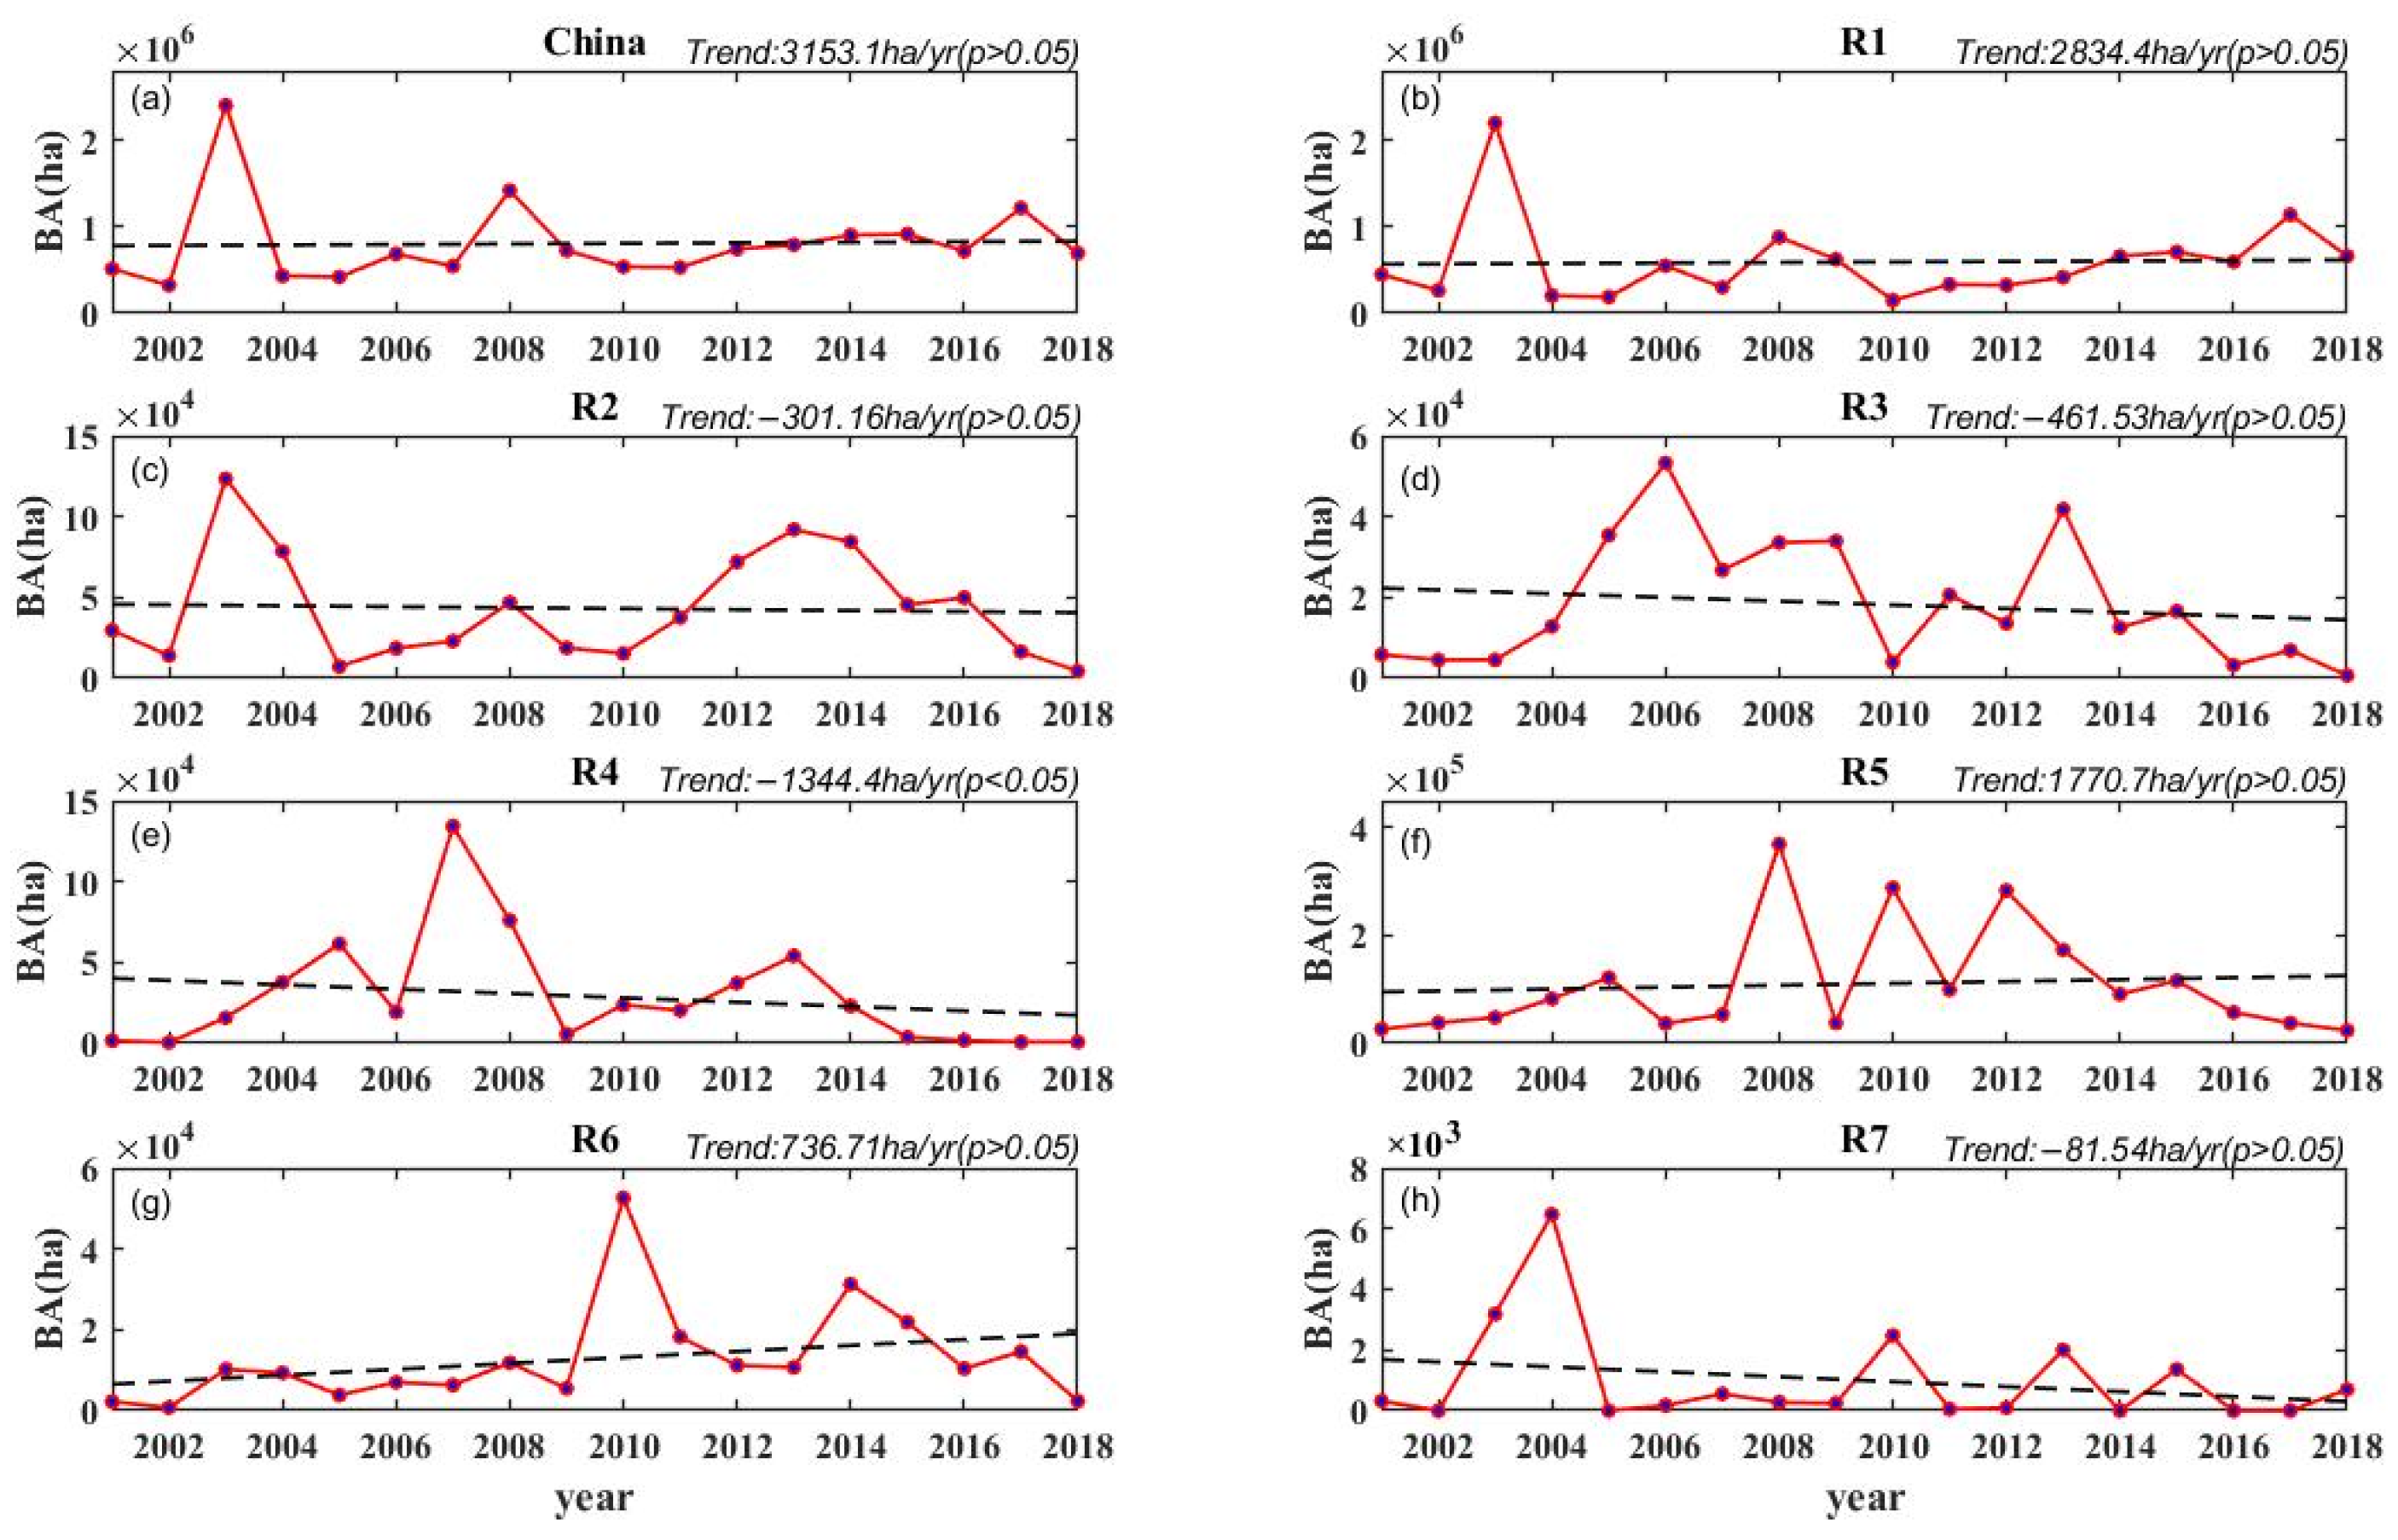
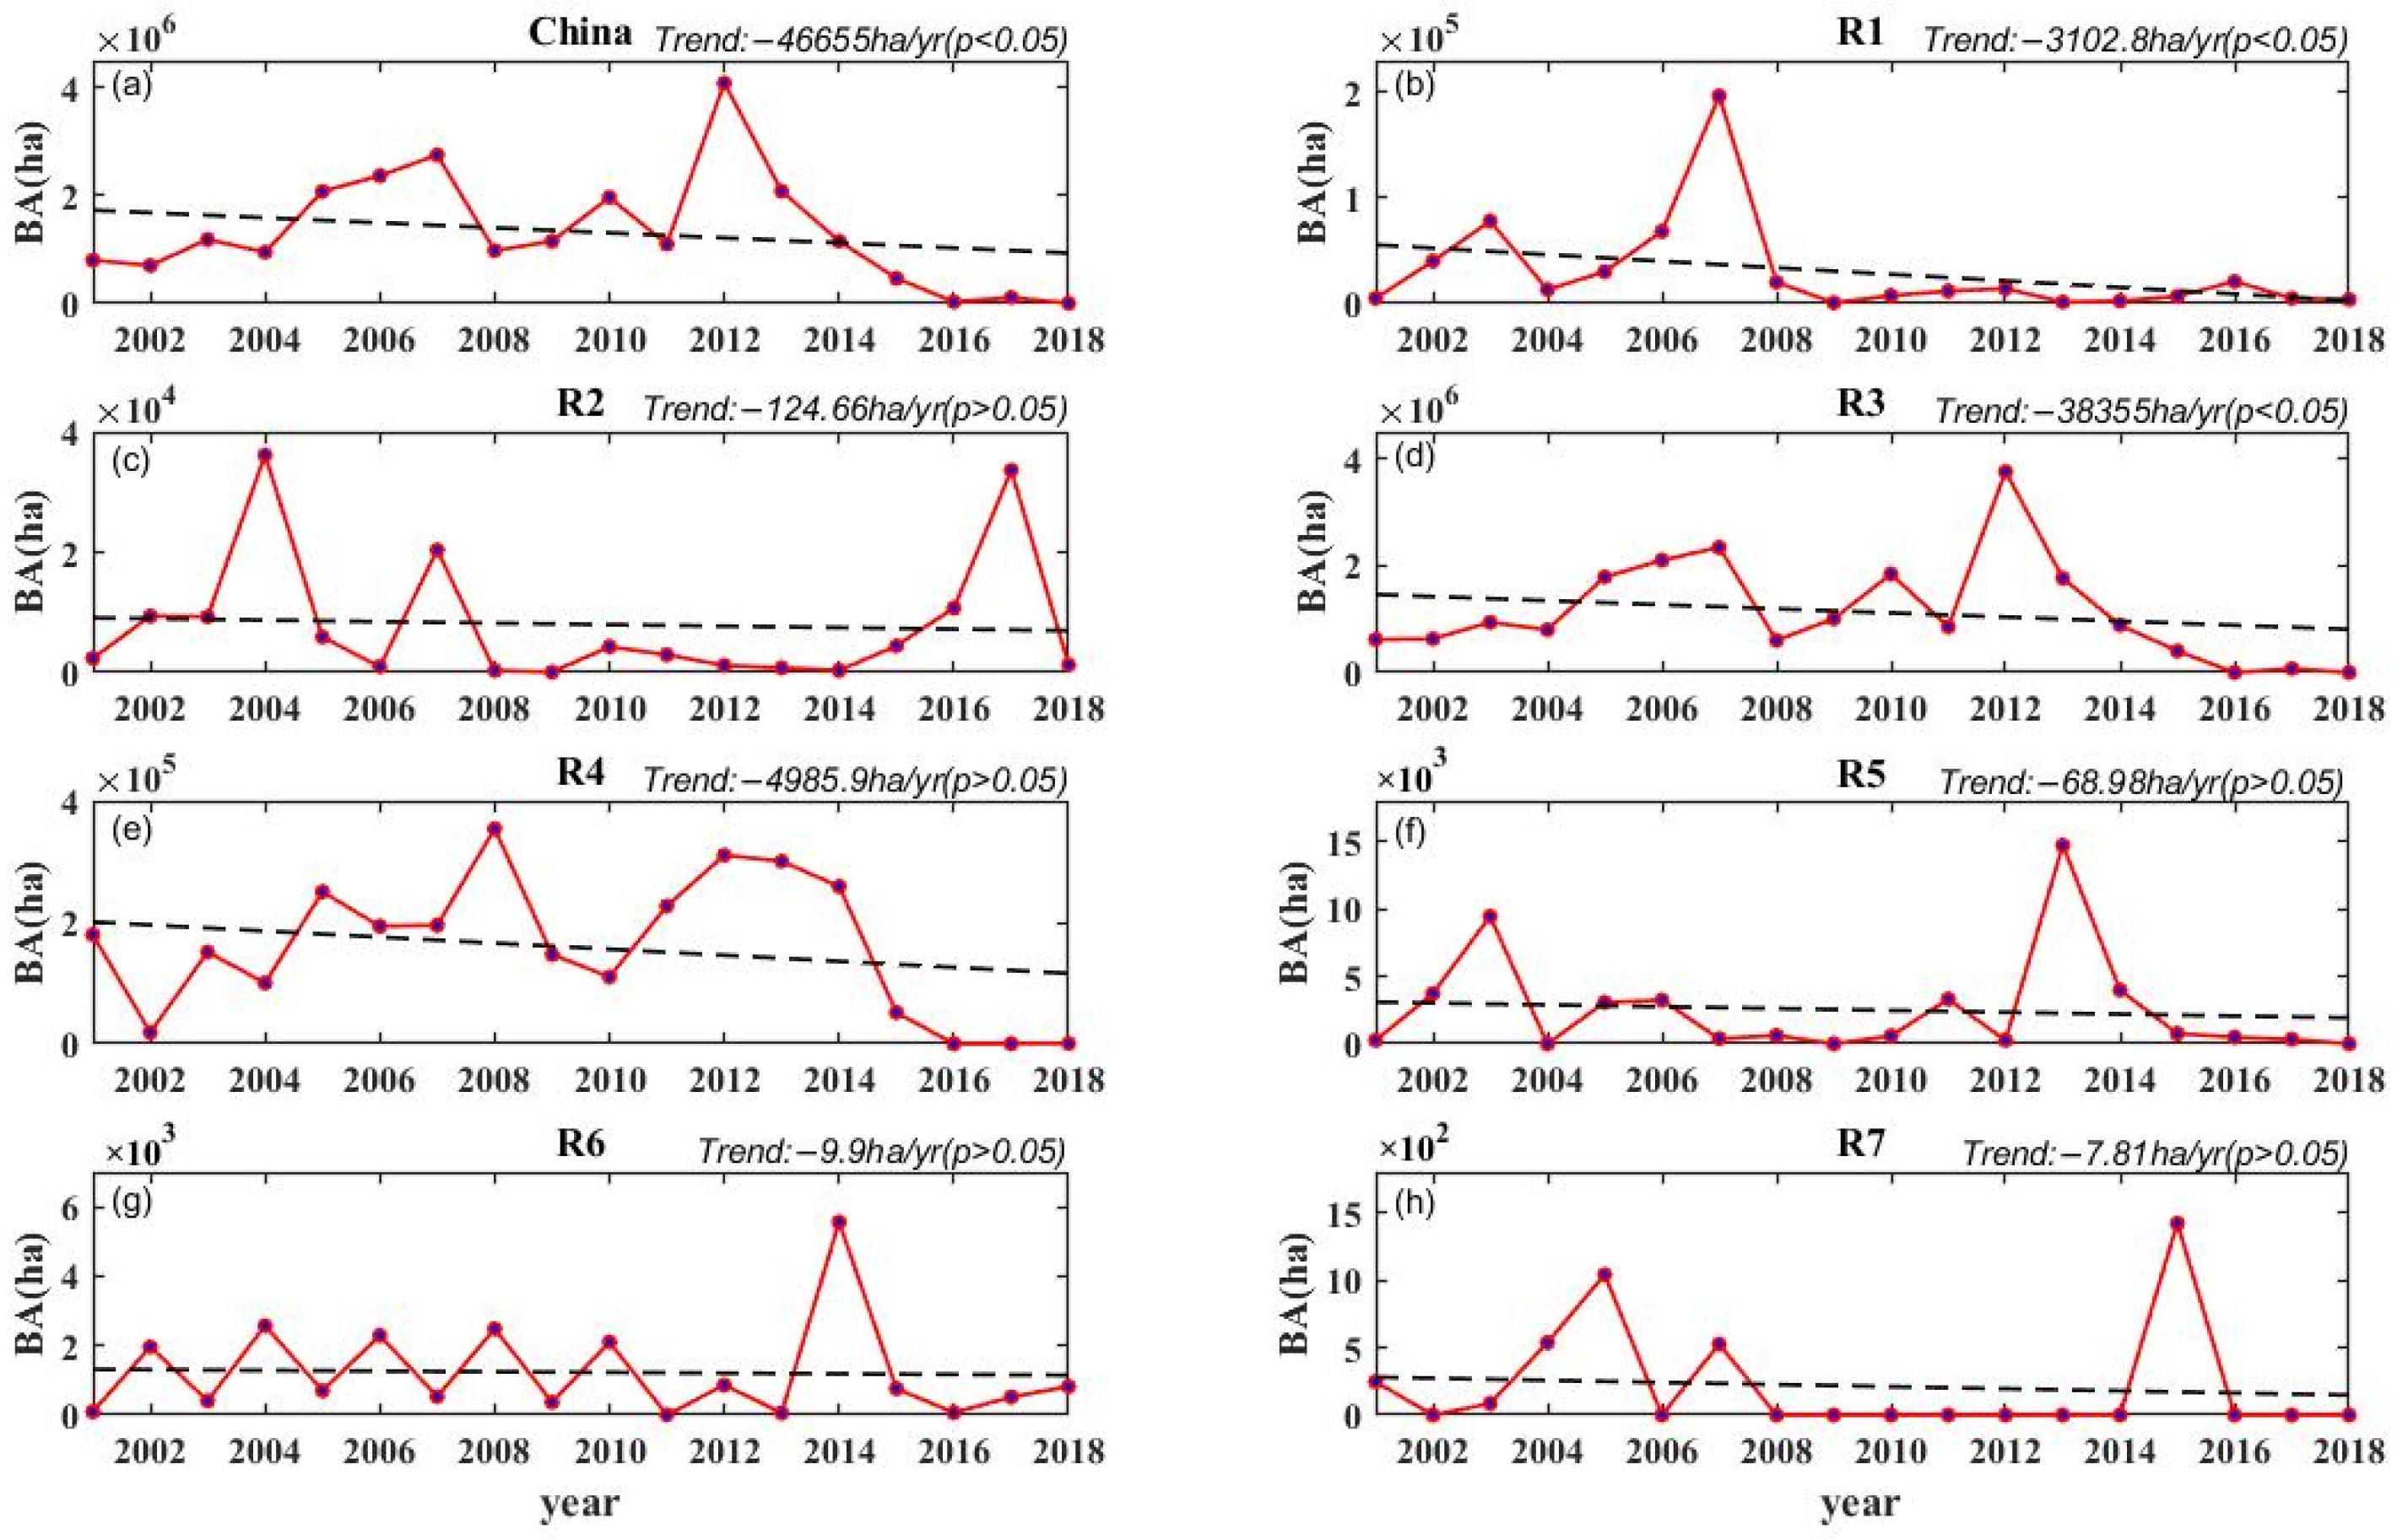
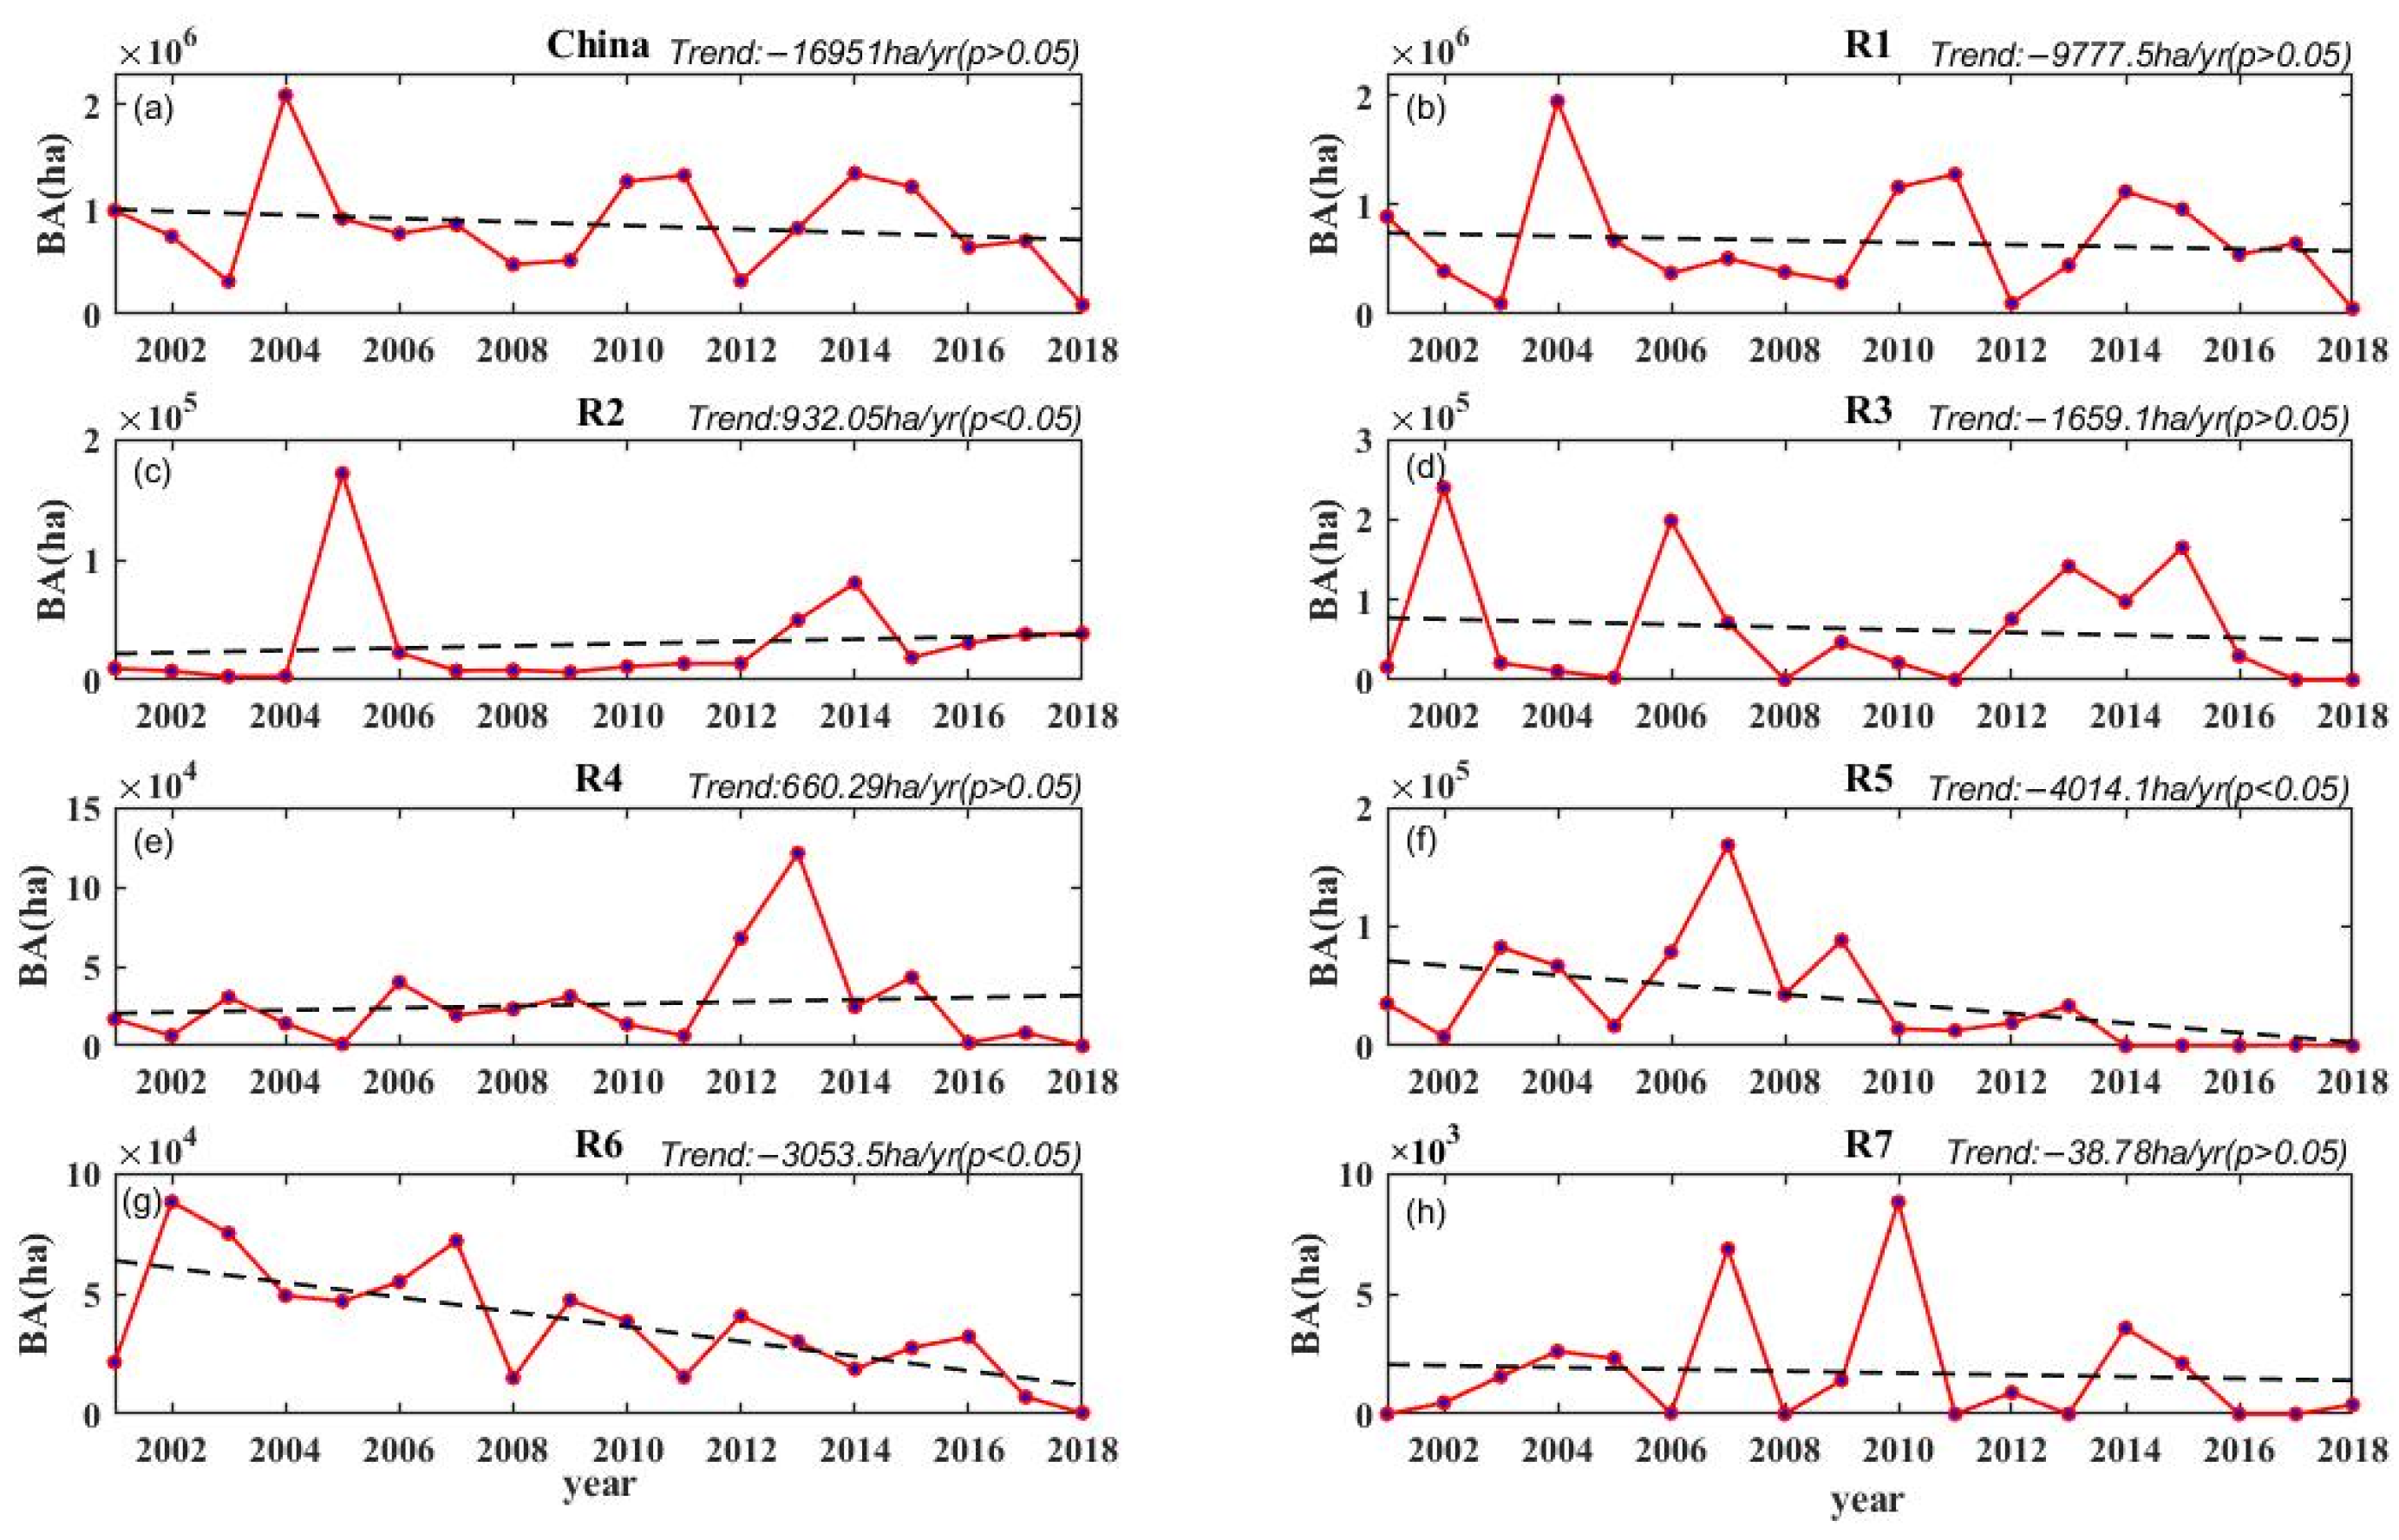
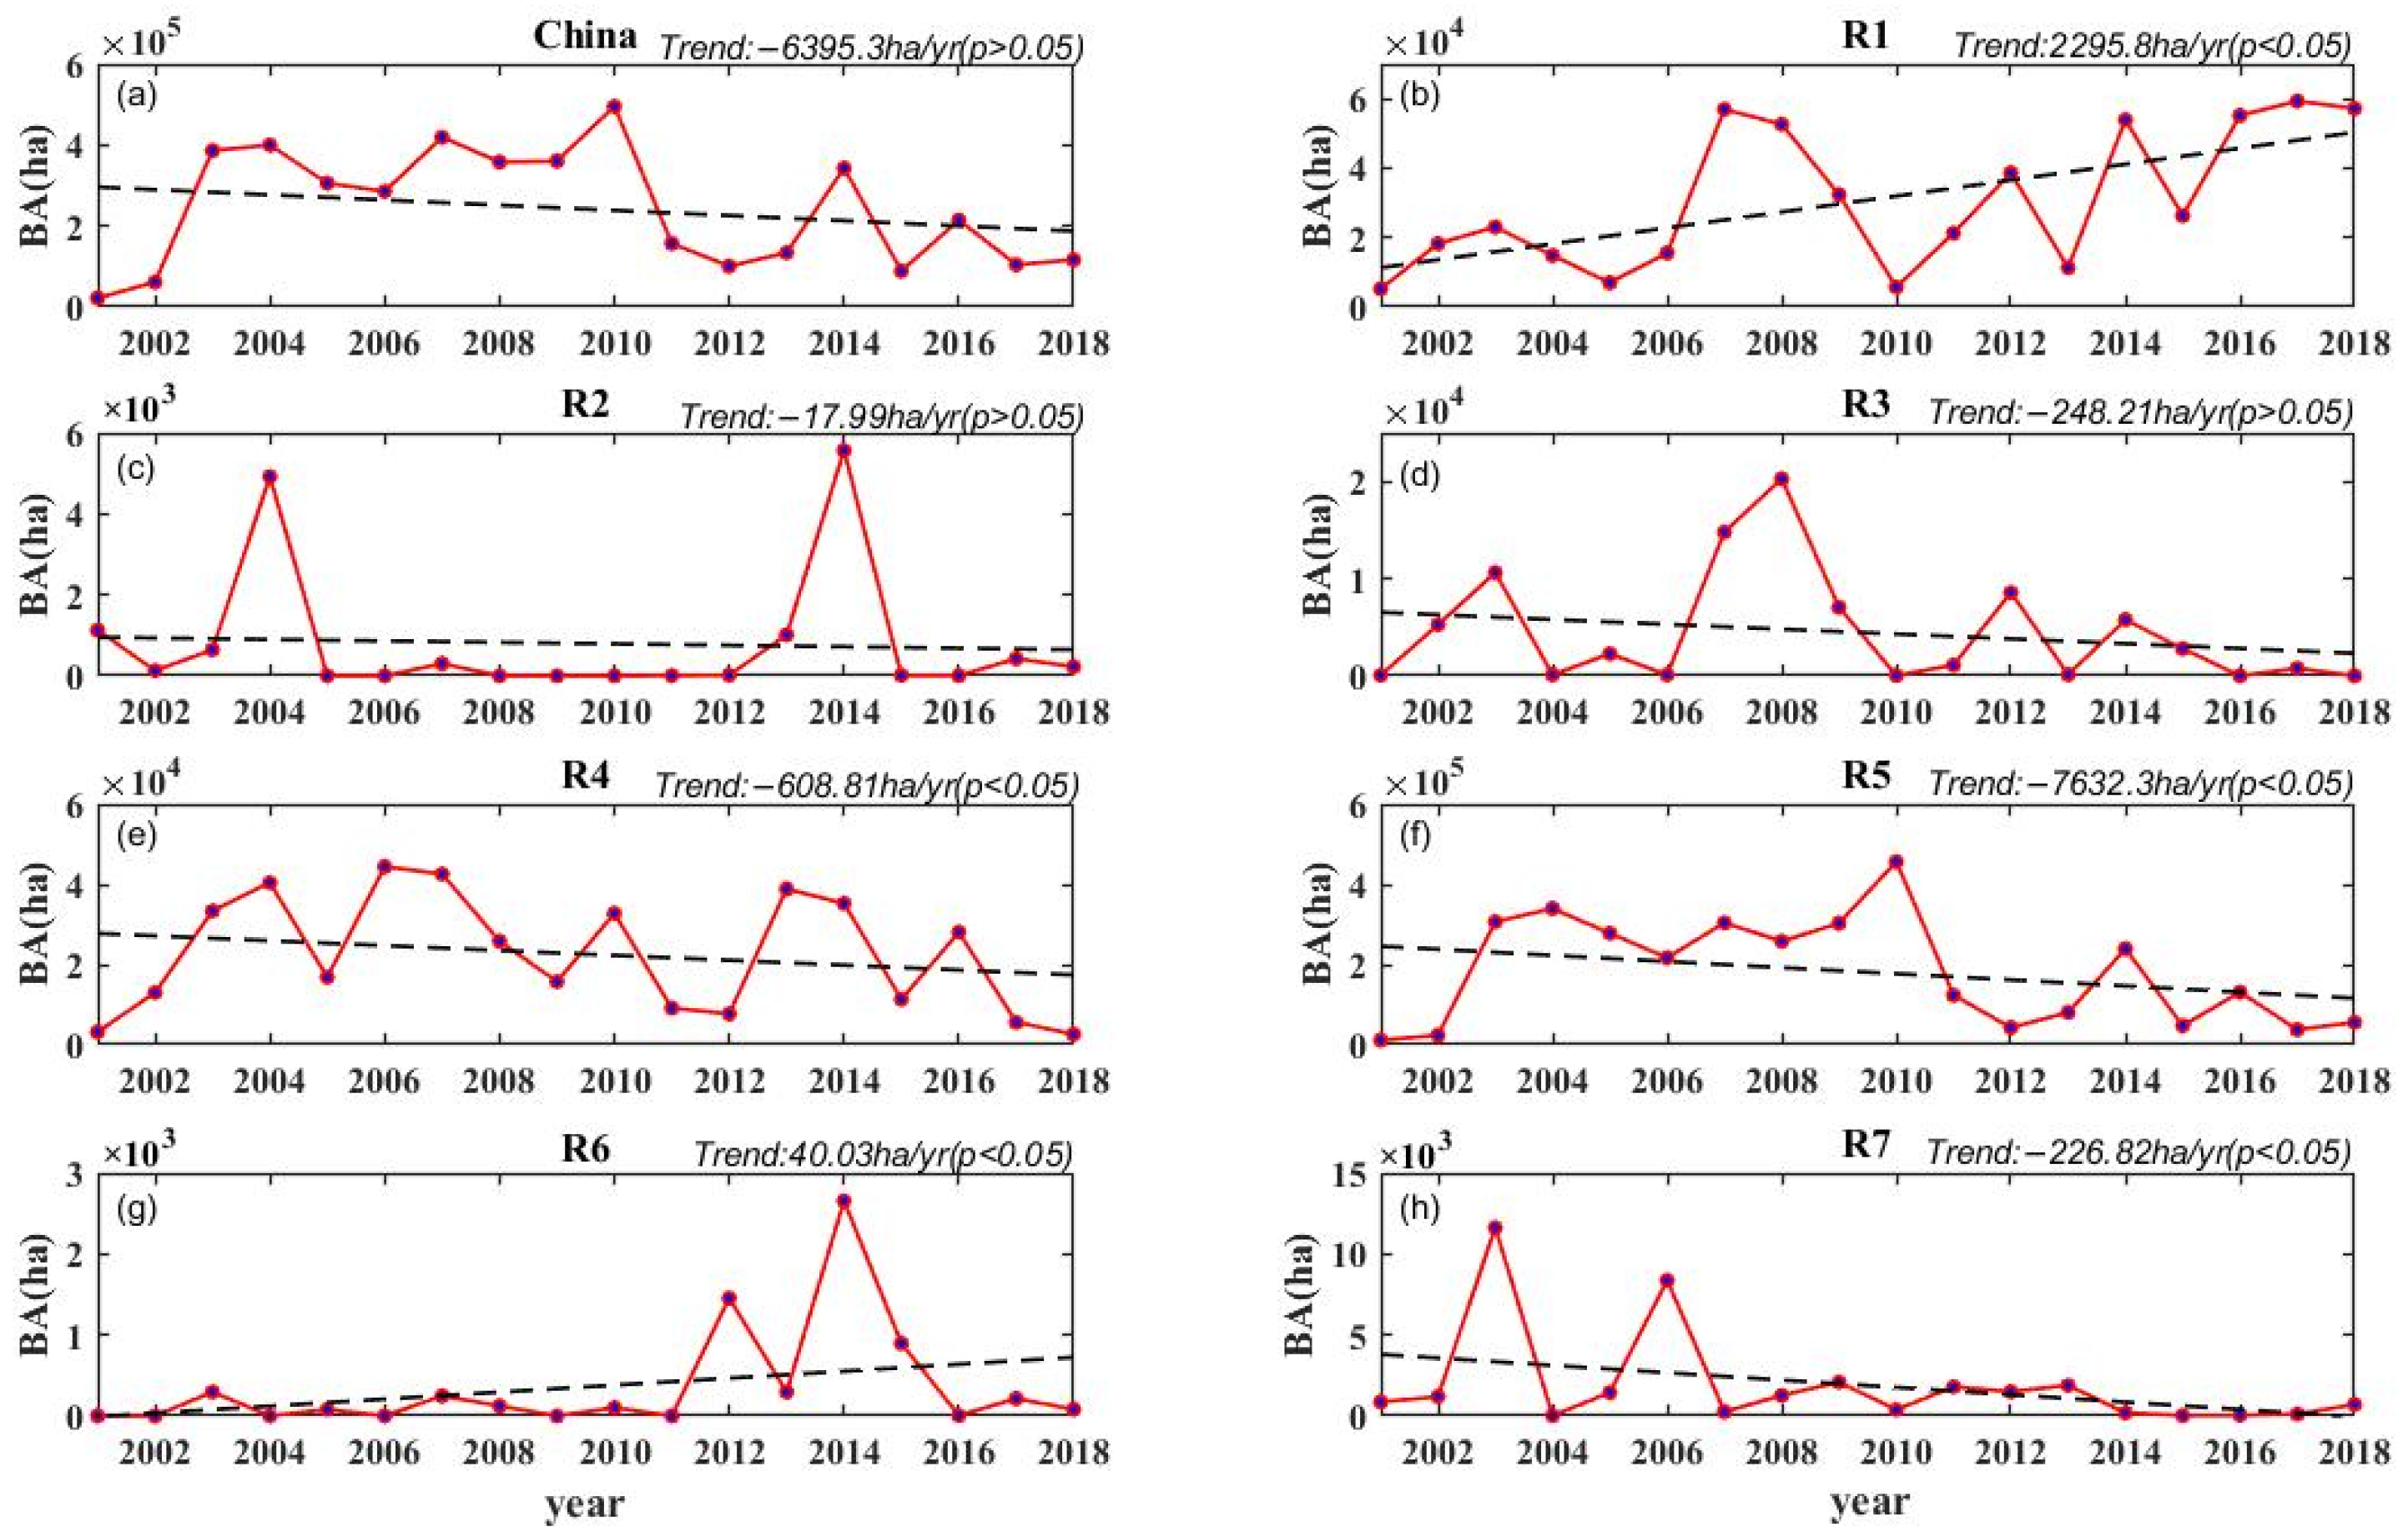
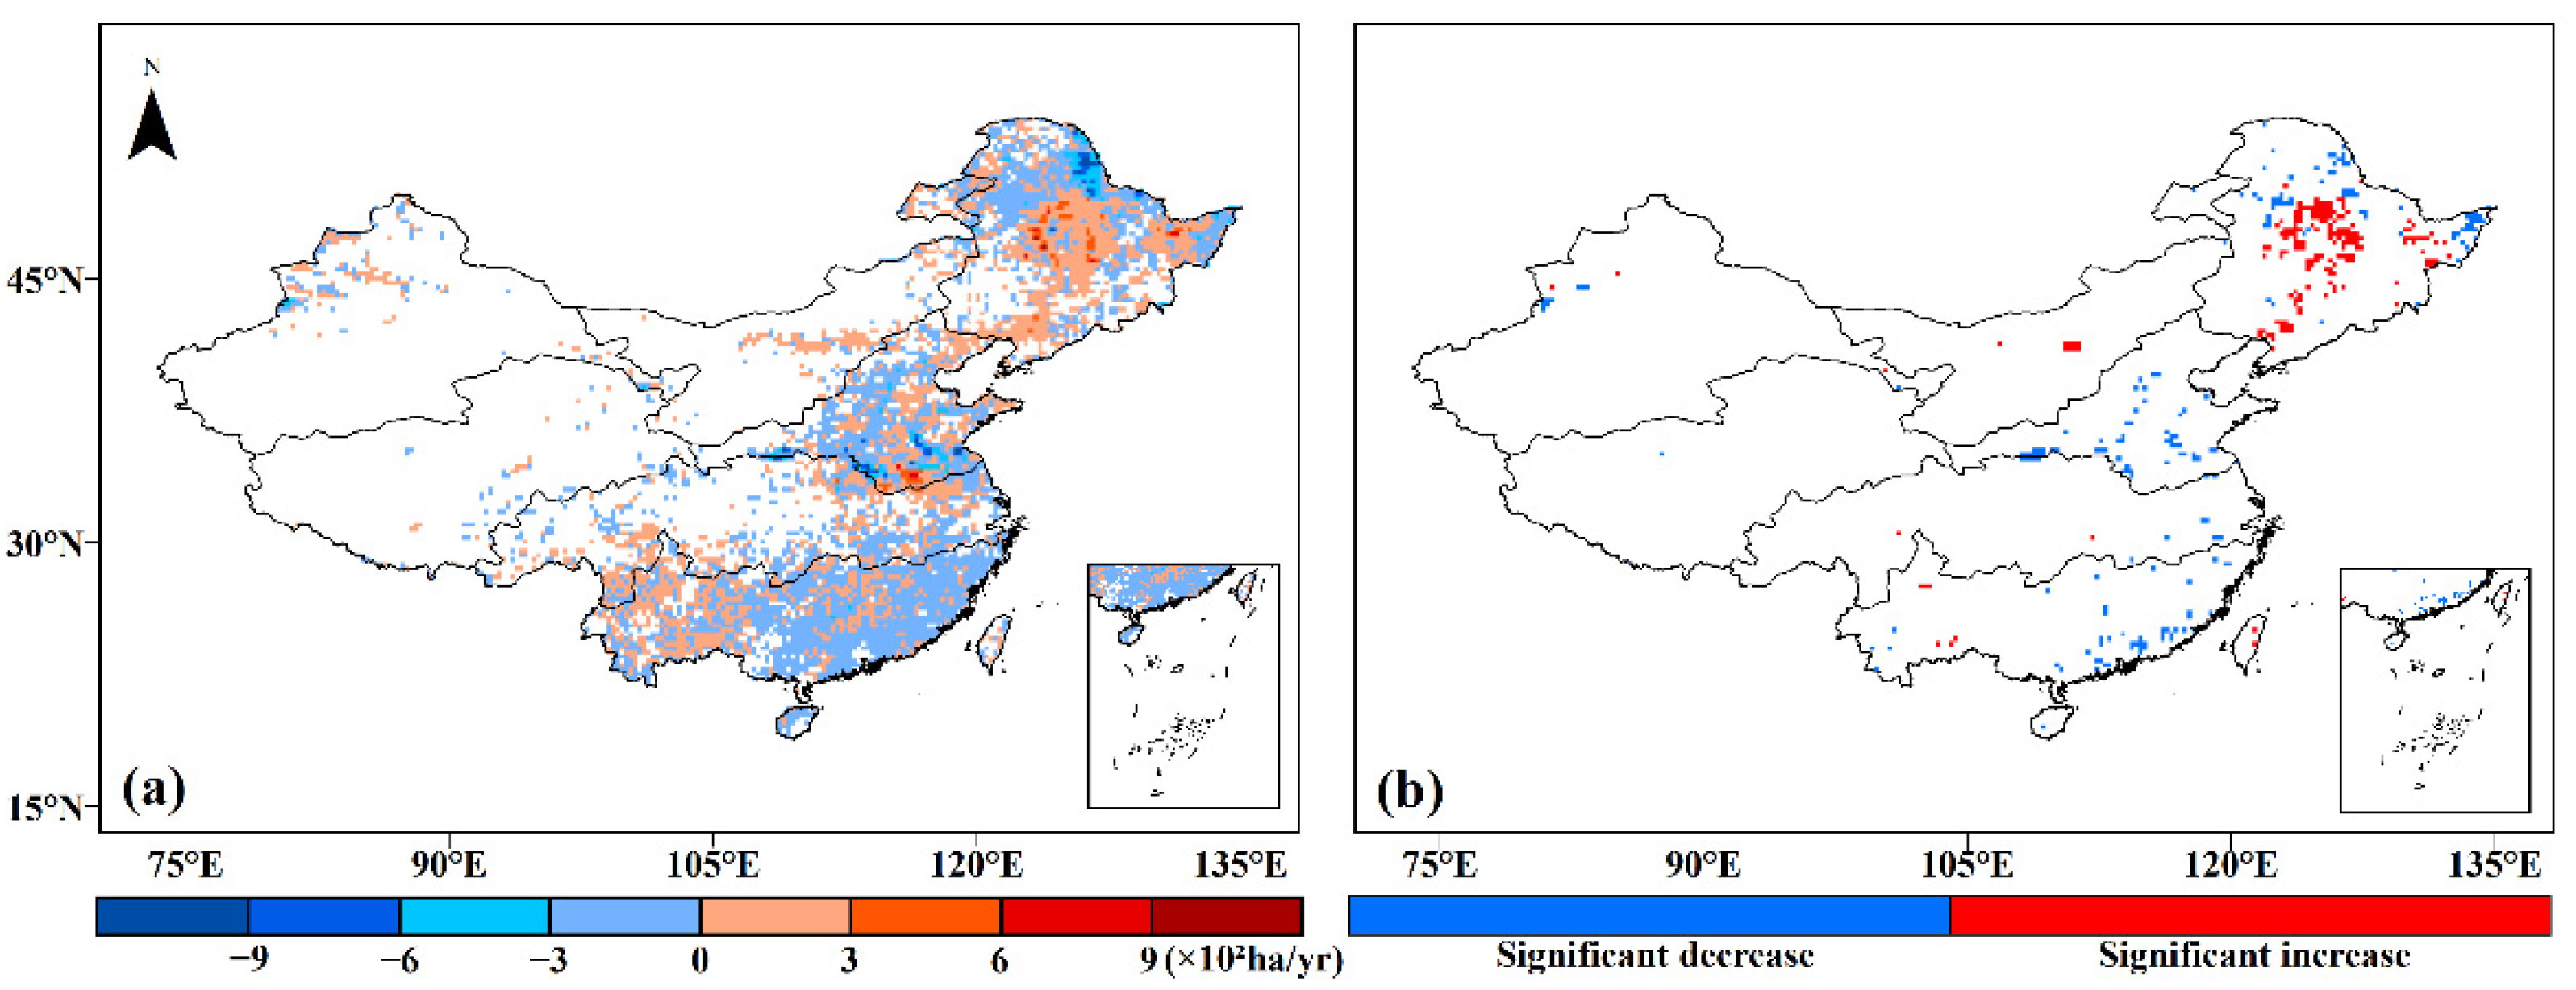
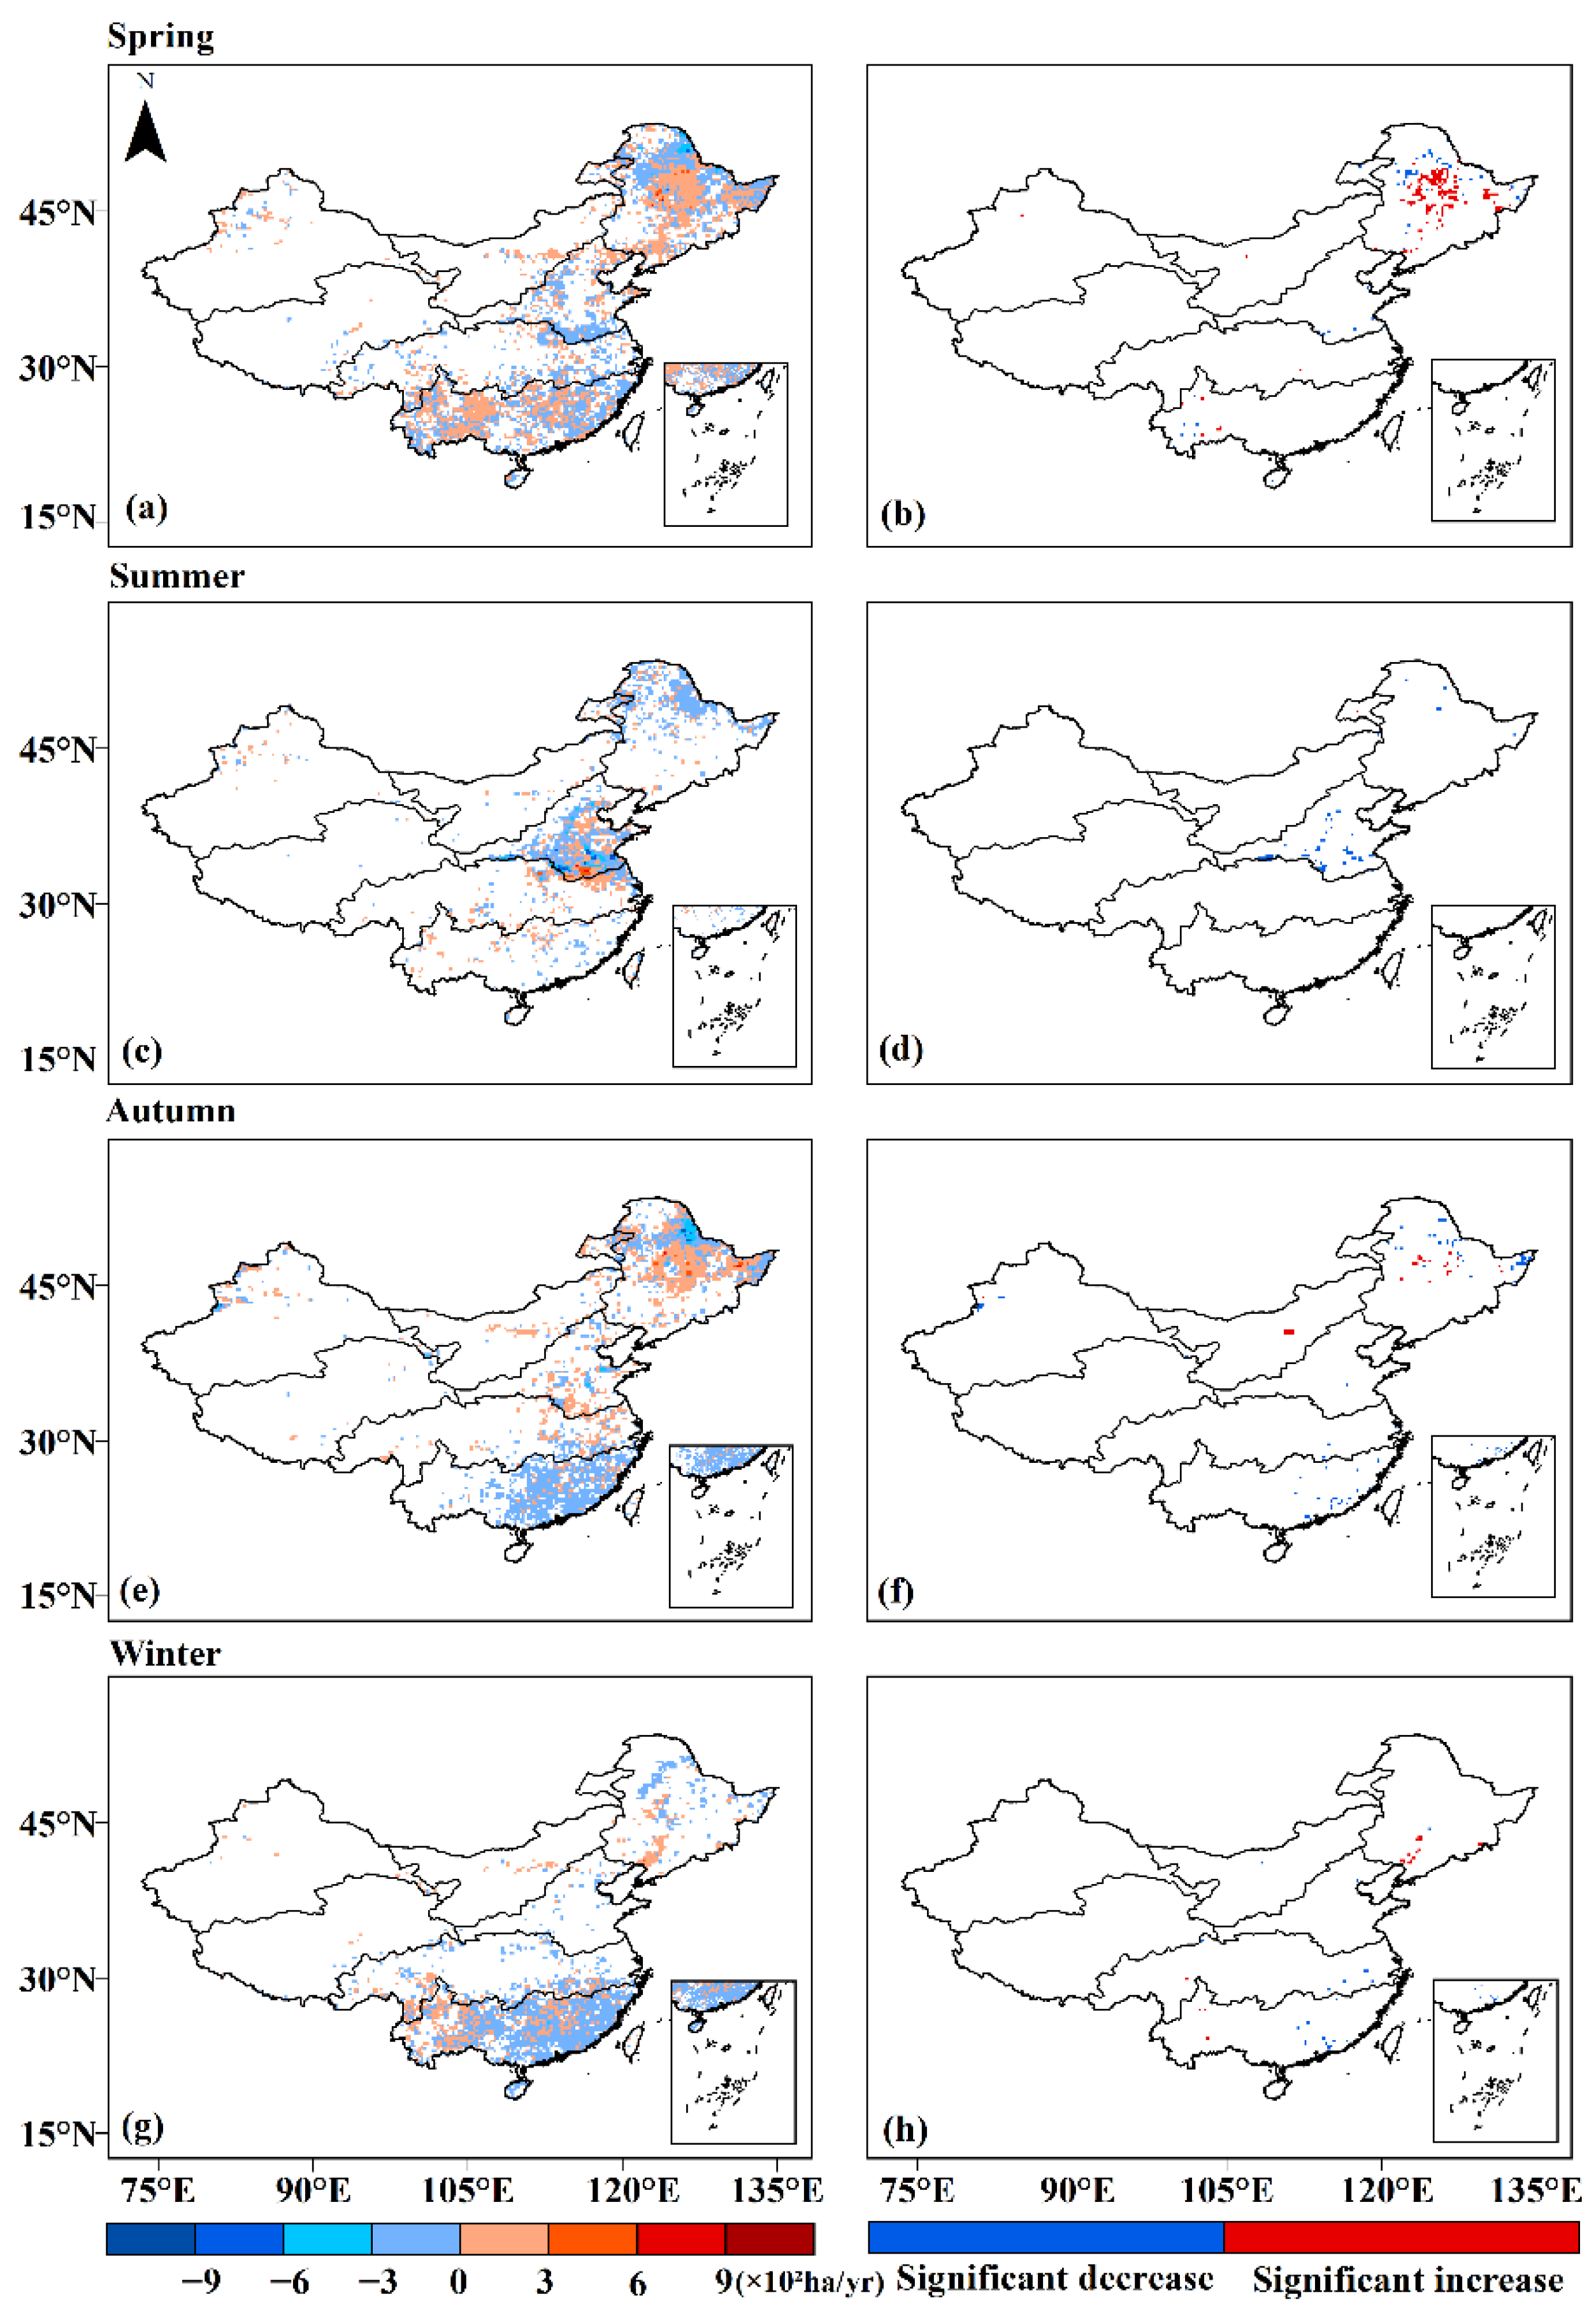
3.1. Spatial–Temporal Characteristics Observed from FireCCI51 BA Product

The BA data from 2001 to 2018 accumulated in each grid were used to analyze the spatial distribution of BA in China. It can be intuitively seen from Figure 2 that there are fires existing in all seven subregions and most of them are distributed in Eastern China. Specifically, R2, R6 and R7 have relatively low accumulated BA, with 1.47, 0.939 and 0.087 million ha, respectively. Their mean annual values are 0.0818, 0.052 and 0.0048 million ha, respectively, and their annual standard deviations are 0.05, 0.0247 and 0.0044 million ha, respectively. The accumulated BAs for the other four subregions (R1, R3, R4 and R5) were relatively large, and they were 23.57, 21.96, 4.24 and 5.96 million ha, respectively. Their mean annual values are 1.31, 1.22, 0.236 and 0.3309 million ha, respectively, and their annual standard deviations are 0.5284, 0.995, 0.1585 and 0.2046 million ha, respectively. The largest BA appeared in the north of R1 and south of R3; however, their fuels were different. The northern part of R1 is coniferous forest, and its fuel is fallen leaves; the southern part of R3 is farmland, and its fuel is straw (Figure 1).
The spatial distribution of accumulated BA during the four seasons is shown in Figure 3. Generally, the seasonal distribution of BA is different. Spring shows the widest BA distribution in Eastern China. Autumn, following spring, has also a similar spatial distribution characteristic. Summer and winter show less BA spatial distribution compared with spring and autumn. Specifically, fire in summer is mainly distributed in R3 and the northern part of R1, and fire in winter is mainly distributed in R5. Among them, spring shows the widest spatial BA distribution, which is similar to the annual distribution in China, and summer has the largest BA.
The sum of BA for China during the four seasons was also calculated. The largest BA in China occurs in summer, with 23.99 million ha, and around 85% of this occurs in R3. The sum of BA in other seasons is 15.38 million ha in autumn, 14.51 million ha in spring and 4.35 million ha in winter. Additionally, it can also be found that the location of the maximum BA in each season is different. In spring and autumn, the location was R1; in summer, it was R3; and in winter, it was R5.
The temporal variation in BA in China and its seven subregions is shown in Figure 4 and Figure 5, Figure 6, Figure 7 and Figure 8, respectively. At annual scale, the trends in China and its seven subregions were decreasing, except for R2, with a slightly increasing trend. The decreasing trends of most of regions were significant (p < 0.05). Specifically, the decreasing trend of China was significant and the slope was −66,848 ha/yr. Four of the six subregions with decreasing trends passed the significant test. Their slopes were R3 with −40,724 ha/yr, R5 with −9944.7 ha/yr, R6 with −2283.5 ha/yr and R7 with −354.75 ha/yr.
Figure 5 shows the results of trends of BA in spring. It can be seen that R4 shows a significantly decreasing trend (−1344.4 ha/yr, p < 0.05). In addition, there were three subregions showing a weakly increasing trend in BA (R1, R5 and R6), and three subregions (R2, R3 and R7) with a weakly decreasing trend. In addition, it can be seen from Figure 5a,b that the amplitude of the BA trend in R1 is very close to that in China. Combined with the comparison of the BA trends in spring, it can be inferred that the fire in R1 is largely responsible for the fires in China, which is consistent with the previous conclusion in Figure 3a that the maximum BA of China in spring occurs in R1.
The trends of BA in summer are shown in Figure 6. Generally, decreasing trends exist in China and its seven subregions (R1–R7), among which China (−46,655 ha/yr), R1 (−3102.8 ha/yr) and R3 (−38,355 ha/yr) show significantly decreasing trends. In addition, the variation trend of R3 is very close to that of China, and their BA ranges are also the same. This demonstrates that the BA of R3 in summer accounts for most of China, which is consistent with the conclusion drawn from Figure 3b.
Figure 7 shows the results of BA trends in autumn. R2 shows a significantly increasing trend with a slope of 932.05 ha/yr, and R5 and R6 show significantly decreasing trends with slopes of −4014.1 ha/yr and −3053.5 ha/yr, respectively. Moreover, R1, R3, R7 and China show weakly decreasing trends, and R2 and R4 have weakly increasing trends. Similarly, the trend of R1 is closer to that of China and their BA ranges are also the same. Therefore, the fire in R1 accounts for most of China in autumn, which can be observed in Figure 3c.
In winter, R1 (2295.8 ha/yr) and R6 (40.03 ha/yr) show significantly increasing trends, while R4 (−608.81 ha/yr), R5 (−7632.3 ha/yr) and R7 (−226.82 ha/yr) show significantly decreasing trends. R2, R3 and China show weakly decreasing trends (see Figure 8). Similarly, the trend of R5 is very close to China and their BA ranges are the same. This indicates that the BA in R5 mostly contributes to the BA of China, which is also proven by the BA spatial distribution in winter (see Figure 3d).
In general, the BA trends at annual and summer scales are decreasing for China and its seven subregions (R1–R7). For the other three seasons, the BA trends of all seven subregions are inconsistent, but the subregions with decreasing trends account for the majority of all seven subregions. Therefore, the BA trends of China and its seven subregions (R1–R7) are generally thought to be decreasing at annual and seasonal scales.
Besides the trends of subregions, the spatial distribution of the trends of all grids in China was also analyzed. Figure 9a shows the results of the spatial distribution of trends at annual scale. On the whole, the distribution of the decreasing trend (marked with blue) is wider than that with the increasing trend (marked with red). The conclusions are the same as the distribution of significant points in Figure 9b. Specifically, the two opposite trends occur in R1, with a decreasing trend in the north and an increasing trend in the central and southern parts. There is more positive significance than negative, but the overall trend is decreasing (see Figure 4b). Most of the BA in R2 shows a slightly increasing trend, making the total trend slightly increasing. Unlike R2, most of R3, R4 and R5 show a decreasing trend, except for southern R3 and western R5. R6 and R7 have less fire. In terms of the significance of these trends, most of the grid points that passed the significance test were located in the R1, R3 and R5 regions. The white regions in Figure 9 experienced no fires over 18 years.
At the seasonal scale, the spatial distribution of the trends for all fire points and significant points is shown in Figure 10. The BA in the northern part of R1 represents a decreasing trend in all four seasons and some points pass the significance test in spring, summer and winter. There are increasing trends in the middle part of R1 in all seasons except winter, and each of the three seasons has some point with a significantly increasing trend. For R3, the main decreasing trend occurs in summer, and its southern part is decreasing in spring and increasing in summer and autumn. A significant decreasing trend occurs in the southern part of R3 in spring and the eastern and western parts of R3 in summer. There is no fire in winter. The BA in R4 is basically decreasing, except for a small part of the north with an increasing trend in summer and autumn. However, none of these trends were significant. The fire in the western part of R5 mainly occurs in spring and winter, when there are a few significant points. Except for summer, with almost no fire, the eastern part of R5 has a decreasing BA in all four seasons, and some points in autumn and winter pass the significant decreasing test. In general, from the perspective of the significance test, the fire trend in the northern part of R1 is decreasing in all seasons except for winter. The middle part of R1 experiences an increasing trend in spring and autumn. The fire in R3 is decreasing in its southern part in spring and the western and eastern parts in summer. Increasing trends occur in the western part of R5 in spring and winter, and decreasing trends in the eastern part of R5 in autumn and winter.

3.2. Effect of Climatic Factors on BA

3.2.1. Results of Multivariable Regression Analysis

In order to analyze the response of BA to temperature, precipitation and wind speed, a multivariable regression equation in each fire grid was built. The BA regression coefficients based on Equation (1) for these three climatic factors at annual scale are shown in Figure 11. It can be found from Figure 11a that the number of the grids with positive coefficients is more than that with negative coefficients, showing that the BA is positively correlated with temperature as a whole. The distribution of significant points is shown in Figure 11b. An increasing temperature will promote BA. The negative coefficients in Figure 11c show that the BA variation trend contrasts that with precipitation. Similarly, there are more significant negative coefficients in Figure 11d. The greater the rainfall, the fewer fires occur. Similar to temperature, the correlation between BA and wind speed is generally positive, as shown in Figure 11e,f. However, there are opposite coefficients in a small part of the southern R3.
The multivariable regression equations between BA and three climatic factors at seasonal scale were also built. The distributions of the regression coefficients based on Equation (1) are shown in Figure 12 and Figure 13. The coefficients of temperature for the seven subregions during the four seasons are basically positive, except for the eastern R5 with slightly negative values in spring, a small part of the southern R3 with negative values in summer and the western part of R5 in winter. From spring to winter, the negative precipitation coefficients account for most of the BA, showing that a negative correlation exists at seasonal scale. Except for a small part of southern R3 in summer, there are basically positive coefficients (red) in each subregion for all four seasons, showing a positive correlation between BA and wind speed at seasonal scale. Overall, the regression relationships between BA and the three climatic factors at seasonal scale are consistent with that at annual scale. In addition, combining Figure 11, Figure 12 and Figure 13, it was found that the contrasting results of southern R3 with the overall conclusion at annual scale are mainly due to the summer results.

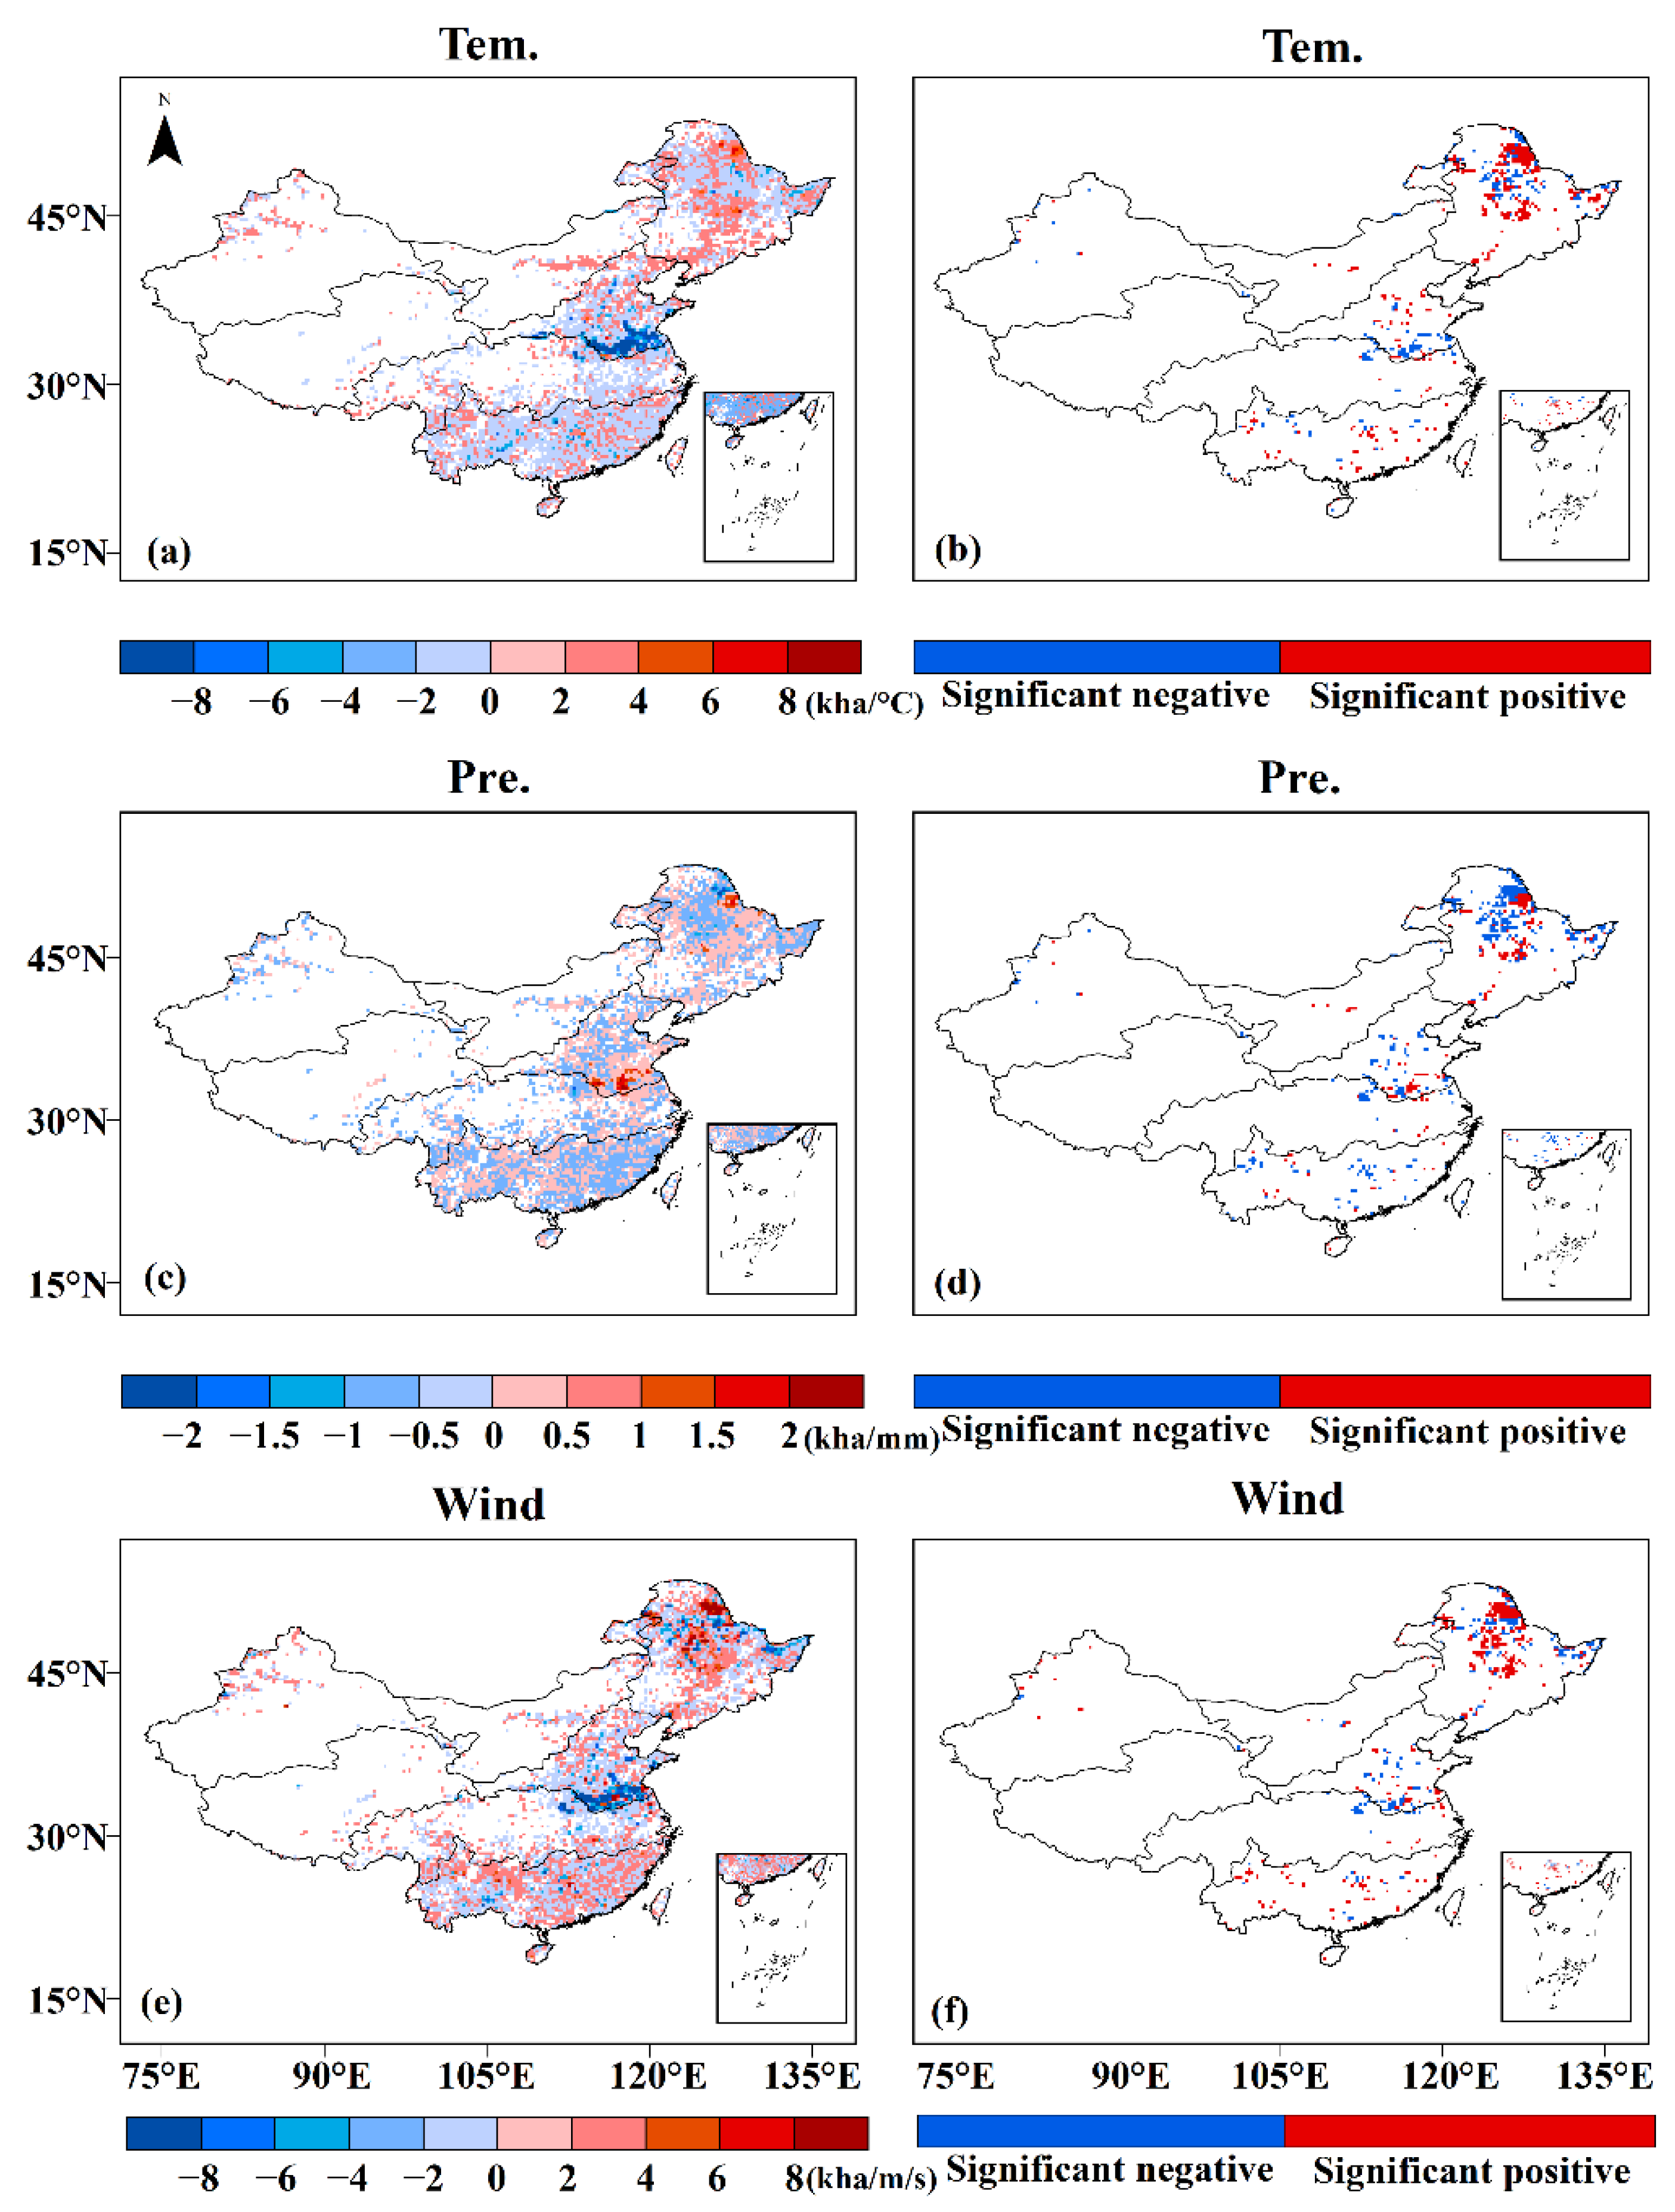
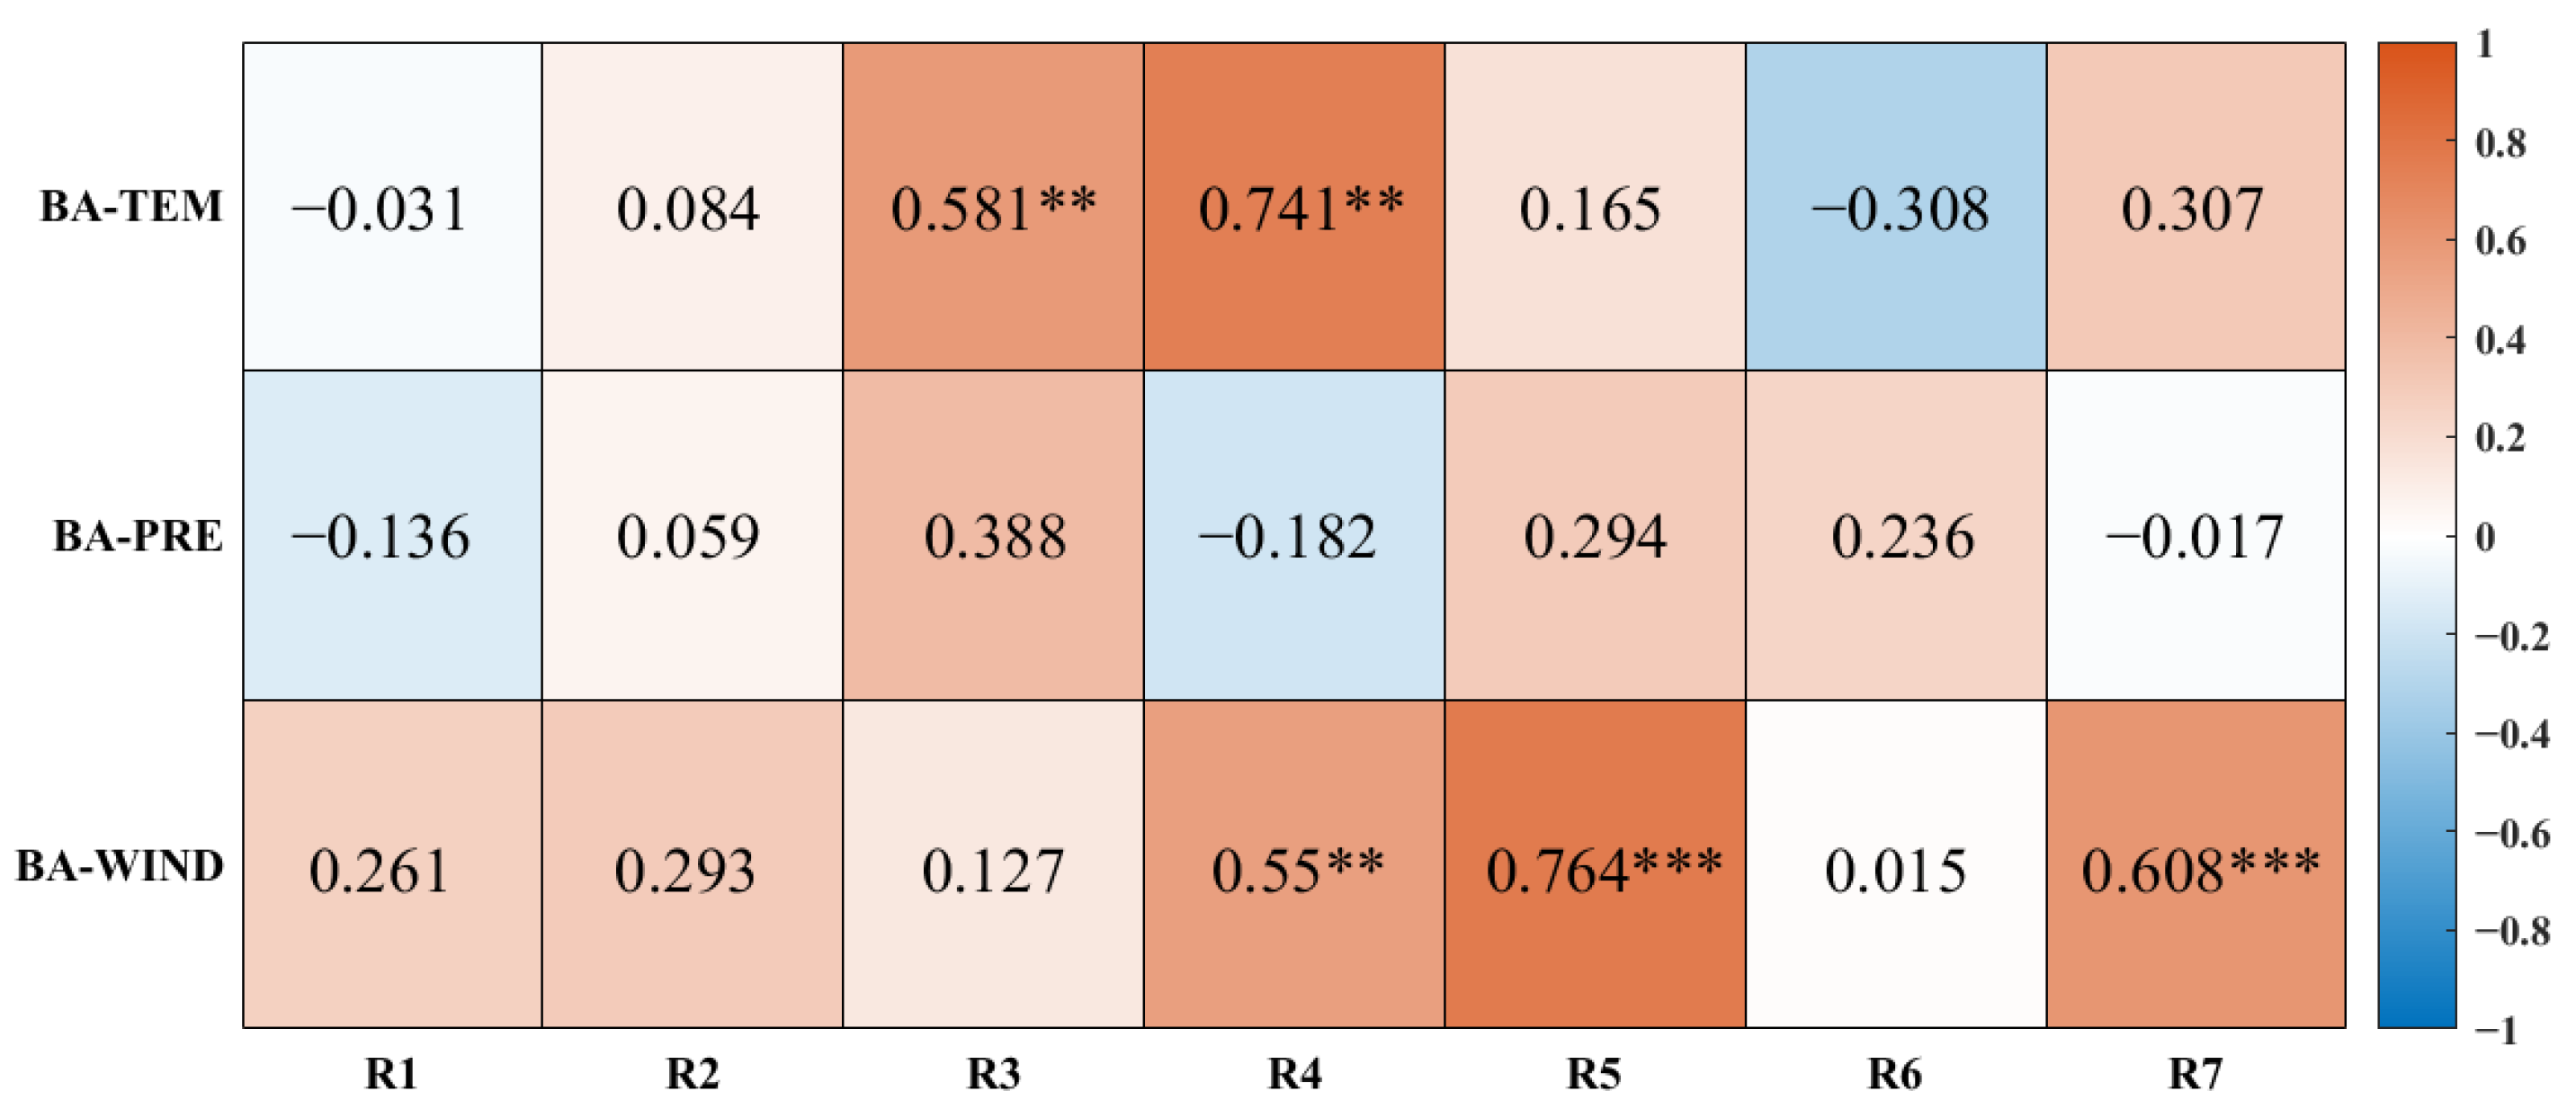
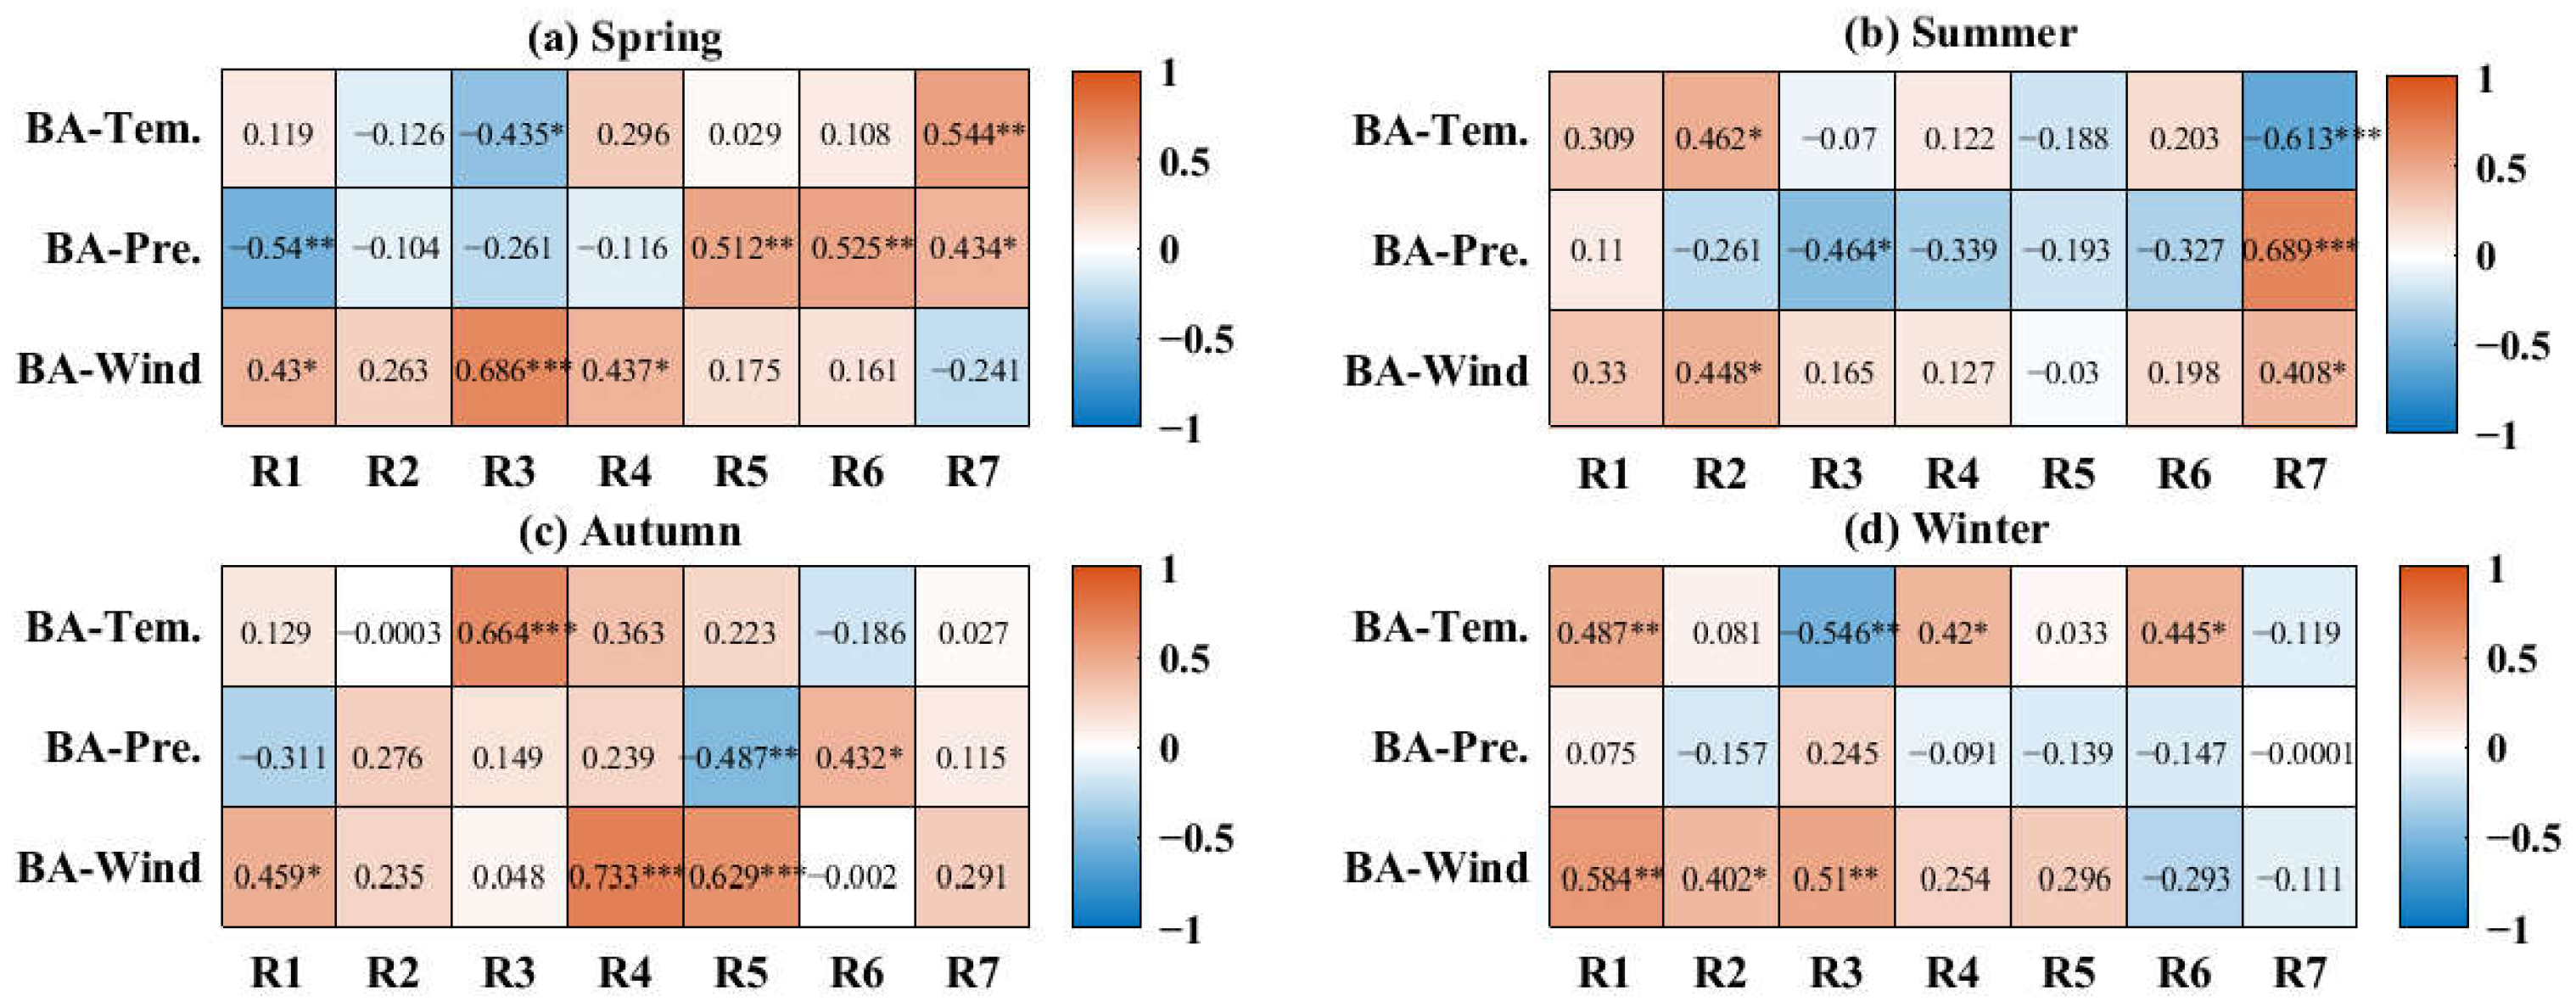
3.2.2. Results of Pearson Correlation Analysis

The correlations of the seven subregions between BA and each of the climatic factors (temperature, precipitation and wind speed) at annual scale were evaluated by Pearson correlation coefficient and the results are shown in Figure 14. Generally, BA is positively correlated with temperature, except for R1 and R6, where R1 has a weak negative correlation. The positive correlations of R3 (r = 0.581, p < 0.05) and R4 (r = 0.741, p < 0.05) are significant. BA in most regions is negatively correlated with precipitation, except for R2, R3, R5 and R6, where R2 has a weak positive correlation. All seven subregions show a positive correlation between BA and wind speed. Among them, R4 (r = 0.55, p < 0.05), R5 (r = 0.764, p < 0.01) and R7 (r = 0.608, p < 0.01) show significant positive correlations.
At the seasonal scale, the correlation between BA and the three climatic factors was also evaluated. The results of correlation coefficients for the four seasons are shown in Figure 15. The effect of temperature on BA is basically positive for all of the subregions during the four seasons. Although there are some negative correlations in some subregions and in different seasons, the number of negative correlation coefficients is fewer. They occur in R2 and R3 in spring, in R3, R5 and R7 in summer, in R2 and R6 in autumn and in R2 and R7 in winter. The effects of these negative correlations are weak, because the absolute value of their correlation is lower than 0.2, except for R3 in spring and winter and R7 in summer. Significantly positive correlations occur in R7 (r = 0.544, p < 0.05) in spring, R2 (r = 0.462, p < 0.1) in summer, R3 (r = 0.664, p < 0.01) in autumn and R1 (r = 0.487, p < 0.05), R4 (r = 0.42, p < 0.1) and R6 (r = 0.445, p < 0.1) in winter.
The effect of precipitation on BA is generally negative for all of the subregions during the four seasons. Specifically, in spring, the influence of precipitation on BA is opposite in the north and south of China. The influence is negative in Northern (R1, R2 and R3) and Central China (R4), but positive in the southern (R5) and the northwestern arid regions (R6) and the Qinghai–Tibet Plateau (R7). In particular, it is significantly correlated in R1 (r = −0.54, p < 0.05), R5 (r = 0.512, p < 0.05), R6 (r = 0.525, p < 0.05) and R7 (r = 0.434, p < 0.1). In summer, the influence of precipitation on BA is basically negative in all seven subregions except for R1 and R7, among which R3 (r = −0.464, p < 0.1) and R7 (r = 0.689, p < 0.01) are significant. In autumn, there are more positive correlation subregions, but their correlations are weak (<0.28) and insignificant, except for R6 (r = 0.432, p < 0.1), with a significantly positive correlation. A relatively high negative correlation exists in R1 and R5 (r = −0.487, p < 0.05). In winter, most of the subregions showed a weakly negative correlation and they did not pass the significance test.
The effect of wind speed on BA is basically positive for all the subregions during the four seasons. In spring, summer and autumn, there is, respectively, one subregion with negative correlations: R7 (−0.24) in spring, R5 (−0.03) in summer and R6 (−0.002) in autumn. These negative correlations are very weak and do not pass the significance test. Note that most of the subregions show a positive correlation, among which R1 (r = 0.43, p < 0.1), R3 (r = 0.686, p < 0.01) and R4 (r = 0.437, p < 0.1) in spring; R2 (r = 0.448, p < 0.1) and R7 (r = 0.408, p < 0.1) in summer; and R1 (r = 0.459, p < 0.1), R4 (r = 0.733, p < 0.01) and R5 (r = 0.629, p < 0.01) in autumn pass the positive significance test. In winter, only two of seven subregions have weakly negative correlations (i.e., R6 with −0.29 and R7 with −0.11), and the rest represent positive correlations, especially for R1 (r = 0.584, p < 0.05), R2 (r = 0.402, p < 0.1) and R3 (r = 0.51, p < 0.05), passing the significance test.

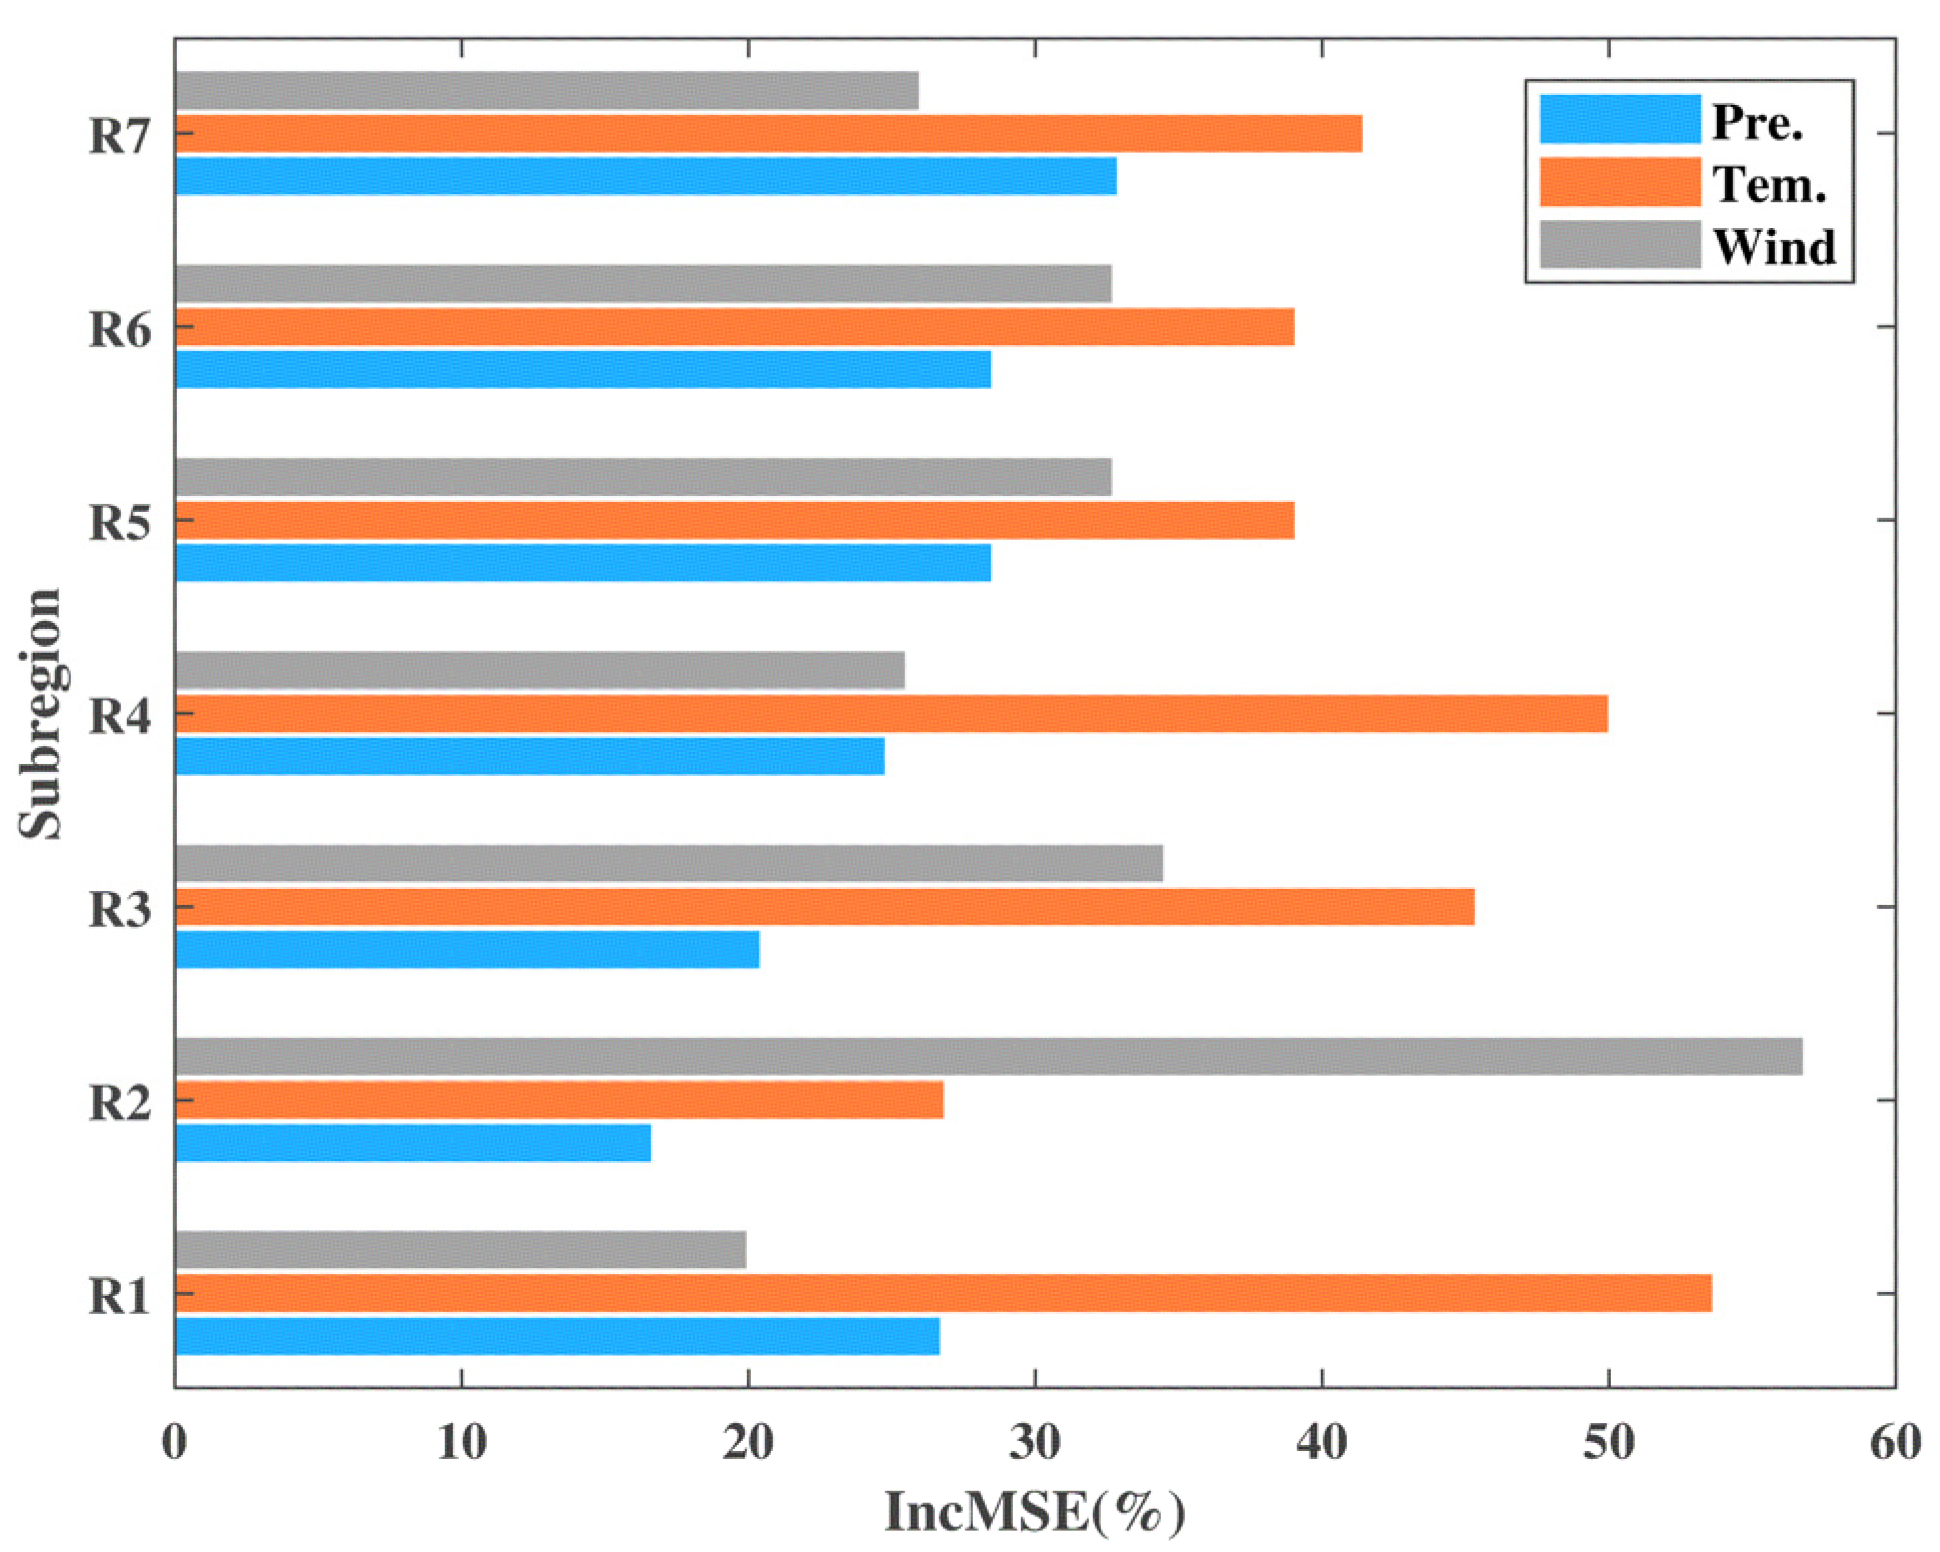
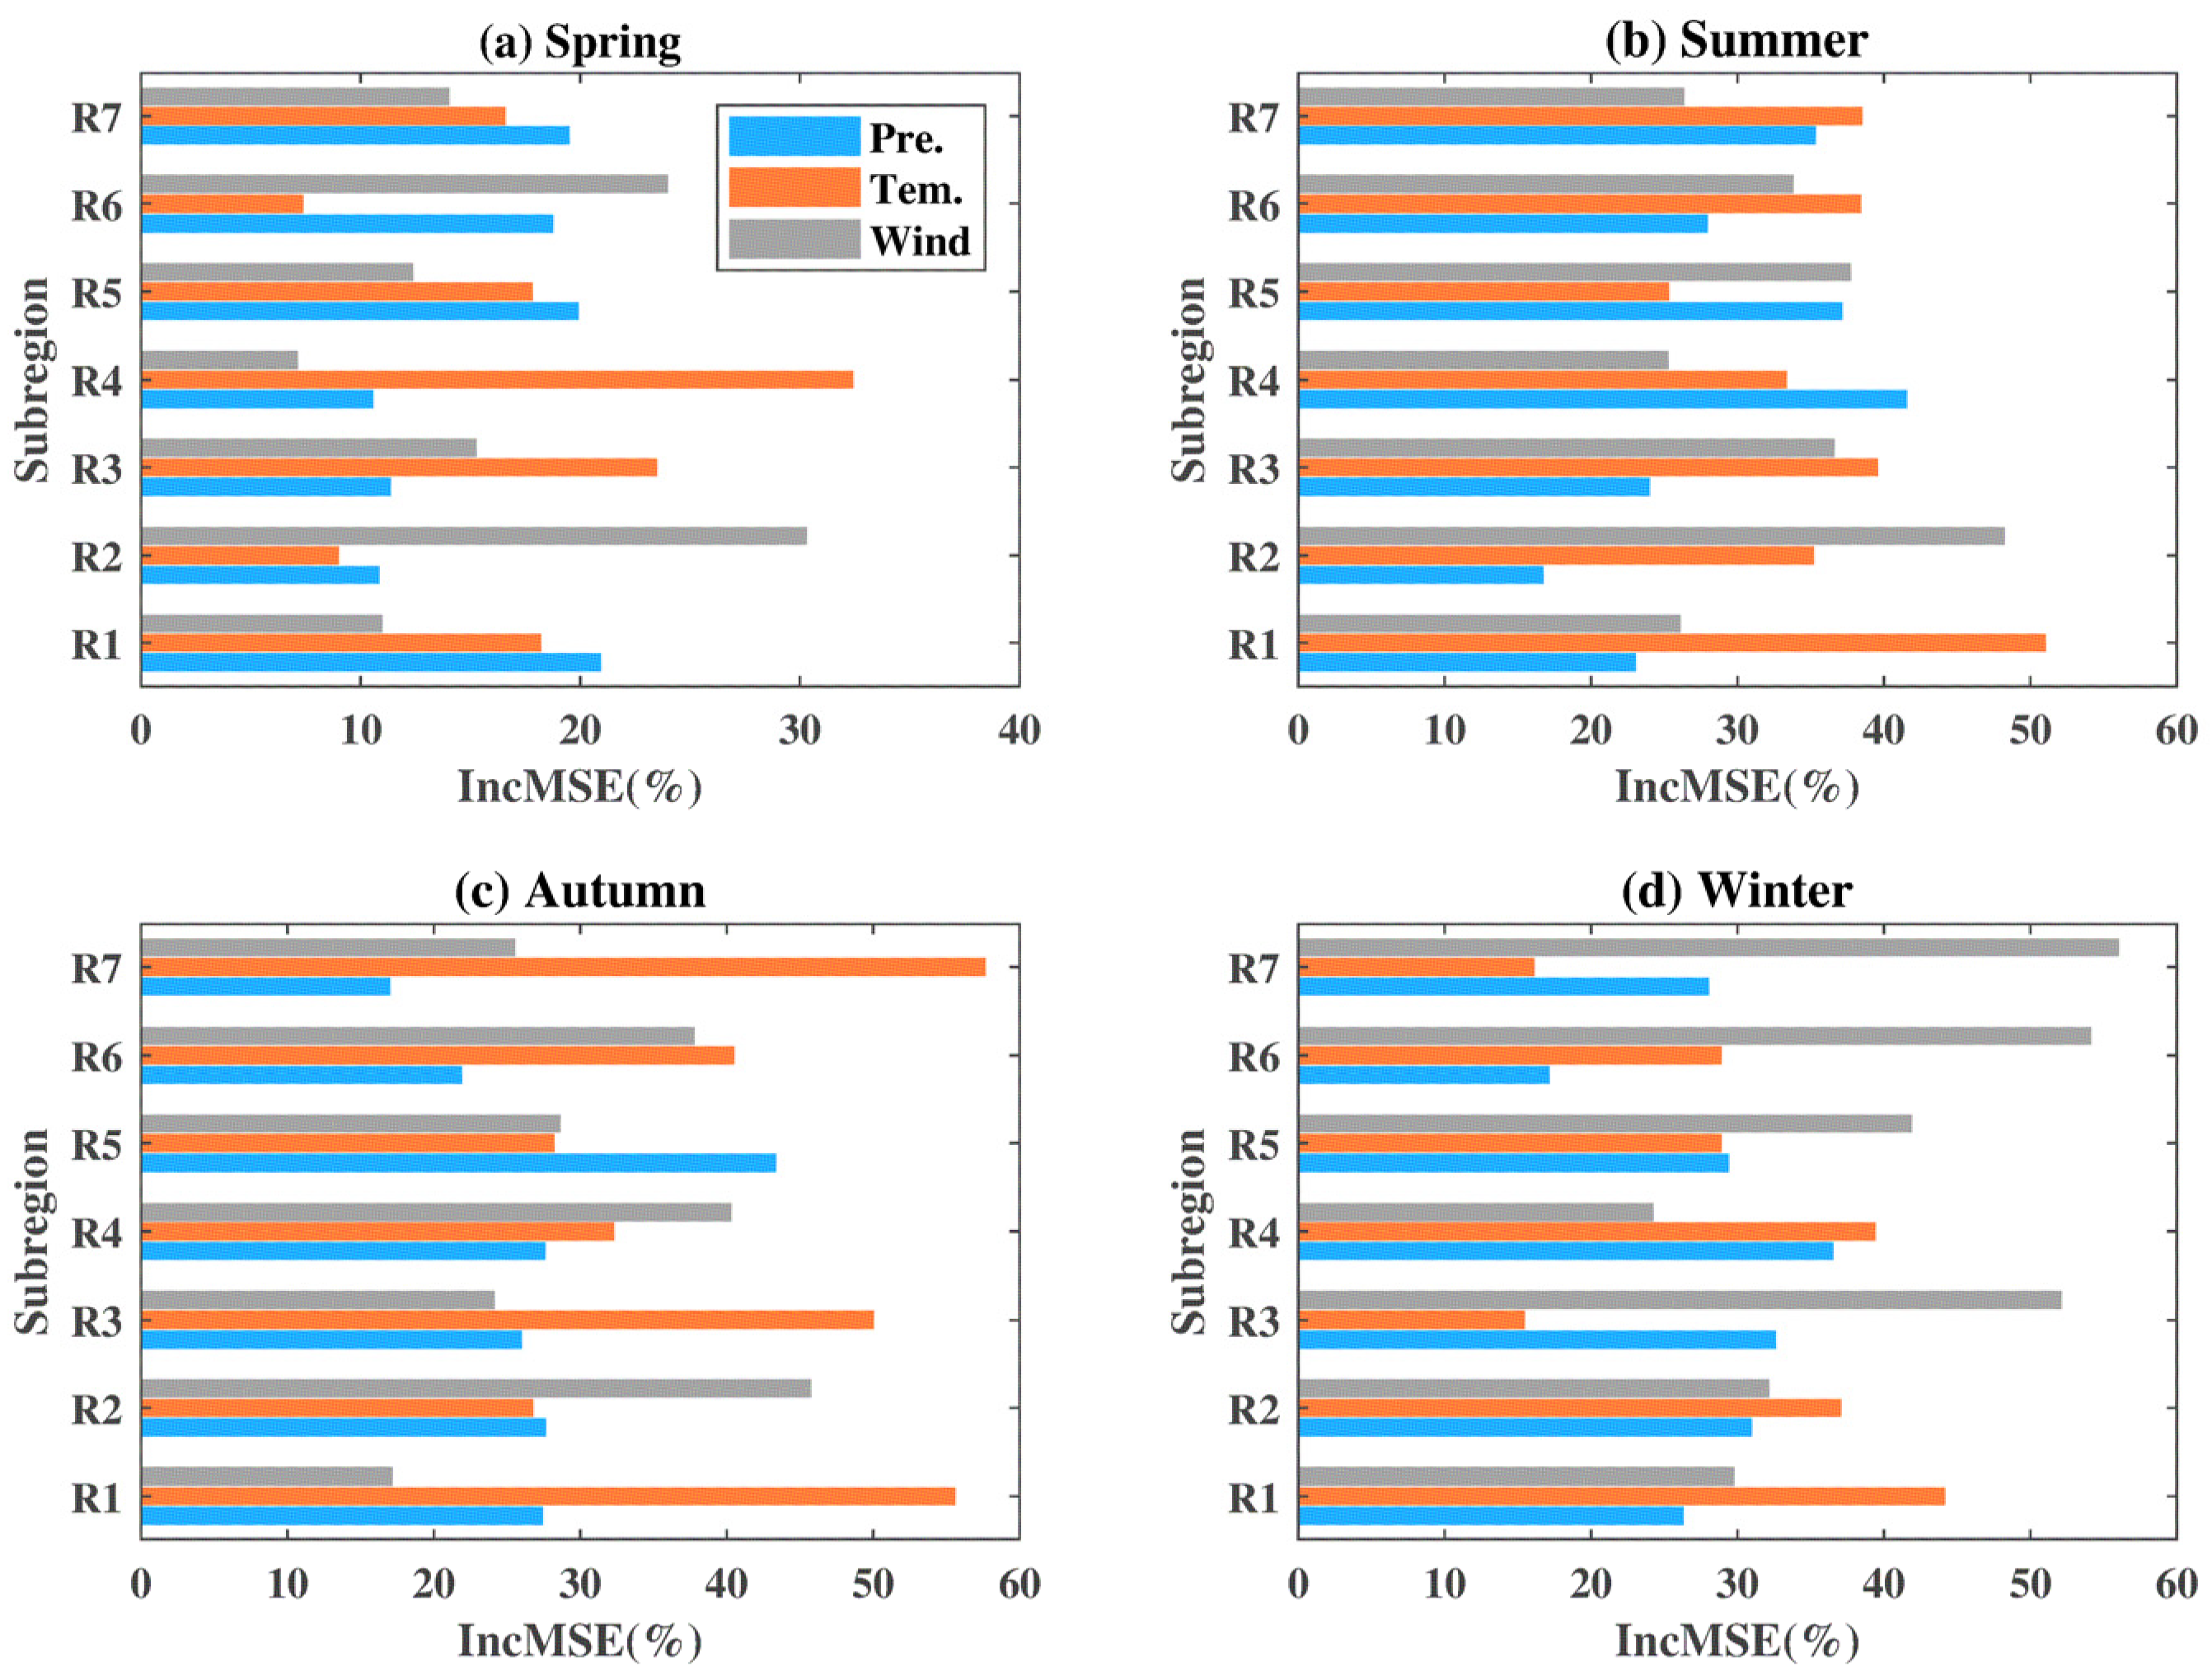
3.2.3. Results of Random Forest Analysis

In addition to Pearson correlation analysis, a nonlinear machine learning algorithm named random forest was also used to assess the importance of the three climatic factors on BA development. The results of the climatic contribution ratios based on Equation (2) to annual BA in seven subregions are shown in Figure 16. They show that the temperature in R1, R3, R4, R5, R6 and R7 is the most important variable affecting annual BA. The wind speed in R2 is the most important, and in R5 and R6, it is relatively important.
The contributions of climatic factors to seasonal BA were also assessed and the results are shown in Figure 17. In spring, the precipitation in R1, R5, R6 and R7 is the important variable. The wind speed in R2 has the largest contribution to BA. The temperature in R1, R3, R4, R5 and R7 has a relatively high contribution. In summer, the temperature in R1, R2, R3, R4, R6 and R7 is the most important variable. The wind speed in R2, R3, R5 and R6 is the most important contributing variable. The precipitation in R4, R5 and R7 has the relatively largest contribution to BA. In autumn, the contributions of the temperature in R1, R3, R6 and R7 are largest. The wind speed in R2, R4 and R6 is a relatively important variable. The precipitation in R5 has the largest contribution. In winter, the temperature in R1, R2 and R4 is the most important variable. The wind speed in R2, R3, R5, R6 and R7 has the relatively highest contribution. The precipitation in R2 and R4 has the relatively largest contribution.
On the whole, the contributions of temperature to BA in China at annual and seasonal scales are significant; however, the wind speed in R2 is determined as the most important variable, which can be also confirmed by correlation analyses (see Figure 14 and Figure 15). Except for temperature, the precipitation in spring and summer, as well as the wind speed in autumn and winter, are also considered important variables. The main driving factors of each subregion are different for the different seasons and therefore it is difficult to determine a single factor as the main contributor during the four seasons.

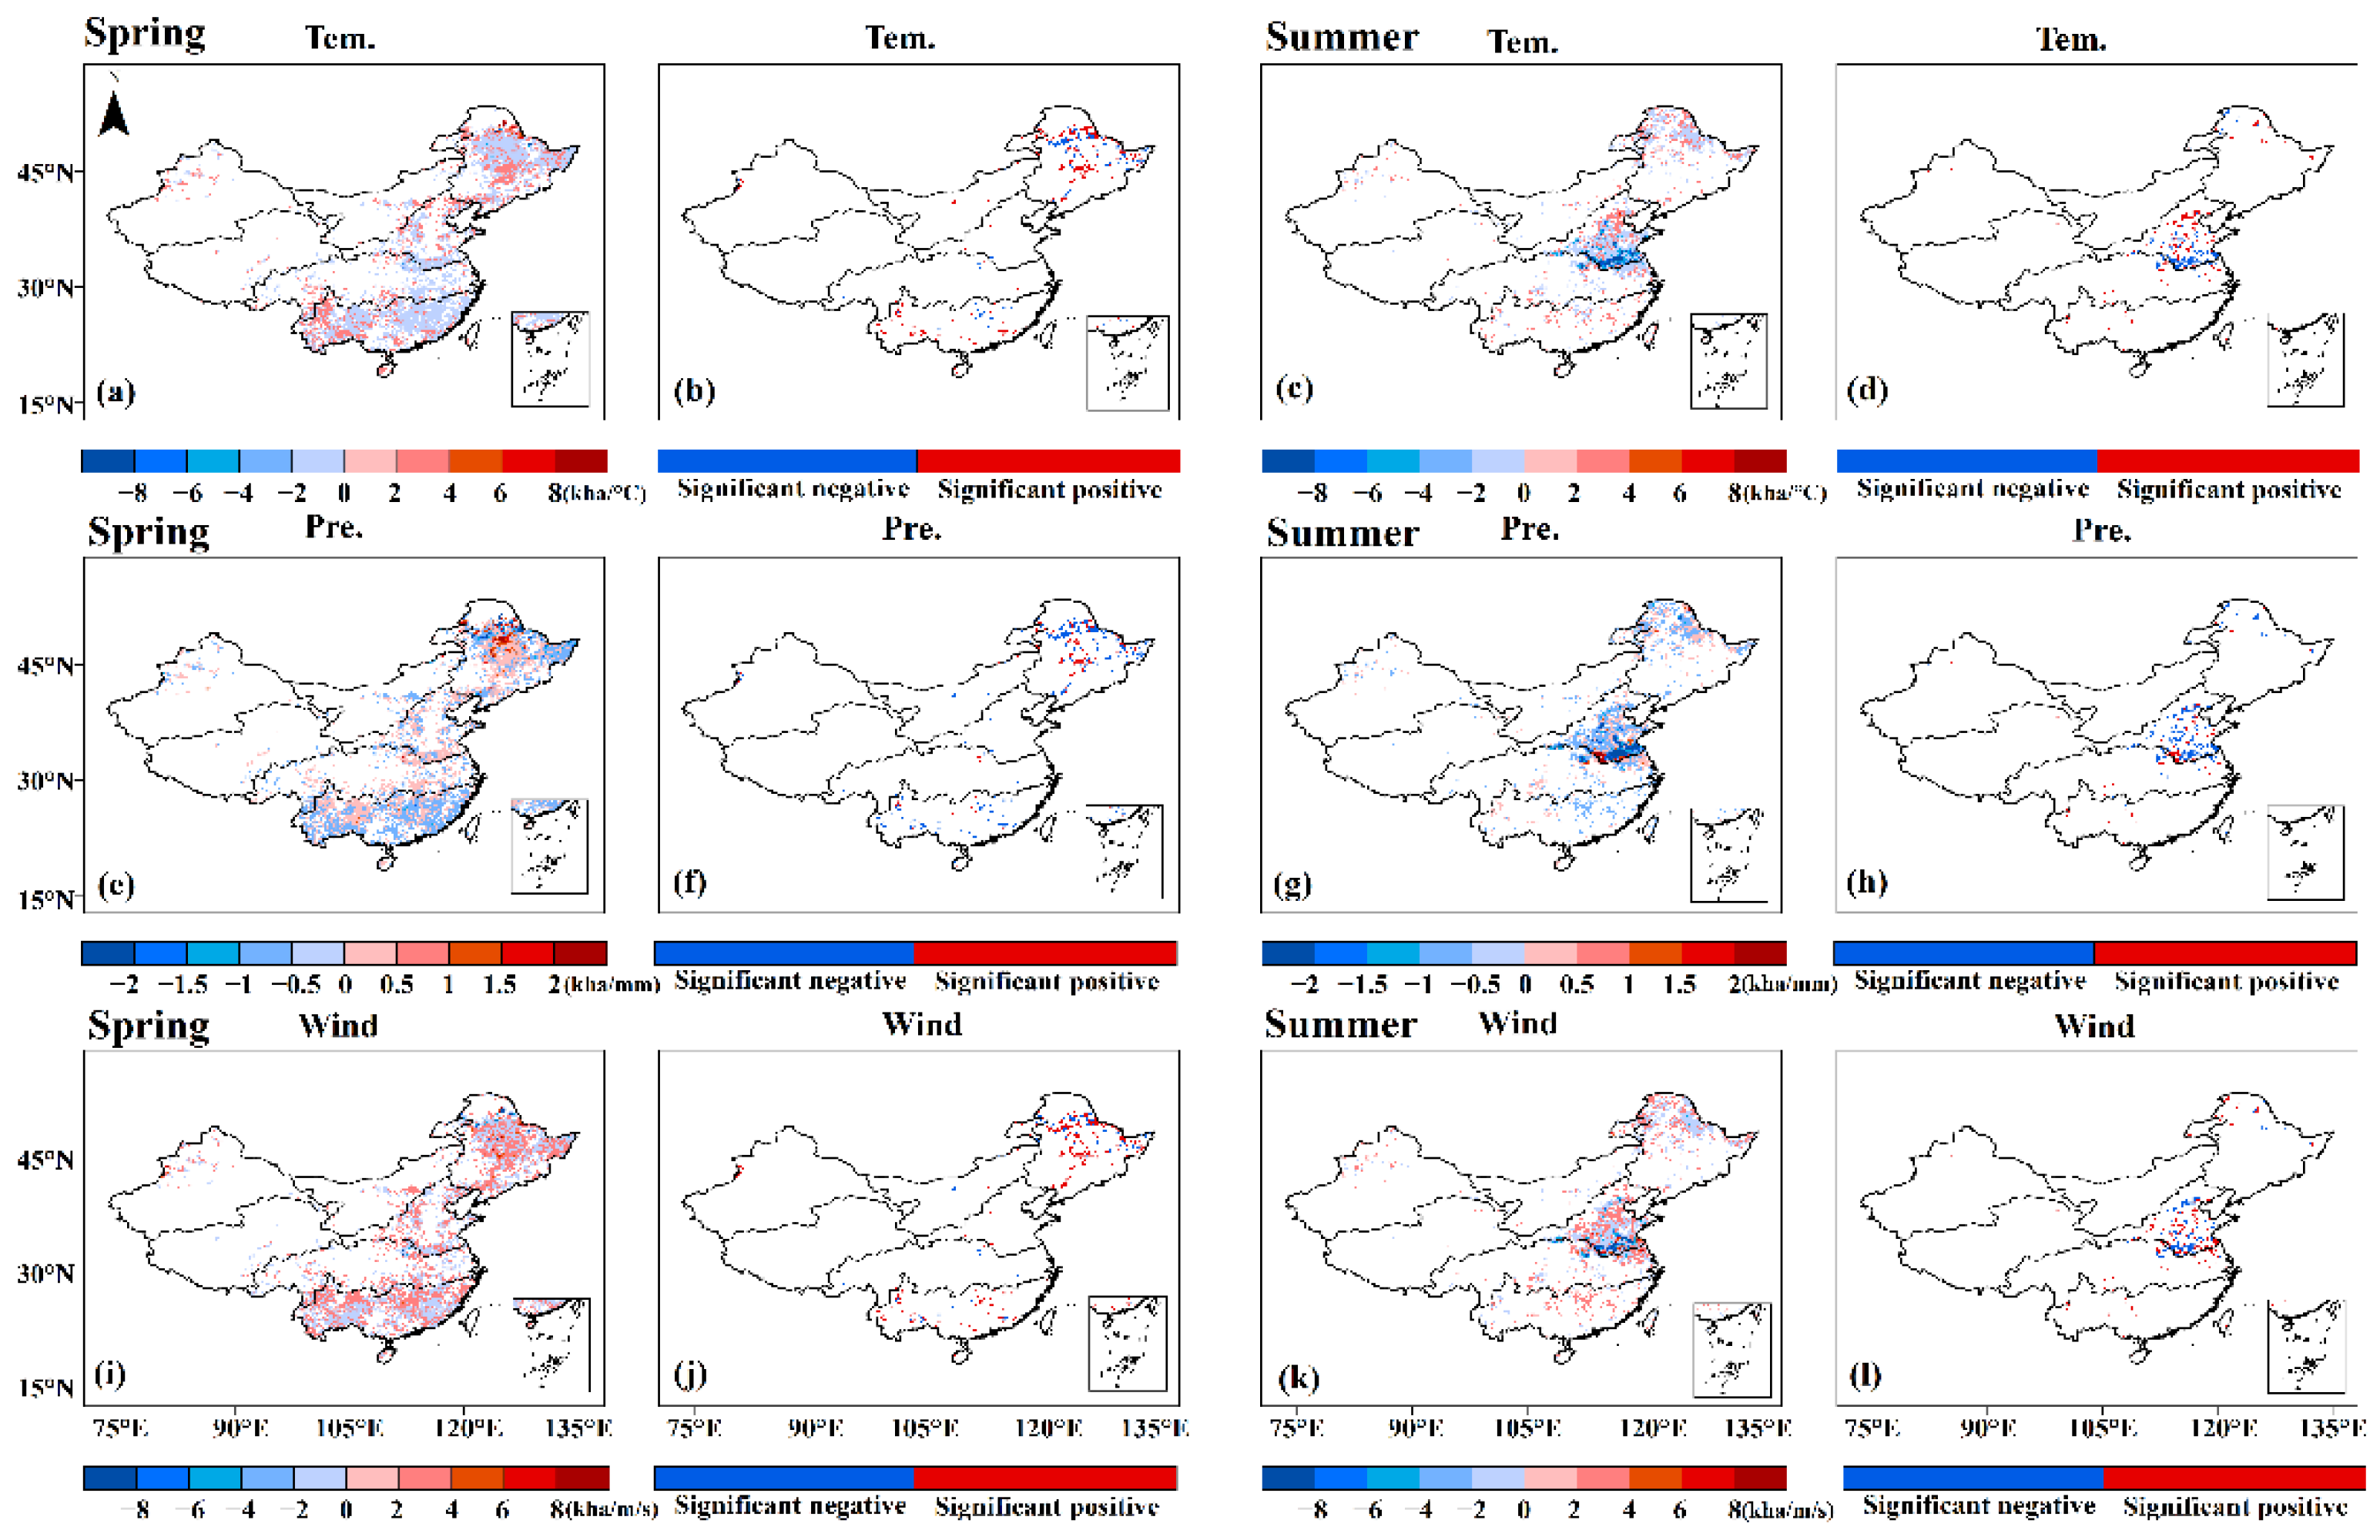
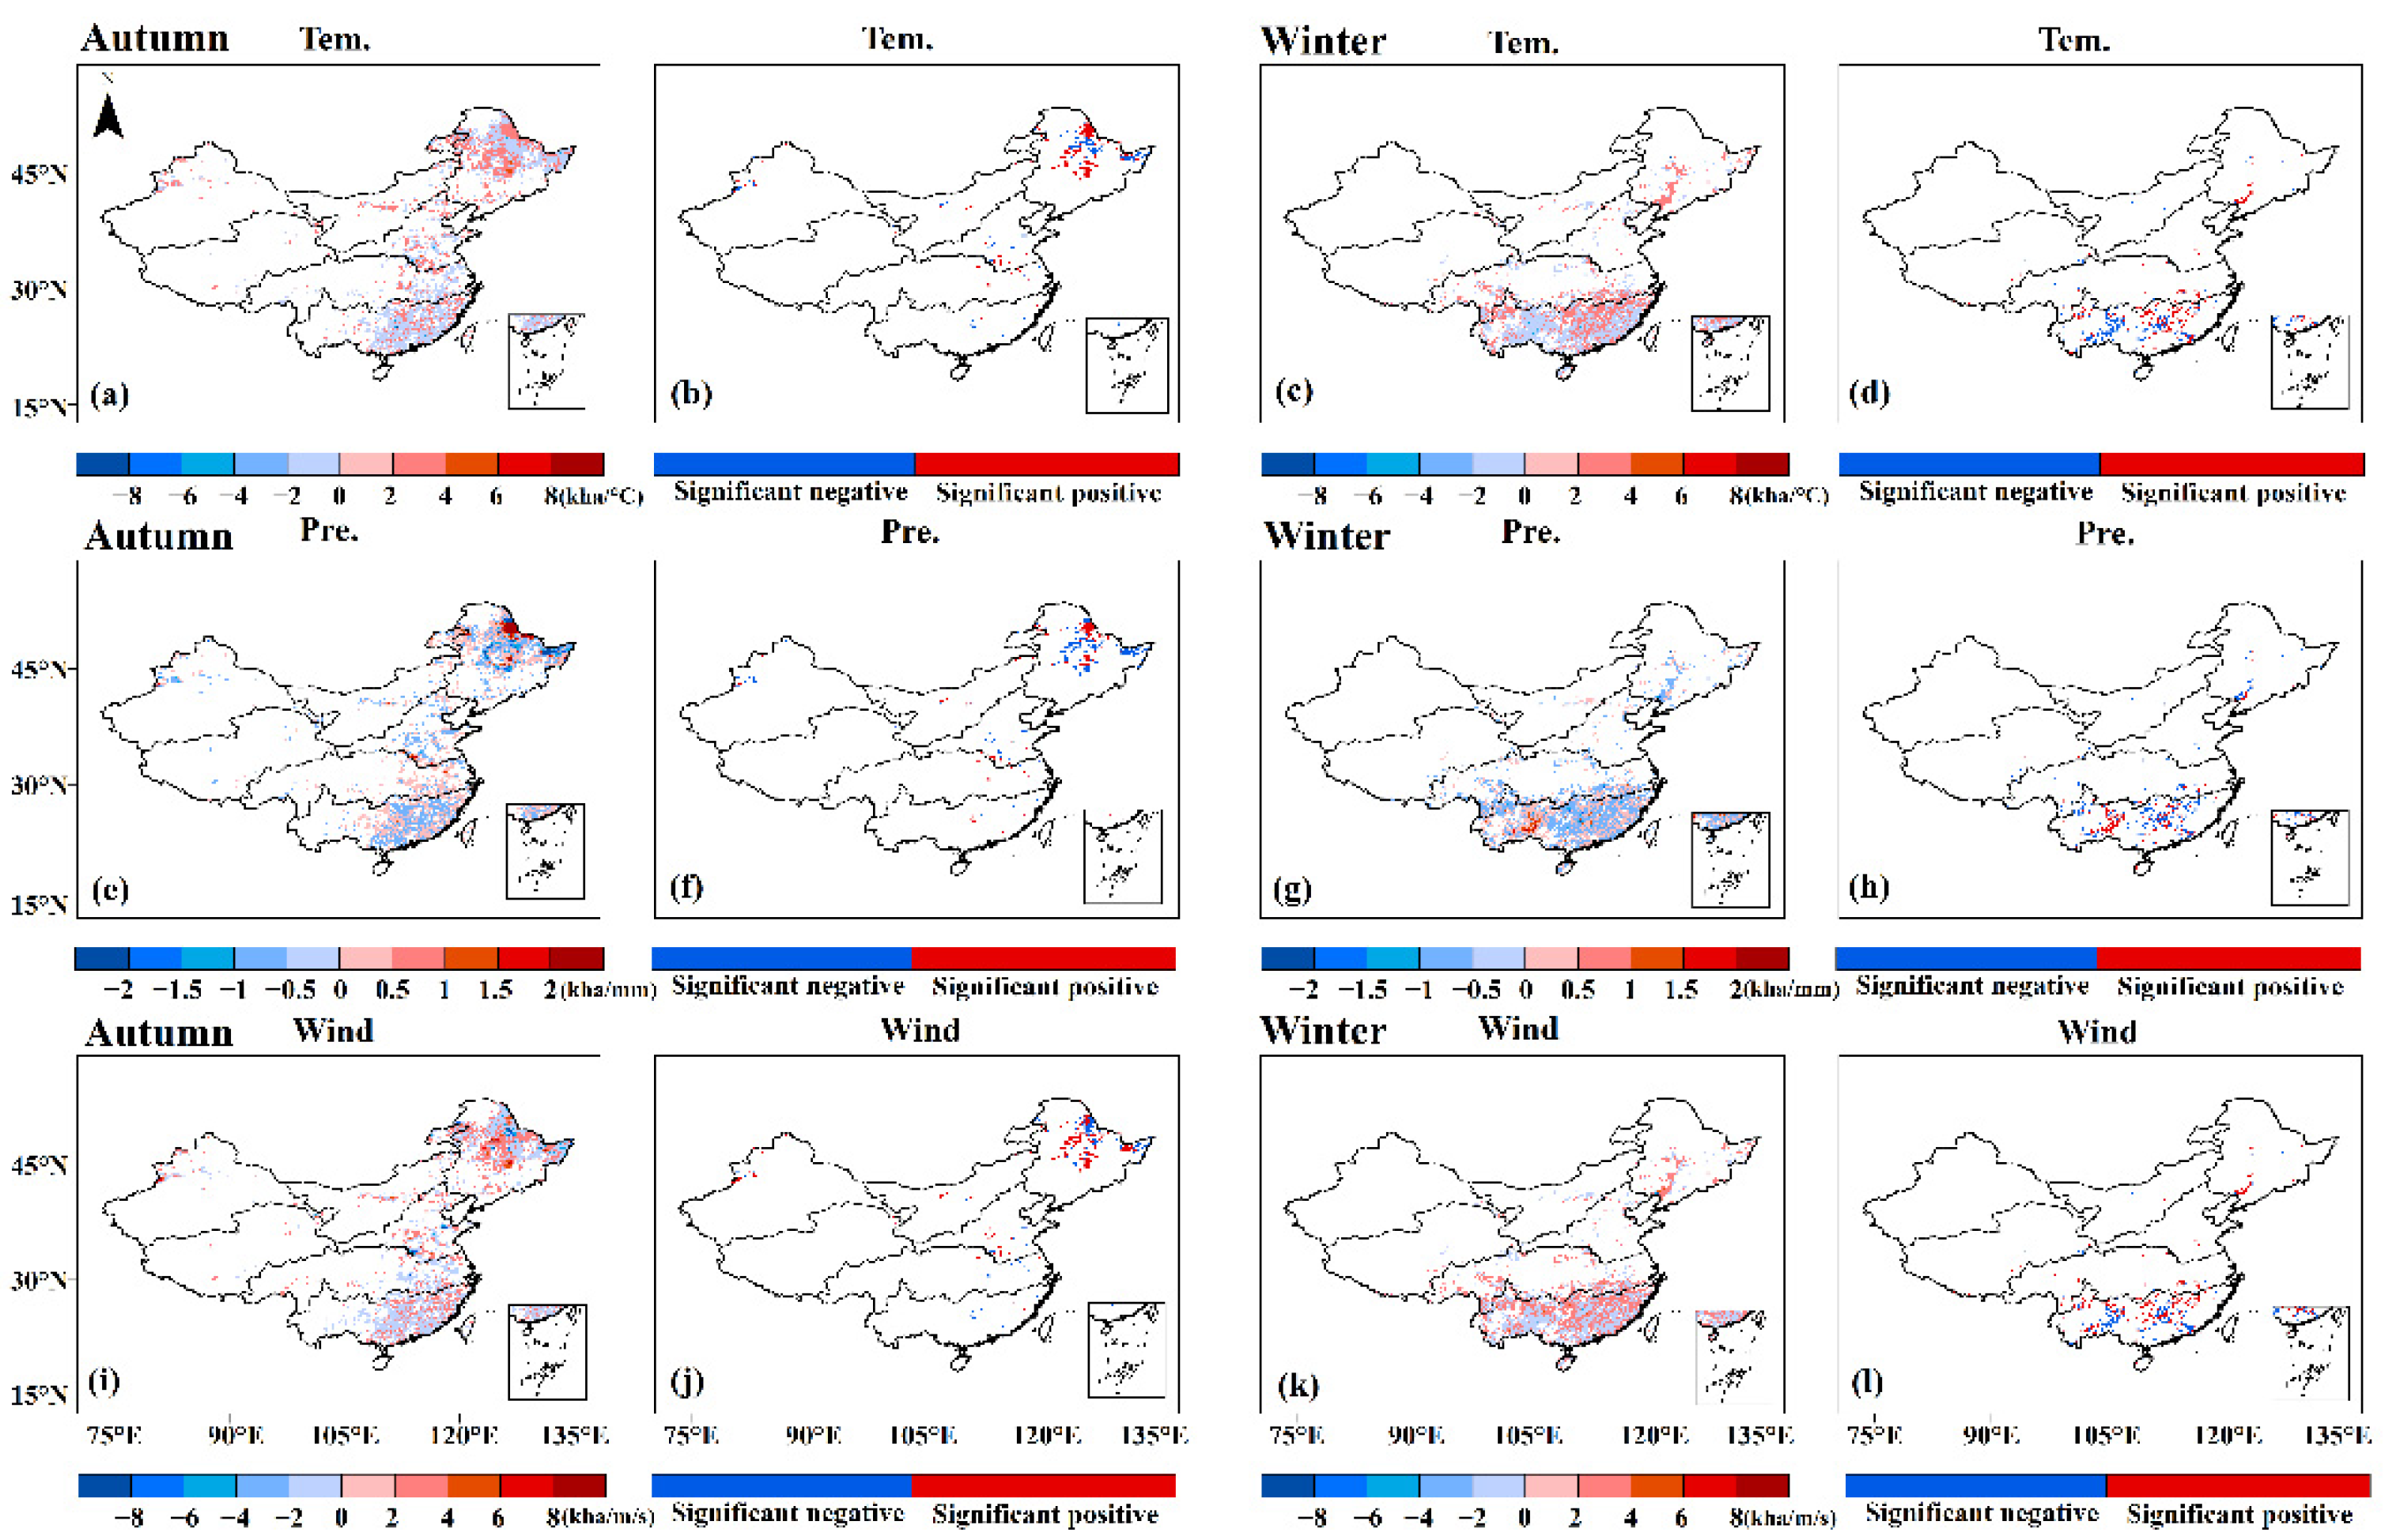
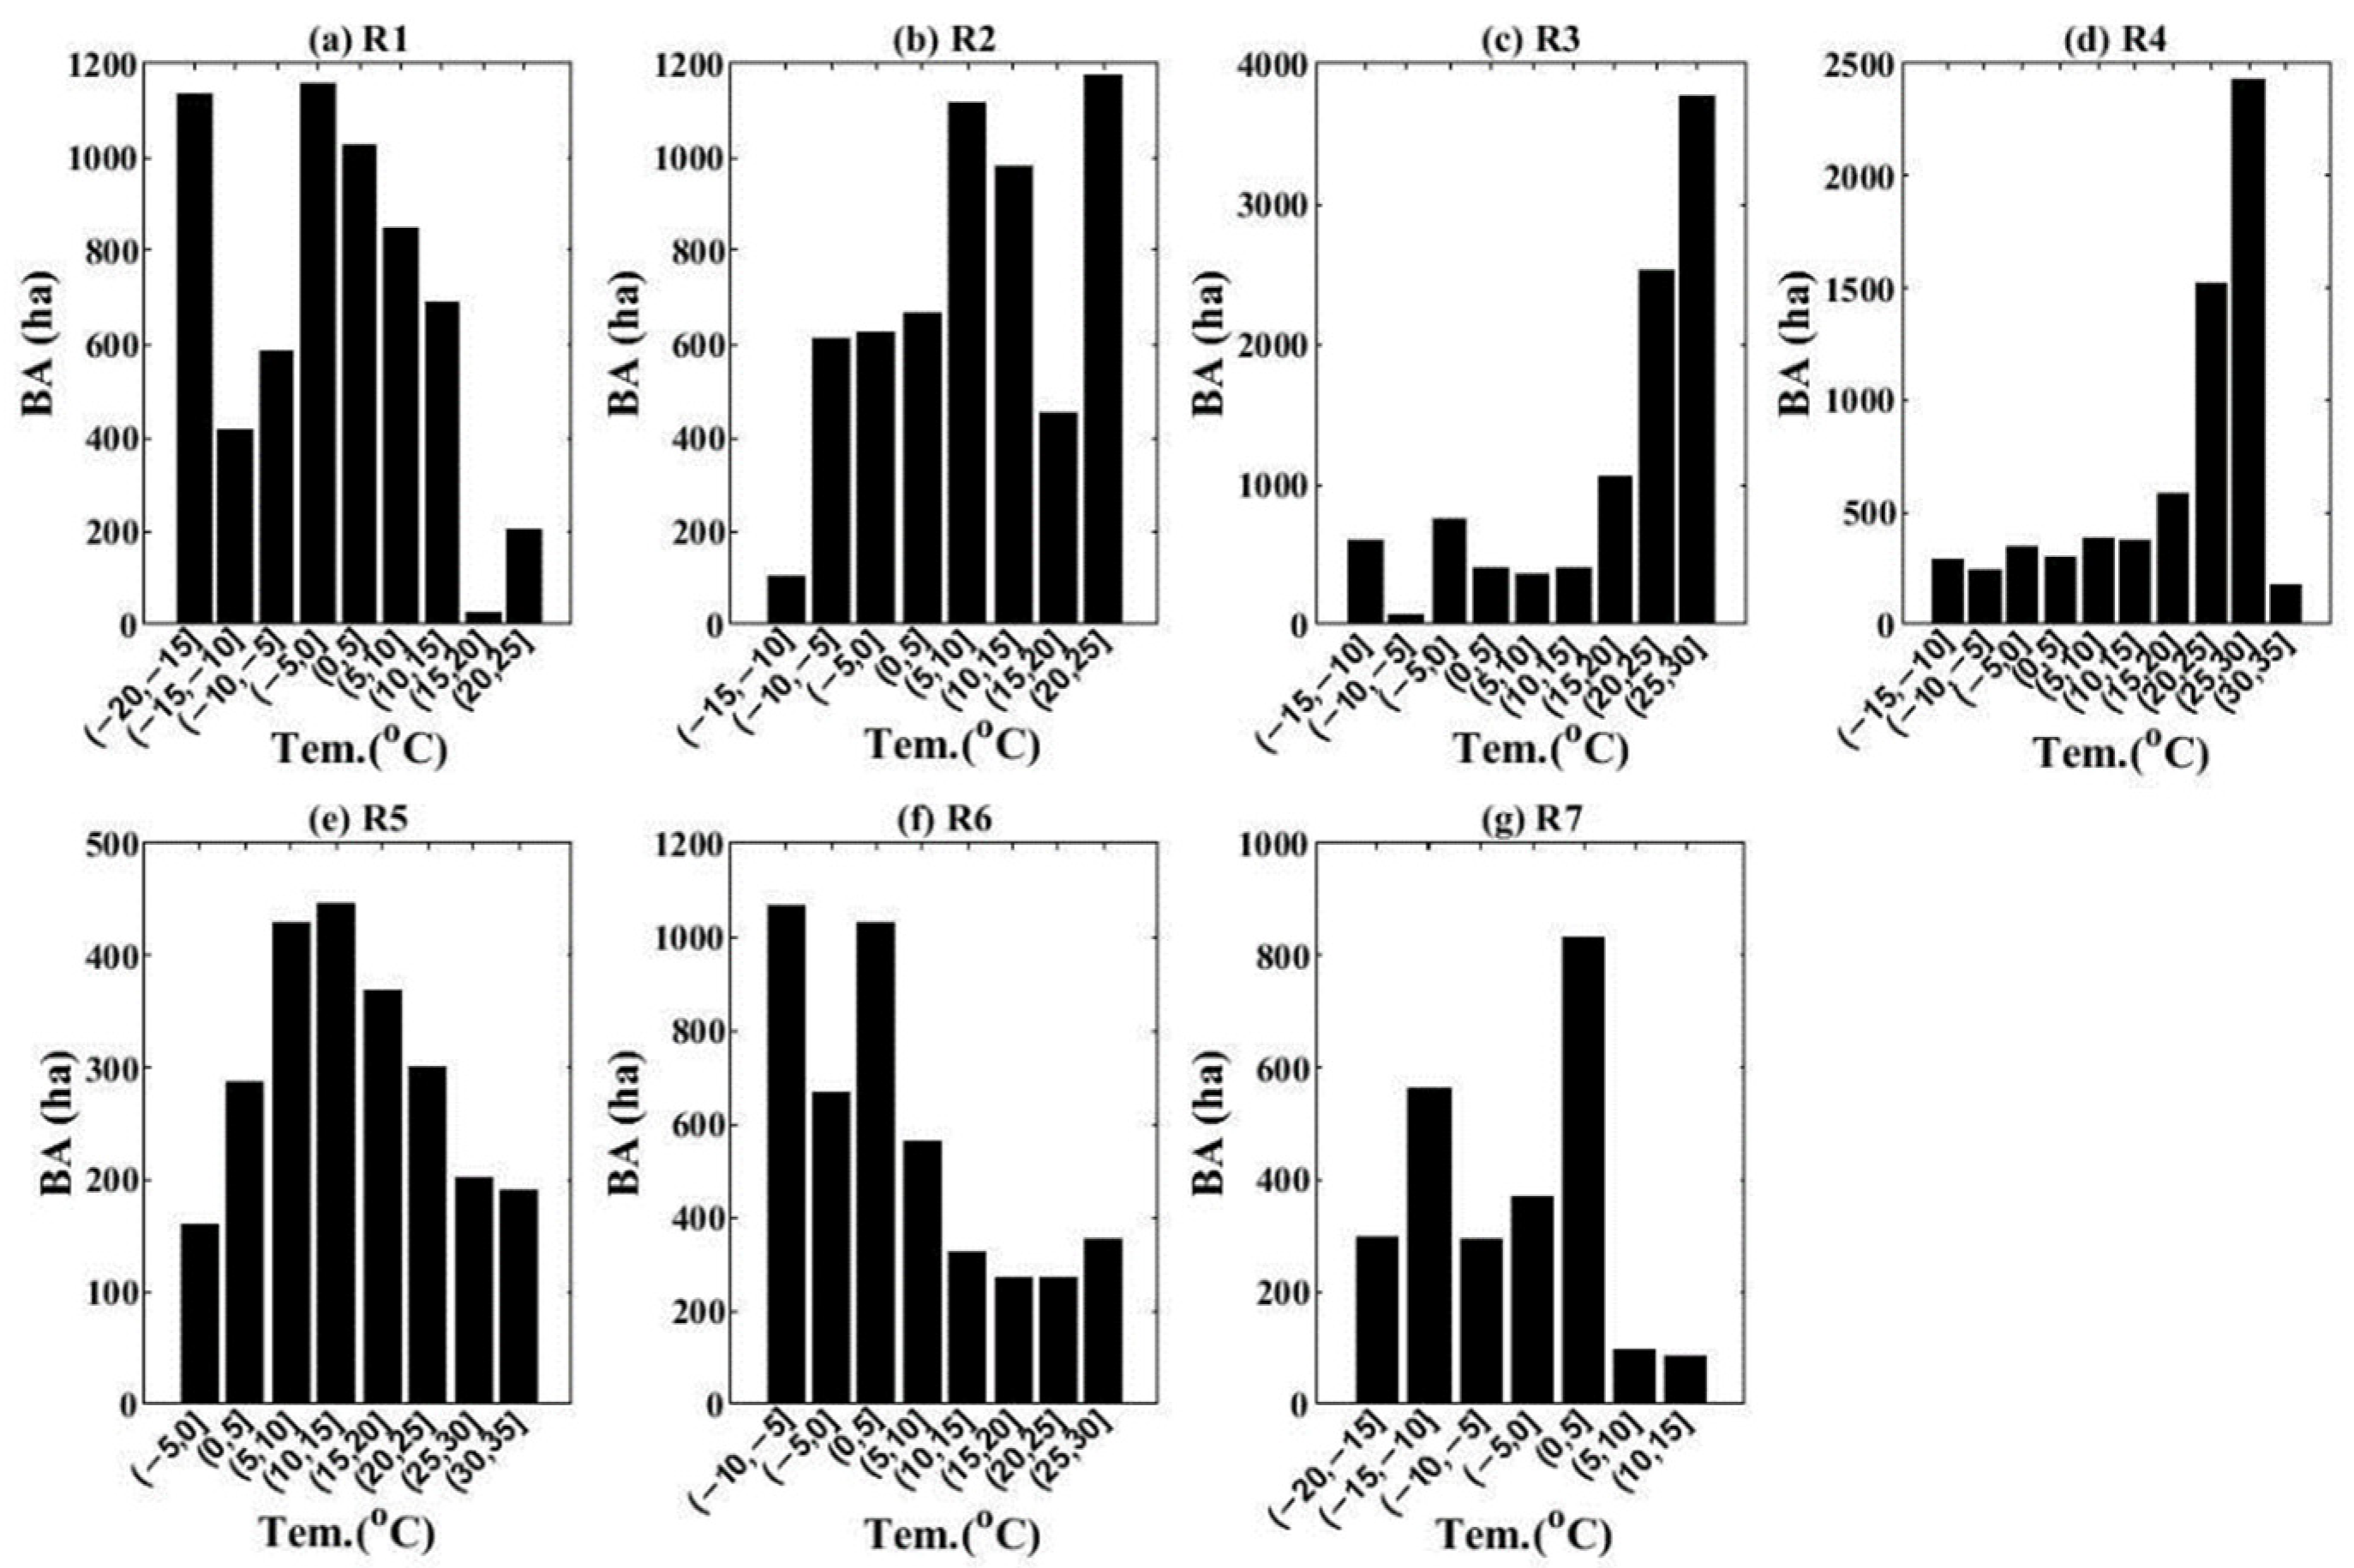
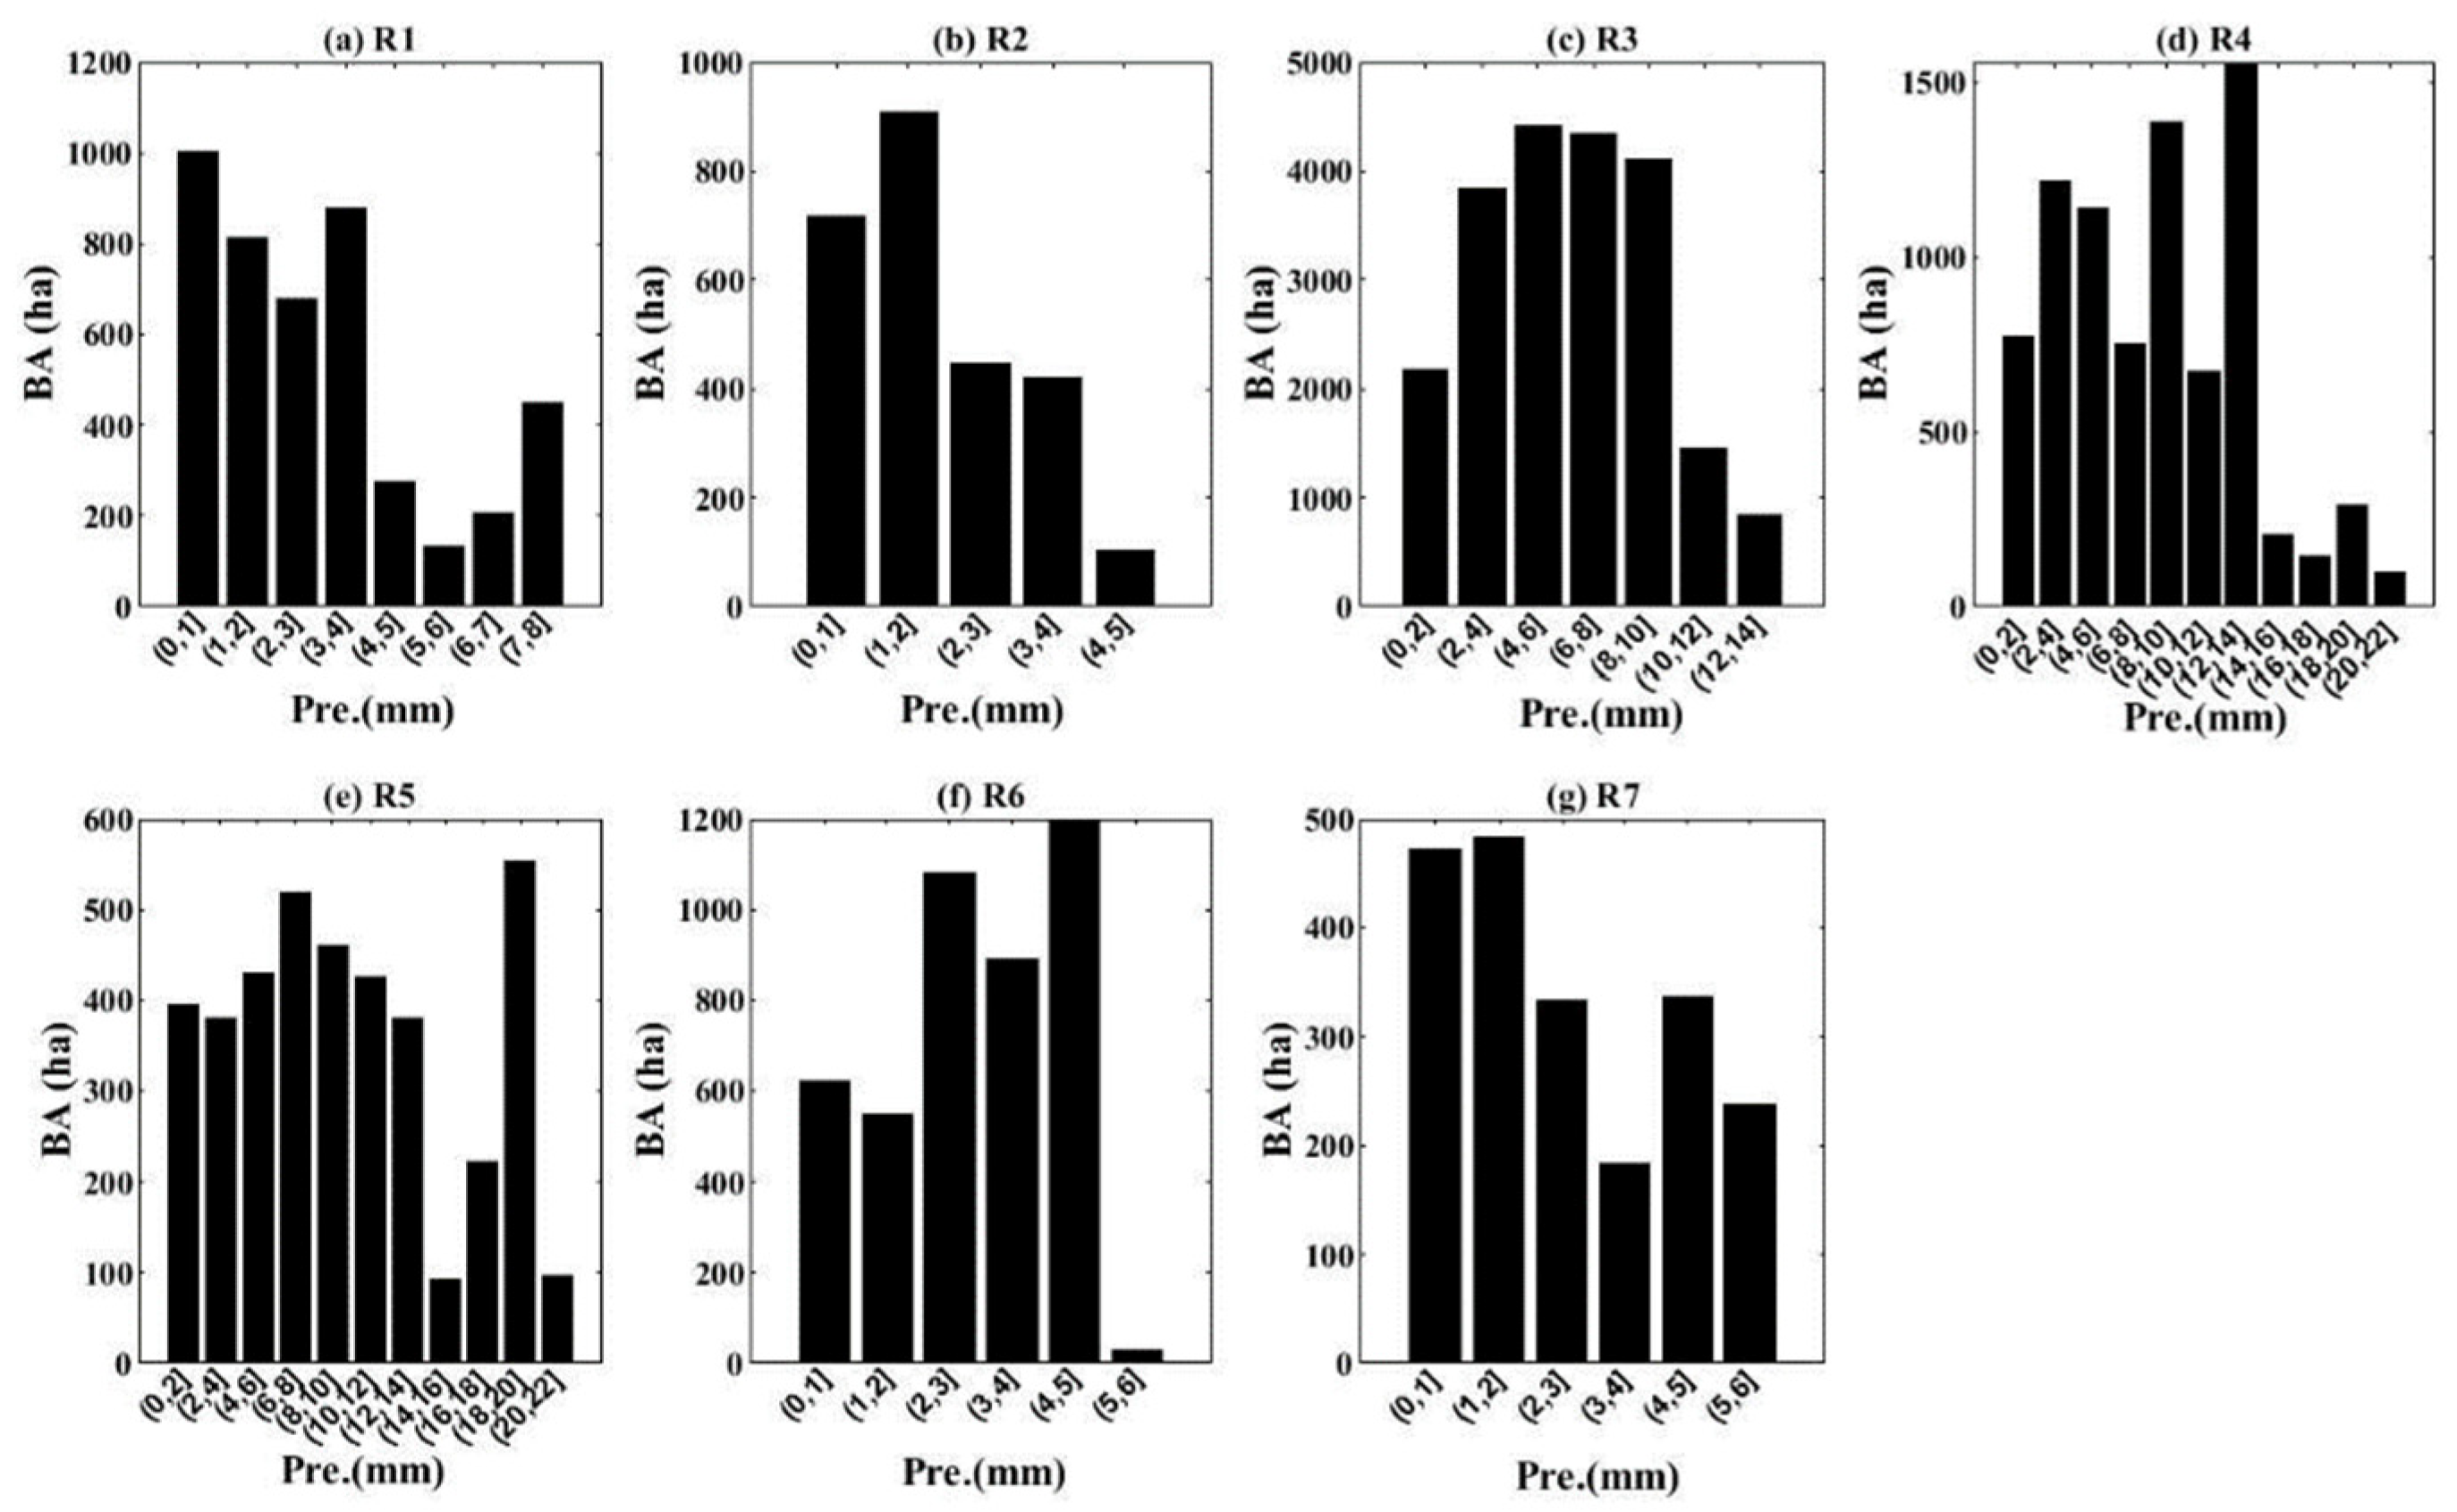
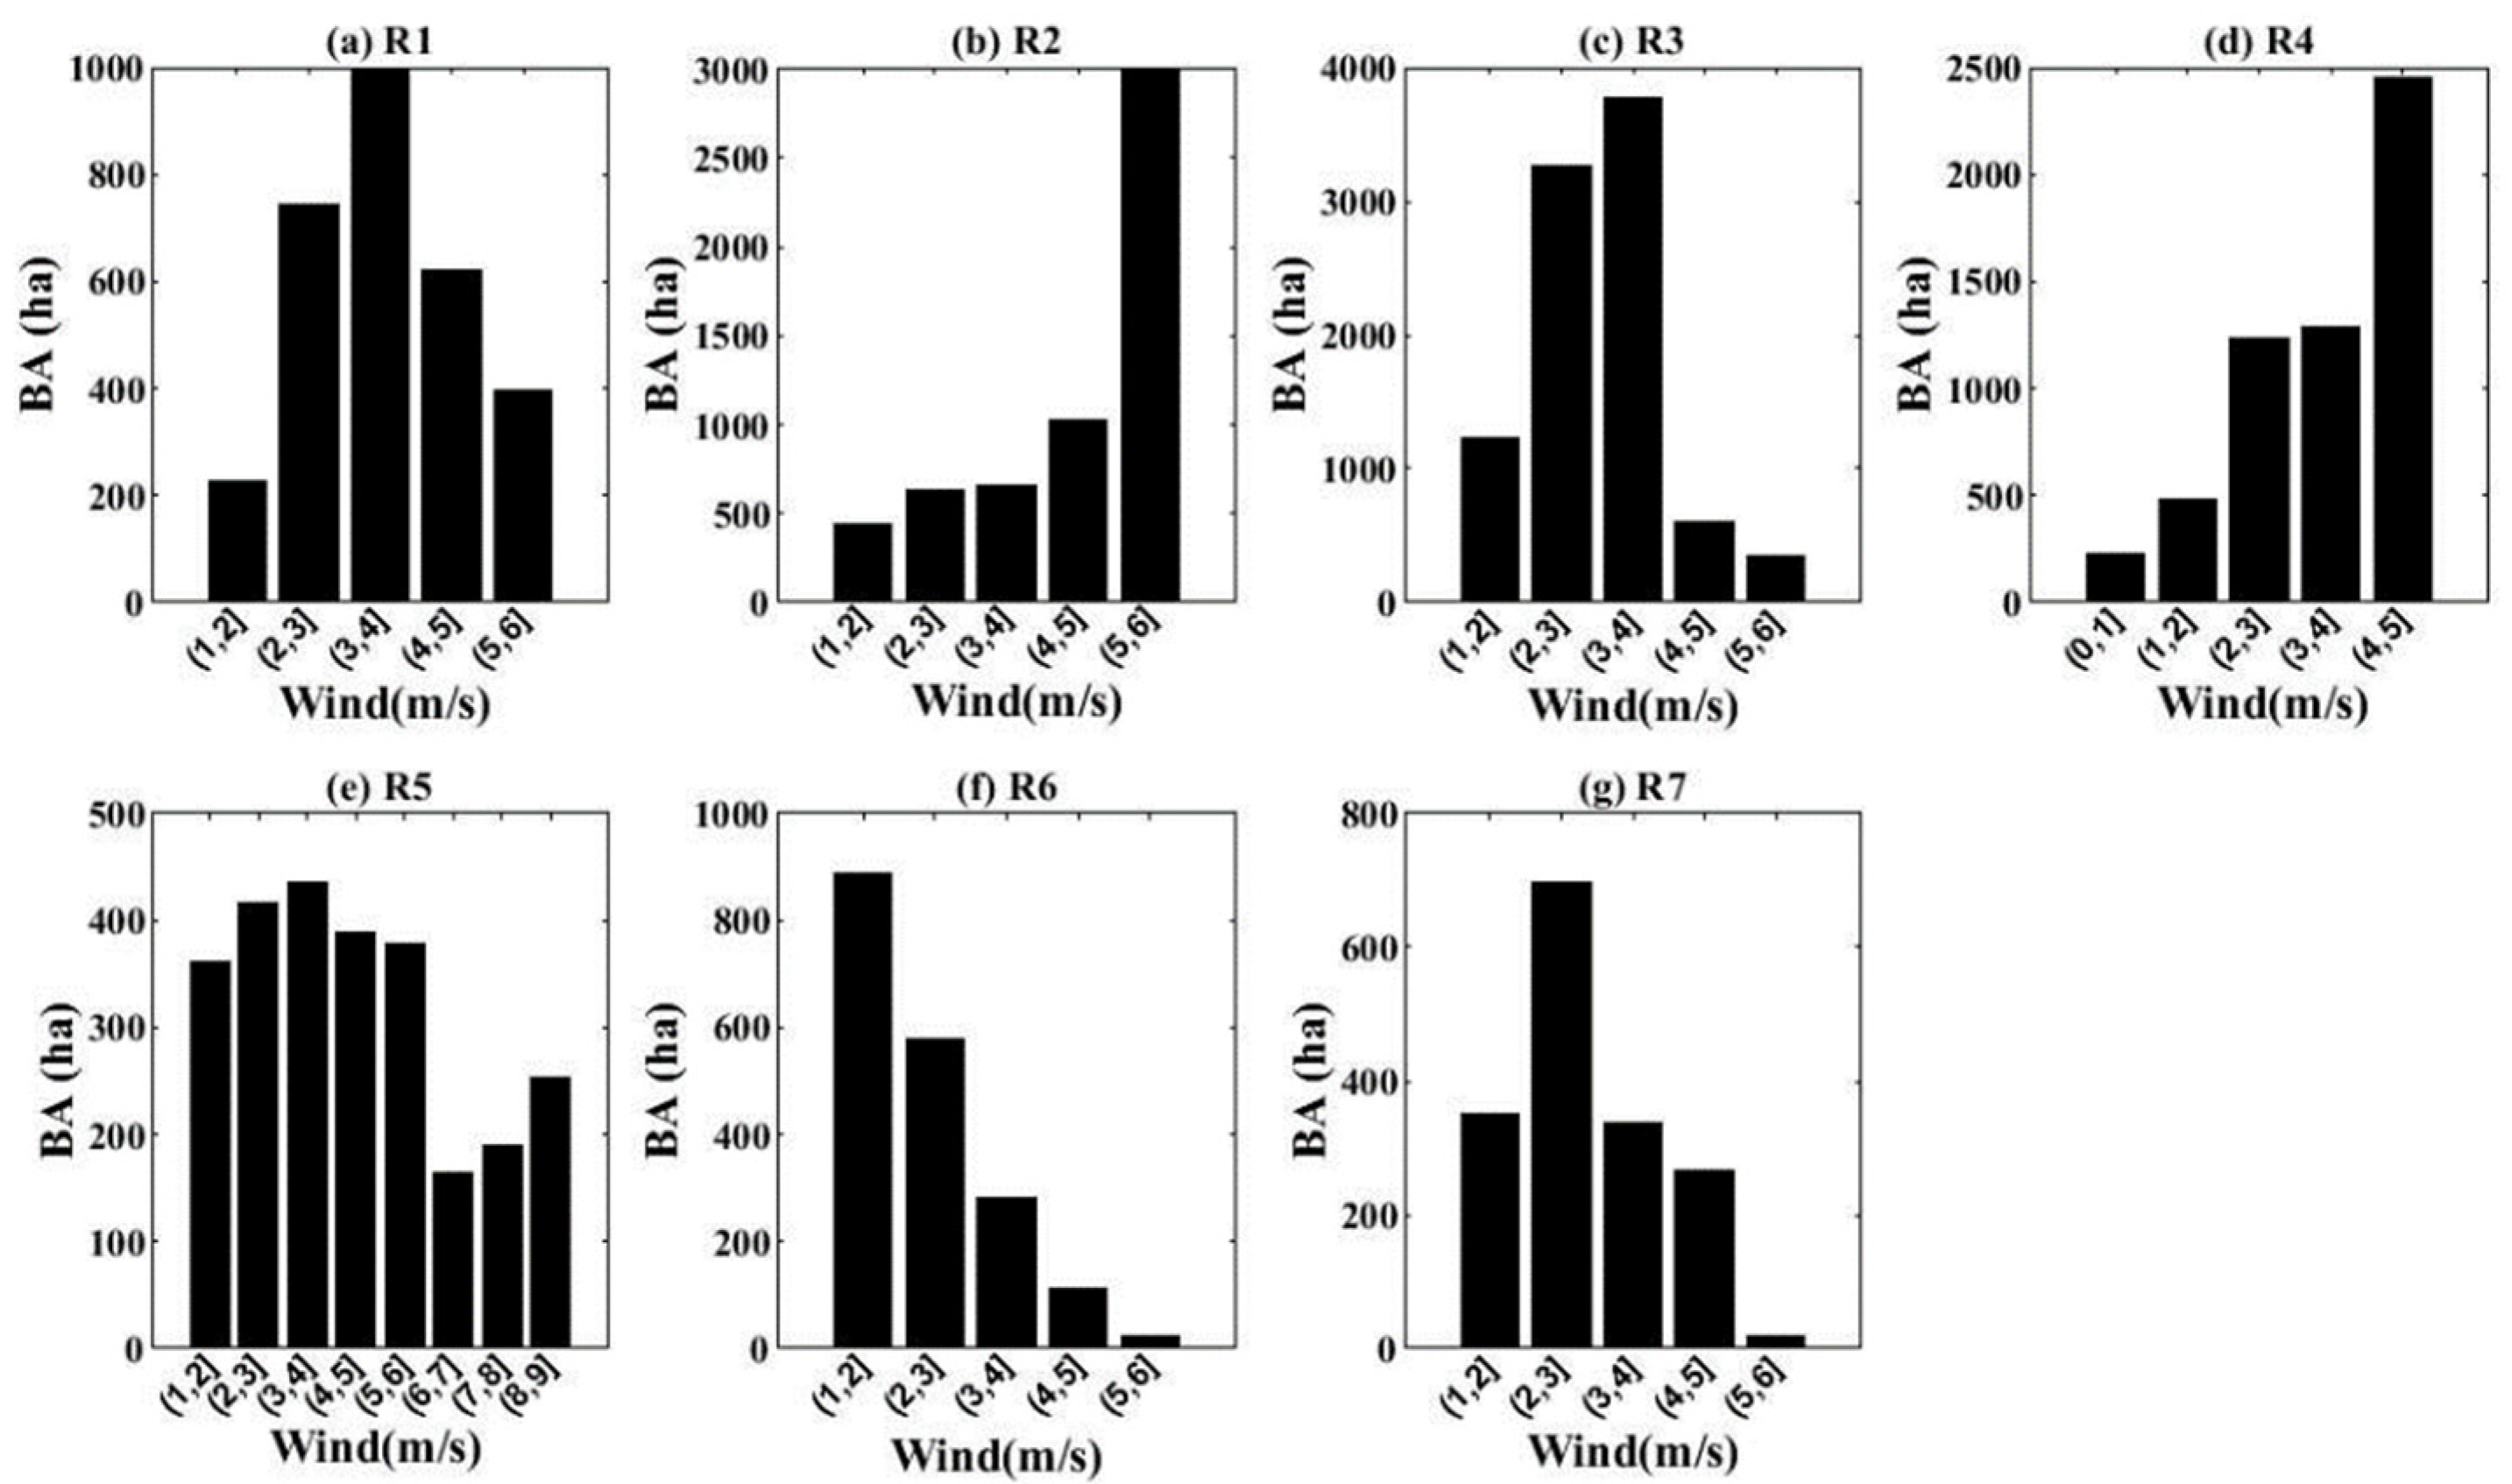
3.3. The Distribution of BA with Climatic Factors

Figure 18 shows the histogram of BA with different temperature intervals. The maximum BAs in seven subregions are divided into three categories. The first is R1, R6 and R7 with maximum BA below 5 °C. The second category is R2 and R5 with maximum BA at 5–15 °C. The third category is R3 and R4 with maximum BA at 20–30 °C. R3 and R4 are in the center of China, and this temperature range occurs in spring and autumn.
The histogram of BA with different precipitation intervals is shown in Figure 19. The maximum BA in the seven subregions is divided into two categories according to precipitation intervals. The first category of maximum BA lies in the low-precipitation interval of less than 5 mm. For instance, the maximum BA occurs in the precipitation intervals of 0–4 mm at R1 and R2 and of 0–5 mm at R6 and R7. The second is in a wider range of small to medium precipitation (e.g., 0–14 mm). For instance, the range of precipitation with high BAs in R3 is 2–10 mm. Compared with R3, R4 and R5 lie at lower latitudes and have a wider precipitation range (0–14 mm) with maximum BA.
The histogram of BA with different precipitation intervals is shown in Figure 20. There are three categories of wind speed intervals with maximum BA. The first category is the medium wind speed interval with the range of 2–4 m/s. This category of wind speed applies to R1, R3, R6 and R7. The second category is a higher wind speed interval with the range of 4–6 m/s, such as in R2 and R4. The higher the wind speed, the more the BA. The third category is a wide weak–medium wind speed as in R5 with the range of 0–6 m/s. When the wind speed of R5 is higher than 6 m/s, the BA value decreases.

4. Discussion

4.1. Comparisons with Other Relevant Studies

Despite the difference in datasets, length of time and geographic divisions, some of the common conclusions on BA characteristics obtained in this study are also supported by previous studies. For example, Chen et al. [51] have demonstrated that the annual BA is mainly distributed in Eastern China, especially in the forests of Heilongjiang Province in Northeast China, and in croplands located on the boundary of the four eastern provinces, including Henan, Shandong, Anhui and Jiangsu, using the MCD64A BA product from 2001 to 2016, which has been confirmed by our study. The climatic changes, such as maximum temperature, decreasing precipitation and strong winds, are likely to alter the fire BA in forest regions. The increase in BA is also likely related to anthropogenic factors; Yi et al. [39] have shown that the annual BA in China from 2001 to 2012 presented an overall decreasing trend, and we also extended the analysis period to 2018 and found that the decreasing trend is more significant from 2013 to 2018 than from 2001 to 2012.
The decreasing BA trends from 2001 to 2018 in China occur for two main reasons. The first reason is climate change. Since the 21st century, temperature and precipitation in China have seen decreasing and increasing trends, respectively [52]. Clearly, low temperature or rainy weather reduces the ignition of fuel, making the fire incidence rate reduced and thus BA decreases. The second reason is the fire prevention efforts of the Chinese government, such as extending the monitoring period for fire prevention and developing advanced location and alarm systems for fuel smoke and fire [53,54]. However, it is also worth noting that the BA trends of R1 and R6 in winter and spring are increasing. The severe warm-drying trend of R1 and R6 in winter and spring since the 21st century due to the monsoon’s influence [55,56] has accelerated the increase in fire occurrence and the extension of BA in these two subregions.
Ma et al. [40] have demonstrated that climate variables are dominant factors affecting forest fires, and therefore it makes sense to focus our study on the climate attribution analysis of fire BA. There are different subregional divisions between Ma et al. [40] and our study, but some climate attributions are the same. For example, they found that the temperature is the dominant factor affecting fires in most regions of China, except for North China, which is confirmed by our study. Note that North China in Ma et al. [40] basically corresponds to our R2 region (semiarid region of Inner Mongolia). They also found that fire occurrence initially increased and then stabilized at a higher value with the increase in temperature. Furthermore, when the temperature exceeded a certain threshold, there was a sharply decreasing trend. Some subregions have also shown these characteristics in our study, and they commonly distribute in the northeast region (R1), mid-south and east regions (R4) and southwest region (R5). Their threshold is basically consistent despite the different time scale of data used. Additionally, Northwest China (R6) and the Qinghai–Tibet Plateau (R7) have also similar characteristics in our study. There are two main reasons for this situation of the variability between temperature and BA: the first is the climate. Higher temperatures can increase plant evaporation and thus reduce the moisture content of fuels, leading to an increase in fire BA. If the temperature continues to increase, strong rainfall occurs and BA reduces due to the characteristics of the Chinese monsoon climate, namely with rainfall and warm temperatures during the same period; the other reason is that anthropogenic fire prevention measures are strengthened when high-temperature weather occurs.
It is widely understood that strong rainfall can reduce the ignition point of vegetation fuels, preventing the occurrence of fire and increases in BA. This situation mainly occurs in the northern subregions in spring and almost all of the subregions in summer [51]; however, there are significantly positive correlations between BA and precipitation, such as in Northwest China and the Qinghai–Tibet Plateau. The reason is that multi-year average precipitation is lower during the fire season for the two drier climate regions. It means that the change in fuel moisture caused by rainfall will be weakened obviously by the increase in surface evaporation due to drier climate characteristics. The conclusion of the positive correlation between BA and precipitation has also been demonstrated in the study of Lv et al. [37]. Furthermore, another positive precipitation correlation occurs in spring in South China (R5). The wetter regions are more prone to drought than the drier subregions; therefore, weak rainfall in spring can easily cause drought and fires.
Wind speed is almost positively correlated with BA at different subregional and seasonal scales. The significant correlations mainly occur in the winter and spring in Northeast China (R1), Inner Mongolia (R2) and North China (R3). Yi et al. [39] have confirmed these findings and explained that the three subregions experience a typical monsoon climate, with a dry climate and strong winds in spring, increasing the probability and duration of fire outbreaks. In addition, the autumn winds in Central China (R4) and South China (R5) also play an important role in BA, which is consistent with the conclusions of Ma et al. [40] and Guo et al. [57]. Stronger winds will increase the evaporation capacity and reduce the moisture content of combustibles. Hence, the wind speed has a positive correlation with BA.
Based on all significant correlation analyses, it is found that the relationship between BA and wind speed is always positive; however, inconsistent relationships exist in the other two factors. For instance, the correlations between BA and temperature in R3 are significantly negative in spring and winter, but positive in autumn; the correlation between BA and precipitation in R5 is significantly positive in spring and significantly negative in autumn. This indicates that wind speed has a more consistent correlation with BA than temperature and precipitation.
In addition, the ranges of climatic factors with maximum BA were also quantified to try to obtain the climatic threshold of BA increase. For the northeast (R1) and northwest (R6) of China, the maximum BA occurs at temperatures below 5 °C, precipitation levels of 0~5 mm and wind speeds of 2–4 m/s. This corresponds to a dry and cold climate, and outdoor, man-made fires might be the reason for fire occurrence. However, the maximum BA also appears on windy days, but not on the most windy days due to human prevention within the subregions. For temperatures of 5–15 °C, R2 (Inner Mongolia steppe) and R5 (South China) have the maximum BA. R2 is highest in the autumn when drying grass can easily causes fire with less precipitation. R5 is highest in the winter when fire is mainly caused by the less rainy weather affected by the monsoon climate. For Central China (R4), the higher the wind speed, the more the BA, indicating that the awareness of fire prevention should be strengthened.

4.2. Comparisons between Pearson Correlation and Random Forest

Pearson correlation is a traditional linear analysis method, and it can not only evaluate the positive/negative linear relationship between dependent variables and independent variables, but also demonstrate whether the correlation passes the significance level test. Only the correlations passing the significance level test are considered statistically significant and objective. The random forest method is one of the classical machine learning algorithms, and it fits the relationship between dependent variable and independent variables in a nonlinear way. The contribution ratio of each independent variable to the dependent variable is solved based on the change in variance by removing the variable from the regression model. Although they express the regression formula in a different way, they can be used to reveal the attribution relationship.
In our study, there are many consistent attribution conclusions for the methods of Pearson correlation analysis and random forest at annual scale. Temperatures in R3, R4 and R6 have the highest correlation coefficients with BA compared with the other two climatic factors. In addition, temperature in R7 is also relatively high. For random forest, the temperature is the main driving factor for all seven subregions except for R2. Obviously, four of the six subregions have a consistent temperature driving factor. Wind speed in R1, R2, R5 and R7 has the highest correlation coefficient, while only R2 has the maximum contribution ratio for random forest, and R3, R5 and R6 have also significant contributions to BA. The common driving factors for wind speed are R2 and R5. In addition, precipitation in R5 is also a common driving factor. Overall, temperature is a major driving factor in all of the subregions except for R2, where wind speed is important, and R5, where precipitation is important. The attribution conclusions are basically consistent, except for R1 and R7, with higher wind correlation and no maximum contribution.
At seasonal scale, there are still many consistent attribution conclusions for the two methods. In spring, temperature in R3, R4 and R7, precipitation in R1, R5, R6 and R7 and wind speed in R2 have consistently significant contributions to BA. Note that there are multiple driving factors for certain subregions, such as the temperature and precipitation in R7. As shown in Figure 17a, its contribution ratio of temperature is close to the maximum precipitation contribution ratio. Besides temperature, the correlation coefficient of precipitation accounts for a large proportion in the sum coefficients of the three climatic factors in R7 for Pearson correlation analysis. Therefore, the two climatic factors were considered as commonly significant contributions. A similar situation occurs in the temperature in R3 and R4. The different results indicate that wind speed in R3 and R4 has an obvious contribution to the Pearson correlation and the wind speed in R6 has the maximum contribution in the random forest. In summer, there are some common driving factors: temperature in R1, R6 and R7, precipitation in R4, R5 and R7 and wind speed in R2, R3 and R6. The different points are temperature in R2 and R5, precipitation in R3 and R6 and wind speed in R1 for Pearson correlation analysis, and temperature in R3 and wind speed in R5 for random forest. In autumn, temperature in R3, R4 and R6, precipitation in R5 and wind speed in R2 and R4 are considered common driving factors for the two methods. A difference exists in precipitation in R1, R2 and R6, and wind speed in R1, R2, R5 and R7 for Pearson analysis, and in temperature in R1 and R7 and wind speed in R6 for random forest. In winter, there are some common driving factors: temperature in R1, R4 and R6, precipitation in R5 and wind speed in R1, R2, R3, R5, R6 and R7. The different points are temperature in R3 and R7 and wind speed in R4 for Pearson correlation analysis and temperature in R2 and R5 and precipitation in R2, R3 and R4 for random forest.

4.3. Limitations and Implications of This Study

In addition to climatic factors, fire BA could also be affected by other factors, such as topographic, vegetation and socioeconomic factors. Ma et al. [40] evaluated the socioeconomic effects on forest fire occurrence besides climate factors and the results showed that the probability of forest fire occurrence decreases with increasing distance from roads, and it increases initially and then decreases with increasing population density and gross national product. It seems that socioeconomic factors could affect fire occurrence; however, no analysis was conducted for BA. In addition, it is also worth investigating whether the monthly temporal scale of the climate and fire dataset represents an excessively long time scale and obscures the nuances of how climate affects fuel availability and fire trends such as drying time lags and impulse precipitation events. Therefore, future work will consider more driving factors behind fires and produce a multi-scale fire dataset to assess their respective impacts on BA more accurately, which will help to further deepen our understanding of fire attribution.
The study provides a recent fire regime including temporal trends and spatial distribution in China and its climate attribution using around 20 years of fire BA data. There are some limitations, including the relatively short-term BA data and the few attribution factors evaluated, but the study is valuable. It provides the first systematic fire regime analysis in China of the 21st century, and it provides preliminary attribution analyses, covering factors such as wind speed, which are more significant for fire BA expansion, as well as the different climatic intervals for the different regions with maximum BA. These results will help in providing reference information for local fire management departments. For instance, the regions with much higher fire activities, such as Northeastern, Northern and Southern China, should be given higher priority when implementing fire prevention measures. Additionally, the critical climatic variables and their ranges, being prone to widespread fire occurrence, should be considered into fire prevention systems.

5. Conclusions

This study analyzed the fire BA characteristics and its attribution associated with three climatic factors (i.e., temperature, precipitation and wind speed) in China and its seven subregions using satellite remote sensing fire BA products from 2001 to 2018. The BAs in China are distributed mainly in its eastern region, and it generally shows a significant decreasing trend.
From the analyses of the multivariable regression and Pearson correlation, the results show that BA is generally negatively correlated with precipitation and positively correlated with temperature and wind speed. Besides the negative correlation with BA, precipitation has a positive correlation in some subregions, such as the arid regions of Northwest China and the Qinghai–Tibet Plateau and wetter South China in spring. Wind speed has an almost positive correlation with BA at different subregional and seasonal scales. The significantly positive correlations mainly occur in winter and spring in Northeast China (R1), Inner Mongolia (R2) and North China (R3) and in autumn in Central China (R4) and South China (R5).
The driving factors obtained by random forest and Pearson correlation are basically consistent. For example, the temperature is a dominant factor affecting BA in most regions of China, except for R2, where wind speed is more important, and R5, where precipitation is more important, which is consistent at annual and seasonal scales. In spring, temperature in R3, R4 and R7, precipitation in R1, R5, R6 (Northwest China) and R7 (Qinghai–Tibet Plateau) and wind speed in R2 have consistently significant contributions to BA. In summer, there are some common driving factors: temperature in R1, R6 and R7, precipitation in R4, R5 and R7 and wind speed in R2, R3 and R6. In autumn, temperature in R3, R4 and R6, precipitation in R5 and wind speed in R2 and R4 are considered common driving factors in the two methods. In winter, there are some common driving factors: temperature in R1, R4 and R6, precipitation in R5 and wind speed in R1, R2, R3, R5, R6 and R7. In general, besides temperature, precipitation in spring and summer is the main driving factor, such as in R1, R5, R6 and R7 in spring and in R4, R5, and R7 in summer; and wind speed in autumn and winter is the main driving factor, such as in R2 and R4 in autumn and in R2, R3, R5, R6 and R7 in winter.
In addition, the BA distributions corresponding to climatic factors in different subregions are also depicted to determine the ranges of climatic factors with maximum BA and climate thresholds that lead to an increase in BA. In summary, this study has provided an understanding of BA characteristics from 2001 to 2018 at regional and seasonal scales and analyzed its climatic attributions, helping policymakers to devise more reasonable fire prevention strategies for the different climatic regions.

Author Contributions

Conceptualization, Z.D. and X.W.; methodology, Z.D.; formal analysis, X.W.; data curation, X.W.; writing—original draft preparation, X.W.; writing—review and editing, Z.D. and M.L.; visualization, X.W.; supervision, Y.Y. All authors have read and agreed to the published version of the manuscript.

Funding

This research was funded by the National Key R&D program of China, grant number 2019YFA0606900 and the National Natural Science Foundation of China (Grant No. 41930970).

Institutional Review Board Statement

Not applicable.

Informed Consent Statement

Not applicable.

Data Availability Statement

The BA datasets used in our work can be freely accessed at http://www.esa-fire-cci.org accessed on 1 November 2018. The climate data were obtained from https://cds.climate.copernicus.eu accessed on 17 February 2019. The land cover data were obtained from https://doi.org/10.5067/MODIS/MCD12Q1.006 accessed on 1 September 2014. Additionally, if you are interested in our data and programs, please contact the corresponding author.

Acknowledgments

The authors are grateful to the anonymous reviewers for their comments and suggestions for helping to improve and clarify this manuscript. We also thank some data agencies who contributed to the BA, climate and land cover datasets used in this study.

Conflicts of Interest

The authors declare no conflict of interest. The founding sponsors neither had a role in the design of the study; the data collection process, the analyses, the interpretation of data; the writing of the manuscript, nor in the decision to publish the results.

References

  1. Leblon, B.; Alexander, M.; Chen, J.; White, S. Monitoring fire danger of northern boreal forests with NOAA-AVHRR NDVI images. Int. J. Remote Sens. 2001, 22, 2839–2846. [Google Scholar] [CrossRef]
  2. Stocks, B.J.; Fosberg, M.A.; Lynham, T.J.; Mearns, L.; Wotton, B.M.; Yang, Q.; Jin, J.; Lawrence, K.; Hartley, G.R.; Mason, J.A.; et al. Climate change and forest fire potential in Russian and Canadian boreal forests. Clim. Chang. 1998, 38, 1–13. [Google Scholar] [CrossRef]
  3. Podur, J.; Martell, D.L.; Csillag, F. Spatial patterns of lightning-caused forest fires in Ontario, 1976–1998. Ecol. Model. 2003, 164, 1–20. [Google Scholar] [CrossRef]
  4. Hamman, S.T.; Burke, I.C.; Knapp, E.E. Soil nutrients and microbial activity after early and late season prescribed burns in a Sierra Nevada mixed conifer forest. For. Ecol. Manag. 2008, 256, 367–374. [Google Scholar] [CrossRef]
  5. Ying, L.; Han, J.; Du, Y.; Shen, Z. Forest fire characteristics in China: Spatial patterns and determinants with thresholds. For. Ecol. Manag. 2018, 424, 345–354. [Google Scholar] [CrossRef]
  6. Thonicke, K.; Venevsky, S.; Sitch, S.; Cramer, W. The role of fire disturbance for global vegetation dynamics: Coupling fire into a Dynamic Global Vegetation Model. Glob. Ecol. Biogeogr. 2001, 10, 661–677. [Google Scholar] [CrossRef] [Green Version]
  7. Beaty, R.M.; Taylor, A.H. Fire history and the structure and dynamics of a mixed conifer forest landscape in the northern Sierra Nevada, Lake Tahoe Basin, California, USA. For. Ecol. Manag. 2008, 255, 707–719. [Google Scholar] [CrossRef]
  8. Frolking, S.; Palace, M.W.; Clark, D.B.; Chambers, J.Q.; Shugart, H.H.; Hurtt, G.C. Forest disturbance and recovery: A general review in the context of spaceborne remote sensing of impacts on aboveground biomass and canopy structure. J. Geophys. Res. Atmos. 2009, 114, 1–27. [Google Scholar] [CrossRef]
  9. Schimel, D.S.; Participants, V.; Braswell, B.H. Continental scale variability in ecosystem processes: Models, data, and the role of disturbance. Ecol. Monogr. 1997, 67, 251–271. [Google Scholar] [CrossRef]
  10. Bowman, D.M.J.S.; Balch, J.K.; Artaxo, P.; Bond, W.J.; Carlson, J.M.; Cochrance, M.A.; D’Antonio, C.M.; DeFries, R.S.; Doyle, J.C.; Harrison, S.P.; et al. Fire in the earth system. Science 2009, 324, 481–484. [Google Scholar] [CrossRef]
  11. Matricardi, E.A.T.; Skole, D.L.; Pedlowski, M.A.; Chomentowski, W.; Fernandes, L.C. Assessment of tropical forest degradation by selective logging and fire using landsat imagery. Remote Sens. Environ. 2010, 114, 1117–1129. [Google Scholar] [CrossRef]
  12. Li, X.; Song, W.; Lian, L.; Wei, X. Forest fire smoke detection using back-propagation neural network based on MODIS Data. Remote Sens. 2015, 7, 4473–4498. [Google Scholar] [CrossRef] [Green Version]
  13. Zhong, M.; Fan, W.; Liu, T.; Li, P. Statistical analysis on current status of China forest fire safety. Fire Saf. J. 2003, 38, 257–269. [Google Scholar] [CrossRef]
  14. Lierop, P.V.; Lindquist, E.; Sathyapala, S.; Franceschini, G. Global forest area disturbance from fire, insect pests, diseases and severe weather events. For. Ecol. Manag. 2015, 352, 78–88. [Google Scholar] [CrossRef] [Green Version]
  15. Tian, X.; Zhao, F.; Shu, L.; Wang, M. Distribution characteristics and the influence factors of forest fires in China. For. Ecol. Manag. 2013, 310, 460–467. [Google Scholar] [CrossRef]
  16. Roy, D.P.; Boschetti, L.; Justice, C.O. The collection 5 MODIS burned area product-Global evaluation by comparison with the MODIS active fire product. Remote Sens. Environ. 2008, 112, 3690–3707. [Google Scholar] [CrossRef]
  17. Giglio, L.; Loboda, T.; Roy, D.P.; Quayle, B.; Justice, C.O. An active-fire based burned area mapping algorithm for the MODIS sensor. Remote Sens. Environ. 2009, 113, 408–420. [Google Scholar] [CrossRef]
  18. Chuvieco, E.; Lizundia-Loiola, J.; Lucrecia Pettinari, M.; Ramo, R.; Padilla, M.; Tansey, K.; Mouillot, F.; Laurent, P.; Storm, T.; Heil, A.; et al. Generation and analysis of a new global burned area product based on MODIS 250 m reflectance bands and thermal anomalies. Earth Syst. Sci. Data 2018, 10, 2015–2031. [Google Scholar] [CrossRef] [Green Version]
  19. Lizundia-Loiola, J.; Otón, G.; Ramo, R.; Chuvieco, E. A spatio-temporal active-fire clustering approach for global burned area mapping at 250 m from MODIS data. Remote Sens. Environ. 2020, 236, 111493. [Google Scholar] [CrossRef]
  20. Diffenbaugh, N.S.; Scherer, M. Observational and model evidence of global emergence of permanent, unprecedented heat in the 20th and 21st centuries. Clim. Chang. 2011, 107, 615–624. [Google Scholar] [CrossRef] [Green Version]
  21. Zhang, L.; Pan, T.; Zhang, H.; Li, X.; Jiang, L. The effects of forest area changes on extreme temperature indexes between the 1900s and 2010s in Heilongjiang province, China. Remote Sens. 2017, 9, 1280. [Google Scholar] [CrossRef]
  22. Westerling, A.L.; Hidalgo, H.G.; Cayan, D.R.; Swetnam, T.W. Warming and earlier spring increase western U.S. forest wildfire activity. Science 2006, 313, 940–943. [Google Scholar] [CrossRef] [Green Version]
  23. Littell, J.S.; Mckenzie, D.; Peterson, D.L.; Westerling, A.L. Climate and wildfire area burned in western U.S. ecoprovinces, 1916–2003. Ecol. Appl. 2009, 19, 1003–1021. [Google Scholar] [CrossRef]
  24. Roads, J.; Fujioka, F.; Chen, S.; Burgan, R. Seasonal fire danger forecasts for the USA. Int. J. Wildland Fire 2005, 14, 1–18. [Google Scholar] [CrossRef]
  25. Preisler, H.K.; Westerling, A.L. Statistical model for forecasting monthly large wildfire events in western United States. J. Appl. Meteorol. Climatol. 2007, 46, 1020–1030. [Google Scholar] [CrossRef] [Green Version]
  26. Pausas, J.G. Changes in fire and climate in the eastern Iberian Peninsula (Mediterranean Basin). Clim. Chang. 2004, 63, 337–350. [Google Scholar] [CrossRef]
  27. Heyerdahl, E.K.; Mckenzie, D.; Daniels, L.D.; Hessl, A.E.; Littell, J.S.; Mantua, N.J. Climate drivers of regionally synchronous fires in the inland Northwest (1651–1900). Int. J. Wildland Fire 2008, 17, 40–49. [Google Scholar] [CrossRef] [Green Version]
  28. Lehmann, C.E.R.; Anderson, T.M.; Sankaran, M.; Higgins, S.I.; Archibald, S.; Hoffmann, W.A.; Hanan, N.P.; Williams, R.J.; Fensham, R.J.; Felfili, J.; et al. Savanna vegetation-fire-climate relationships differ among continents. Science 2014, 343, 548. [Google Scholar] [CrossRef]
  29. Chang, Y.; Zhu, Z.; Bu, R.; Chen, H.; Wang, Z. Predicting fire occurrence patterns with logistic regression in Heilongjiang Province, China. Landsc. Ecol. 2013, 28, 1989–2004. [Google Scholar] [CrossRef]
  30. Ying, L.; Shen, Z.; Yang, M.; Piao, S. Wildfire detection probability of MODIS fire products under the constraint of environmental factors: A study based on confirmed ground wildfire records. Remote Sens. 2019, 11, 3031. [Google Scholar] [CrossRef] [Green Version]
  31. Pan, J.; Wang, W.; Li, J. Building probabilistic models of fire occurrence and fire risk zoning using logistic regression in Shanxi Province, China. Nat. Hazards 2016, 81, 1879–1899. [Google Scholar] [CrossRef]
  32. Wu, Z.; He, H.; Yang, J.; Liu, Z.; Liang, Y. Relative effects of climatic and local factors on fire occurrence in boreal forest landscapes of northeastern china. Sci. Total Environ. 2014, 493, 472–480. [Google Scholar] [CrossRef] [PubMed]
  33. Guang, Y.; Di, X.; Guo, Q.; Shu, Z.; Zeng, T.; Yu, H.; Wang, C. The impact of climate change on forest fire danger rating in China’s boreal forest. J. For. Res. 2011, 22, 249–257. [Google Scholar]
  34. Liu, Z.; Yang, J.; Chang, P.; Weisberg, P.; He, H. Spatial patterns and drivers of fire occurrence and its future trend under climate change in a boreal forest of Northeast China. Glob. Chang. Biol. 2012, 18, 2041–2056. [Google Scholar] [CrossRef]
  35. Fornacca, D.; Ren, G.; Xiao, W. Performance of three MODIS fire products (MCD45A1, MCD64A1, MCD14ML), and ESA Fire_CCI in a mountainous area of northwest Yunnan, China, characterized by frequent small fires. Remote Sens. 2017, 9, 1131. [Google Scholar] [CrossRef] [Green Version]
  36. Zhang, T.; Wooster, M.J.; Jong, M.C.D.; Xu, W. How well does the ‘small fire boost’ methodology used within the gfed4.1s fire emissions database represent the timing, location and magnitude of agricultural burning? Remote Sens. 2018, 10, 823. [Google Scholar] [CrossRef] [Green Version]
  37. Lv, A. Study on the relationship among forest fire, temperature and precipitation and its spatial-temporal variability in China. Agric. Sci. Technol. 2011, 12, 1396–1400. [Google Scholar]
  38. Chang, Y.; Zhu, Z.; Bu, R.; Li, Y.; Hu, Y. Environmental controls on the characteristics of mean number of forest fires and mean forest area burned (1987–2007) in China. For. Ecol. Manag. 2015, 356, 13–21. [Google Scholar] [CrossRef]
  39. Yi, K.; Bao, Y.; Zhang, J. Spatial distribution and temporal variability of open fire in China. Int. J. Wildland Fire 2017, 26, 122–135. [Google Scholar] [CrossRef] [Green Version]
  40. Ma, W.; Feng, Z.; Cheng, Z.; Chen, S.; Wang, F. Identifying Forest Fire Driving Factors and Related Impacts in China Using Random Forest Algorithm. Forests 2020, 11, 507. [Google Scholar] [CrossRef]
  41. Chuvieco, E.; Pettinari, M.L.; Lizundia-Loiola, J.; Storm, T.; Padilla Parellada, M. ESA Fire Climate Change Initiative (Fire_cci): MODIS Fire cci Burned Area Pixel Product; Version 5.1.; Centre for Environmental Data Analysis: Didcot, UK, 2018. [Google Scholar]
  42. Hersbach, H.; Bell, B.; Berrisford, P.; Hirahara, S.; Horanyi, A.; Munoz-Sabater, J.; Nicolas, J.; Peubey, C.; Radu, R.; Schepers, D.; et al. The ERA5 global reanalysis. Q. J. R. Meteor. Soc. 2020, 146, 1999–2049. [Google Scholar] [CrossRef]
  43. Liu, Z.; Liu, Y.; Wang, S.; Yang, X.; Wang, L.; Baig, M.H.A.; Chi, W.; Wang, Z. Evaluation of spatial and temporal performances of ERA-Interim precipitation and temperature in mainland China. J. Clim. 2018, 31, 4347–4364. [Google Scholar] [CrossRef]
  44. Yu, J.; Zhou, T.; Jiang, Z.; Zou, L. Evaluation of Near-Surface Wind Speed Changes during 1979 to 2011 over China Based on Five Reanalysis Datasets. Atmosphere 2019, 10, 804. [Google Scholar] [CrossRef] [Green Version]
  45. Jiang, Q.; Li, W.; Fan, Z.; He, X.; Sun, W.; Chen, S.; Wen, J.; Gao, J.; Wang, J. Evaluation of the ERA5 reanalysis precipitation dataset over Chinese mainland. J. Hydrol. 2020. [Google Scholar] [CrossRef]
  46. Wang, Q.; Li, W.; Xiao, C.; Ai, W. Evaluation of High-Resolution Crop Model Meteorological Forcing Datasets at Regional Scale: Air Temperature and Precipitation over Major Land Areas of China. Atmosphere 2020, 11, 1011. [Google Scholar] [CrossRef]
  47. Friedl, M.A.; Sulla-Menashe, D.; Tan, B.; Schneider, A.; Ramankutty, N.; Sibley, A.; Huang, X. MODIS collection 5 global land cover: Algorithm refinements and characterization of new datasets. Remote Sens. Environ. 2010, 114, 168–182. [Google Scholar] [CrossRef]
  48. Belward, A.S.; Estes, J.E.; Kline, K.D. The IGBP-DIS global 1-km land-cover data set DIScover: A project overview. Photogramm. Eng. Remote Sens. 1999, 65, 1013–1020. [Google Scholar]
  49. Ishwaran, H.; Kogalur, U.B.; Chen, X.; Minn, A.J. Random survival forests for highdimensional data. Stat. Anal. Data Min. 2011, 4, 115–132. [Google Scholar] [CrossRef]
  50. Liang, H.; Lin, Y.; Yang, G.; Su, Z.; Wang, W.; Guo, F. Application of random forest algorithm on the forest fire prediction in Tahe area based on meteorological factors. Sci. Silvae Sin. 2016, 52, 89–98. [Google Scholar]
  51. Chen, D.; Pereira, J.M.C.; Masiero, A.; Pirotti, F. Mapping fire regimes in China using MODIS active fire and burned area data. Appl. Geogr. 2017, 85, 14–26. [Google Scholar] [CrossRef]
  52. Liu, J.; Du, H.; Wu, Z.; He, H.; Wang, L.; Zong, S. Recent and future changes in the combination of annual temperature and precipitation throughout China. Int. J. Climatol. 2017, 37, 821–833. [Google Scholar] [CrossRef]
  53. Wang, H.; Fan, W. Progress and problems of fire protection in China. Fire Saf. J. 1997, 28, 191–205. [Google Scholar] [CrossRef]
  54. Zhong, M.; Fan, W.; Liu, T.; Zhang, P.; Wei, X.; Liao, G. China: Some key technologies and the future developments of fire safety science. Saf. Sci. 2004, 42, 627–637. [Google Scholar] [CrossRef]
  55. Wang, X.; Shen, H.; Zhang, W.; Cao, J.; Qi, Y.; Chen, G.; Li, X. Spatial and temporal characteristics of drought in the northeast China Transect. Nat. Hazards 2015, 76, 601–614. [Google Scholar] [CrossRef]
  56. Huang, J.; Zhang, Y.; Wang, M.; Wang, F.; Tang, Z.; He, H. Spatial and temporal distribution characteristics of drought and its relationship with meteorological factors in Xinjiang in last 17 years. Acta Ecol. Sin. 2020, 40, 1077–1088. [Google Scholar]
  57. Guo, F.; Wang, G.; Su, Z.; Liang, H.; Liu, A. What drives forest fire in Fujian, China? Evidence from logistic regression and random forests. Int. J. Wildland Fire 2016, 25, 505–519. [Google Scholar] [CrossRef]
Figure 1. Ecological and geographical divisions and their land cover in China. The land cover data are from MODIS Land Cover Type Product (MCD12Q1, available online: https://doi.org/10.5067/MODIS/MCD12Q1.006 accessed on 1 September 2014).
Remotesensing 13 01287 g001
Figure 2. Spatial distribution of accumulated burned area (BA) at the annual scale in China.
Remotesensing 13 01287 g002
Figure 3. Spatial distribution of accumulated BA at the seasonal scale in China: (a) spring; (b) summer; (c) autumn and (d) winter.
Remotesensing 13 01287 g003
Figure 4. The trends of the annual BA in China and its seven subregions (R1–R7).
Remotesensing 13 01287 g004
Figure 5. The trends of the BA in China and R1–R7 in spring.
Remotesensing 13 01287 g005
Figure 6. The trends of the BA in China and R1–R7 in summer.
Remotesensing 13 01287 g006
Figure 7. The trends of the BA in China and R1–R7 in autumn.
Remotesensing 13 01287 g007
Figure 8. The trends of the BA in China and in R1–R7 in winter.
Remotesensing 13 01287 g008
Figure 9. Spatial distribution of annual BA trends: (a) the trends of all fire points, where a positive value (red) indicates an increasing trend and a negative value (blue) indicates a decreasing trend; (b) the trends of the points passing the significance test (p < 0.1).
Remotesensing 13 01287 g009
Figure 10. Spatial distribution of seasonal BA trends. The left columns are the trends of all points, and the right columns are the trends of the corresponding points passing the significance test (p < 0.1): (a,b) in spring; (c,d) in summer; (e,f) in autumn; (g,h) in winter.
Remotesensing 13 01287 g010
Figure 11. The coefficients of the multivariable regression equations between BA and three climatic factors (i.e., temperature, precipitation and wind speed) at annual scale. The left column shows all points, and the right column shows the corresponding significant points (p < 0.1): (a,b) represent temperature; (c,d) represent precipitation; (e,f) represent wind speed.
Remotesensing 13 01287 g011
Figure 12. The coefficients of the multivariable regression equations between BA and three climatic factors (i.e., temperature, precipitation and wind speed) in spring and summer. The first and third columns show all points in spring and summer, respectively, and the second and fourth columns show the corresponding significant points (p < 0.1) in spring and summer, respectively: (ad) represent temperature; (eh) represent precipitation; (il) represent wind.
Remotesensing 13 01287 g012
Figure 13. The coefficients of the multivariable regression equations between BA and three climatic factors (i.e., temperature, precipitation and wind speed) in autumn and winter. The first and third columns show all points in autumn and winter, respectively, and the second and fourth columns show the corresponding significant points (p < 0.1) in autumn and winter, respectively: (ad) represent temperature; (eh) represent precipitation; (il) represent wind.
Remotesensing 13 01287 g013
Figure 14. Annual correlation coefficients between BA and temperature, precipitation and wind speed in seven subregions. ** indicates passing the significance test (p < 0.05), and *** indicates p < 0.01.
Remotesensing 13 01287 g014
Figure 15. Correlation coefficients between BA and three climatic factors in seven subregions in four seasons: (a) spring; (b) summer; (c) autumn and (d) winter. * indicates passing the significance test (p < 0.1), ** indicates p < 0.05, and *** indicates p < 0.01.
Remotesensing 13 01287 g015
Figure 16. Contributions of the three climatic factors to annual BA in R1−R7. IncMSE represents the increase in mean of squared error of random forest model in testing dataset when one variable is removed.
Remotesensing 13 01287 g016
Figure 17. Contributions of the three climatic factors to seasonal BA in R1−R7: (a) spring; (b) summer; (c) autumn and (d) winter.
Remotesensing 13 01287 g017
Figure 18. The histogram of BA with different temperature intervals for (ag) representing R1–R7, respectively.
Remotesensing 13 01287 g018
Figure 19. The histogram of BA with different precipitation intervals for (ag) representing R1–R7, respectively.
Remotesensing 13 01287 g019
Figure 20. The histogram of BA with different wind speed intervals for (ag) representing R1–R7, respectively.
Remotesensing 13 01287 g020
Publisher’s Note: MDPI stays neutral with regard to jurisdictional claims in published maps and institutional affiliations.

