Communication

AgroShadow: A New Sentinel-2 Cloud Shadow Detection Tool for Precision Agriculture

1
IBE-CNR, Institute of BioEconomy-National Research Council, 50019 Sesto Fiorentino, Italy
2
Center for Space and Remote Sensing Research, National Central University, No. 300, Zhongda Rd., Zhongli District, Taoyuan City 32001, Taiwan
*
Author to whom correspondence should be addressed.
Remote Sens. 2021, 13(6), 1219; https://doi.org/10.3390/rs13061219
Submission received: 17 February 2021 / Revised: 16 March 2021 / Accepted: 18 March 2021 / Published: 23 March 2021
(This article belongs to the Special Issue Image Enhancement Techniques to Guarantee Sensors Interoperability)

Abstract

:
Remote sensing for precision agriculture has been strongly fostered by the launches of the European Space Agency Sentinel-2 optical imaging constellation, enabling both academic and private services for redirecting farmers towards a more productive and sustainable management of the agroecosystems. As well as the freely and open access policy adopted by the European Space Agency (ESA), software and tools are also available for data processing and deeper analysis. Nowadays, a bottleneck in this valuable chain is represented by the difficulty in shadow identification of Sentinel-2 data that, for precision agriculture applications, results in a tedious problem. To overcome the issue, we present a simplified tool, AgroShadow, to gain full advantage from Sentinel-2 products and solve the trade-off between omission errors of Sen2Cor (the algorithm used by the ESA) and commission errors of MAJA (the algorithm used by Centre National d’Etudes Spatiales/Deutsches Zentrum für Luft- und Raumfahrt, CNES/DLR). AgroShadow was tested and compared against Sen2Cor and MAJA in 33 Sentinel 2A-B scenes, covering the whole of 2020 and in 18 different scenarios of the whole Italian country at farming scale. AgroShadow returned the lowest error and the highest accuracy and F-score, while precision, recall, specificity, and false positive rates were always similar to the best scores which alternately were returned by Sen2Cor or MAJA.

Graphical Abstract

1. Introduction

The Sentinel-2 Multi-Spectral Imager (MSI) instruments deliver a remarkable amount of global data with high spatio–temporal resolution (10–20–60 m with a revisit time of 5 days in cloud-free conditions) and spectral sampling, essential for numerous operational applications such as land monitoring and risk assessment [1].
Nowadays agriculture is strongly influenced by technology and the availability of reliable and high-quality data can optimize production, maximizing profits [2]. In particular, agricultural systems can take advantage of information of Sentinel-2 data, detecting variations in soil properties and crop yield, and improving more sustainable cropping practices (i.e., water management, manuring and fertilizer application) [3,4,5,6]. To these purposes, however, a reliable detection and discrimination of clouds/cloud shadows is crucial, and the availability of free and open access big data has prompted to people provide end users with easy and ready to use products and tools to automate the processes of atmospheric correction and cloud/cloud shadow masking [7,8,9,10].
Many discrimination methods and approaches were developed in the past years both for low and high-resolution remote sensing images [11,12,13]. Some of them are focused on shadows casted by ground features as building or trees (especially for high resolution images) [14,15], other on topographic shadows [16,17], lastly on clouds classification [18,19,20,21]. Mostafa [12] and Shahtahmassebi et al. [22] did a review of several detection and de-shadowing methods for all the three categories. Hollstein et al. [23] made a comparison between several classification techniques based on machine learning, among which were decision trees, Random Forest and Bayesian, whereas [24] developed the Spatial Procedures for Automated Removal of Cloud and Shadow (SPARCS) using a Neural Network approach.
Cloud shadow masking can be even more challenging. Shadows, in fact, can create misleading reflectance signals, as they can be casted over surfaces of similar spectral signatures (e.g., dark soils, wetlands, or burned vegetation) [24,25,26], or by thin clouds with soft boundaries [23]. To date, most of the automatic cloud shadows classification tools are based on geometry-identification methods [26,27,28] by thresholding of a single spectral band, reflectance differences or ratio, or derived indices (e.g., Normalized Difference Vegetation Index—NDVI or snow indices).
Different services have developed tools to process Level2 products for Sentinel-2, including cloud/cloud shadow masks. Sen2Cor [29,30], provided by the European Space Agency (ESA), and MAJA [31,32], provided by Theia Data Center, are two of the most largely employed examples. The main difference among them is the single-date approach used by Sen2Cor for cloud detection and the multi-temporal approach used by MAJA. Algorithms performances of Sen2Cor and MAJA, together with Fmask [10,26], were compared by [25,33,34], revealing a quite good overall accuracy. However, the evaluations of omission/commission errors were conducted considering a complete scene or a portion of a few km.
In this paper we present a novel tool for detecting cloud shadows from Sentinel-2 imagery at farming scale: the AgroShadow tool. The implementation of this tool is explained by the need for reducing misclassifications for precision farming applications over different agroclimatic and orographic areas. Three main advantages make AgroShadow an easy-to-use tool for shadow detection: (1) the tool is only based on the threshold method, avoiding clouds’ location and solar geometry definitions; (2) the field scale requires low computational efforts; (3) the tool provides a cloud shadow mask that can be integrated into any other classifier.
The AgroShadow tool is primarily based on the modified-OPtical TRApezoid Model (OPTRAM) soil moisture index [35], based on Short Wave InfraRed (SWIR-B12) band and NDVI of Sentinel-2 MSI. To evaluate the robustness of the AgroShadow tool and to identify environments where the shadow detection is eventually critical, we compared its performance against manually classified areas, selected from Sentinel-2 scenes over different geographic areas of Italy, with different shadow conditions and covering all seasons. We also tested the accuracy of cloud shadow classifications at field scale made by Sen2Cor and MAJA tools, to verify if they can be substantially improved by the AgroShadow tool.

2. Materials and Methods

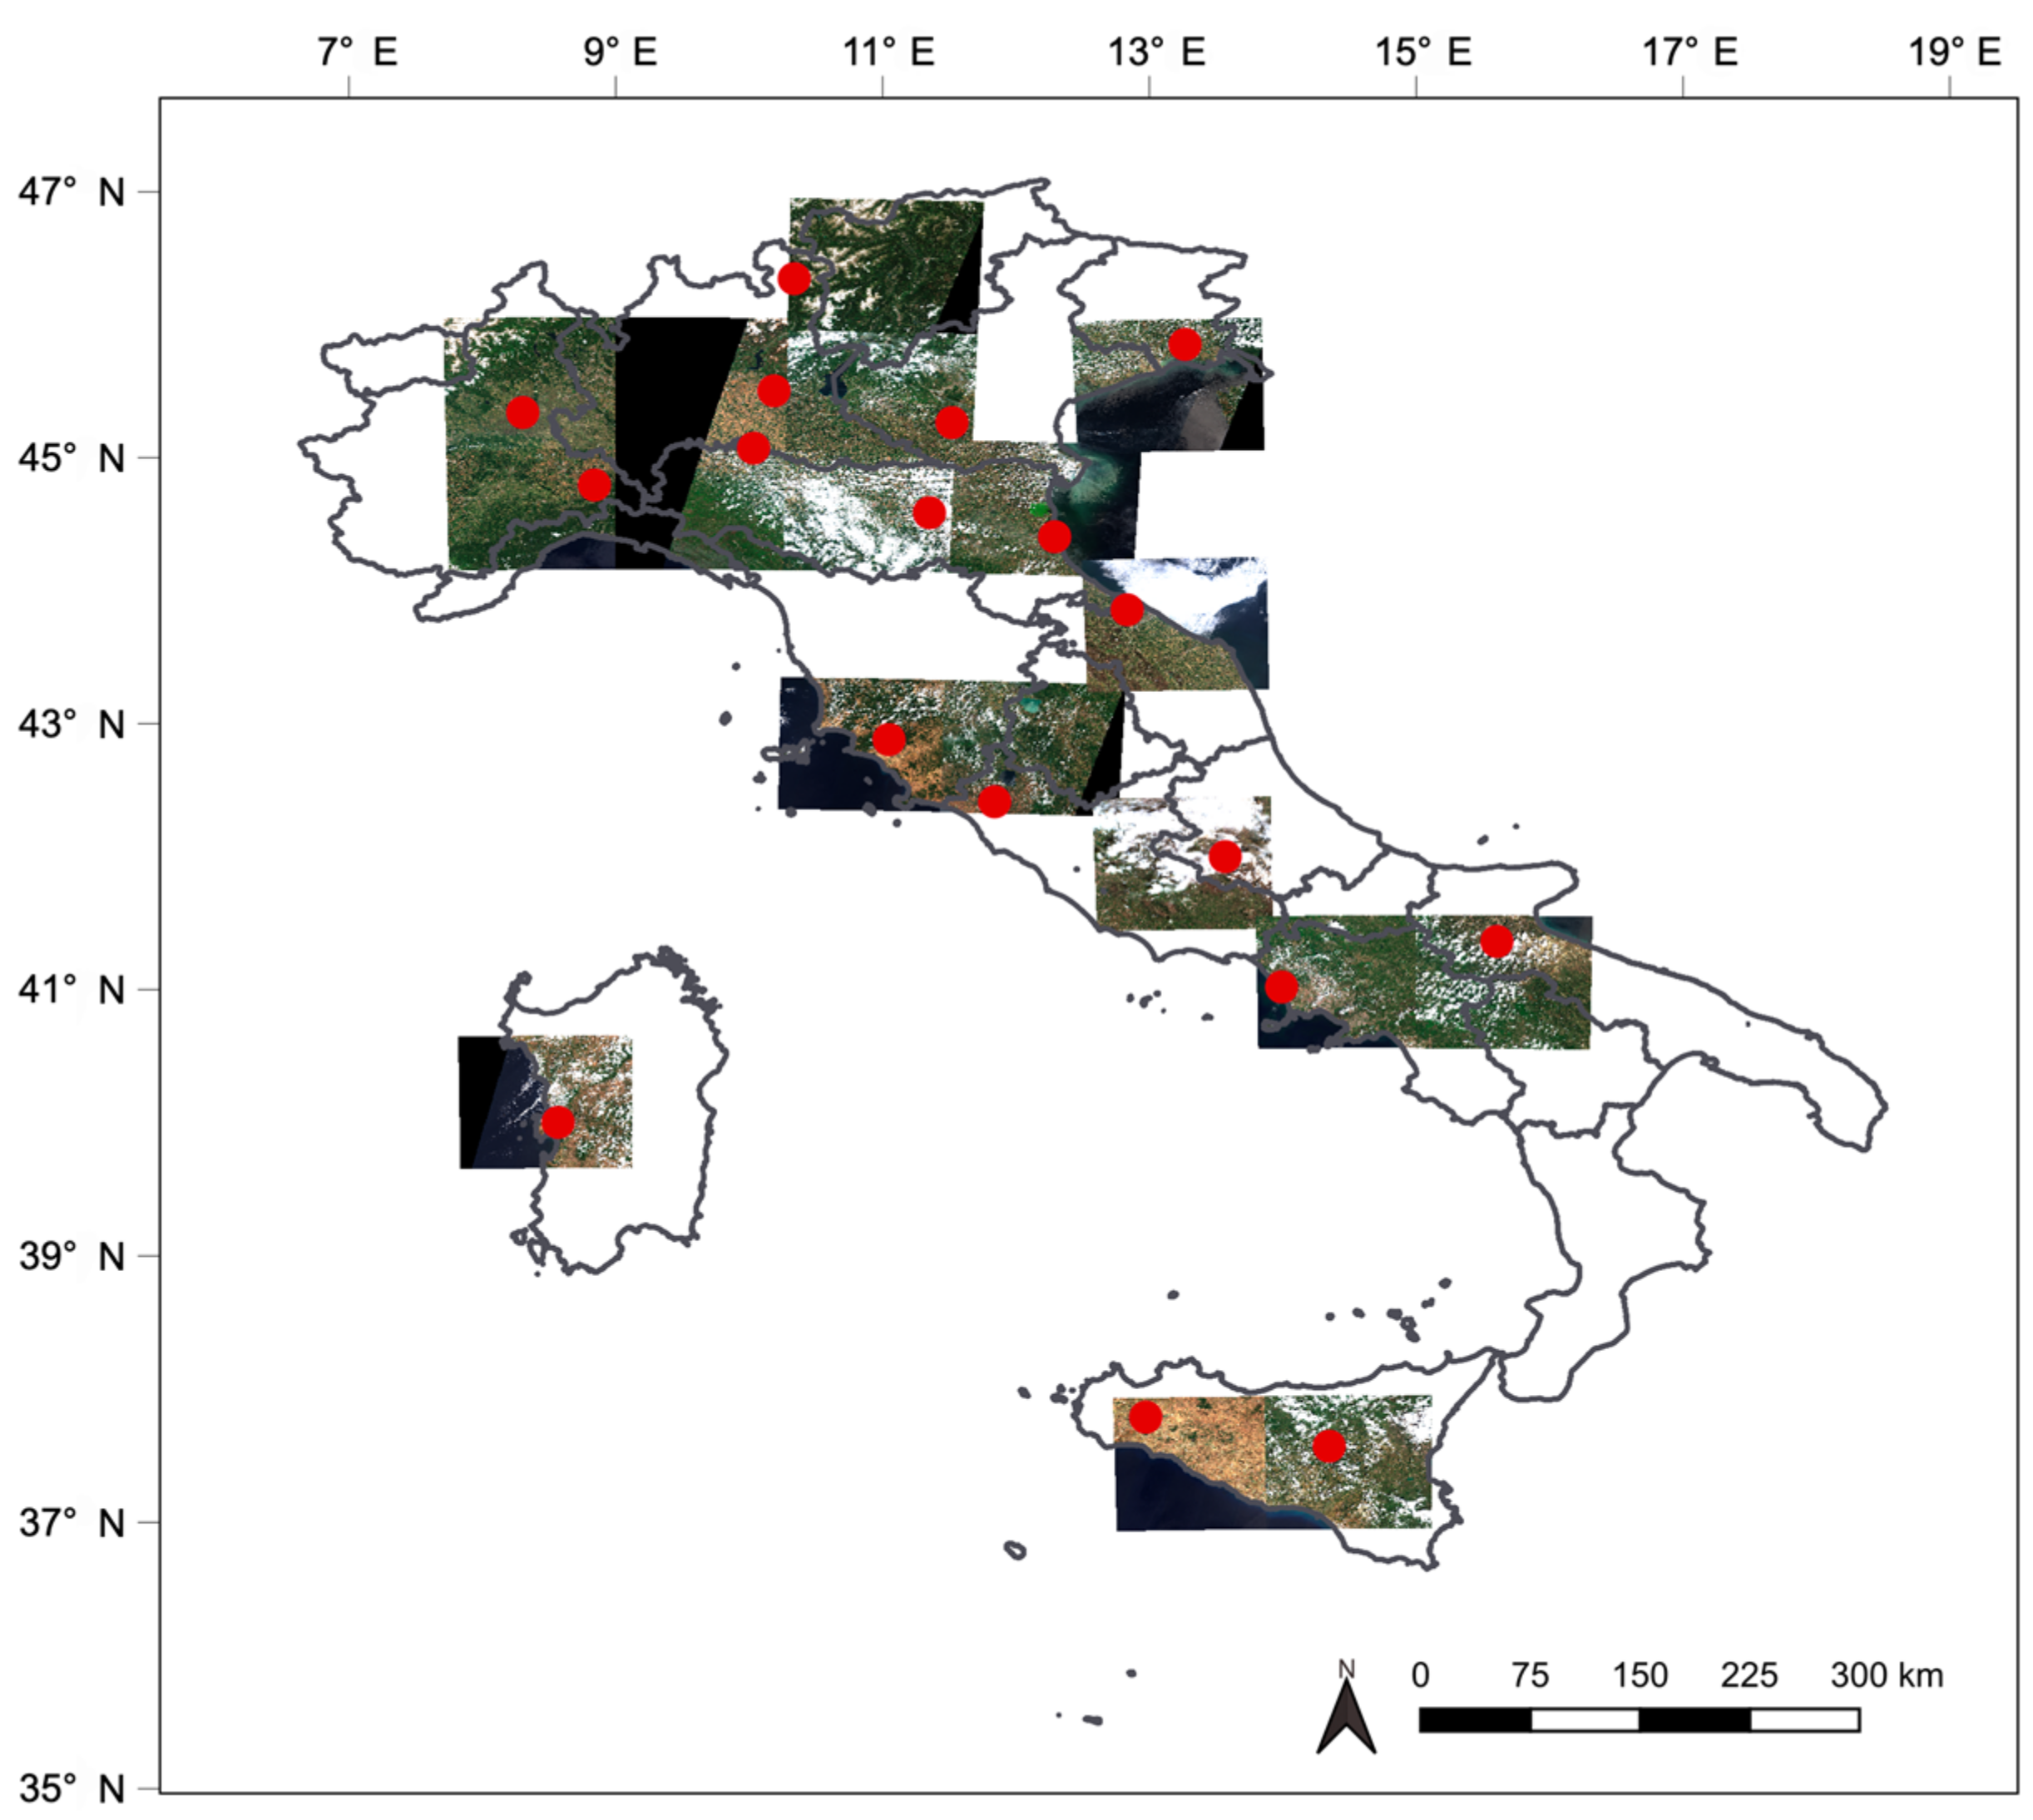
2.1. Study Area and Data Retrieval

Eighteen locations were selected across the Italian territory (Figure 1), characterized by different types of climatic conditions (from hot and dry to more humid areas) and by morphology, including plains, hills and steep slopes.
To assess the effectiveness of the cloud shadow tool for agricultural applications, we selected fields with different dimensions (among 30 and 200 ha). For each location (Table 1), from 1 to 3 satellite imageries throughout 2020 were downloaded including several types of cloud shadows (with soft/clear boundaries, related to thin clouds, low cumulus, etc.), soil moisture, crops (cereals, rice, mixed crops, etc.), vegetation growing status, irrigation practices (rainfed, irrigated, flooded) and different land covers.
Sentinel-2 imageries were downloaded both from the Copernicus Open Access Hub (https://scihub.copernicus.eu/, accessed on 24 November 2020) and the Theia–Land Data Center (https://theia.cnes.fr/, accessed on 26 November 2020).
From the Copernicus Open Access Hub we selected the following Level-2A Bottom Of Atmosphere (BOA) reflectance data and products: (i) 10m channels B4 and B8, representing, respectively, the Red and Near InfraRed surface reflectance used to calculate NDVI; (ii) 20 m channel B12 (SWIR reflectance) used, together with the NDVI, for soil moisture modeling and shadow mask; (iii) 10m True Color Image (TCI) composite, necessary to manually identify shadows samples for the selected fields (Figure 2); (iv) 10m channel B2 (blue reflectance) and 20 m channel B11 (SWIR reflectance) used for discriminating soil from water; (v) 20 m Scene CLassification (SCL) map to compare shadows identified by our tool to those of Sen2Cor.
As additional comparison, we downloaded 20 m CLoud Mask (CLM) and MG2 files from the Theia–Land Data Center.

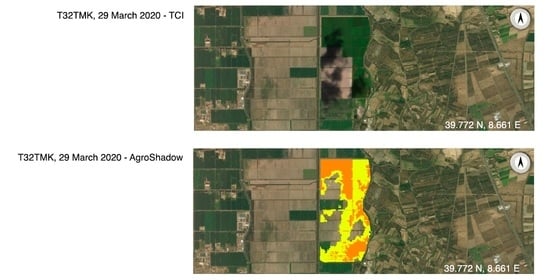
2.2. The AgroShadow Tool

The AgroShadow detection tool relies on the modified-OPTRAM model, implemented for estimating soil water content [35]:
W = i d e x p ( s d × N D V I ) S T R i d e x p ( s d × N D V I ) i w e x p ( s w × N D V I )
where W is soil moisture, STR is SWIR (band 12, Sentinel 2) Transformed Reflectance, calculated as:
S T R = ( 1 S W I R ) 2 2 × S W I R
and where id and sd, iw and sw are, respectively, the dry and wet edges parameters of exponential function of the model, depending on the STR–NDVI pixel distribution.
The processing chain, launched on fields defined on-the-fly by users, includes a series of checks based on thresholds on reflectance ratio and indices, and k-means classification algorithm, essential to avoid misclassifications.
The adopted criteria consist of:
  • a threshold of B2/B11 < 1.5, to discriminate soil from water pixels;
  • a k-means for classifying soil moisture values;
  • a classified value ≤0 is detected as cloud;
  • a classified value ≥1 is stated as possible shadow, snow or flooded condition;
  • a threshold of TCI > 200, to distinguish snow pixels from shadows and flooded condition;
  • a 5-pixel buffer neighbouring the detected area with a soil moisture threshold >0.6 is stated as flooded condition;
  • a 5-pixel buffer neighbouring the detected area with a soil moisture threshold ≤0.6 is stated as shadow.
Pixels turning out to be shadow are classified as NoData and not displayed on the map. These checks disentangle the shadows classification from their geometric relation with clouds and sun position, allowing the processing and classification of small portions of land.

2.3. Sen2Cor Classification

The SCL algorithm of the Sen2Cor tool [29,30] classifies pixels in 12 possible classes (https://dragon3.esa.int/web/sentinel/technical-guides/sentinel-2-msi/level-2a/algorithm, accessed on 10 February 2021): unclassified pixels (with cloud-low-probability), three types of clouds (cloudmedium-probability, cloudhigh-probability, thin cirrus), two types of shadows (dark area and cloud shadow), snow, vegetation, not-vegetated, water, saturated or defective pixels, no data (Table S5 of the Supplementary Materials). The algorithm consists of a threshold-filtering method applied to the Top Of Atmosphere (TOA) reflectance of Level-1C spectral bands, bands ratio, and indices. Once the clouds map is defined, the cloud shadow mask is obtained integrating the “radiometric” identification of potential cloud shadows from dark areas [36] by their spectral signatures and the “geometrically probable” cloud shadows defined by the final cloud mask, sun position and distribution of the top-cloud height. Pixels are classified as “cloud shadow” after several steps of threshold filtering.

2.4. MAJA Classification

The latest version of the MAJA tool for clouds and cloud shadows detection is based on an update of the original Multi-Temporal Cloud Detection (MTCD) method described by [32]. The MTCD method compares a reference composite image containing the most recent cloud-free pixels with the latest image in order to identify, throughout thresholds on several reflectance bands, possible cloudy pixels by an increase in reflectance in time. If the time between the reference image and the last image to be processed is too long, a mono-temporal cloud mask is also defined. A time correlation test of neighborhood pixels is also made. The comparison is not performed at full resolution to reduce computational time and avoid misclassifications. Once cloud mask is available, the same multi-temporal and thresholds concepts were used to identify the darkening of pixels by cloud shadows. The procedure generates a “geometric” and a “radiometric” cloud shadow mask, the latter especially used to identify shadows casted by clouds outside the image. The final clouds/cloud shadows classification mask (CLM), released by the Theia–Land Data Center with 10–20 m resolutions, defines classes by a set of binary bits (https://labo.obs-mip.fr/multitemp/sentinel-2/theias-sentinel-2-l2a-product-format/, accessed on 10 February 2021): all clouds except the thinnest and all shadows; all clouds (except the thinnest); clouds detected via mono-temporal thresholds; clouds detected via multi-temporal thresholds; thinnest clouds; cloud shadows cast by a detected cloud; cloud shadows cast by a cloud outside image; high clouds detected by 1.38 µm (Table S3 of the Supplementary Materials). The Theia–Land Data Center also distributes a “geophysical mask” (MG2) where the two shadow classes of CLM are grouped in a single class and a topographic shadows class is included (Table S4 of the Supplementary Materials).

3. Results and Discussion

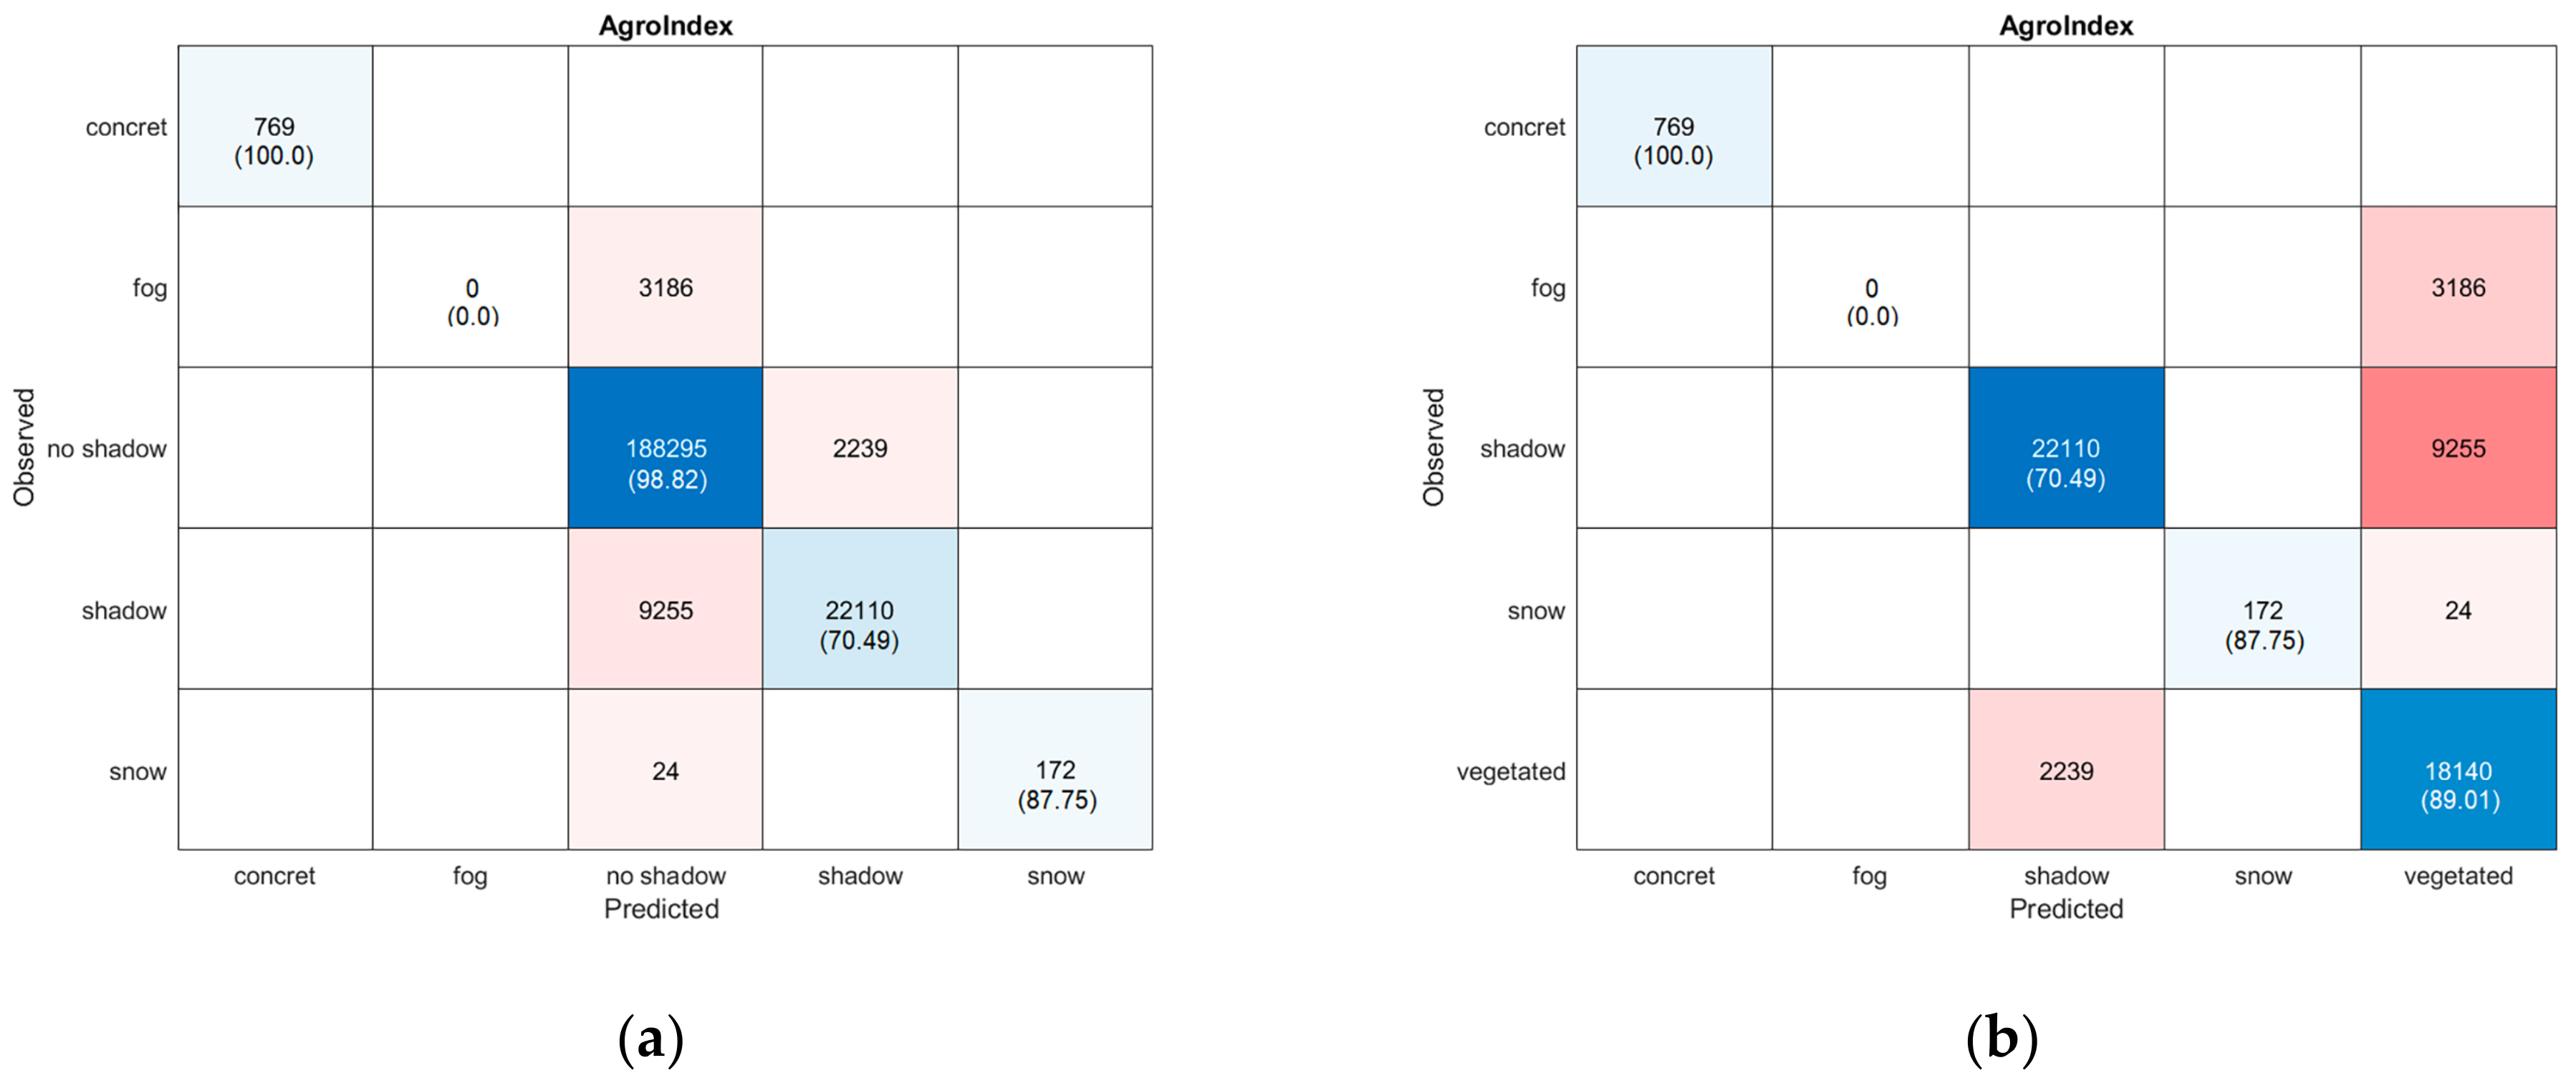
3.1. AgroShadow Tool Validation

Validation of the AgroShadow tool consists of comparing shadow-masked areas identified by our tool with reference shadow polygons visually recognized on TCI band composition, both for each area and date.
The performance of the shadow mask methodology is evaluated throughout confusion matrices. A first check (Figure 2a) is made for the shadow/no shadow classifier, additionally considering the pixels of other classes that can induce misclassifications due to fog or used as test-sites for bright land covers (i.e., concrete and snow).
The rate of classification for each class concerning the other classes shows very good values (Table 2). The true positive rate of the no shadow correctly predicted pixels has a recall of 98.82%, with most misclassifications occurring between no shadow and shadow classes and for crop fields coated by light fog (false positives), which is not recognized (see Avezzano (FOG)—T33TUG field, on 5 April 2020 in the Supplementary Materials, p. 13). The shadow predicted pixels have a true positive rate recall of 70.49%, with omission errors (false negative) referred to the no shadow class slightly higher than the commission errors (false positive).
In Figure 2b the multiclass confusion matrix includes particular conditions over vegetated areas, i.e., flooded rice fields and foggy alluvial plains. In this case, also, the true positive rate is good, with a recall of 89.01% for vegetated pixels. Misclassification between shadow and vegetated classes has an omission error higher than the commission error. The false positive rate for incorrectly classified pixels in the shadow class is due to the particular soil condition. In fact, the field is a rice paddy with a rotation flooding system. Before the seeding, when the bare soil of a parcel is flooded turning its color from light to dark brown, this creates a sharp contrast with the nearer parcels that is wrongly confused with a shadow (see Vercelli—T32TMR field, on 14 April 2020 in the Supplementary Materials, p. 20).

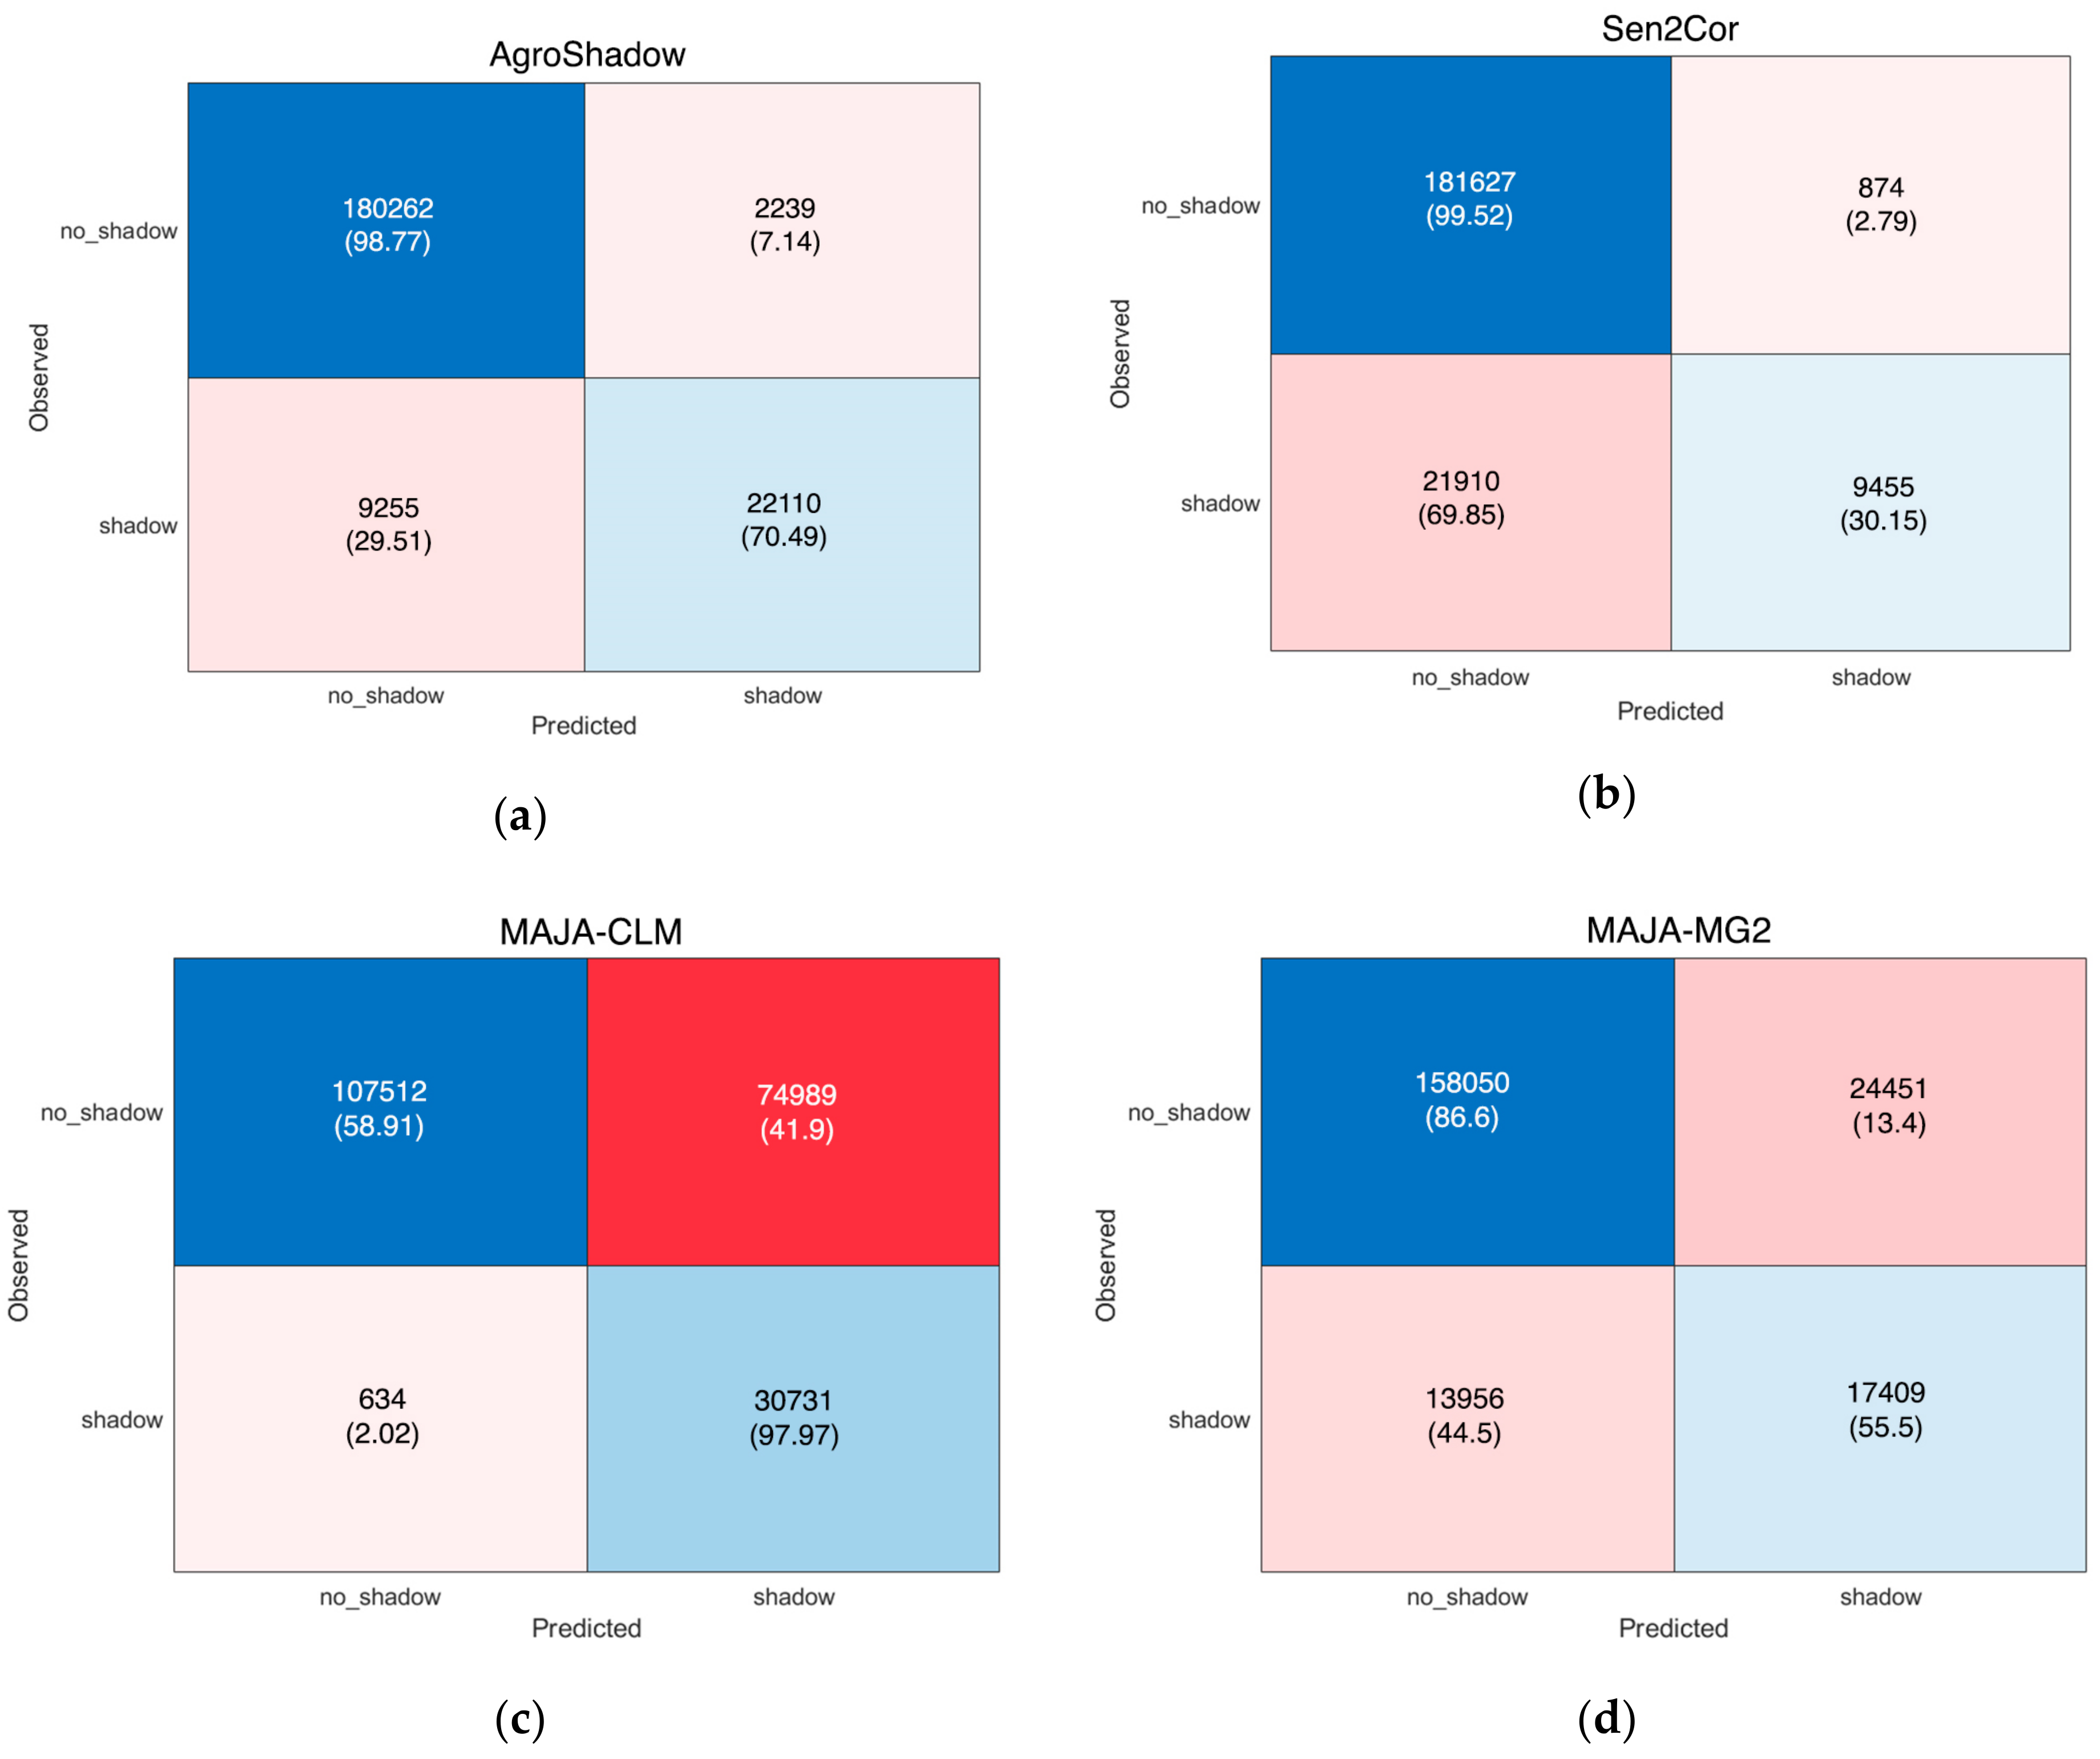
3.2. Comparison with Sen2Cor and MAJA Tools

The comparison between the performances of AgroShadow, Sen2Cor and MAJA shadow masking methods is made through binary shadow/no shadow confusion matrices (Figure 3). Compared to the other tools, regarding on the whole shadow and no shadow classes, the AgroShadow rate of classification is extremely good, even if the true positive rate of shadow class of MAJA-CLM and no shadow class of Sen2Cor have higher recalls. Additionally, analyzing the overall commission/omission errors, the AgroShadow tool generally shows lower values than the other tools (Figure 3).
In particular, even though MAJA-CLM is able to detect almost all shadow pixels, with a recall of 97.97%, its false positives (red box of Figure 3c) are clearly higher than AgroShadow misclassifications (upper-right pink box of Figure 3a), especially for particular soil conditions, such as flooded rice fields and alluvial plains (Supplementary Materials, Table S2). This high commission error is due to the lower resolution of the classification process [30] and a misinterpretation of areas with a sharp reflectance decrease due to a sudden or strong modification in soil moisture or crop management. On the contrary, Sen2Cor (darker pink box of Figure 3b) misses more shadow pixels (lower-left pink box of Figure 3a), most of them wrongly classified as vegetation, dark area (representing topographic shadows) or unclassified (Supplementary Materials, Table S1). Finally, MAJA-MG2 is the tool with an overall quite high shadow misclassification (Figure 3d).
Metrics of shadow classifiers (Table 3) confirm the validity of the AgroShadow tool for applications at farming scale, strongly reducing the loss of information, which is essential for precision farming practices. The precision, recall, specificity, and false positive rates are very good, with values quite similar to the best scores; the error has the lower value, and accuracy and F score are the highest. Even the number of completely missed classifications is contained, as for MAJA-CLM. Additional results are reported in Tables S1 and S2 of the Supplementary Materials. Table S1 compares false negative (missing shadows) classifications of the three tools based on nine Sen2Cor classes, whereas Table S2 is focused on the correct/incorrect classification of four scenes related to particular conditions: fog, snow, concrete and a rice-alluvial plain.
To visually explain differences among the three classification tools, in the Supplementary Materials we provide some TCI reference images, and the corresponding fields classified by the AgroShadow, Sen2Cor and MAJA tools.
As recently highlighted by [25,33], our findings confirm a poor performance of Sen2Cor in identifying cloudy/shadowed observations, with a high rate of underestimations and the highest number of missed scenes (i.e., 11 wrongly identified as clear scenes, Table 3). Likewise, our analysis shows that the multi-temporal cloud mask enables MAJA to perform better than Sen2Cor, but with high commission errors (shadow overestimation). Considering the aim of our study for precision agriculture applications, the risk is including images erroneously classified as no shadow/clear sky (Sen2Cor) or skipping many containing usable information (MAJA). AgroShadow has the added value of reducing both the high omission errors that characterize Sen2Cor and the high commission errors of MAJA, in a sort of reduction in the weaknesses of the two state-of-the-art tools, while preserving and improving their strengths. This result also prevents the computational effort required by the implementation of multiple algorithms in a sort of ensemble tool, as suggested by [33] for cloud detection, by [37,38] for different remote sensing applications, or by [39] that integrate spectral, temporal and spatial information in a three-step cloud/shadow detection. In addition, the AgroShadow tool classifies shadows without clouds’ location, only being based on the threshold method, thus avoiding propagation errors due to cloud misclassification. It should be noted that we chose to evaluate the algorithms in areas that show a high interest in terms of agricultural activity without any limitation or preference in terms of disagreement between the three tools and "visual truth". Furthermore, the pool of selected study areas includes combinations of different land use, simple or more complex orography and proximity to rivers or the sea, clear sky, any kind of clouds and shadows (shape and dimensions) which make this comparison as complete as possible for correct use and replicability over a broad range of scenarios.
This study contains only a limitation with regard to the modified-OPTRAM soil moisture index. Indeed, this model may require calibration for areas with climatic and morphologic conditions that differ from those used for its implementation (i.e., Mediterranean environment, flat-hills and plateau areas, rainfed and irrigated crops) [35].

4. Conclusions

Current methods for the classification of cloud shadow rely on geometry-identification methods by thresholding of the single spectral band, reflectance differences or ratios, or derived indices with a single or multiple-date approach and have shown obvious deficiencies in terms of shadow identification, especially at finer scales.
To eliminate such deficiencies, this paper introduces a new tool—AgroShadow—based on two thresholds (B2/B11 and RGB), a model for soil moisture retrieval and its classification capable of handling and identifying any kind of shadows dimension, orientation and shape. Comprehensive tests demonstrate the full capacity of the proposed tool in dealing with different types of scenarios, such as land use, orography, soil and crop conditions with a substantial benefit in Precision Agriculture applications. The results of approximately 0.8 in terms of F-score and error of 0.054 indicate the superior capability to classify shadows of the AgroShadow tool, while the precision, recall, specificity, and false positive rates are always similar to the best scores obtained with Sen2Cor and MAJA.
AgroShadow is a simplified tool able to create ready-to-use Sentinel-2 data and can be easily integrated in any image processing chain, thus facilitating interoperability.
However, the proposed method is strictly linked to the OPTRAM model for the soil moisture estimations: it is essential to achieve a correct OPTRAM calibration to avoid shadow misclassification. Furthermore, our tool may fail over bare soil flooded areas surrounded by dry bare soils.
Our planned future work will consist of overcoming this issue and testing AgroShadow in environments with climate and soil conditions different from Mediterranean ones.

Supplementary Materials

Sen2Cor and MAJA tools are available online at https://www.mdpi.com/2072-4292/13/6/1219/s1. Additional information concerning comparison among AgroShadow, Sen2Cor and MAJA tools and examples of TCI reference images and shadow classifications achieved by AgroShadow.

Author Contributions

Conceptualization, P.T. and R.M.; methodology, P.T. and R.M.; software, L.R.; validation, A.M., S.F.D.G., C.-F.C., N.-T.S.; formal analysis, P.T. and R.M.; data curation, R.D., P.T., L.R.; writing—original draft preparation, R.M., P.T.; writing—review and editing, R.M., P.T., R.D., L.R., A.M., S.F.D.G., C.-F.C., N.-T.S.; supervision, P.T., C.-F.C. All authors have read and agreed to the published version of the manuscript.

Funding

This research was funded by MoST (Taiwan Ministry of Science and Technology)—CNR (National Research Council, Italy)—Joint Programs, Dec. 2019 0088273/2019, 9 December 2019.

Data Availability Statement

Data is contained within the article or Supplementary Materials (https://www.mdpi.com/2072-4292/13/6/1219/s1).

Conflicts of Interest

The authors declare no conflict of interest. The funders had no role in the design of the study; in the collection, analyses, or interpretation of data; in the writing of the manuscript, or in the decision to publish the results.

References

  1. Coluzzi, R.; Imbrenda, V.; Lanfredi, M.; Simoniello, T. A first assessment of the Sentinel-2 Level 1-C cloud mask product to support informed surface analyses. Remote Sens. Environ. 2018, 217, 426–443. [Google Scholar] [CrossRef]
  2. Saiz-Rubio, V.; Rovira-Más, F. From smart farming towards agriculture 5.0: A review on crop data management. Agronomy 2020, 10, 207. [Google Scholar] [CrossRef] [Green Version]
  3. Castaldi, F.; Hueni, A.; Chabrillat, S.; Ward, K.; Buttafuoco, G.; Bomans, B.; Vreis, K.; Brell, M.; van Wesemael, B. Evaluating the capability of the Sentinel 2 data for soil organic carbon prediction in croplands. ISPRS J. Photogramm. Remote Sens. 2019, 147, 267–282. [Google Scholar] [CrossRef]
  4. Toscano, P.; Castrignanò, A.; Di Gennaro, S.F.; Vonella, A.V.; Ventrella, D.; Matese, A. A precision agriculture approach for durum wheat yield assessment using remote sensing data and yield mapping. Agronomy 2019, 9, 437. [Google Scholar] [CrossRef] [Green Version]
  5. Segarra, J.; Buchaillot, M.L.; Araus, J.L.; Kefauver, S.C. Remote sensing for precision agriculture: Sentinel-2 improved features and applications. Agronomy 2020, 10, 641. [Google Scholar] [CrossRef]
  6. Tewes, A.; Montzka, C.; Nolte, M.; Krauss, G.; Hoffmann, H.; Gaiser, T. Assimilation of sentinel-2 estimated LAI into a crop model: Influence of timing and frequency of acquisitions on simulation of water stress and biomass production of winter wheat. Agronomy 2020, 10, 1813. [Google Scholar] [CrossRef]
  7. Mueller-Wilm, U.; Devignot, O.; Pessiot, L. S2 MPC—Sen2Cor Configuration and User Manual; ESA Report, Ref. S2-PDGS-MPC-L2A-SUM-V2.8 Issue 2. 2019. Available online: http://step.esa.int/thirdparties/sen2cor/2.8.0/docs/S2-PDGS-MPC-L2A-SUM-V2.8.pdf (accessed on 24 November 2020).
  8. Hagolle, O. MAJA Processor for Cloud Detection and Atmospheric Correction Tool. Available online: https://logiciels.cnes.fr/en/node/58?type=desc (accessed on 26 November 2020).
  9. Google Earth Engine. Sentinel-2 Cloud Masking with s2cloudless. Available online: https://developers.google.com/earth-engine/tutorials/community/sentinel-2-s2cloudless (accessed on 13 January 2021).
  10. Qiu, S.; Zhu, Z.; He, B. Fmask 4.2 Handbook. 2020. Available online: https://drive.google.com/drive/folders/1bVwvlGDFOsWnVj5b3MqI5yqRDoi8g935 (accessed on 13 January 2021).
  11. Aboutalebi, M.; Torres-Rua, A.F.; Kustas, W.P.; Nieto, H.; Coopmans, C.; McKee, M. Assessment of different methods for shadow detection in high-resolution optical imagery and evaluation of shadow impact on calculation of NDVI, and evapotranspiration. Irrig. Sci. 2019, 37, 407–429. [Google Scholar] [CrossRef]
  12. Mostafa, Y. A review on various shadow detection and compensation techniques in remote sensing images. Can. J. Remote Sens. 2017, 43, 545–562. [Google Scholar] [CrossRef]
  13. Tarko, A.; De Bruin, S.; Bregt, A.K. Comparison of manual and automated shadow detection on satellite imagery for agricultural land delineation. Int. J. Appl. Earth Obs. Geoinf. 2018, 73, 493–502. [Google Scholar] [CrossRef]
  14. Tatar, N.; Saadatseresht, M.; Arefi, H.; Hadavand, A. A robust object-based shadow detection method for cloud-free high resolution satellite images over urban areas and water bodies. Adv. Space Res. 2018, 61, 2787–2800. [Google Scholar] [CrossRef]
  15. Wang, Q.; Yan, L.; Yuan, Q.; Ma, Z. An automatic shadow detection method for VHR remote sensing orthoimagery. Remote Sens. 2017, 9, 469. [Google Scholar] [CrossRef] [Green Version]
  16. França, M.M.; Fernandes Filho, E.I.; Ferreira, W.P.; Lani, J.L.; Soares, V.P. Topographyc shadow influence on optical image acquired by satellite in the southern hemisphere. Eng. Agrícola 2018, 38, 728–740. [Google Scholar] [CrossRef]
  17. Wójcik-Długoborska, K.A.; Bialik, R.J. The influence of shadow effects on the spectral characteristics of glacial meltwater. Remote Sens. 2021, 13, 36. [Google Scholar] [CrossRef]
  18. Frantz, D.; Haß, E.; Uhi, A.; Stoffels, J.; Hill, J. Improvement of the Fmask algorithm for Sentinel-2 images: Separating clouds from bright surfaces based on parallax effects. Remote Sens. Environ. 2018, 215, 471–481. [Google Scholar] [CrossRef]
  19. Sun, L.; Mi, X.; Wei, J.; Wang, J.; Tian, X.; Yu, H.; Gan, P. A cloud detection algorithm-generating method for remote sensing data at visible to short-wave infrared wavelengths. ISPRS J. Photogramm. Remote Sens. 2017, 124, 70–88. [Google Scholar] [CrossRef]
  20. Irish, R.R.; Barker, J.L.; Goward, S.N.; Arvidson, T. Characterization of the Landsat-7 ETM+ automated cloud-cover assessment (ACCA) algorithm. Photogramm. Eng. Remote Sens. 2006, 72, 1179–1188. [Google Scholar] [CrossRef]
  21. Amin, R.; Gould, R.; Hou, W.; Arnone, R.; Lee, Z. Optical algorithm for cloud shadow detection over water. IEEE Trans. Geosci. Remote Sens. 2012, 51, 732–741. [Google Scholar] [CrossRef]
  22. Shahtahmassebi, A.; Yang, N.; Wang, K.; Moore, N.; Shen, Z. Review of shadow detection and de-shadowing methods in remote sensing. Chin. Geogr. Sci. 2013, 23, 403–420. [Google Scholar] [CrossRef] [Green Version]
  23. Hollstein, A.; Segl, K.; Guanter, L.; Brell, M.; Enesco, M. Ready-to-use methods for the detection of clouds, cirrus, snow, shadow, water and clear sky pixels in Sentinel-2 MSI images. Remote Sens. 2016, 8, 666. [Google Scholar] [CrossRef] [Green Version]
  24. Hughes, M.J.; Hayes, D.J. Automated detection of cloud and cloud shadow in single-date Landsat imagery using neural networks and spatial post-processing. Remote Sens. 2014, 6, 4907–4926. [Google Scholar] [CrossRef] [Green Version]
  25. Baetens, L.; Desjardins, C.; Hagolle, O. Validation of copernicus Sentinel-2 cloud masks obtained from MAJA, Sen2Cor, and FMask processors using reference cloud masks generated with a supervised active learning procedure. Remote Sens. 2019, 11, 433. [Google Scholar] [CrossRef] [Green Version]
  26. Zhu, Z.; Woodcock, C.E. Object-based cloud and cloud shadow detection in Landsat imagery. Remote Sens. Environ. 2012, 118, 83–94. [Google Scholar] [CrossRef]
  27. Zhong, B.; Chen, W.; Wu, S.; Hu, L.; Luo, X.; Liu, Q. A cloud detection method based on relationship between objects of cloud and cloud-shadow for Chinese moderate to high resolution satellite imagery. IEEE J. Sel. Top. Appl. Earth Obs. Remote Sens. 2017, 10, 4898–4908. [Google Scholar] [CrossRef]
  28. Le Hegarat-Mascle, S.; Andre, C. Use of Markov Random Fields for automatic cloud/shadow detection on high resolution optical images. ISPRS J. Photogramm. Remote Sens. 2009, 64, 351–366. [Google Scholar] [CrossRef]
  29. Main-Knorn, M.; Pflug, B.; Louis, J.; Debaecker, V.; Müller-Wilm, U.; Gascon, F. Sen2Cor for sentinel-2. In Proceedings of the International Society for Optics and Photonics, Warsaw, Poland, 11–14 September 2017; Volume 10427, p. 1042704. [Google Scholar] [CrossRef] [Green Version]
  30. Richter, R.; Louis, J.; Müller-Wilm, U. Sentinel-2 MSI—Level 2A Products Algorithm Theoretical Basis Document; ESA Report S2PAD-ATBD-0001; Telespazio VEGA Deutschland GmbH: Darmstadt, Germany, 2012. [Google Scholar]
  31. Hagolle, O.; Huc, M.; Desjardins, C.; Auer, S.; Richter, R. MAJA ATBD—Algorithm Theoretical Basis Document; CNES-DLR Report MAJA-TN-WP2-030 V1.0 2017/Dec/07; Zenodo: Meyrin, Switzerland, 2017. [Google Scholar] [CrossRef]
  32. Hagolle, O.; Huc, M.; Pascual, D.V.; Dedieu, G. A multi-temporal method for cloud detection, applied to FORMOSAT-2, VENμS, LANDSAT and SENTINEL-2 images. Remote Sens. Environ. 2010, 114, 1747–1755. [Google Scholar] [CrossRef] [Green Version]
  33. Tarrio, K.; Tang, X.; Masek, J.G.; Claverie, M.; Ju, J.; Qiu, S.; Zhu, Z.; Woodcock, C.E. Comparison of cloud detection algorithms for Sentinel-2 imagery. Sci. Remote Sens. 2020, 2, 100010. [Google Scholar] [CrossRef]
  34. Zekoll, V.; Main-Knorn, M.; Louis, J.; Frantz, D.; Richter, R.; Pflug, B. Comparison of masking algorithms for sentinel-2 imagery. Remote Sens. 2021, 13, 137. [Google Scholar] [CrossRef]
  35. Ambrosone, M.; Matese, A.; Di Gennaro, S.F.; Gioli, B.; Tudoroiu, M.; Genesio, L.; Miglietta, M.; Baronti, S.; Maienza, A.; Ungaro, F.; et al. Retrieving soil moisture in rainfed and irrigated fields using Sentinel-2 observations and a modified OPTRAM approach. Int. J. Appl. Earth Obs. Geoinf. 2020, 89, 102113. [Google Scholar] [CrossRef]
  36. Kohonen, T. Self-organized formation of topologically correct feature maps. Biol. Cybern. 1982, 43, 59–69. [Google Scholar] [CrossRef]
  37. Engler, R.; Waser, L.T.; Zimmermann, N.E.; Schaub, M.; Berdos, S.; Ginzler, C.; Psomas, A. Combining ensemble modeling and remote sensing for mapping individual tree species at high spatial resolution. For. Ecol. Manag. 2013, 310, 64–73. [Google Scholar] [CrossRef]
  38. Healey, S.P.; Cohen, W.B.; Yang, Z.; Kenneth Brewer, C.; Brooks, E.B.; Gorelick, N.; Hernandez, A.J.; Huang, C.; Joseph Hughes, M.; Kennedy, R.E.; et al. Mapping forest change using stacked generalization: An ensemble approach. Remote Sens. Environ. 2018, 204, 717–728. [Google Scholar] [CrossRef]
  39. Jin, S.; Homer, C.; Yang, L.; Xian, G.; Fry, J.; Danielson, P.; Townsend, P.A. Automated cloud and shadow detection and filling using two-date Landsat imagery in the USA. Int. J. Remote Sens. 2013, 34, 1540–1560. [Google Scholar] [CrossRef]
Figure 1. Study areas location (red dots) with samples of Sentinel2 scenes.
Remotesensing 13 01219 g001
Figure 2. AgroShadow classification rates. Numbers without brackets represent the pixels for each class; numbers in brackets are the recall, in percentages. (a) The confusion matrix considers all the pixels, including areas to test bright land covers (i.e., snow and concrete) and fields covered by light fog; (b) the matrix analyzes particular soil conditions, i.e., flooded rice fields and foggy alluvial plains where AgroShadow makes more misclassifications. Colors refer to the probability of true (blue)/false (red) prediction normalized by the total number of observations.
Remotesensing 13 01219 g002
Figure 3. Confusion matrices of shadow/no shadow binary classification for AgroShadow, Sen2Cor and MAJA tools, excluding snow and concrete test areas and foggy fields. Numbers without brackets represent the pixels for each class; numbers in brackets are the recall, in percentages. (a) Confusion matrix of AgroShadow classification; (b) confusion matrix of Sen2Cor classification; (c) confusion matrix of MAJA-CLM classification; (d) confusion matrix of MAJA-MG2 classification. Colors refer to the probability of true (blue)/false (red) prediction normalized by the total number of observations.
Remotesensing 13 01219 g003
Table 1. Main characteristics of the study areas and the number of scenes selected for each field. Land use classification is based on the European Space Agency-Climate Change Initiative (ESA-CCI) Land Cover definition (MNV = Mosaic Natural Vegetation; CI = Cropland Irrigated; MC = Mosaic Cropland; CR = Cropland Rainfed; CBA = Consolidated bare areas). Height AMSL = Height Above Mean Sea Level; DOY = Day-Of-Year; * for cloud scenes.
Study AreasLatLonLand UseFields InfoHeight
AMSL
AreaN. of ScenesTilesDOY
(m)(ha)
Sondrio46.3410.33MNVSnow/Mountain15905.461T32TPS77
Palmanova45.8513.26CIIrrigated area/Plain7198.491T33TUL164 *
Brescia45.510.18CIClose to urban area/Plain11338.072T32TNR124 *, 184 *
Vercelli45.348.3CIRice/Flooding/Plain150127.323T32TMR105, 165, 247 *
Vicenza45.2611.52CIAlluvial plain12133.992T32TPR164 *, 299 *
Piacenza45.0710.03CIClose to the river/Plain35120.522T32TNQ124 *, 189 *
Alessandria44.798.84CIClose to river/Plain/Test clear sky17861.361T32TMQ187
Bologna44.5811.35CIClose to urban area/Plain2432.732T32TPQ194 *, 219 *
Ravenna44.4112.29CIClose to river and sea0111.182T32TQQ164 *, 254 *
Pesaro43.8612.83MCClose to industrial area/steep slope49–14029.882T33TUJ121 *,206 *
Grosseto42.8811.05CRDry land/surrounded by hills11101.962T32TPN239 *, 274 *
Tuscania42.4111.84CRSmooth hill16733.533T32TQN164 *, 291 *, 296 *
Avezzano4213.57MCLarge endorheic lake/Plateau651113.941T33TUG96 *
Foggia41.3615.6CRDry land/Plain8879.111T33TWF128 *
Caserta41.0213.99CRPlain080.541T33TVF118 *
Oristano408.57CRClose to river/wet area/Plain039.433T32TMK169 *, 247 *, 282 *
Cretto di Burri37.7912.97CBALand art/Slope/ Concrete4177.841T33SUB208
Enna37.5714.35CRHilly/Slope43524.363T33SVB118 *, 158 *, 218 *
Table 2. AgroShadow classification metrics for shadow/no shadow, fog, snow and concrete classes.
ClassesErrorAccuracyPrecisionRecallSpecificityFalse Positive RateF Score
Shadow0.0510.9490.9080.7050.9880.0120.794
Snow0.0001.0001.0000.8781.0000.0000.935
Concrete0.0001.0001.0001.0001.0000.0001.000
Fog0.0140.9860.0000.0001.0000.0000.000
No Shadow0.0650.9350.9380.9880.6490.3510.962
Table 3. Comparison between classification metrics of AgroShadow, Sen2Cor and MAJA shadow classes for all the scenes (bold numbers indicate the best metrics, underlined numbers are values quite near to the best metrics). CLM = clouds/cloud shadows classification mask; MG2 = geophysical mask.
ToolsErrorAccuracyPrecisionRecallSpecificityFalse Positive RateF ScoreN° of Missed Scenes
AgroShadow0.0540.9460.9080.7050.9880.0120.7943
Sen2Cor0.1070.8930.9150.3010.9950.0050.45411
MAJA-CLM0.3540.6460.2910.9800.5890.4110.4483
MAJA-MG20.1800.8200.4160.5550.8660.1340.47512
Publisher’s Note: MDPI stays neutral with regard to jurisdictional claims in published maps and institutional affiliations.

