Abstract
The fusion of the hyperspectral image (HSI) and the light detecting and ranging (LiDAR) data has a wide range of applications. This paper proposes a novel feature fusion method for urban area classification, namely the relative total variation structure analysis (RTVSA), to combine various features derived from HSI and LiDAR data. In the feature extraction stage, a variety of high-performance methods including the extended multi-attribute profile, Gabor filter, and local binary pattern are used to extract the features of the input data. The relative total variation is then applied to remove useless texture information of the processed data. Finally, nonparametric weighted feature extraction is adopted to reduce the dimensions. Random forest and convolutional neural networks are utilized to evaluate the fusion images. Experiments conducted on two urban Houston University datasets (including Houston 2012 and the training portion of Houston 2017) demonstrate that the proposed method can extract the structural correlation from heterogeneous data, withstand a noise well, and improve the land cover classification accuracy.
1. Introduction
Recently, the advancement of remote sensing technologies has resulted in an improvement in the availability of multi-sensor data in the same region and a deeper understanding of the research area [1,2]. Specifically, the hyperspectral image (HSI) has hundreds of spectral bands for each pixel. A detailed overview of the spectral features of the ground cover can be given by the rich spectral details preserved in HSI [3]. However, HSI may not be able to reliably identify objects with the same spectral properties [4]. Moreover, the light detecting and ranging (LiDAR) data could provide height information that is complementary to spectral details [1,5]. Objects of the same elevation but made from different materials cannot be separated using only LiDAR elevation information [6]. Therefore, the fusion of the high spectral resolution of HSI and the structural information given by LiDAR will provide more complete and enhanced surface properties for a broader range of applications, such as forest monitoring [7,8,9], biomass estimation [10], and geological analysis [11]. In order to allow the best use of the information given by different sensors, several feature extraction techniques are recommended. Typical feature extraction methods include unsupervised techniques such as principal component analysis (PCA) [12], independent component analysis [13], and the maximum noise fraction [14] and supervised methods such as linear discriminative analysis [15]. However, these methods process each pixel separately and are only optimized for extracting spectral features, without taking into account spatial context information [16,17,18]. Moreover, it has been proven that image fusion has the benefit of combining spectral features and spatial information, because the spatial regularity of remote sensing image surface materials is typically very uniform in a limited region [19,20]. Different techniques for feature extraction are commonly adopted to make full use of the spectral and spatial information given by both HSI and LiDAR data. For example, the attribute profile (AP) [21], which focuses on high-level spatial features, has attracted a great deal of interest. It can retain the geometric features of the input image while removing unimportant details [22,23]. The extended multi-attribute profile (EMAP) [24], which is then proposed to create spectral-spatial features through a set of attribute profiles, has been successfully implemented in the fusion of HSI and LiDAR data [25,26]. What is more, Gabor features can express the spatial structure of various sizes and directions in the image [27,28]. Lin et al. enhanced the discriminative low-rank Gabor filter to fully explore the capacity of extracting useful information from the spectral and spatial domains [29]. The local binary pattern (LBP) [30], which belongs to invariant and gray-scale texture operators of rotation, is proposed for texture extraction. Unlike the features extraction methods described above, the LBP concentrates on texture details (including global contrast information and texture depth) [31]. Furthermore, other advanced tools such as composite kernel methods [32], low-rank representation [20], and edge-preserving filtering [16] are utilized to make use of spectral and spatial information. However, the automatic feature fusion of multiple types of data is not straightforward [6]. To combine the heterogeneous features, several feature fusion methods have been developed. These methods can be roughly divided into five categories: feature-based stack structure, multiple kernels learning, sparse representation, graph-based method, and deep learning.
- Feature-based stack structure: The method of stacking features to create a spectral-spatial cube is relatively simple [33,34]. However, the stacked feature vector assigned to each pixel has a high dimensionality, which contributes to the curse of dimensionality and a limited number of available training samples [35].
- Multiple kernels learning : Integrating multi-source data based on multiple kernels is effective [5]. For example, Camps-Valls et al. suggested a general kernel method-based architecture that allows multi-sensor images to be combined with contextual information [36]. However, it is a challenging job to build an acceptable kernel and to pick its parameters [37].
- Sparse representation: Some fusion strategies combine heterogeneous features by dictionary creation and sparse coefficient solutions based on sparse representation [38,39]. These are non-parametric approaches that do not require any data distribution or mathematical estimation assumptions. Dian et al. formulated the fusion problem as the calculation of the spectral basis and coefficients by taking advantage of the non-local spatial self-similarities, prior knowledge of the spectral unmixing, and a sparse prior [40]. Nevertheless, how to solve the problem of optimization in sparse representation is a tough task [35].
- Graph-based method: The discriminant graph-based method merges heterogeneous features by mining the manifold structure of these features [3,41]. Liao et al. proposed a general graph-based fusion approach to combine dimension reduction and the spectral details with morphological profiles (MPs) and apply the method to the HSI and LiDAR fusion [1].
- Deep learning: Deep learning approaches such as convolutional neural networks (CNNs) can derive layer-by-layer joint spectral-spatial features [12,42,43,44]. In extracting non-linear and hidden features, these approaches have great promise. However, deep learning networks have hyper-parameters and are thus vulnerable to the over-fitting problem [35].
Total variation (TV) [45] is an efficient regularization technology for image processing and has been commonly used in remote sensing applications such as pansharpening [46], image denoising [47], and feature extraction [48]. In image fusion, the TV method based on feature extraction has high performance. For example, Kumar et al. used a semi-norm method based on TV to fuse the pixels of the input images [49]. Ma et al. emulated the fusion as an optimization problem and merged gradient transfer and TV minimization for infrared and visible image fusion [50]. However, there are relatively few studies on TV-based image feature fusion, especially for HSI and LiDAR data fusion. In this paper, a TV-based feature fusion method is proposed for the merging of HSI and LiDAR city datasets. In the feature extraction stage, a variety of high-performance methods including EMAP, Gabor, and LBP are used to extract the features of the input data. Then, the relative TV structure analysis (RTVSA) is adopted to combine various features derived from HSI and LiDAR data. The proposed method is utilized on two publicly accessible urban Houston University datasets (including Houston 2012 and the training portion of Houston 2017). Two classification methods, random forest and convolutional neural network, are applied to the dataset for land cover classification. The main contributions of this paper are as follows:
- (1)
- First, this paper proposes a novel algorithm for the fusion of HSI and LiDAR data based on RTV and nonparametric weighted feature extraction. The proposed method RTVSA can effectively improve the classification accuracy of the HSI and LiDAR fusion data, extract the structural association from heterogeneous data, and have noise adaptability.
- (2)
- The spatial features used in the HSI and LiDAR fusion are studied in this paper. It is proven that the LBP and EMAP features can achieve high classification accuracy.
The remainder of this paper is structured as follows. Section 2 describes the related work. Section 3 introduces in depth the feature fusion approach proposed in this paper and some feature extraction methods. Section 4 presents the dataset used in this paper Section 5 shows the experiment results. The discussion is presented in Section 6. Finally, the concluding remarks are given in Section 7.
2. Related Works
To evaluate the quality of the fusion images, two classification methods, including random forest (RF) and the convolutional neural network (CNN), are used to classify the image before and after the fusion.
2.1. Random Forest
Random forest (RF) is a standard method of ensemble learning, with the outstanding output of classification and high processing speed, and it can prevent over-fitting effectively [51,52,53,54,55,56,57]. RF is a mixture of tree predictors. Each tree depends on the value of a random vector sampled independently and has the same distribution for all trees in the forest [58]. The generalization error of the tree classifier forest depends on the intensity and the similarity of each tree in the forest. They vote for the most popular class after creating a large number of trees.
2.2. Convolutional Neural Network
The convolutional neural network (CNN) is one of the most commonly used visual data processing methods based on deep learning. Recent studies showed that 3D-CNN achieves satisfactory results for HSI classification. In this paper, the hybrid spectral CNN (HybridSN) [59] is used for classification. Let the input data cube be represented as . The input data cube is divided into small overlapping 3D neighboring patches . The true value label is determined by the label of the central pixel , covering the window or spatial range and all D spectral bands. By combining the 3D kernel with 3D data, 3D convolution is accomplished. The 3D kernel is used to create feature maps of the convolution layer on several continuous bands in the input layer. Spectral details will be captured here. In 3D convolution, in the j-th feature map of the i-th layer, the activation value of the spatial location is:
where is the activation function, is the bias parameter for the j-th feature map of the i-th layer, represents the number of feature maps in the -th layer, and are the values of the weight parameter of the j-th feature map of the i-th layer in the -th dimension. The parameters of CNN are determined by using a supervised method for training with the aid of gradient descent optimization technology.
3. Methods
In this section, the TV-based method is proposed to fuse the HSI and LiDAR data. The approach consists of two parts, feature extraction and feature fusion. Three high-performance methods are used in the feature extraction, including the LBP, EMAP, and Gabor. The relative total variation structure analysis method is suggested in feature fusion. Using random forest and convolutional neural networks, the processed data are classified respectively. The flowchart is shown in Figure 1.
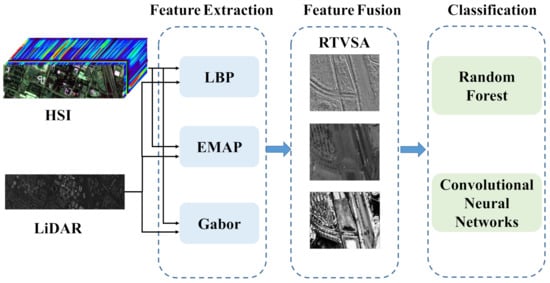
Figure 1.
The flowchart of the algorithm design. LBP, local binary pattern; EMAP, extended multi-attribute profile; RTVSA, relative total variation structure analysis.
3.1. Feature Extraction
3.1.1. Local Binary Pattern
The local binary pattern (LBP) [30] is a simple, yet effective texture descriptor that can analyze each pixel and its region to summarize the local structure in the image. It has the characteristics of gray-scale invariance and rotation invariance. For each band of the input image, the texture U in the local neighborhood is defined as the joint gray-level distribution of image pixels. The gray value of the image consists of the gray value of the local neighborhood’s middle pixel, and () is the gray value of P equidistant pixels on a circle forming a circularly symmetrical neighbor set with a radius of Q (). If the coordinates of are , then the coordinates of can be expressed as . The LBP is calculated by thresholding the neighbors to create a P-bit binary code as:
3.1.2. Extended Multi-Attribute Profile
The extended multi-attribute profile (EMAP) relies on the application of the attribute profile (AP) to the data. The AP is a multi-level decomposition of image attribute filters [24]. Considering the different attributes, APs extract various information from the image, such as area, range, length of the diagonal of the bounding box, and entropy. The size of the structuring element (SE) also affects the degree of processing of the input image. The AP has duality, deleting from the image the darker portion and processing the input image via the closed reconstruction at the same time. The opening and closing reconstructions of the image are respectively given by:
where and are the erosion and dilation of the SE size i, respectively. and achieve reconstruction through dilation and erosion, respectively. Different from the morphological profile (MP), the AP can steadily simplify the picture as the filter value increases, since it has a cumulative function. In order to ensure that the added standards of the attribute filter are verified, the family of criteria must be considered, making . Therefore, the AP can be regarded as the concatenation of a thickened AP, , and a sparse AP, :
where is a set of ordered criteria. The process of EMAP is as follows. First, principal component analysis is used for the input image. AP is calculated on the extracted n principal components (PCs). An extended attribute profile (), composed of n different APs, can be formulated as:
The is a combination of different EAPs.
where () is the generic attribute.
3.1.3. Gabor Filter
Gabor filters have been commonly used in hyperspectral image classification, among which 3D-Gabor filters are efficient and superior in extracting spectral-spatial characteristics [60]. In this paper, to extract the features of input images, the discriminative low-rank Gabor filtering proposed in [29] is adopted. The method used decomposes the standard 3D Gabor filter into several sub-filters, referring to various combinations of single-rank low-pass and band-pass filters. It can maintain the features of the image appropriate for discrimination purposes, relative to the conventional Gabor filter. For the input image with a size of , calculate the Gaussian rank one envelope first.
where is the standard deviation. Then, find the cosine harmonic and sine harmonic of rank one, respectively.
The required sub-filter consists of a Gaussian function and a corresponding harmonic function.
Finally, the 3D Gabor filter of image can be obtained by:
3.2. Relative Total Variation Structure Analysis
The proposed feature fusion method, relative total variation structure analysis (RTVSA), includes two parts, which are RTV-based fusion and feature dimension reduction. The relative total variation (RTV) [61] model can capture meaningful structural data and delete redundant texture data in the image. Furthermore, the approach is general, i.e., it is sufficient for the decomposition of anisotropic texture. The RTV model does not presuppose the form of texture to exclude the uncertain texture, but implements a novel mapping of window intrinsic variance. For the combined HSI and LiDAR image s after feature extraction, the RTV model can be expressed as:
where j is the index of all pixels in a square region centered on point i and is a weighting function specified according to spatial affinity.
In [61], the authors transformed the original nonlinear problem into a set of sub-problems that were easier to solve. As nonlinear problems can be translated into solving a sequence of linear equations, the RTV is broken down into nonlinear terms and quadratic terms. To solve Equation (14), the penalty in the x direction is extended as:
It is possible to work with the y-direction term similarly. Reconstruct the quadratic term and the nonlinear component at the same time. They can be articulated as:
where is the Gaussian kernel function with standard deviation and * is the convolution symbol. Then, Equation (14) can be transformed into the following matrix form:
where and represent the column vectors of s and I, respectively. and are the Toeplitz matrices of the forward difference gradient operators. ,, , and are all diagonal matrices, and the values on their diagonals are: , , , and . Derivation of the above matrix can get the following linear equation.
where is the identity matrix and is the weight matrix computed on the vector . The data processed by the RTV still retain a large number of features and may be redundant. Many studies have shown that nonparametric weighted feature extraction (NWFE) is a powerful tool for extracting features of remote sensing images. The main idea of NWFE is to assign different weights to each sample and define new non-parameters between the class and the within-class scatter matrix. In NWFE, first calculate the distance between each pair of sampling points, and form a distance matrix , where represents the l-th sample in class i. Then, calculate the weight function through the distance matrix.
The weighted mean function can be obtained by .
The weight of the scatter matrix is a function of and , defined as:
NWFE extracts L features by using weight vectors between and within classes. The extracted L features are the L eigenvectors having the largest eigenvalues of the following matrix:
where the within-class scatter matrix is defined as:
The between-class scatter matrix for L classes is defined as:
4. Materials
Two Houston datasets, including hyperspectral images and LiDAR data, were adopted to evaluate the effectiveness of the proposed RTVSA method. Table 1 lists the detailed information about the training and test sets.

Table 1.
Dataset information of 2012 Houston and the 2017 Houston. The sizes of the 2012 Houston dataset and the 2017 Houston dataset are and , respectively.
4.1. 2012 Houston Dataset
The 2012 Houston dataset (http://www.classic.grss-ieee.org/community/technical-committees/data-fusion/2013-ieee-grss-data-fusion-paper-contest-results/, accessed on 23 December 2020), originally distributed for the 2013 IEEE Geoscience and Remote Sensing Society (GRSS) Data Fusion Contest (DFC), contains the HSI and a LiDAR-derived digital surface model (DSM). This dataset was gathered in June 2012 and covers the Houston University and the surrounding urban areas. Among them, the HSI consists of 144 spectral bands in the 380 nm to 1050 nm region and has been calibrated to at-sensor spectral radiance units. The HSI was captured by the ITRES -CASI (Compact Airborne Spectrographic Imager) 1500 hyperspectral imager. The LiDAR data were acquired using an Optech Gemini sensor. The size of the HSI and LiDAR-derived data is with a spatial resolution of 2.5 m. The ground truth map contains 15 classes and is provided in a 2.5 m ground sampling distance (GSD) raster. Figure 2 shows the HSI, the LiDAR-derived DSM, and the ground truth map. In Table 1, the division of training data and test data on the 2012 Houston dataset is completely based on the 2013 GRSS DFC.
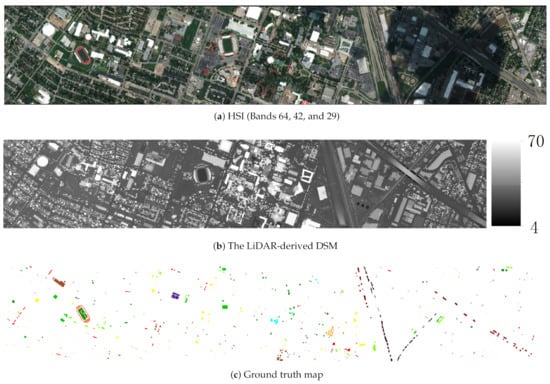

Figure 2.
The 2012 Houston dataset.
4.2. 2017 Houston Dataset
The 2017 Houston dataset (http://www.classic.grss-ieee.org/community/technical-committees/data-fusion/2018-ieee-grss-data-fusion-contest/, accessed on 23 December 2020), originally distributed for the 2018 IEEE GRSS Data Fusion Contest, is composed of HSI and multispectral LiDAR data. In this paper, the training portion of the dataset was used. The HSI, captured by an ITRES CASI 1500, contains 48 bands with a spectral range of 0.38–1.05 m at a 1 m GSD. The multispectral LiDAR data, acquired by an Optech Titan MW (14SEN/CON340), includes point cloud data at 1550 nm, 1064 nm, and 532 nm, as well as the intensity grid, returned for the first time in each channel, and digital surface model (DSM) data with a GSD of 0.5 m. The ground truth map contains 20 urban land cover/land use classes and is provided in a 0.5 m GSD raster with an image size of . Figure 3 presents the HSI, LiDAR-derived DSM, and the ground truth map. In Table 1, for each class, one percent of the samples are randomly selected as the training samples and the rest as test samples.
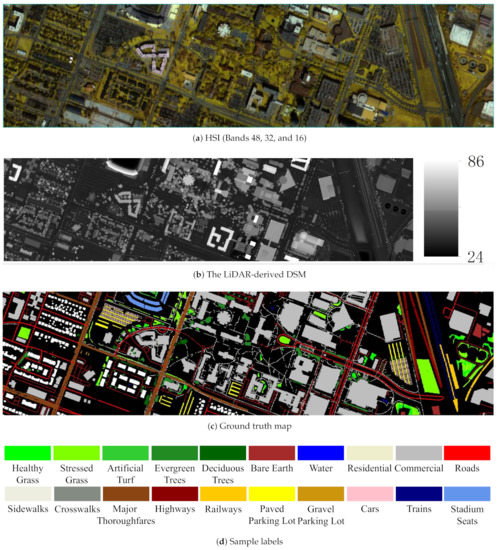
Figure 3.
The 2017 Houston dataset.
5. Results
5.1. Experiment Settings
Three different methods including the LBP, EMAP, and Gabor were adopted in the feature extraction part. In the experiment, their parameters were designed as follows.
- EMAP : According to References [21,24,25], three different attributes are considered when constructing the EMAP: the area, standard deviation, and length of the diagonal of the bounding box. The EMAP with the area attribute describes the proportion of the structure in the scene. To create the profile with the area attribute, the sizes of the SE were set to 10, 15, and 20. The standard deviation attribute performs multi-layer decomposition on objects in the scene that are not related to the geometric shape of the area, but models the gray uniformity of the pixels in the area [21]. For the standard deviation, the size of the SE was 150. The length attribute gives the diagonal length of the smallest rectangle surrounding the connected components, and the sizes of the SEs were set to 50, 100, and 500.
- Gabor: Before extracting Gabor features, the HSI was used to extract the first seven principal components using principal component analysis. For each Gabor filter, the frequency length was set to , , , and , and the angle between the frequency and the spectral size was set to 0, , , and .
- LBP: The input data were first normalized. The circle of radius Q was set to one, and the number of data points P on the circular symmetric neighbor set was eight.
The parameters of the RTVSA method were set as follows: , , and . In image classification, according to the results in Reference [62] and our previous work [51], the number of decision trees in the RF was determined to be 100, and the number of prediction variables was set approximately to the square root of the number of input bands. The settings of the CNN were based on [59]. In the 3D-CNN framework, the size of the 3D convolution kernel was , , and . The mini-batch size was 256, and the network was trained for 100 epochs without batch normalization and data expansion. No pre-trained models were used, and all models were trained from scratch. According to the classification results, the optimal learning rate of 0.001 was selected. The training dataset and the test dataset were randomly selected from the input data respectively according to Table 1.
5.2. Evaluation Indexes
To evaluate the performance of fusion image classification, four commonly used quantitative metrics, namely class accuracy (CA), overall accuracy (OA), average accuracy (AA), and the Kappa coefficient, were used to assess the classification results. Specifically, CA is used to measure the percentage of correctly classified pixels in each class. OA represents the proportion of samples that are correctly classified among all samples. AA measures the average of the percentage of pixels correctly classified for each class. The Kappa statistics is a multivariate statistical method for classification accuracy.
5.3. Results and Analysis
5.3.1. The 2012 Houston Dataset
For the 2012 Houston dataset, the RTVSA fusion method was applied based on the LBP, EMAP, and Gabor feature extraction, respectively. Random forest and CNN classifiers were used to classify the results of different fusion methods. The RF and CNN classification performances are shown in Table 2 and Table 3, respectively. The best results are shown in bold. r represents the number of bands in each image. It can be seen from Table 2 that, compared to directly classifying the original data, the data obtained through feature extraction can effectively improve the performance of random forest. In particular, the spatial information extracted by the EMAP can significantly improve the classification accuracy. For example, the application of the EMAP can improve AA by nearly 7.72% for the HSI. Among all the methods considered in the paper, the RTVSA fusion method captured the redundant information in the HSI and LiDAR data and eliminated unnecessary texture information. All OAs using the RTVSA method exceeded 90%. Besides, since the proposed method took into account spectral and spatial information, it showed excellent performance in the accuracy of specific classes, such as the classes of synthetic grass, soil, tennis court, and running track. Among the CNN classification results, the EMAP extracted multi-scale spatial features, and the RTVSA fusion based on EMAP feature extraction had the best performance. For example, in terms of OA, the classification accuracy of fused images based on EMAP was 11.93% higher than that of LBP and 2.93% higher than that of Gabor. However, the HSI data after function extraction had a good output in certain classes. For example, the classification accuracy of synthetic grass, soil, tennis court, and running track in HSI data based on Gabor feature extraction reached 100%. HSI data themselves have rich spectral information, and the data after spatial feature extraction were more conducive to image classification. When it integrated LiDAR data, it supplemented complementary information and was more helpful for image classification. The classification maps using RF and CNN classifiers obtained by different fusion approaches on the 2012 Houston data are shown in Figure 4 and Figure 5, respectively. The sample labels were consistent with those in Figure 2. Both figures demonstrate that the proposed fusion method gives a classification map of homogeneous regions while maintaining the structure. With regards to the city data collection, the use of RTV not only boosts the smoothness, but also preserves the current structure. It is worth noting that the CNN classification map is skewed because the number of unprocessed LiDAR data bands was too limited.

Table 2.
The RF classification performance of the proposed method based on the LBP, EMAP, and Gabor feature extraction on the 2012 Houston dataset (%). The best values are shown in bold.

Table 3.
The CNN classification performance of the proposed method based on the LBP, EMAP, and Gabor feature extraction on the 2012 Houston dataset (%). The best values are shown in bold.
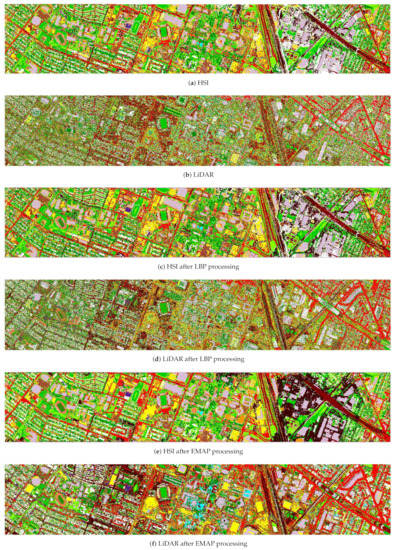
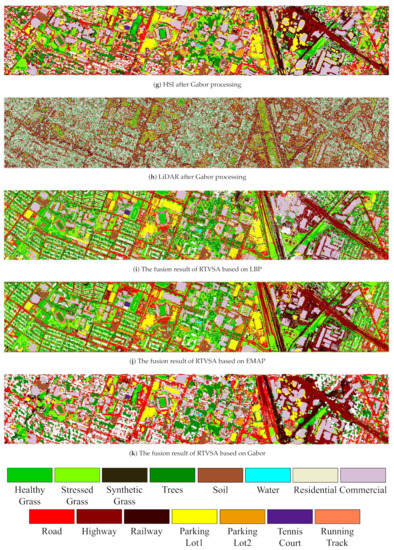
Figure 4.
Classification maps obtained by RF classifiers combined with the proposed methods on the 2012 Houston dataset.
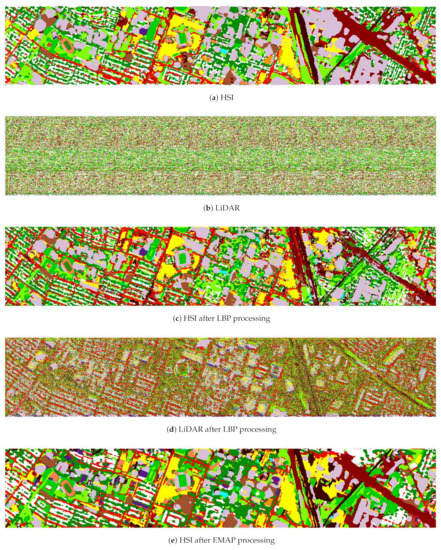
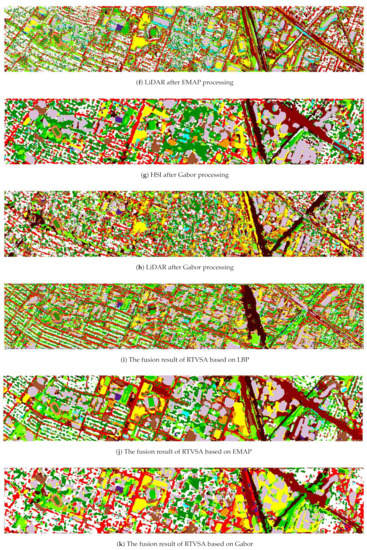

Figure 5.
Classification maps obtained by CNN classifiers combined with the proposed methods on the 2012 Houston dataset.
5.3.2. The 2017 Houston Dataset
The RF and CNN classification results of different fusion methods on the 2017 Houston dataset are shown in Table 4 and Table 5, respectively. Different from the 2012 Houston dataset, the LBP-based RTVSA fusion method achieved the best classification accuracy on the 2017 Houston dataset. This is related to the spectral and spatial information contained in the original data. Based on LBP feature extraction, the classification results after RTVSA fusion were excellent. As far as OA is concerned, the LBP based fusion achieved OA of 91.83%, which was 15.44% higher than that of HSI and 14.33% higher than that of LiDAR. The classification results of CNN also proved the above. The results indicated that the proposed fusion method was stable enough to accurately identify complex classes with few features. However, since the 2017 Houston dataset was only a part of the 2012 dataset and the 2017 dataset with a 1m GSD was too detailed, the classification performance of the 2017 Houston dataset was slightly inferior to that of the 2012 Houston dataset. The classification maps using RF and CNN classifiers obtained by different fusion approaches on the 2017 Houston data are shown in Figure 6 and Figure 7, respectively. The sample labels are consistent with those in Figure 3. In the RF classification map (Figure 6), the fusion data based on the LBP and RTVSA had large differences between each class, which can be distinguished well. There was a wide difference between the Gabor-based HSI and LiDAR data classification maps, primarily because the spatial information contained in the LiDAR data varied considerably from the spectral information contained in the HSI data. In Figure 7, it can be seen that the consideration of EMAP can make the classification map uniform by extracting the structure of various objects, compared to the case where only the spectral information is considered. This was further enhanced by using the proposed method of fusing spectral, spatial, and elevation information.

Table 4.
The RF classification performance of the proposed method based on the LBP, EMAP, and Gabor feature extraction on the 2017 Houston dataset (%). The best values are shown in bold.

Table 5.
The CNN classification performance of the proposed method based on the LBP, EMAP, and Gabor feature extraction on the 2017 Houston dataset (%). The best values are shown in bold.

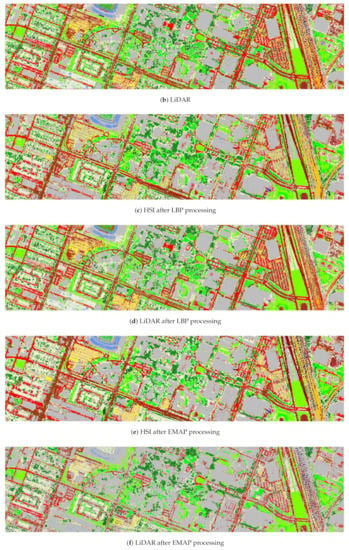
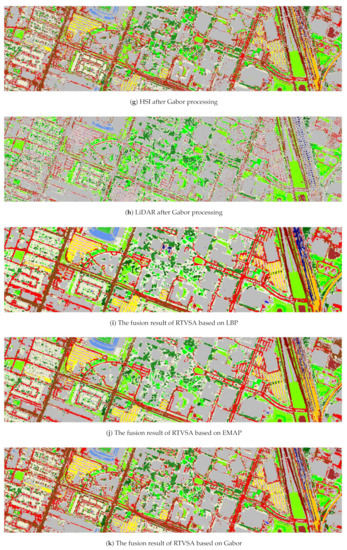

Figure 6.
Classification maps obtained by RF classifiers combined with the proposed methods on the 2017 Houston dataset.
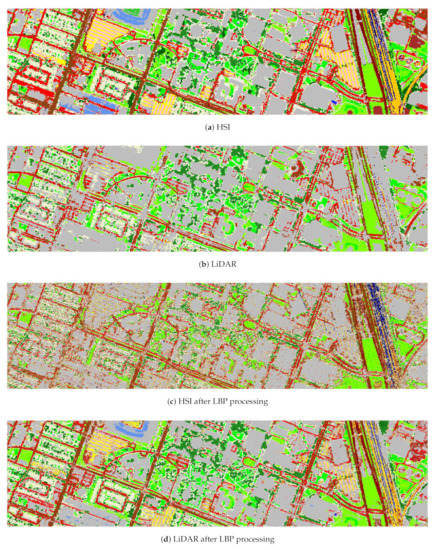
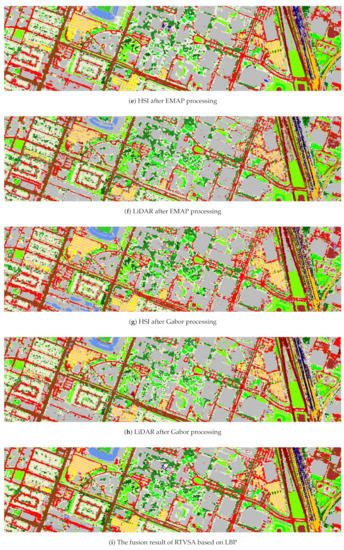
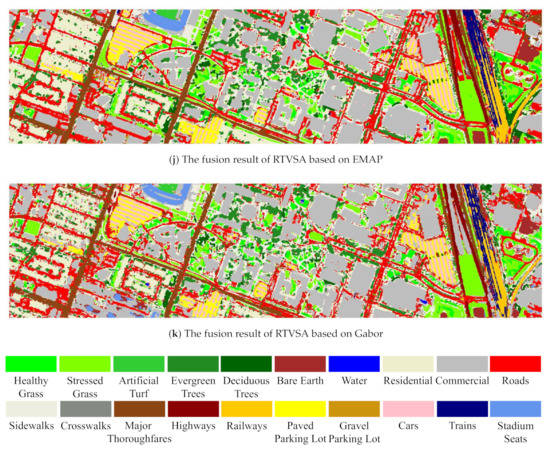
Figure 7.
Classification maps obtained by CNN classifiers combined with the proposed methods on the 2017 Houston dataset.
5.4. Parametric Analysis
Three important parameters, namely , , and L, on the performance of the proposed RTVSA method are discussed in this section. The experiment was conducted on the 2012 Houston dataset, using RF and CNN classifiers, respectively. Other parameters were fixed when addressing , i.e., and . Similarly, other parameters were also fixed when determining the effect of , i.e., and . When measuring the effect of L, and took 0.04 and two, respectively. The effect of classification performance is shown in Figure 8 and Figure 9 by pairs of these parameters. It can be seen from Figure 8 that while the value of increases, the RF classification accuracy also presents an upward trend. The growth rate of is close to that of , and when the value of exceeds three, the classification accuracy essentially no longer improves. The classification accuracy shows an upward trend with an increase of L. When L exceeds 40, the classification accuracy no longer increases. This phenomenon is not surprising. More features can introduce more useful information, which is beneficial to improve classification performance. However, if the number of features is too large, this will cause information redundancy, which will result in a decrease in classification accuracy. The changes of parameters under the CNN classifiers are similar to the RF. However, due to the characteristics of the CNN, it is more sensitive to changes in parameters.
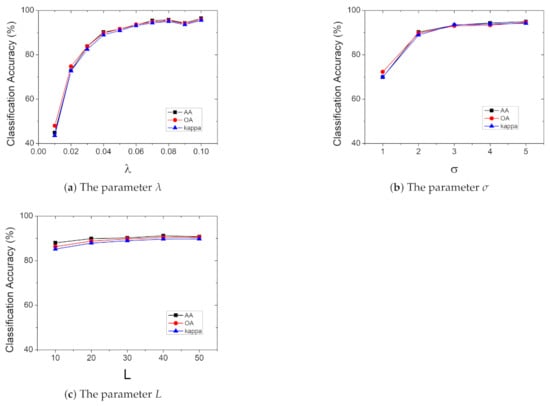
Figure 8.
Influence of the parameters on the RF classification accuracies of the proposed method on the 2012 Houston dataset.
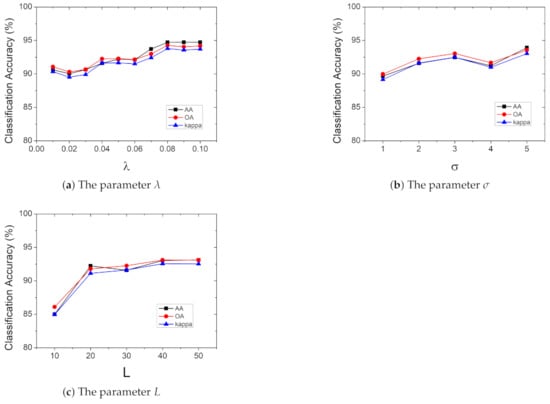
Figure 9.
Influence of the parameters on the CNN classification accuracies of the proposed method on the 2012 Houston dataset.
6. Discussion
Due to the limitation of imaging equipment, hyperspectral data have rich spectral information, but it may not be able to reliably identify objects with the same spectral characteristics. Moreover, the LiDAR data can provide complementary information along with the HSI. To meet social and economic applications, more flexible land cover data products are needed. This paper aims to extract structural correlations from heterogeneous data to fuse HSI and LiDAR data. The proposed feature-level fusion method can provide an effective way to extract and fuse features for improving the classification accuracy of land cover. In this study, a TV-based feature fusion method is proposed for the fusing of HSI and LiDAR urban datasets. The proposed method is used on two publicly available Houston datasets. The classification results of random forest and CNN classification demonstrate the effectiveness of the proposed method.
- (1)
- In this study, three feature extraction methods, the LBP, EMAP, and Gabor, are used to extract the spatial features of HSI and LiDAR. The results in Table 2, Table 3, Table 4 and Table 5 show that the use of these three features can improve the accuracy of land cover classification. In the 2012 Houston dataset, the EMAP feature provides the highest value of OA. Compared with other methods, the EMAP feature obtains the highest classification accuracy in the classes of healthy grass, stressed grass, synthetic grass, trees, soil, residential, commercial, and roads. However, it is slightly inferior to the performance of the LBP feature in the other classes. The EMAP extracts multi-scale structural information, while the LBP feature shows the texture feature of a local area. In the 2017 Houston dataset, different from the 2012 Houston dataset, the LBP obtains the highest classification accuracy. The reason is that the 2017 Houston dataset with a 1m GSD contains more detailed information, and the 2017 Houston dataset used in this paper only covers a part of the 2012 Houston dataset. When the sample is in a homogeneous region, the LBP feature plays an important role. When the sample contains more boundary regions, the performance of the EMAP feature is better.
- (2)
- Although the two datasets used in this paper cover part of the same area, the classification accuracy of the 2012 Houston dataset is slightly higher than that of the 2017 Houston dataset. This is due to many reasons. The two datasets have different spatial resolutions, where the 2012 Houston dataset has a 2.5 m GSD and the 2017 Houston dataset a 2.5 m GSD. The dimensions of the HSI and LiDAR are not the same in the two datasets. The two datasets use different data types. The 2017 Houston dataset contains multispectral LiDAR, while the 2012 Houston dataset contains a LiDAR-derived DSM. In addition, the dataset used in this paper is involved in the area of Houston University, but the geo-reference is not part of the paper.
- (3)
- The feature-level fusion method proposed in this paper only contains a single spatial feature. Some researchers have found that the fusion of multiple features can improve the accuracy of land cover classification [63,64]. Therefore, the fusion of multiple features to improve the usability of remote sensing images will be considered in future work.
7. Conclusions
In this paper, a feature-level fusion method based on total variation is proposed to combine the heterogeneous features of HSI and LiDAR data. The proposed method consists of two parts, feature extraction and feature fusion. In feature extraction, three effective methods (LBP, EMAP, and Gabor) are adopted to extract spatial features, among which the LBP and EMAP have greater contributions to improving land cover classification. In feature fusion, the proposed RTVSA method is suitable for removing the useless texture and noise information and enhances class separability, which can effectively combine the complementary information of various data. Two urban Houston University datasets, including the 2012 Houston dataset and the training portion of the 2017 Houston dataset, are used to evaluate the proposed method. Experimental results prove that the RTVSA fusion method can capture feature redundancy while improving classification accuracy on the study datasets. Moreover, RTVSA retains the structure and provides a uniform classification map. In the future, the fusion of multiple features to improve the usability of remote sensing images will be considered.
Author Contributions
Y.Q. and W.F. conceived of and designed the experiments; Y.T. wrote the paper. Y.T. and W.Z. performed the experiments. W.F. and G.D. revised the paper. W.H. and M.X. edited the manuscript. All authors have read and agreed to the published version of the manuscript.
Funding
This research was funded by the National Natural Science Foundation of China (61772397, 12005169), the National Key R&D Program of China (2016YFE0200400), the Open Research Fund of Key Laboratory of Digital Earth Science (2019LDE005), the science and technology innovation team of Shaanxi Province (2019TD-002), and Special fund for basic scientific research project in the central scientific research institutes (Institute of Grassland Research of CAAS) (1610332020026).
Data Availability Statement
The study did not report any data.
Conflicts of Interest
The authors declare no conflict of interest.
References
- Liao, W.; Pižurica, A.; Bellens, R.; Gautama, S.; Philips, W. Generalized Graph-Based Fusion of Hyperspectral and LiDAR Data Using Morphological Features. IEEE Geosci. Remote Sens. Lett. 2015, 12, 552–556. [Google Scholar] [CrossRef]
- Xia, J.; Yokoya, N.; Iwasaki, A. Fusion of Hyperspectral and LiDAR Data With a Novel Ensemble Classifier. IEEE Geosci. Remote Sens. Lett. 2018, 15, 957–961. [Google Scholar] [CrossRef]
- Gu, Y.; Wang, Q. Discriminative Graph-Based Fusion of HSI and LiDAR Data for Urban Area Classification. IEEE Geosci. Remote Sens. Lett. 2017, 14, 906–910. [Google Scholar] [CrossRef]
- Rasti, B.; Ghamisi, P.; Plaza, J.; Plaza, A. Fusion of Hyperspectral and LiDAR Data Using Sparse and Low-Rank Component Analysis. IEEE Trans. Geosci. Remote Sens. 2017, 55, 6354–6365. [Google Scholar] [CrossRef]
- Gu, Y.; Wang, Q.; Jia, X.; Benediktsson, J.A. A Novel MKL Model of Integrating LiDAR Data and MSI for Urban Area Classification. IEEE Trans. Geosci. Remote Sens. 2015, 53, 5312–5326. [Google Scholar] [CrossRef]
- Rasti, B.; Ghamisi, P.; Gloaguen, R. Hyperspectral and LiDAR Fusion Using Extinction Profiles and Total Variation Component Analysis. IEEE Trans. Geosci. Remote Sens. 2017, 55, 3997–4007. [Google Scholar] [CrossRef]
- Sankey, T.; Donager, J.; McVay, J.; Sankey, J.B. UAV lidar and hyperspectral fusion for forest monitoring in the southwestern USA. Remote Sens. Environ. 2017, 195, 30–43. [Google Scholar] [CrossRef]
- Dalponte, M.; Bruzzone, L.; Gianelle, D. Fusion of Hyperspectral and LIDAR Remote Sensing Data for Classification of Complex Forest Areas. IEEE Trans. Geosci. Remote Sens. 2008, 46, 1416–1427. [Google Scholar] [CrossRef]
- Alonzo, M.; Bookhagen, B.; Roberts, D.A. Urban tree species mapping using hyperspectral and lidar data fusion. Remote Sens. Environ. 2014, 148, 70–83. [Google Scholar] [CrossRef]
- Swatantran, A.; Dubayah, R.; Roberts, D.; Hofton, M.; Blair, J.B. Mapping biomass and stress in the Sierra Nevada using lidar and hyperspectral data fusion. Remote Sens. Environ. 2011, 115, 2917–2930. [Google Scholar] [CrossRef]
- Buckley, S.J.; Kurz, T.H.; Howell, J.A.; Schneider, D. Terrestrial lidar and hyperspectral data fusion products for geological outcrop analysis. Comput. Geosci. 2013, 54, 249–258. [Google Scholar] [CrossRef]
- Li, S.; Hao, Q.; Kang, X.; Benediktsson, J.A. Gaussian Pyramid Based Multiscale Feature Fusion for Hyperspectral Image Classification. IEEE J. Sel. Top. Appl. Earth Obs. Remote Sens. 2018, 11, 3312–3324. [Google Scholar] [CrossRef]
- Falco, N.; Benediktsson, J.A.; Bruzzone, L. Spectral and Spatial Classification of Hyperspectral Images Based on ICA and Reduced Morphological Attribute Profiles. IEEE Trans. Geosci. Remote Sens. 2015, 53, 6223–6240. [Google Scholar] [CrossRef]
- Licciardi, G.; Pacifici, F.; Tuia, D.; Prasad, S.; West, T.; Giacco, F.; Thiel, C.; Inglada, J.; Christophe, E.; Chanussot, J.; et al. Decision Fusion for the Classification of Hyperspectral Data: Outcome of the 2008 GRS-S Data Fusion Contest. IEEE Trans. Geosci. Remote Sens. 2009, 47, 3857–3865. [Google Scholar] [CrossRef]
- Hang, R.; Liu, Q.; Sun, Y.; Yuan, X.; Pei, H.; Plaza, J.; Plaza, A. Robust Matrix Discriminative Analysis for Feature Extraction from Hyperspectral Images. IEEE J. Sel. Top. Appl. Earth Obs. Remote Sens. 2017, 10, 2002–2011. [Google Scholar] [CrossRef]
- Kang, X.; Li, S.; Benediktsson, J.A. Feature Extraction of Hyperspectral Images with Image Fusion and Recursive Filtering. IEEE Trans. Geosci. Remote Sens. 2014, 52, 3742–3752. [Google Scholar] [CrossRef]
- Fang, L.; He, N.; Li, S.; Ghamisi, P.; Benediktsson, J.A. Extinction Profiles Fusion for Hyperspectral Images Classification. IEEE Trans. Geosci. Remote Sens. 2018, 56, 1803–1815. [Google Scholar] [CrossRef]
- Gao, L.; Hong, D.; Yao, J.; Zhang, B.; Gamba, P.; Chanussot, J. Spectral Superresolution of Multispectral Imagery with Joint Sparse and Low-Rank Learning. IEEE Trans. Geosci. Remote Sens. 2020, 1–12. [Google Scholar] [CrossRef]
- Jia, S.; Wu, K.; Zhu, J.; Jia, X. Spectral-Spatial Gabor Surface Feature Fusion Approach for Hyperspectral Imagery Classification. IEEE Trans. Geosci. Remote Sens. 2019, 57, 1142–1154. [Google Scholar] [CrossRef]
- Jia, S.; Tang, G.; Zhu, J.; Li, Q. A Novel Ranking-Based Clustering Approach for Hyperspectral Band Selection. IEEE Trans. Geosci. Remote Sens. 2016, 54, 88–102. [Google Scholar] [CrossRef]
- Dalla Mura, M.; Benediktsson, J.A.; Waske, B.; Bruzzone, L. Morphological Attribute Profiles for the Analysis of Very High Resolution Images. IEEE Trans. Geosci. Remote Sens. 2010, 48, 3747–3762. [Google Scholar] [CrossRef]
- Ghamisi, P.; Benediktsson, J.A.; Phinn, S. Land cover classification using both hyperspectral and LiDAR data. Int. J. Image Data Fusion 2015, 6, 189–215. [Google Scholar] [CrossRef]
- Khodadadzadeh, M.; Li, J.; Prasad, S.; Plaza, A. Fusion of Hyperspectral and LiDAR Remote Sensing Data Using Multiple Feature Learning. IEEE J. Sel. Top. Appl. Earth Obs. Remote Sens. 2015, 8, 2971–2983. [Google Scholar] [CrossRef]
- Mura, M.D.; Benediktsson, J.A.; Waske, B.; Bruzzone, L. Extended profiles with morphological attribute filters for the analysis of hyperspectral data. Int. J. Remote Sens. 2010, 31, 5975–5991. [Google Scholar] [CrossRef]
- Kwan, C.; Gribben, D.; Ayhan, B.; Bernabe, S.; Plaza, A.; Selva, M. Improving Land Cover Classification Using Extended Multi-Attribute Profiles (EMAP) Enhanced Color, Near Infrared, and LiDAR Data. Remote Sens. 2020, 12, 1392. [Google Scholar] [CrossRef]
- Luo, R.; Liao, W.; Zhang, H.; Zhang, L.; Scheunders, P.; Pi, Y.; Philips, W. Fusion of Hyperspectral and LiDAR Data for Classification of Cloud-Shadow Mixed Remote Sensed Scene. IEEE J. Sel. Top. Appl. Earth Obs. Remote Sens. 2017, 10, 3768–3781. [Google Scholar] [CrossRef]
- Kang, X.; Li, C.; Li, S.; Lin, H. Classification of Hyperspectral Images by Gabor Filtering Based Deep Network. IEEE J. Sel. Top. Appl. Earth Obs. Remote Sens. 2018, 11, 1166–1178. [Google Scholar] [CrossRef]
- Li, W.; Du, Q. Gabor-Filtering-Based Nearest Regularized Subspace for Hyperspectral Image Classification. IEEE J. Sel. Top. Appl. Earth Obs. Remote Sens. 2014, 7, 1012–1022. [Google Scholar] [CrossRef]
- He, L.; Li, J.; Plaza, A.; Li, Y. Discriminative Low-Rank Gabor Filtering for Spectral-Spatial Hyperspectral Image Classification. IEEE Trans. Geosci. Remote Sens. 2017, 55, 1381–1395. [Google Scholar] [CrossRef]
- Ojala, T.; Pietikainen, M.; Maenpaa, T. Multiresolution gray-scale and rotation invariant texture classification with local binary patterns. IEEE Trans. Pattern Anal. Mach. Intell. 2002, 24, 971–987. [Google Scholar] [CrossRef]
- Ge, C.; Du, Q.; Li, W.; Li, Y.; Sun, W. Hyperspectral and LiDAR Data Classification Using Kernel Collaborative Representation Based Residual Fusion. IEEE J. Sel. Top. Appl. Earth Obs. Remote Sens. 2019, 12, 1963–1973. [Google Scholar] [CrossRef]
- Fang, L.; Li, S.; Duan, W.; Ren, J.; Benediktsson, J.A. Classification of Hyperspectral Images by Exploiting Spectral-Spatial Information of Superpixel via Multiple Kernels. IEEE Trans. Geosci. Remote Sens. 2015, 53, 6663–6674. [Google Scholar] [CrossRef]
- Puttonen, E.; Jaakkola, A.; Litkey, P.; Hyyppä, J. Tree classification with fused mobile laser scanning and hyperspectral data. Sensors 2011, 11, 5158–5182. [Google Scholar] [CrossRef] [PubMed]
- Pedergnana, M.; Marpu, P.R.; Dalla Mura, M.; Benediktsson, J.A.; Bruzzone, L. Classification of Remote Sensing Optical and LiDAR Data Using Extended Attribute Profiles. IEEE J. Sel. Top. Signal Process. 2012, 6, 856–865. [Google Scholar] [CrossRef]
- Imani, M.; Ghassemian, H. An overview on spectral and spatial information fusion for hyperspectral image classification: Current trends and challenges. Inf. Fusion 2020, 59, 59–83. [Google Scholar] [CrossRef]
- Camps-Valls, G.; Gomez-Chova, L.; Munoz-Mari, J.; Rojo-Alvarez, J.L.; Martinez-Ramon, M. Kernel-Based Framework for Multitemporal and Multisource Remote Sensing Data Classification and Change Detection. IEEE Trans. Geosci. Remote Sens. 2008, 46, 1822–1835. [Google Scholar] [CrossRef]
- Zhang, Y.; Yang, H.L.; Prasad, S.; Pasolli, E.; Jung, J.; Crawford, M. Ensemble Multiple Kernel Active Learning For Classification of Multisource Remote Sensing Data. IEEE J. Sel. Top. Appl. Earth Obs. Remote. Sens. 2015, 8, 845–858. [Google Scholar] [CrossRef]
- Zhang, Y.; Prasad, S. Multisource Geospatial Data Fusion via Local Joint Sparse Representation. IEEE Trans. Geosci. Remote Sens. 2016, 54, 3265–3276. [Google Scholar] [CrossRef]
- Rasti, B.; Ghamisi, P. Remote sensing image classification using subspace sensor fusion. Inf. Fusion 2020, 64, 121–130. [Google Scholar] [CrossRef]
- Dian, R.; Li, S.; Fang, L.; Wei, Q. Multispectral and hyperspectral image fusion with spatial-spectral sparse representation. Inf. Fusion 2019, 49, 262–270. [Google Scholar] [CrossRef]
- Hong, D.; Gao, L.; Yao, J.; Zhang, B.; Plaza, A.; Chanussot, J. Graph Convolutional Networks for Hyperspectral Image Classification. IEEE Trans. Geosci. Remote Sens. 2020, 1–13. [Google Scholar] [CrossRef]
- Chen, Y.; Li, C.; Ghamisi, P.; Jia, X.; Gu, Y. Deep Fusion of Remote Sensing Data for Accurate Classification. IEEE Geosci. Remote Sens. Lett. 2017, 14, 1253–1257. [Google Scholar] [CrossRef]
- Zhang, M.; Li, W.; Du, Q.; Gao, L.; Zhang, B. Feature Extraction for Classification of Hyperspectral and LiDAR Data Using Patch-to-Patch CNN. IEEE Trans. Cybern. 2020, 50, 100–111. [Google Scholar] [CrossRef] [PubMed]
- Feng, Q.; Zhu, D.; Yang, J.; Li, B. Multisource hyperspectral and lidar data fusion for urban land use mapping based on a modified two-branch convolutional neural network. ISPRS Int. J. Geo Inf. 2019, 8, 28. [Google Scholar] [CrossRef]
- Rudin, L.I.; Osher, S.; Fatemi, E. Nonlinear total variation based noise removal algorithms. Phys. D Nonlinear Phenom. 1992, 60, 259–268. [Google Scholar] [CrossRef]
- Palsson, F.; Sveinsson, J.R.; Ulfarsson, M.O. A New Pansharpening Algorithm Based on Total Variation. IEEE Geosci. Remote Sens. Lett. 2014, 11, 318–322. [Google Scholar] [CrossRef]
- Chang, Y.; Yan, L.; Fang, H.; Liu, H. Simultaneous Destriping and Denoising for Remote Sensing Images With Unidirectional Total Variation and Sparse Representation. IEEE Geosci. Remote Sens. Lett. 2014, 11, 1051–1055. [Google Scholar] [CrossRef]
- Duan, P.; Kang, X.; Li, S.; Ghamisi, P. Noise-Robust Hyperspectral Image Classification via Multi-Scale Total Variation. IEEE J. Sel. Top. Appl. Earth Obs. Remote Sens. 2019, 12, 1948–1962. [Google Scholar] [CrossRef]
- Kumar, M.; Dass, S. A Total Variation-Based Algorithm for Pixel-Level Image Fusion. IEEE Trans. Image Process. 2009, 18, 2137–2143. [Google Scholar] [CrossRef]
- Ma, J.; Chen, C.; Li, C.; Huang, J. Infrared and visible image fusion via gradient transfer and total variation minimization. Inf. Fusion 2016, 31, 100–109. [Google Scholar] [CrossRef]
- Quan, Y.; Tong, Y.; Feng, W.; Dauphin, G.; Huang, W.; Xing, M. A Novel Image Fusion Method of Multi-Spectral and SAR Images for Land Cover Classification. Remote Sens. 2020, 12, 3801. [Google Scholar] [CrossRef]
- Feng, W.; Dauphin, G.; Huang, W.; Quan, Y.; Liao, W. New margin-based subsampling iterative technique in modified random forests for classification. Knowl. Syst. 2019, 182, 104845. [Google Scholar] [CrossRef]
- Feng, W.; Dauphin, G.; Huang, W.; Quan, Y.; Bao, W.; Wu, M.; Li, Q. Dynamic Synthetic Minority Over-Sampling Technique-Based Rotation Forest for the Classification of Imbalanced Hyperspectral Data. IEEE J. Sel. Top. Appl. Earth Obs. Remote Sens. 2019, 12, 2159–2169. [Google Scholar] [CrossRef]
- Feng, W.; Huang, W.; Bao, W. Imbalanced Hyperspectral Image Classification With an Adaptive Ensemble Method Based on SMOTE and Rotation Forest With Differentiated Sampling Rates. IEEE Geosci. Remote Sens. Lett. 2019, 16, 1879–1883. [Google Scholar] [CrossRef]
- Feng, W.; Huang, W.; Ren, J. Class Imbalance Ensemble Learning Based on the Margin Theory. Appl. Sci. 2018, 8, 815. [Google Scholar] [CrossRef]
- Quan, Y.; Zhong, X.; Feng, W.; Dauphin, G.; Gao, L.; Xing, M. A Novel Feature Extension Method for the Forest Disaster Monitoring Using Multispectral Data. Remote Sens. 2020, 12, 2261. [Google Scholar] [CrossRef]
- Qiang Li, W.F.; Quan, Y. Trend and forecasting of the COVID-19 outbreak in China. J. Infect. 2020, 80, 469–496. [Google Scholar]
- Breiman, L. Random forests. Mach. Learn. 2001, 45, 5–32. [Google Scholar] [CrossRef]
- Roy, S.K.; Krishna, G.; Dubey, S.R.; Chaudhuri, B.B. HybridSN: Exploring 3D-2-D CNN Feature Hierarchy for Hyperspectral Image Classification. IEEE Geosci. Remote Sens. Lett. 2020, 17, 277–281. [Google Scholar] [CrossRef]
- Shen, L.; Jia, S. Three-Dimensional Gabor Wavelets for Pixel-Based Hyperspectral Imagery Classification. IEEE Trans. Geosci. Remote Sens. 2011, 49, 5039–5046. [Google Scholar] [CrossRef]
- Xu, L.; Yan, Q.; Xia, Y.; Jia, J. Structure extraction from texture via relative total variation. ACM Trans. Graph. TOG 2012, 31, 1–10. [Google Scholar] [CrossRef]
- Rodriguez-Galiano, V.; Ghimire, B.; Rogan, J.; Chica-Olmo, M.; Rigol-Sanchez, J. An assessment of the effectiveness of a random forest classifier for land cover classification. ISPRS J. Photogramm. Remote Sens. 2012, 67, 93–104. [Google Scholar] [CrossRef]
- Mu, C.; Liu, Y.; Liu, Y. Hyperspectral Image Spectral-Spatial Classification Method Based on Deep Adaptive Feature Fusion. Remote Sens. 2021, 13, 746. [Google Scholar] [CrossRef]
- Mohla, S.; Pande, S.; Banerjee, B.; Chaudhuri, S. FusAtNet: Dual Attention Based SpectroSpatial Multimodal Fusion Network for Hyperspectral and LiDAR Classification. In Proceedings of the IEEE/CVF Conference on Computer Vision and Pattern Recognition (CVPR) Workshops, Seattle, WA, USA, 14–19 June 2020. [Google Scholar]
Publisher’s Note: MDPI stays neutral with regard to jurisdictional claims in published maps and institutional affiliations. |
© 2021 by the authors. Licensee MDPI, Basel, Switzerland. This article is an open access article distributed under the terms and conditions of the Creative Commons Attribution (CC BY) license (http://creativecommons.org/licenses/by/4.0/).