Article

Underground Coal Fire Detection and Monitoring Based on Landsat-8 and Sentinel-1 Data Sets in Miquan Fire Area, XinJiang

1
Key Laboratory of Land Environment and Disaster Monitoring, MNR, China University of Mining and Technology, Xuzhou 221116, China
2
School of Environment Science and Spatial Informatics, China University of Mining and Technology, Xuzhou 221116, China
3
Xinjiang Coalfield Fire Extinguishing Engineering Bureau, Urumqi 830000, China
4
College of Information Science and Engineering, Henan University of Technology, Zhengzhou 450001, China
5
School of Mines and Coals, Inner Mongolia University of Science and Technology, Baotou 014010, China
*
Author to whom correspondence should be addressed.
Remote Sens. 2021, 13(6), 1141; https://doi.org/10.3390/rs13061141
Submission received: 19 January 2021 / Revised: 5 March 2021 / Accepted: 5 March 2021 / Published: 17 March 2021
(This article belongs to the Special Issue Geodetic Observations for Earth System)

Abstract

:
Underground coal fires have become a worldwide disaster, which brings serious environmental pollution and massive energy waste. Xinjiang is one of the regions that is seriously affected by the underground coal fires. After years of extinguishing, the underground coal fire areas in Xinjiang have not been significantly reduced yet. To extinguish underground coal fires, it is critical to identify and monitor them. Recently, remote sensing technologies have been showing great potential in coal fires’ identification and monitoring. The thermal infrared technology is usually used to detect thermal anomalies in coal fire areas, and the Differential Synthetic Aperture Radar Interferometry (DInSAR) technology for the detection of coal fires related to ground subsidence. However, non-coal fire thermal anomalies caused by ground objects with low specific heat capacity, and surface subsidence caused by mining and crustal activities have seriously affected the detection accuracy of coal fire areas. To improve coal fires’ detection accuracy by using remote sensing technologies, this study firstly obtains temperature, normalized difference vegetation index (NDVI), and subsidence information based on Landsat8 and Sentinel-1 data, respectively. Then, a multi-source information strength and weakness constraint method (SWCM) is proposed for coal fire identification and analysis. The results show that the proposed SWCM has the highest coal fire identification accuracy among the employed methods. Moreover, it can significantly reduce the commission and omission error caused by non-coal fire-related thermal anomalies and subsidence. Specifically, the commission error is reduced by 70.4% on average, and the omission error is reduced by 30.6%. Based on the results, the spatio-temporal change characteristics of the coal fire areas have been obtained. In addition, it is found that there is a significant negative correlation between the time-series temperature and the subsidence rate of the coal fire areas (R2 reaches 0.82), which indicates the feasibility of using both temperature and subsidence to identify and monitor underground coal fires.

Graphical Abstract

1. Introduction

Underground coal fire disasters refer to the interaction of coal seams with oxygen under the interference of the natural environment or human factors [1]. In hot and dry environments, the oxidation of coal generates heat, if the heat is not dissipated, the temperature of coal can rise to a point at which ignition occurs and the coal begins to burn, which eventually leads to spontaneous combustion of coal that significantly affects the environment [2,3]. Coal fire disasters are widely distributed around the world, mainly in China, India, the United States, Australia, Venezuela, Indonesia, and South Africa [4]. Coal fires cause massive energy waste. According to statistical surveys, nearly 1 billion tons of coal is destroyed by underground coal fires every year [5]. In addition, several toxic and harmful gases and a large amount of dust, sulfide, and other pollutants are produced during the combustion of coal, causing severe environmental pollution [6]. At the same time, the combustion space area created by coal fires can change the stress balance of the overlying rocks, causing cracks, fissures, and collapses, which seriously endanger the local residents’ lives and property [7]. Therefore, it is crucial to identify, monitor, and control the underground coal fires.
The common identification methods of coal fire areas include the census method, geophysical method, and remote sensing method [4,8]. The first two methods require workers to carry equipment for conducting on-site investigations, which necessitate huge manpower and material resources. Thus, they are not suitable for analysis and monitoring of wide-area coal fires and sequential coal fires. On the other hand, the remote sensing method involves capturing a series of physical and chemical changes induced by coal fires, such as the increase in the surface temperature, change in the magnetoelectric properties of the rock, and surface subsidence of the coal fire areas due to the increase in the combustion space area, to identify the corresponding coal fire areas [9]. Nowadays, a variety of monitoring sources and remote sensing data are available for selection, and they are becoming increasingly abundant, making the advantages of remote sensing technology in the identification of coal fire areas more obvious.
Thermal infrared remote sensing technology is widely used for the identification of coal fire areas, peatland combustion, forest fire, etc. [10,11]. Typically, the first step of this technology to detect coal fires is to invert the surface temperature, and then certain rules are utilized to extract the thermal anomalies on the land surface. This method has been proved to be feasible and time-efficient. Several experiments using Landsat 8 and Advanced Spaceborne Thermal Emission and Reflection Radiometer (ASTER) have been reported, and the results have proved the efficiency of thermal infrared technology in the identification of coal fire areas [12,13,14,15]. However, this technology has some limitations, such as an error in thermal anomaly extraction and non-coal fire thermal anomaly, which can cause non-coal fire areas to be misrecognized as coal fire areas [16]. In addition, it is hard to detect some deeply concealed coal fires by this method. Further, the range of coal fires caused by abandoned small coal mines is usually smaller than that of current medium spatial resolution thermal infrared images, so thermal infrared technology cannot detect the small coal fires.
Recently, differential interferometric synthetic aperture radar (DInSAR) technology has been employed to monitor the surface subsidence associated with coal fires to effectively identify the coal fire areas. This technique has the potential to detect small coal fires or hidden coal fires. For example, many scholars have carried out a series of DInSAR experiments in the Wuda fire area [17,18,19]. The results indicated that the subsidence and coal fire areas have a certain degree of overlap, and the burning of coal fires can cause new cracks and fissures in the surrounding area. However, the DInSAR technology also has some limitations. For example, non-coal fire subsidence caused by crustal movement, coal mining, etc., could affect the identification of coal fire areas [20]. Further, the ground objects in the coal fire area are mostly distributed scatterers, the traditional time-series DInSAR method is difficult to obtain high-quality ground subsidence in these areas [21,22].
In addition, some studies employed the combination of thermal infrared technology and DInSAR technology for monitoring coal fires, but they only used the results of the two technologies as an auxiliary means of mutual support or simply superimposed the inversion results of the two technologies [13,23]. These algorithms consider that the areas with both subsidence and thermal anomalies are coal fire areas. However, it is hard for them to accurately decide whether the individual thermal anomaly and subsidence areas are coal fire areas or not.
To address the shortcomings of remote sensing technology for the detection and monitoring of coal fires, in this study, a strong and weak constraint method (SWCM) is proposed based on the Landsat-8 and Sentinel-1 data sets. The core idea of the proposed SWCM is to generate a filter by setting a reasonable threshold to jointly process the temperature, subsidence, and normalized difference vegetation index (NDVI). The proposed method can be used to decide whether the individual thermal anomaly and subsidence areas are coal fire areas, thus, improving the identification accuracy.
The rest of this paper is organized as follows. The study area and data are introduced in Section 2. In Section 3, the inversion methods of temperature, subsidence, and NDVI are briefly introduced, and then the SWCM is described in detail. In Section 4, the results are presented, and the accuracy of the proposed method is verified. Then, the spatio-temporal variation of coal fire areas is studied. Finally, the relationship between temperature and subsidence in coal fire areas is analyzed. In Section 5, the distinct features, applications, and limitations of the proposed method are discussed. Finally, the conclusions and future scope of the work are given in Section 6.

2. Study Area and Datasets
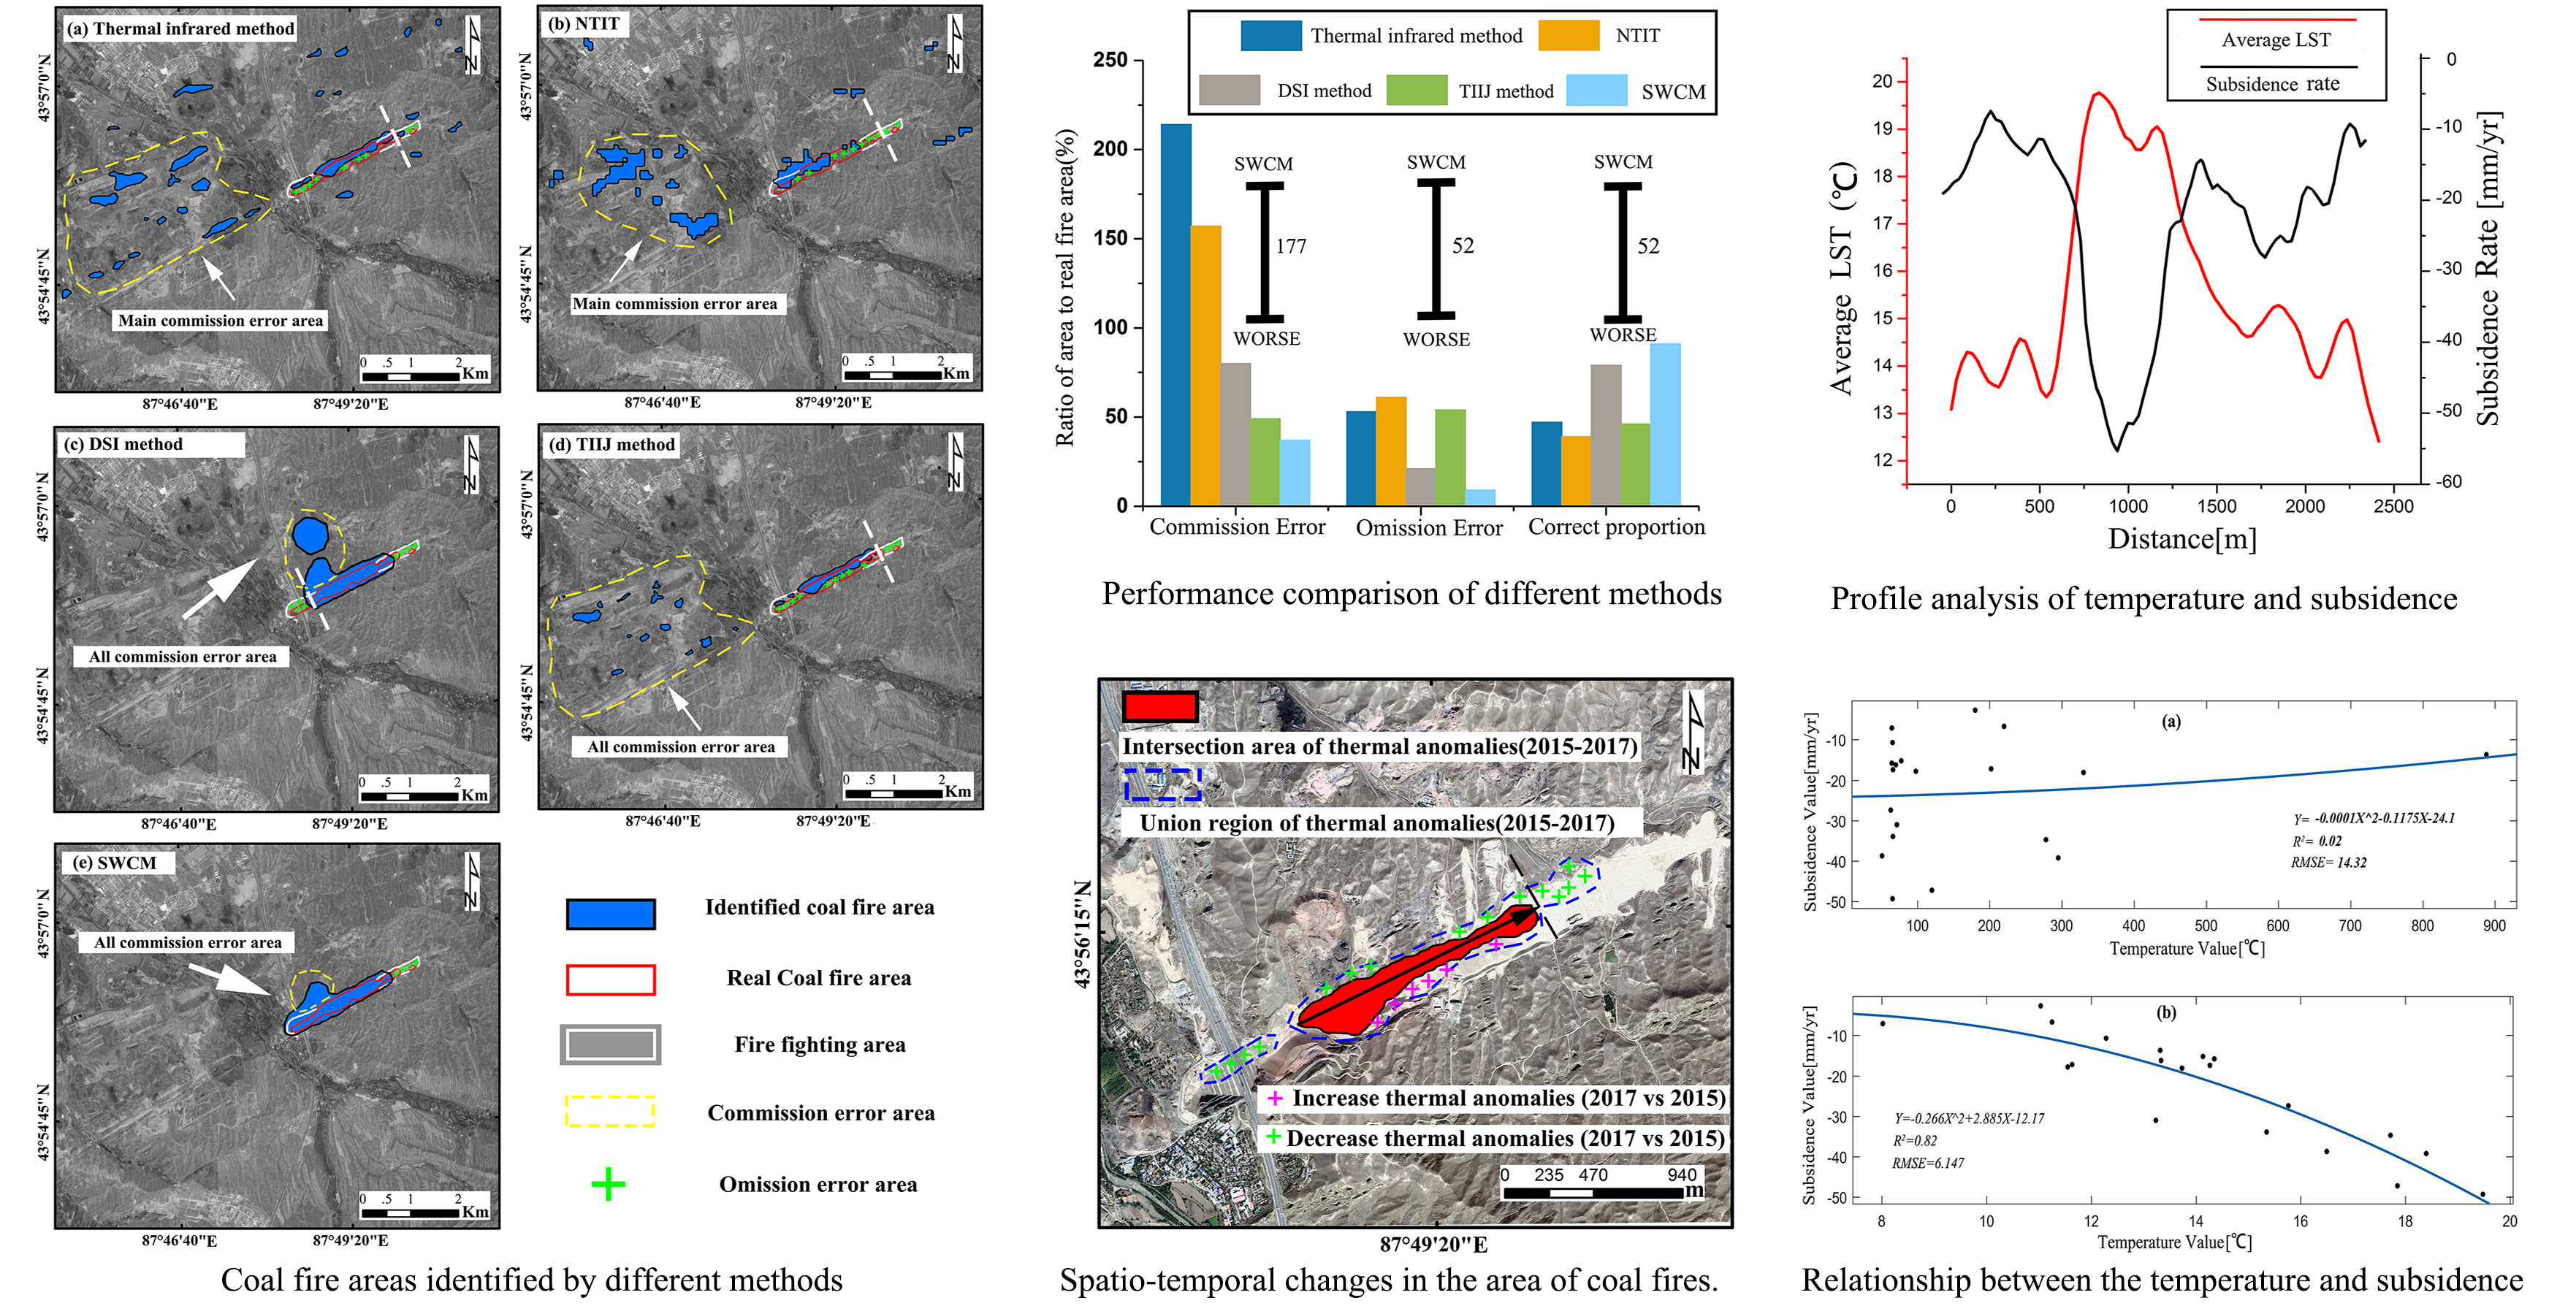
2.1. Study Area

The study area is the Miquan Sandaoba coal fire area located in the south of Miquan City, Urumqi. Its geodetic coordinates are 87°40′–87°50′ E and 43°52′–43°57′ N, and it’s about 8 km from north to south, and about 12 km from east to west, as shown in Figure 1. The study area has a typical temperate continental climate, with a temperature difference of more than 10 °C between day and night, the highest temperature in summer is 41.9 °C, annual precipitation is less than 100 mm, and the climate is hot and dry [20]. The coal in this area has a high tendency for spontaneous combustion, and the degree of deterioration is low. In addition, the coal seam is buried shallow, the thickness of the coal seam is large, and the characteristics of mostly inclined coal seams make the coal fire disaster more serious. The Miquan Sandaoba coal fire areas are a typical case of coal fire disasters caused by abandoned coal kilns. Although the fire extinguishing project began in 2017, the Miquan Sandaoba coal seam is mostly thicker than 10 meters, and the coal seam inclination is mostly 70°. Additionally, there are many fissures around the coal fire areas, the fire is fierce and spreading rapidly, so the task of fire extinguishing is very arduous.
From Figure 1c, we can see a lot of smoke from the coal fires. During the field investigation in the Miquan fire area, it was found that the surface temperature of the fire area was relatively high, and the coal seam in most areas was shallow, so the heat of the coal fire could be conducted to the ground. There are many cracks, fissures, soil pits, and other subsidence phenomena, and the vegetation in the fire area is sparse. At the same time, there are many historical mining areas in Xinjiang. Most of the coal fires are formed because the abandoned small coal kilns have not been effectively and safely engineered. The mining areas and the coal fire areas are staggered. Many abandoned mining areas are at risk of coal fire disasters.
Figure 1d shows the classification results of the ground features in the study area obtained by using the random forest distribution method. It can be seen from the figure that the ground features in the study area are mostly bare soil and vegetation, with only a few buildings. Statistics show that the construction area of the whole map accounts for 9%, which severely limits the application of traditional time-series DInSAR [24]. Therefore, distributed scatterers (DSs) must be fully excavated for subsidence monitoring in the study area to meet the need for coal fire monitoring.

2.2. Datasets

This research uses Landsat8 data to obtain temperature and NDVI information, and the spatial resolution of the thermal infrared band is sampled to 30 m, which is the same as that of the visible light band. The specific data information is shown in Table 1.
The radar images used in this research are Sentinel-1A data, the azimuth and range resolutions are around 5 m and 20 m respectively, and the polarization mode is VV. We select 38 images from January 2015 to December 2017, the master image is 6 May 2016, and the resolution of the external digital elevation model (DEM) is 90 m.

3. Methods

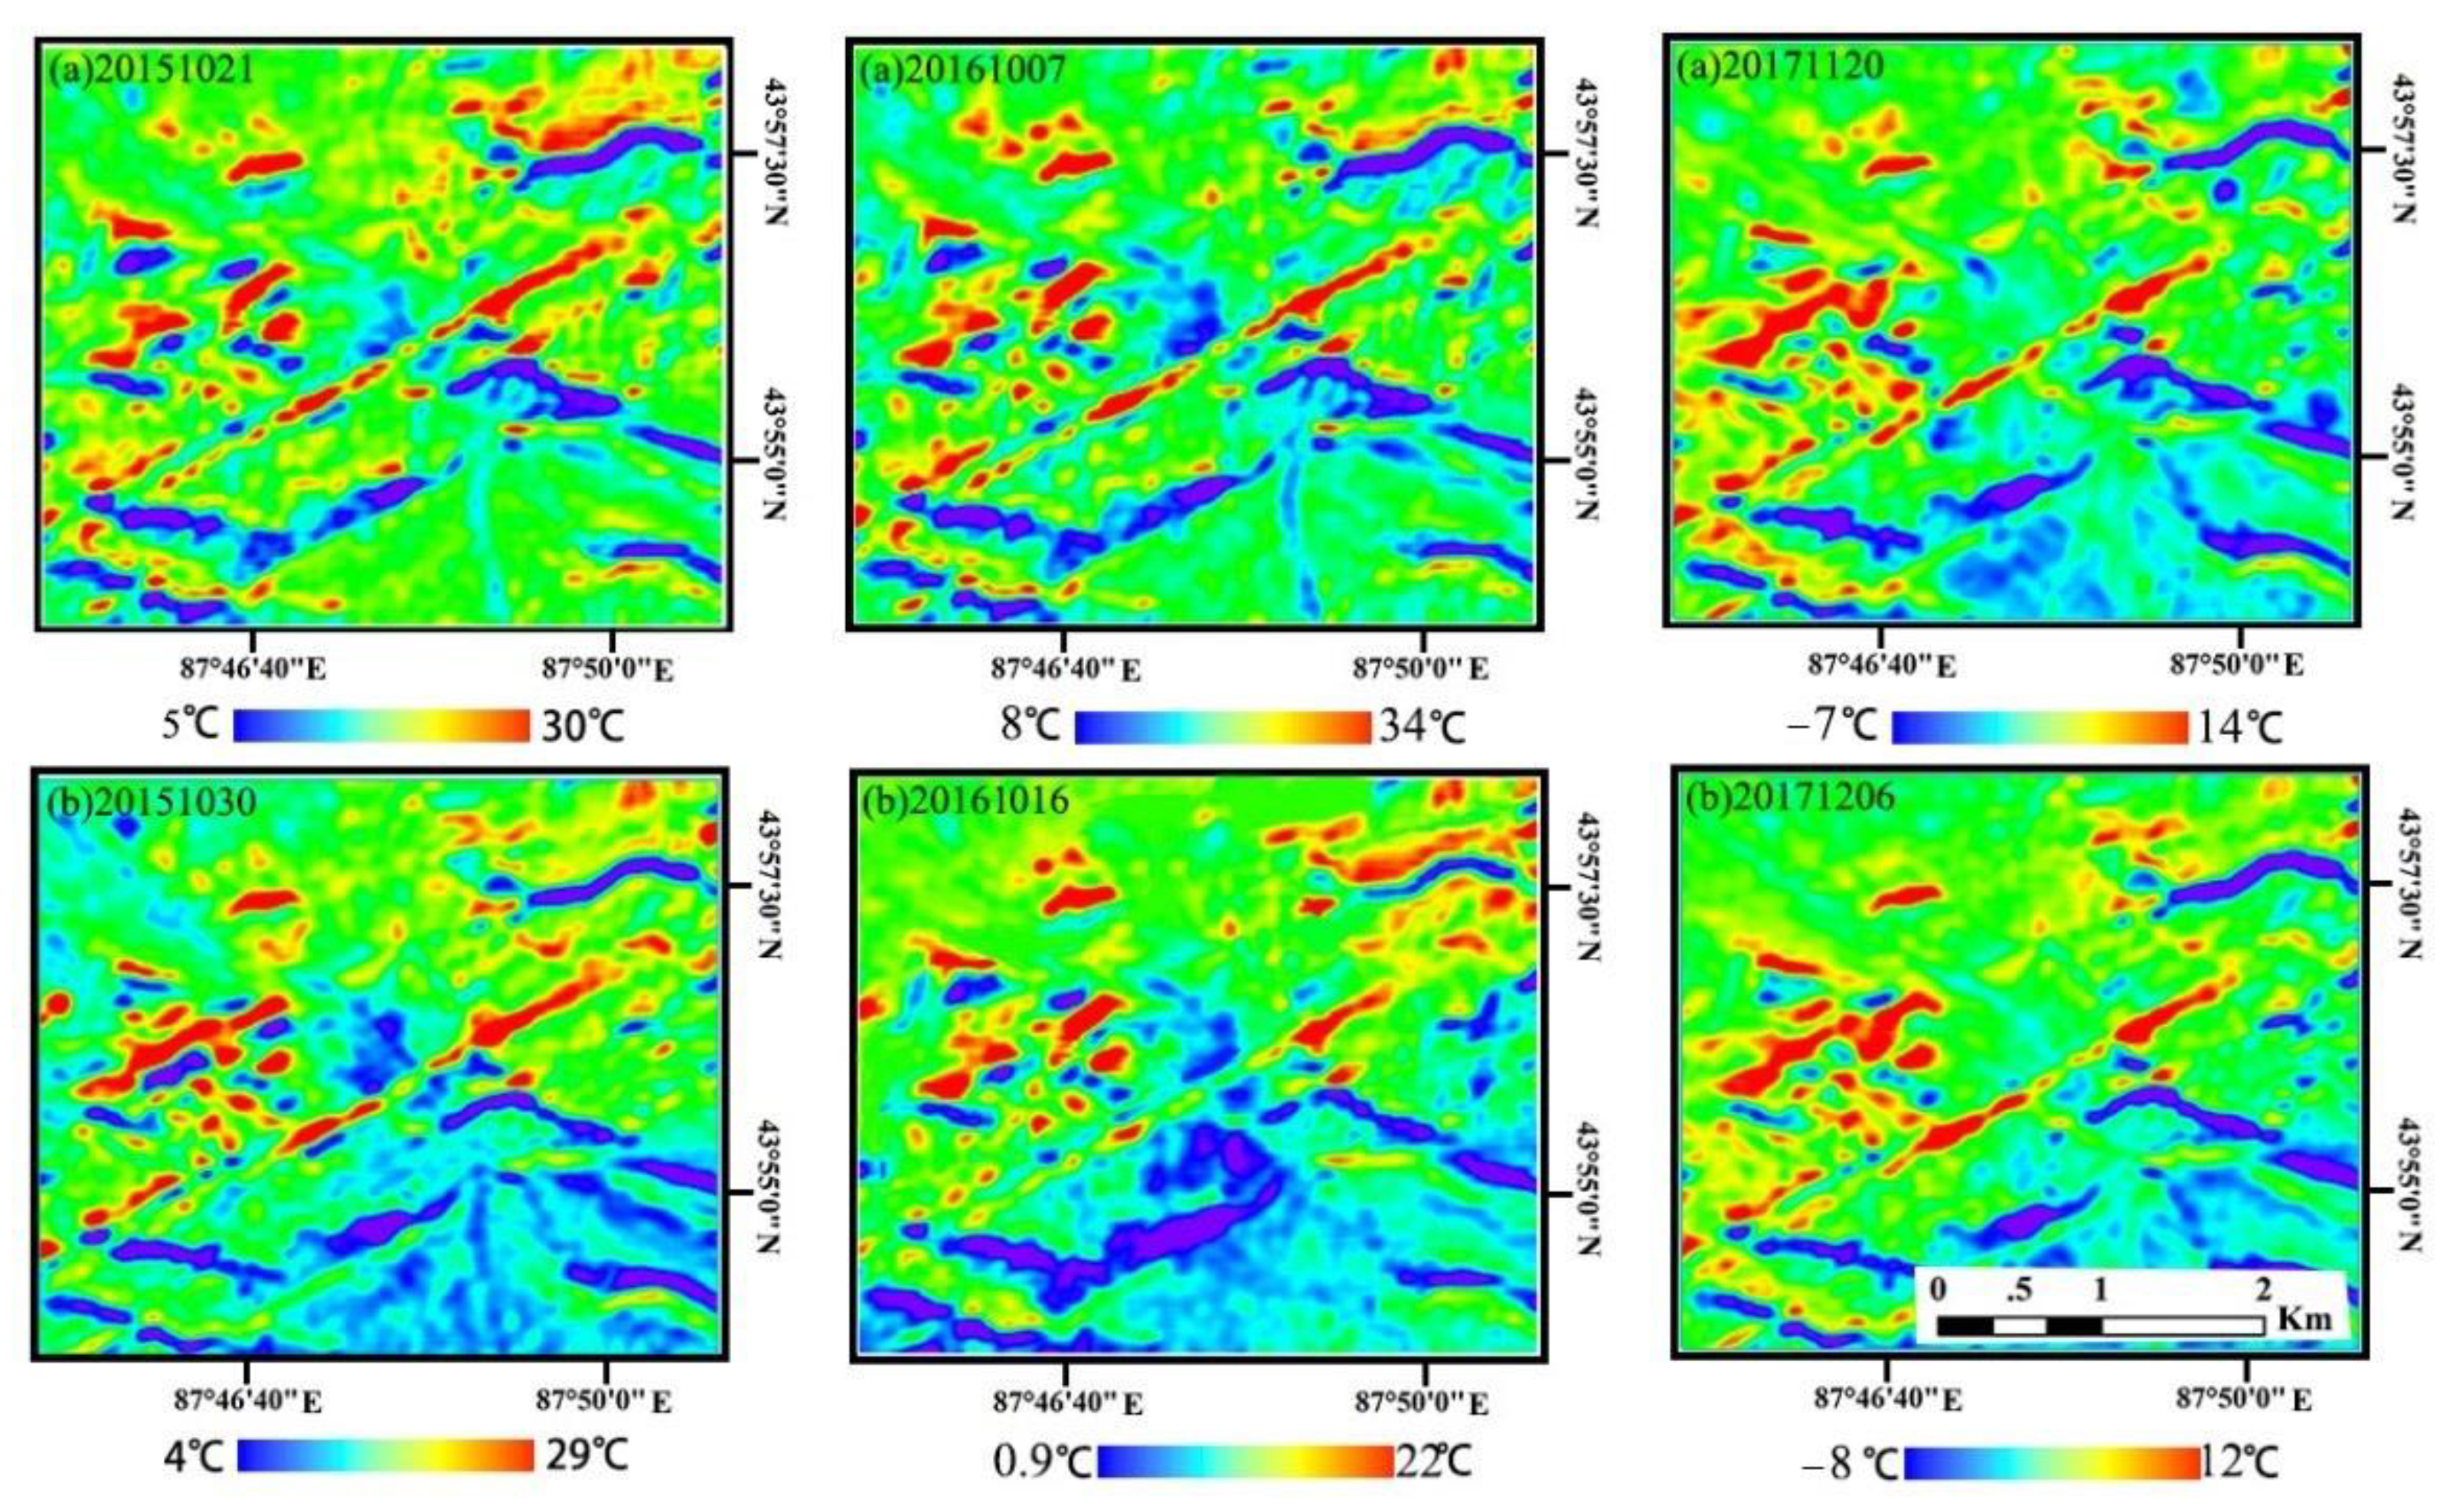
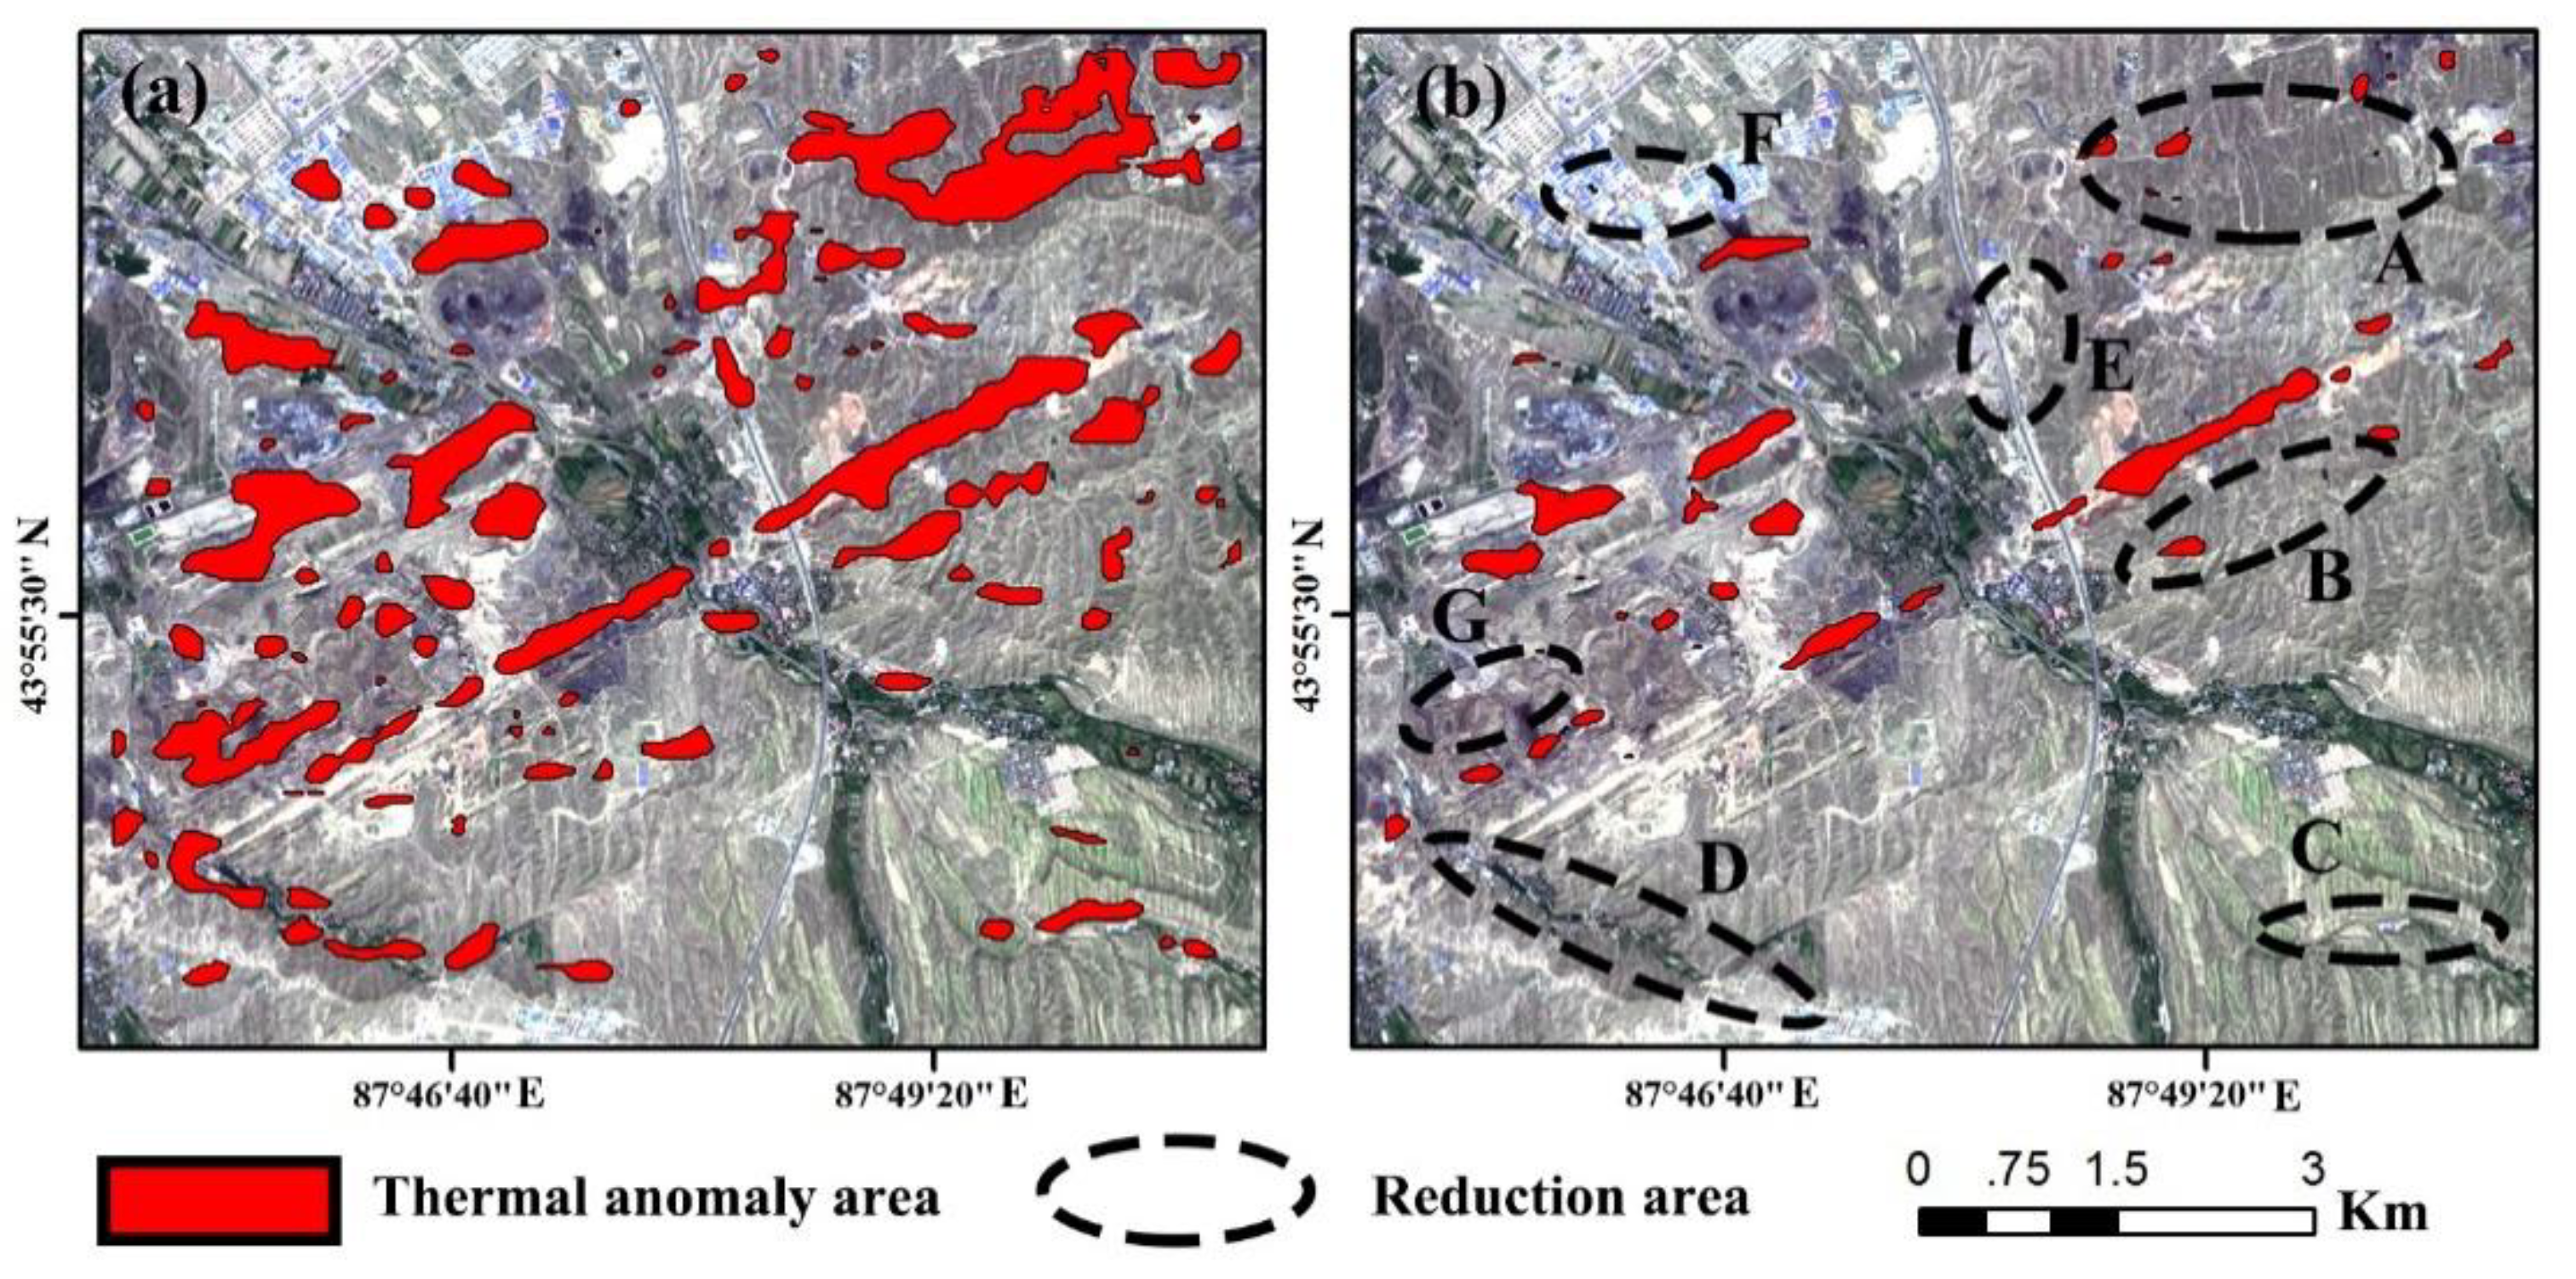
3.1. Temperature Inversion and Thermal Anomaly Extraction

The temperature inversion method used in this research is a universal single-channel algorithm proposed by Jiménez-Muñoz [25]. In the processing, a more advanced emissivity calculation method [26] is adopted while taking into account terrain correction [27]. The main steps include data preprocessing, terrain correction, calculation of surface emissivity, and calculation of atmospheric water vapor.
There are many methods for extracting thermal anomalies in the coal fire areas, such as the fixed threshold method [28], composite pixel method [29], multi-field superposition method [13,30,31], etc., each of which has its own applicable conditions. In order to monitor coal fire dynamics, this research inverts multi-scene thermal infrared images and uses a self-adaptive gradient-based thresholding method (SAGBT) to extract thermal anomalies [32]. This method can generate an adaptive threshold based on the temperature value of each image to extract thermal anomaly areas. It has been proven in the relevant literature that it has good stability in the long-time span. The core idea of this method is to detect the high-temperature edge of the coal fire areas and use the average value of the edge areas as the thermal anomaly threshold. On this basis, the sequence superposition step of adjacent images is added. Considering that the coal fire areas will not change significantly in a short time, the sequence superposition of two adjacent thermal anomaly areas with a short time interval can reduce the error, and the intersection area is the final thermal anomaly area of this year.

3.2. NDVI Inversion

The study area has snow cover on the ground from December to early March of the following year and the frozen soil is widely distributed. However, since the temperature rebounded in mid-to-late March, vegetation began to grow. In order to prevent the growth cycle of different types of vegetation and the time fluctuations of the annual temperature rise, this research uses (1) to retrieve the NDVI information of the multi-scene data [33]. Through comparative analysis, we find that the vegetation in the study area is the most vigorous period from April to May, and the NDVI decreases significantly from July to September. Based on the above results, the following uses the NDVI results in the study area from April to May to assist in the identification of coal fire areas.
N D V I = ρ r e d ρ n i r ρ r e d + ρ n i r
In (1), NDVI is the vegetation index, ρ n i r is the reflection value in the near-infrared band, ρ r e d is the reflection value in the infrared band.

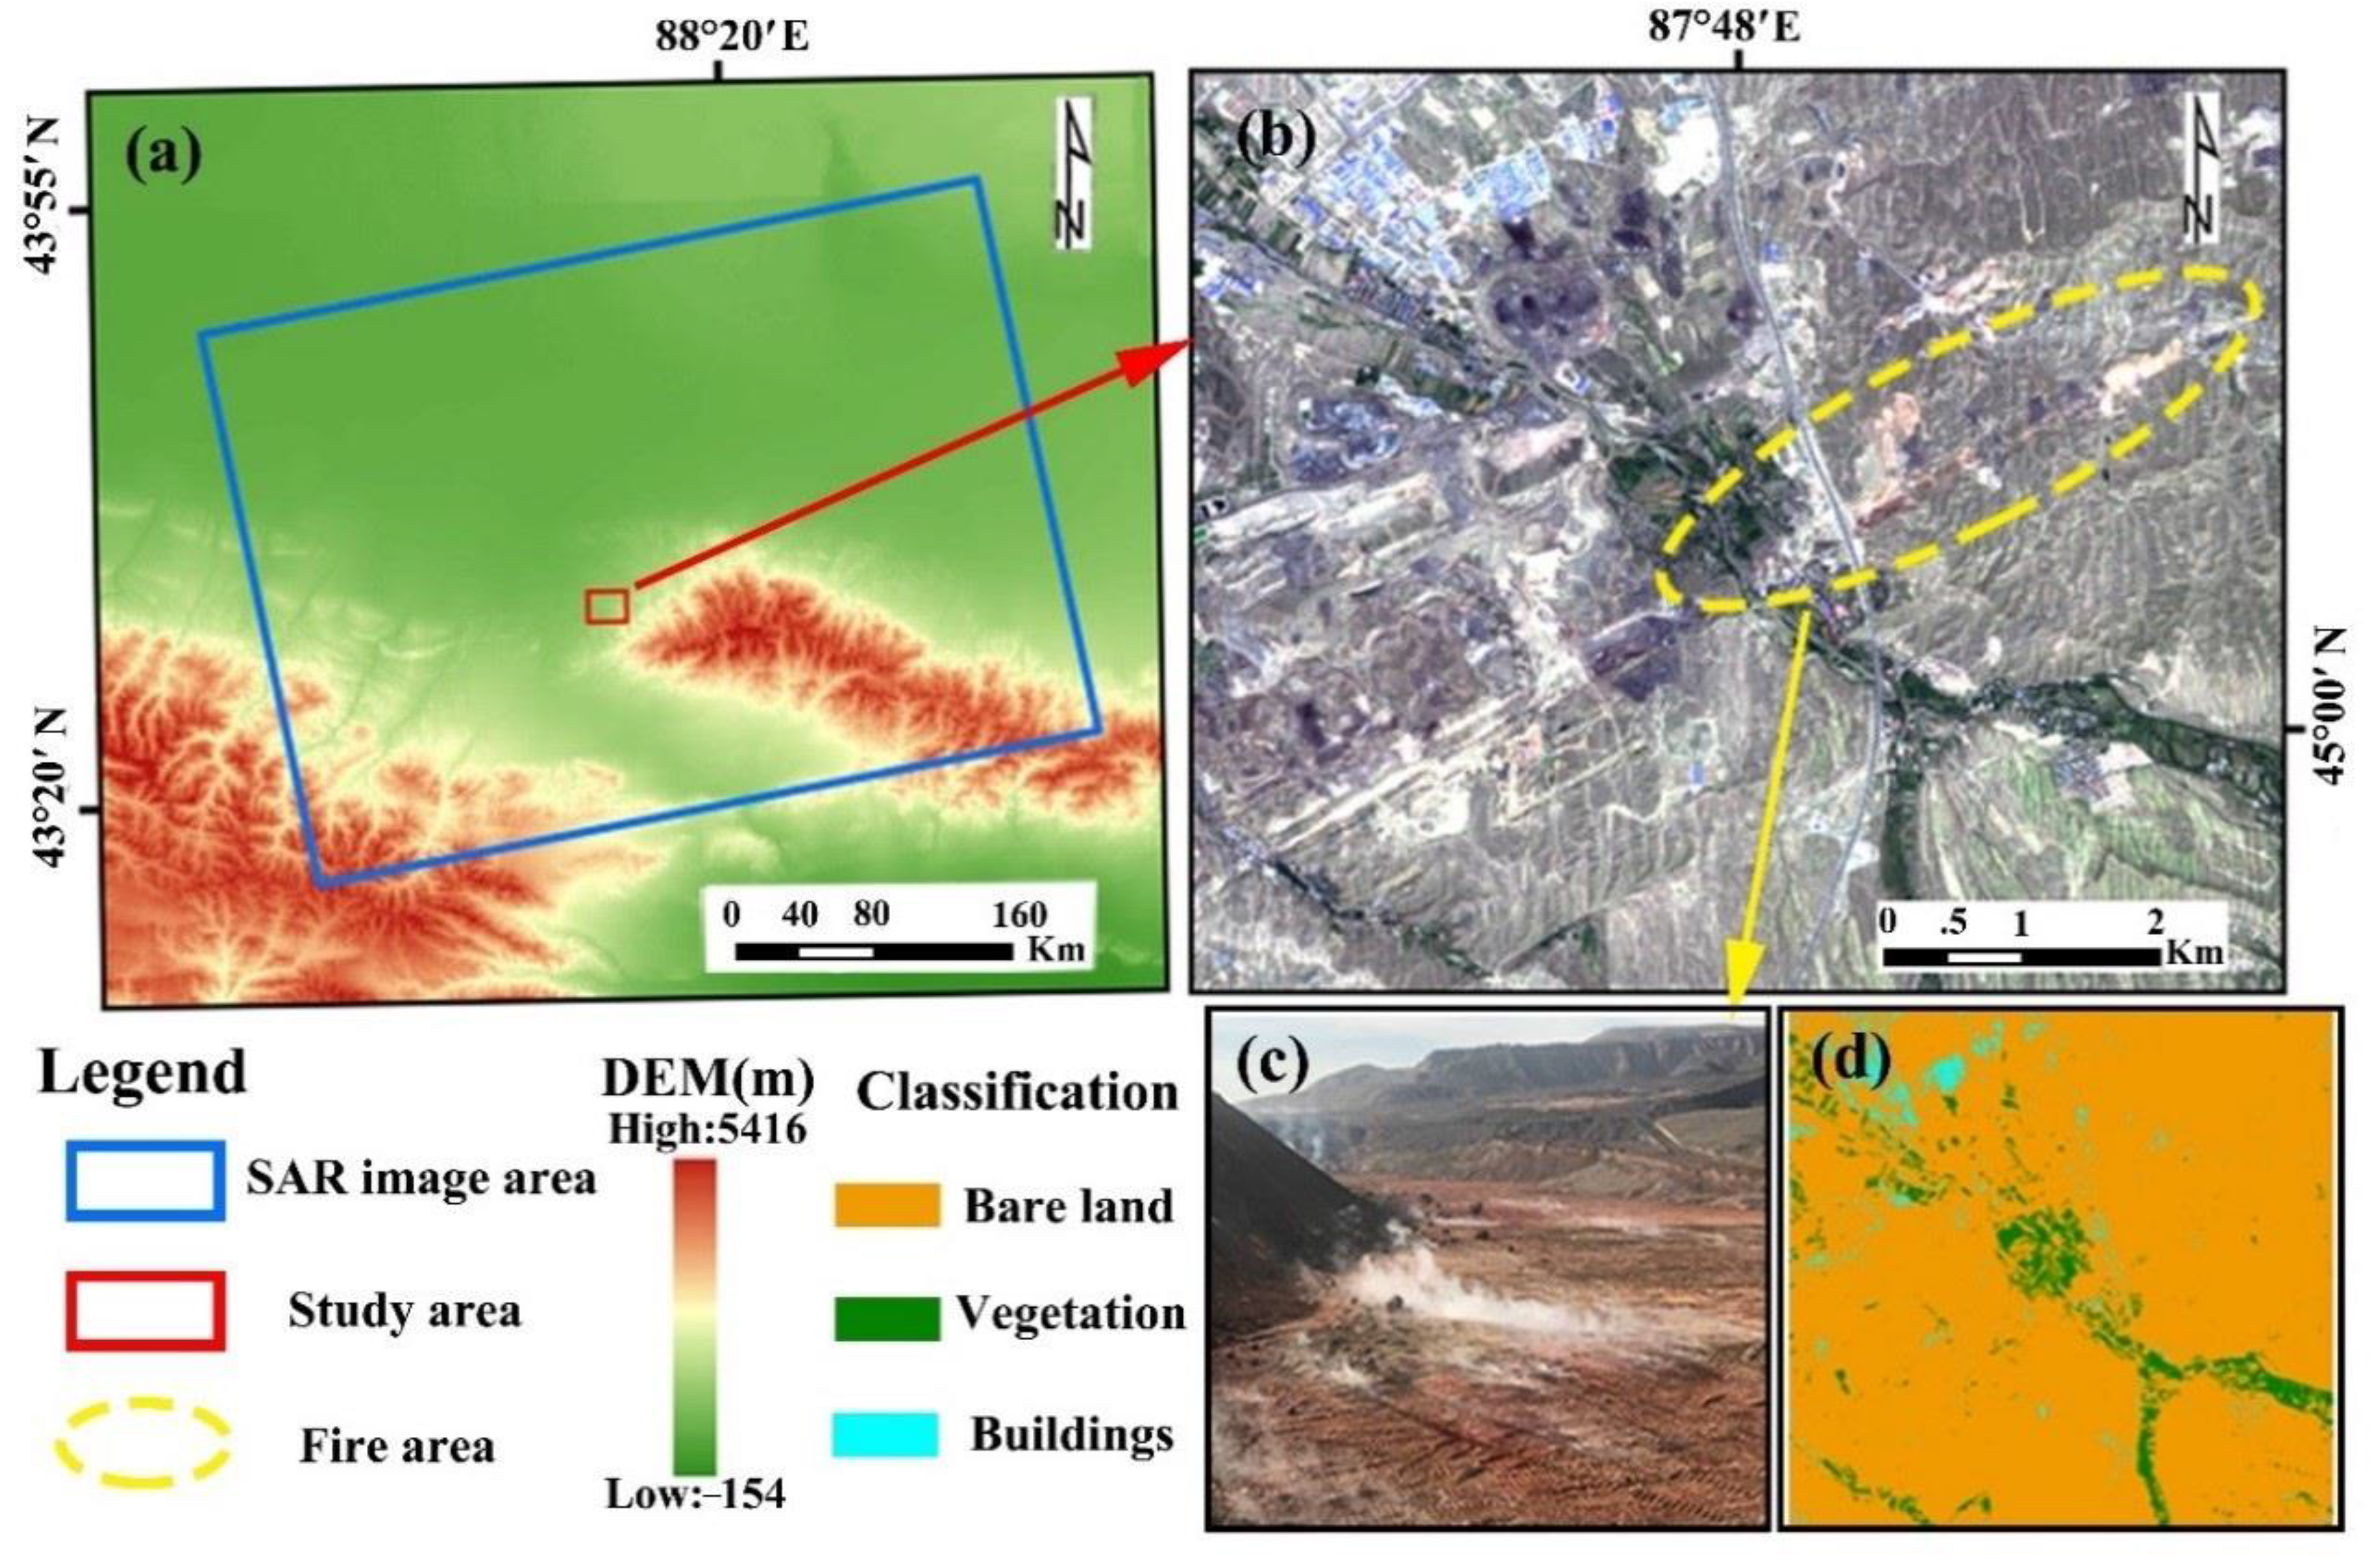
3.3. Subsidence Information Inversion

The distributed scatterer interferometry (DSI) technology used in this research first selects distributed scatterers (DSs) and then integrates DSs and Persistent Scatters (PSs) into StaMPS for subsequent processing. The DSI process includes homogeneous pixel identification and phase optimization steps. In order to maintain efficiency and accuracy, this research adopts a combination of two-sample t-test and sample coherence matrix eigenvalue decomposition (EVD) for DSI homogeneous pixel identification and phase optimization [20].
To illustrate the advantages of DSI in coal fire area monitoring, the ground subsidence results obtained by persistent scatter interferometry (PSI) and DSI over the study area are shown in Figure 2. It can be seen from Figure 2a that the number of PSs is very rare, and the subsidence distribution trend is not obvious. The number of DSI subsidence monitoring points is 64,254, which is 124 times that of PSI. It can be clearly seen that there are three serious subsidence areas, A, B, and C, in the study area from the DSI-derived result.

3.4. Joint Processing of Three Remote Sensing Parameters

Underground coal fire generates heat, and the combustion process also changes the volume and mechanical properties of surrounding rocks, causing surface collapse. The high temperature caused by coal fires and the precipitated sulfides can seriously hinder vegetation growth. The above phenomena are shown as thermal anomalies in thermal infrared images, small subsidence in time-series interferometric signals, and sparse vegetation in optical images [34]. In addition, after initial experimental investigations, we found that Xinjiang coal fire areas and mining areas are staggered. Several thermal anomaly regions exist in the study area, and some thermal anomaly regions include ground objects with low specific heat capacity affected by solar radiation. This can cause non-coal fire thermal anomaly areas and non-coal fire subsidence areas, which makes it difficult to identify coal fire areas by simple remote sensing technology. To this end, in this study, a multi-source remote sensing method, named SWCM, is proposed for the detection of coal fire areas. This method takes into account the characteristics of thermal anomalies, subsidence, and NDVI and adopts a strong constraint process (SCP) and weak constraint process (WCP) for the identification of fire areas. Among them, the SCP can reduce the influence of non-coal fire-related thermal anomalies and subsidence on coal fire detection, effectively ensuring that the identified fire areas are the real fire areas, while the WCP compensates for the omission error of the fire areas caused by the harsh conditions of the SCP. The flow chart of the method is shown in Figure 3.

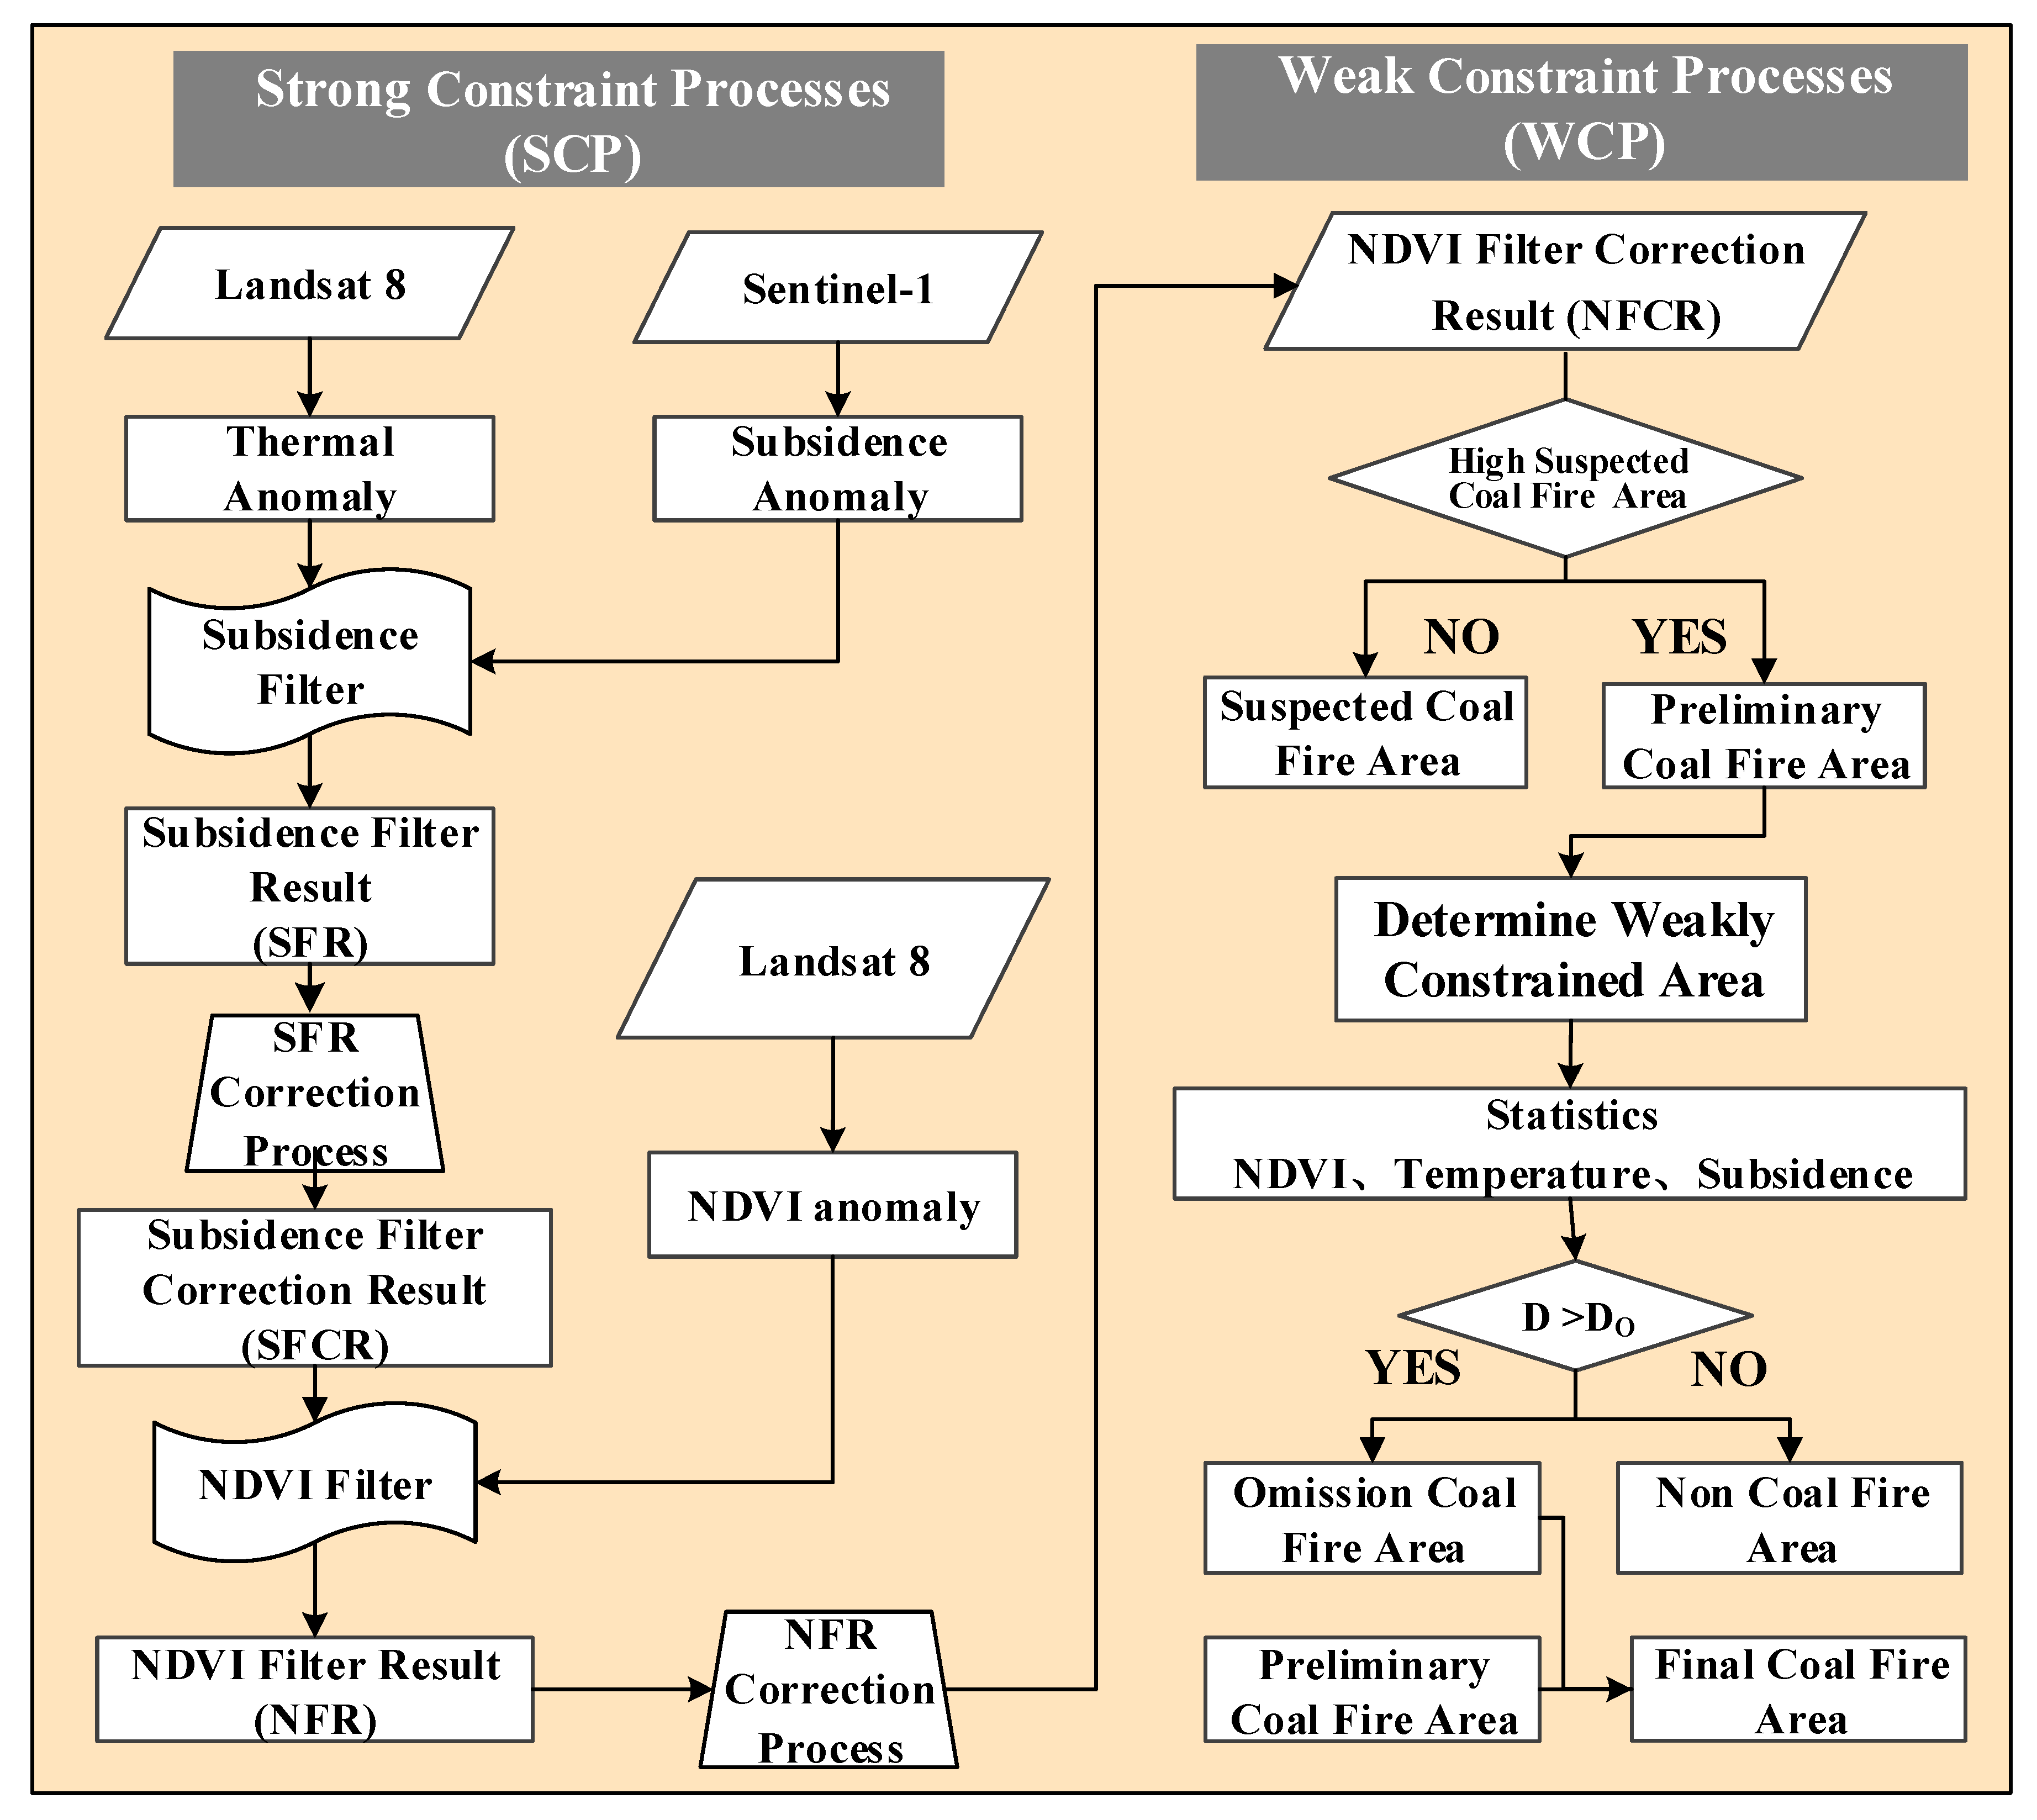
3.4.1. Strong Constraint Process

SCP is used to combine three kinds of information sequentially through filtering and filtering result correction. It is worth mentioning that the reason for combining the three kinds of information sequentially is that the combination process requires filtering and filtering correction, and the NDVI fusion is based on the results of subsidence filtering correction. This process is mainly divided into the following steps:
  • Reasonable thresholds are established to extract thermal anomaly, subsidence anomaly, and NDVI anomaly areas. The thresholds corresponding to thermal, subsidence, and NDVI anomalies are obtained by the self-adaptive gradient-based thresholding (SAGBT) method [32,35], the standard deviation of subsidence based on distributed scatterer interferometry (DSI) [36,37,38], and the sum of the mean and standard deviation of NDVI, respectively.
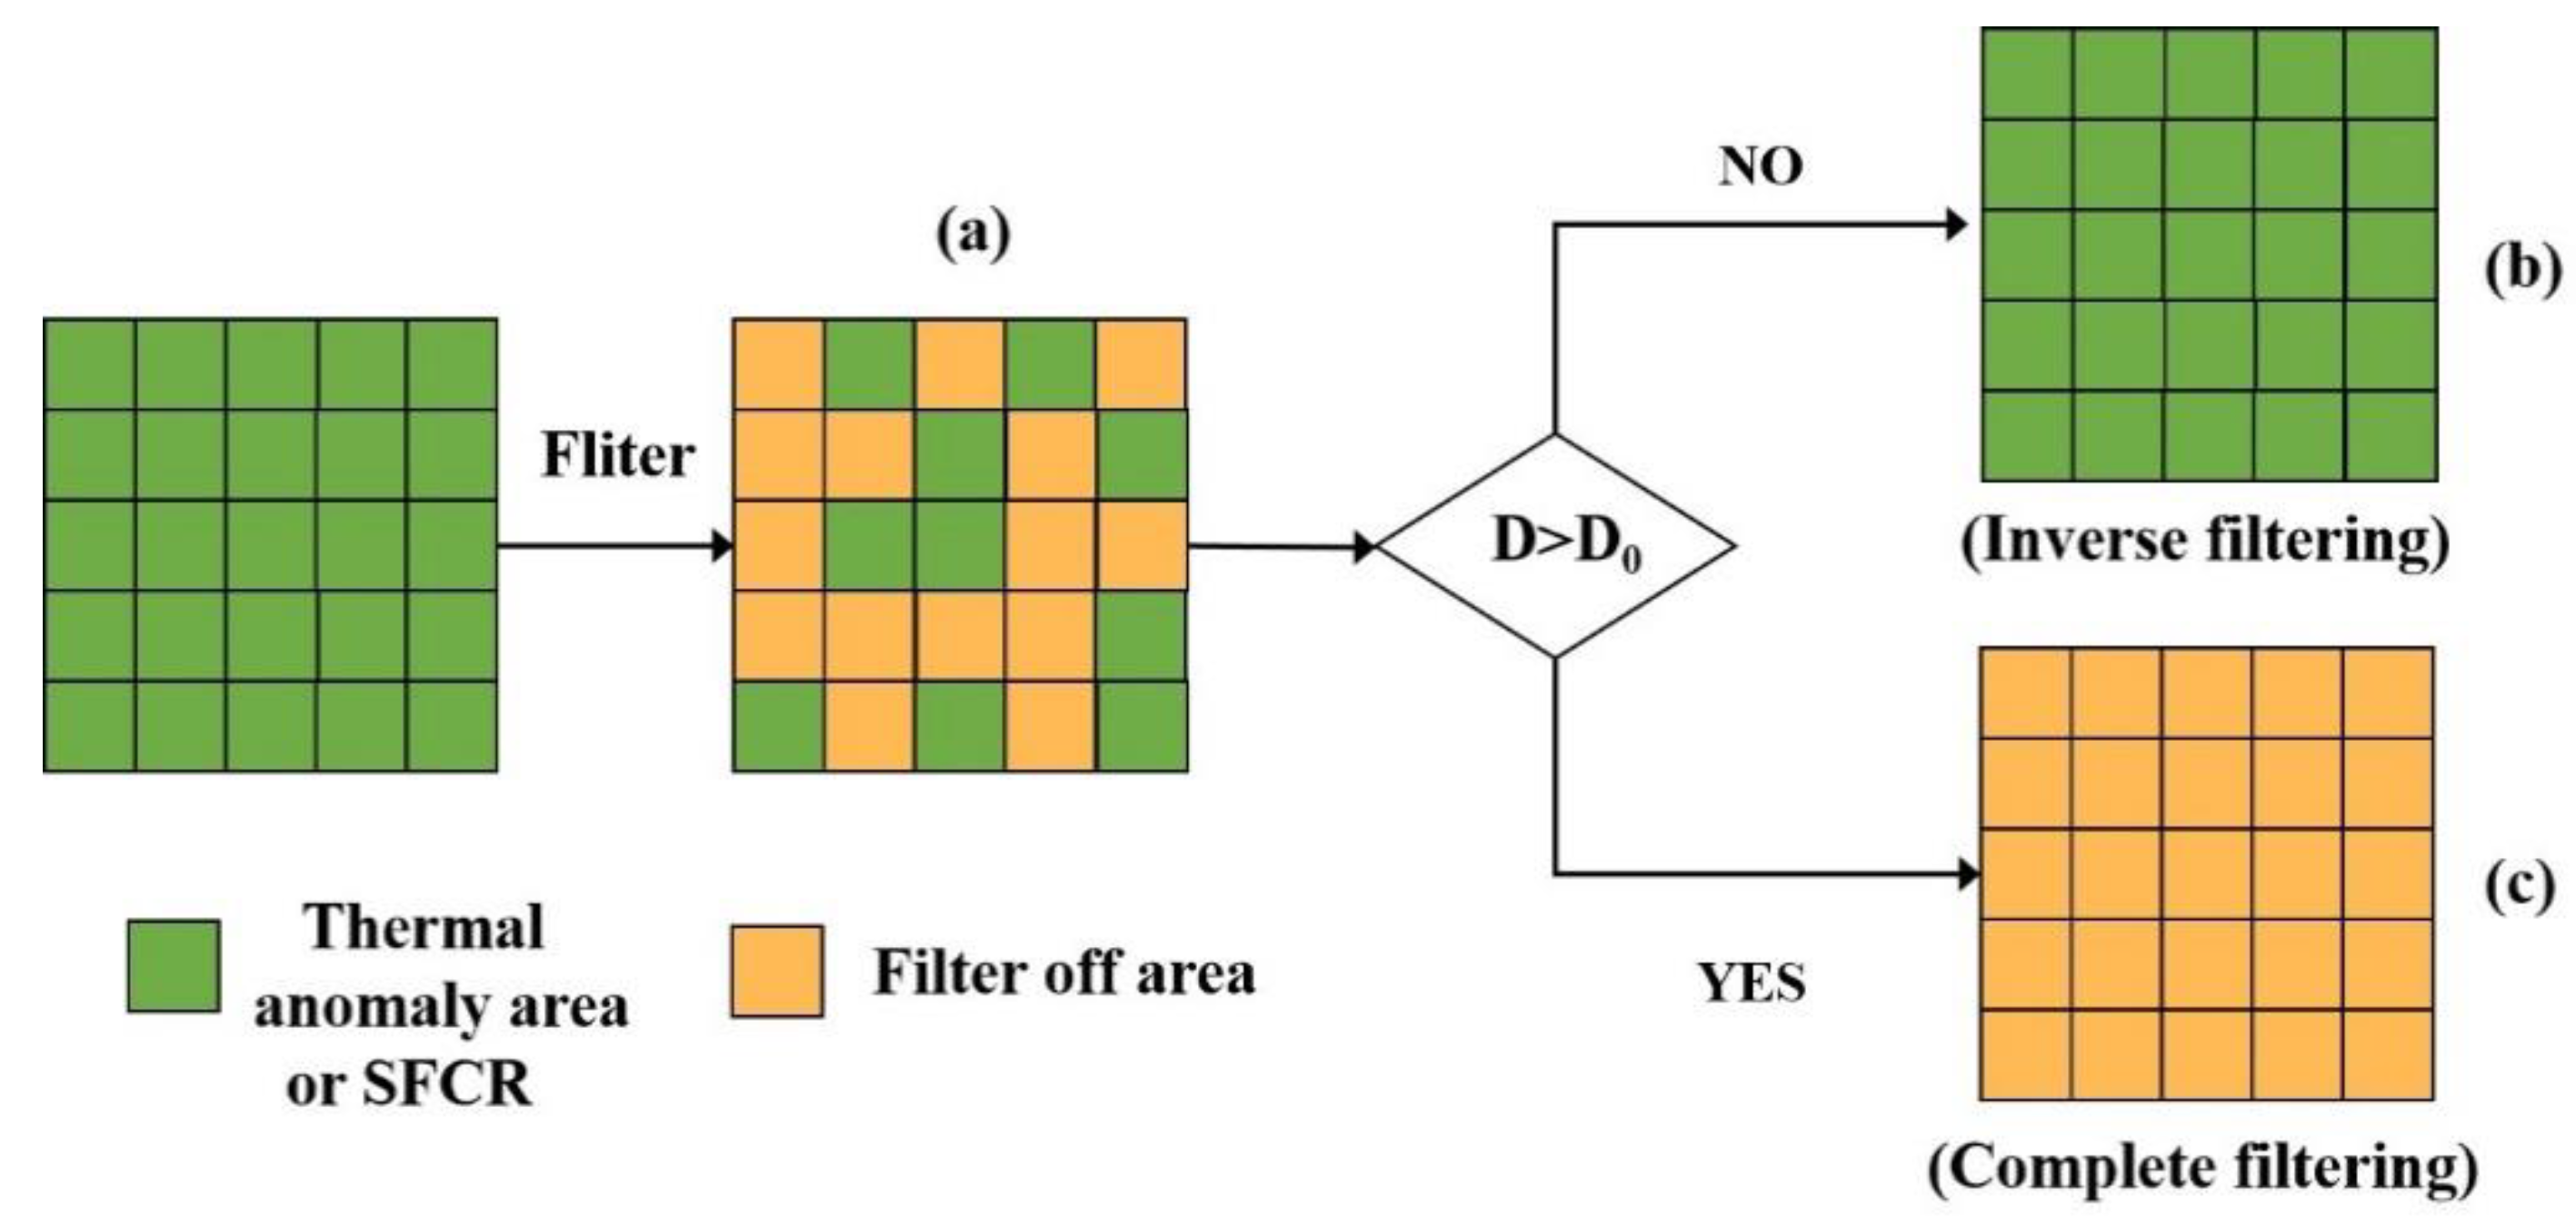
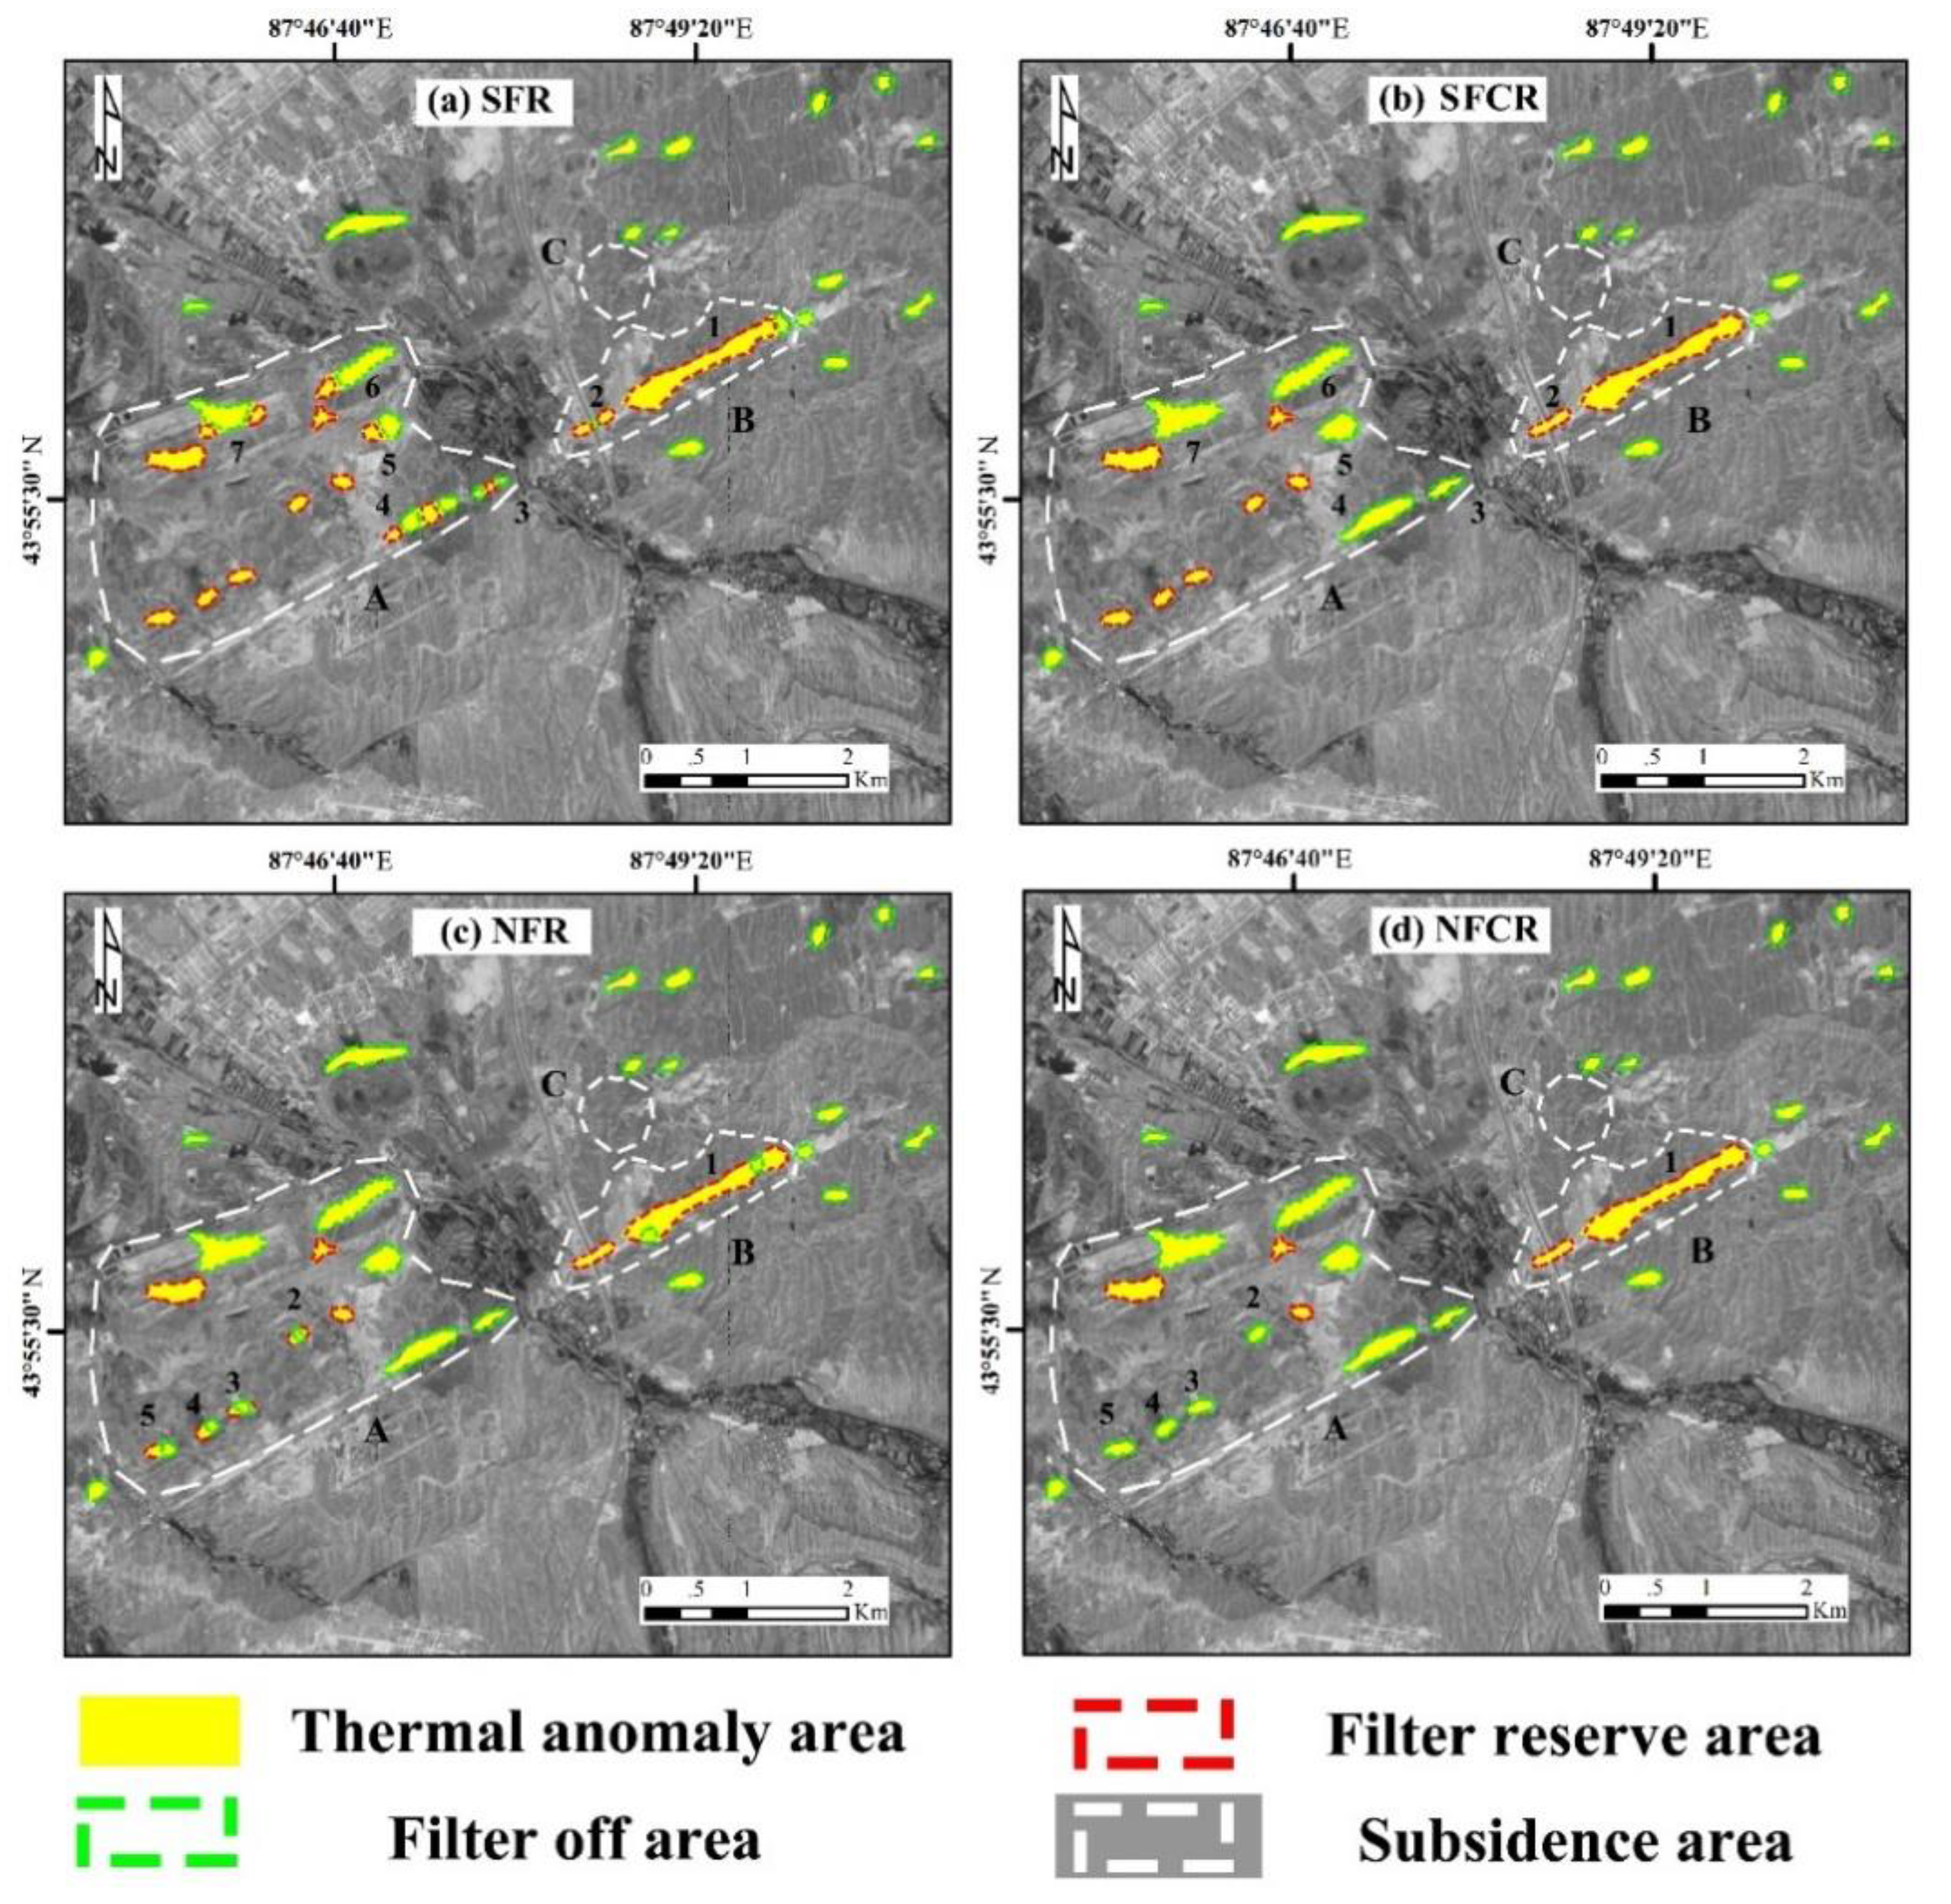
  • A subsidence filter is prepared to filter the thermal anomaly area for obtaining the subsidence filtering result (SFR), which is then corrected to attain the subsidence filtering correction result (SFCR).
  • NDVI filter is prepared to perform NDVI filtering on SFCR to obtain the NDVI filtering result (NFR), which is then corrected to derive the NDVI filtering correction result (NFCR).
Specifically, the subsidence filter is a 0–1 filter, which is constructed by the subsidence anomaly threshold [34]. The thermal anomaly area whose subsidence rate is smaller than the subsidence anomaly threshold can pass through the filter, and the thermal anomaly area with no surface subsidence or low subsidence rate cannot pass through the filter. The SFR is the area where the thermal anomaly and the subsidence anomaly overlap. This can indeed reduce the part of surface thermal anomaly caused by some ground objects with low specific heat capacity (such as sandstone), but some coal fire areas may not have subsidence, which can lead to omission error of coal fire areas. In addition, thermal anomalies and subsidence anomalies related to non-coal fires can affect the detection of coal fires. For example, thermal anomalies and subsidence anomalies of ground objects with low specific heat capacity in mining areas often occur at the same time, which can lead to the commission error of coal fire areas.
To reduce the commission and omission error of the coal fire areas caused by the subsidence filtering process, the SFR needs to be corrected. In-situ investigations have revealed that thermal anomalies and subsidence are widely distributed in coal fire areas, and thermal anomaly areas are distributed in blocks. In addition, some other studies found that the thermal anomaly and subsidence in the fire areas have a good overlap degree [17,18]. Therefore, in this research, it is assumed that in most areas of the thermal anomaly areas meet the subsidence threshold, then the probability of coal fire in the thermal anomaly area is high, and vice versa. Most areas of a thermal anomaly area do not meet the subsidence threshold, so the thermal anomaly area is highly likely to be an area with low specific heat capacity in which there is a low probability of coal fires. However, during the process of subsidence filtering, only a few areas meeting the subsidence threshold in this kind of thermal anomaly area will be retained, which may easily cause commission errors of the coal fire areas. Further, if most areas of a thermal anomaly area meet the subsidence threshold, the probability of the thermal anomaly area being coal fire is high, but a few areas in this kind of thermal anomaly area that do not meet the subsidence threshold will be discarded in the process of filtering. This may result in omission errors of coal fire areas. The probability of coal fire can be obtained by setting the subsidence filtering loss ratio (SFLR), which is calculated by Equation (2). Then, the SFLR value of 50% is considered as the cut-off value of coal fire and non-coal fire, i.e., the subsidence filter correction threshold (SFCT) is set to 50%. Finally, SFLR is compared with SFCT to correct the SFR. In this research, the SFCT is set to 50%, which is determined based on the study area and field investigations.
S F L R i = S L i T A i 100 %
where i is the number of thermal anomaly areas. SL is the loss area after subsidence filtering, and TA is the area of the original thermal anomaly.
Figure 4 shows a schematic of the filtering correction process. The SFR is similar to the result of Figure 4a, which is obtained by the subsidence filtering method. Then, SFCT is set to correct the SFR, and the final SFCR is obtained. SFCR is similar to the result of Figure 4b or Figure 4c, which depends on whether the SFLR of SFR meets the SFCT. The SFR whose SFLR is smaller than the SFCT is inversely filtered to restore the original thermal anomaly area (Figure 4b), and the SFR whose SFLR is larger than the SFCT is completely filtered out (Figure 4c).
Since it is assumed that the filtered areas cannot be coal fire areas, so regardless of the filtering and filtering correction results, we only focus on the filter reserve areas. For the sake of clarity, the filter reserve areas represent the results of filtering and filtering correction.
Since it is difficult to determine an accurate SFCT and it is set roughly, there are still some errors in SFCR. Therefore, it is necessary to find another parameter in the physical and chemical changes caused by coal fires to correct the SFCR. We now describe how to use NDVI to correct the SFCR.
The step of preparing the NDVI filter is similar to the second step, and the NDVI filter is used to filter the SFCR. The SFCR whose NDVI is smaller than the NDVI anomaly threshold can pass through the filter and vice versa. Then, the NFR is obtained.
NFR also needs to be corrected to obtain the NFCR. This is because a small amount of surface or the surrounding area of underground coal fire areas and mining areas still have sparse vegetation after investigation. If the NDVI filter is directly used to filter out the SFCR, it can lead to omission and commission errors of coal fire areas. Fortunately, the NDVI of the coal fire area is affected by both high temperature and subsidence, so the overall NDVI loss is higher [9]. In this study, it is assumed that if most areas of the SFCR area meet the NDVI threshold, then the probability of coal fire in the SFCR area is high, and vice versa. Most areas of the SFCR area do not meet the NDVI threshold, so the SFCR area is highly likely to be a non-coal fire area, which has a low probability of coal fires. However, in the process of NDVI filtering, only a few areas meeting the NDVI threshold in this kind of SFCR area will be retained, which may easily cause commission errors of the coal fire areas. Further, if most areas of an SFCR area meet the NDVI threshold, the probability of the SFCR area being a coal fire is high, but a few areas in this kind of SFCR area that do not meet the NDVI threshold will be discarded during the filtering process. This may lead to omission errors of coal fire areas.
Then, the NDVI filtering loss ratio (NFLR) is used to express the probability of coal fire. Subsequently, the NFR can be corrected by comparing NFLR with the NDVI filtering correction threshold (NFCT). The correction process is shown in Figure 4. The NFLR is calculated as follows:
N F L R i = N L i O S i 100 %
where i represents each SFCR. NL is the loss area after NDVI filtering, and OS is the original area of SFCR.
However, the NFCT cannot be set directly to correct the result. Since mining itself has an inhibitory effect on vegetation growth, the ability of NDVI information to distinguish coal fire areas is reduced to a certain extent. In this study, the risk level of suspected coal fires in different subsidence areas is firstly determined, and the NFCT is evaluated by some weighted calculations. Here, the risk level of suspected coal fires is determined only for the subsidence area because the coal fire in Xinjiang is mostly developed from the historical goaf. In addition, the risk level of suspected coal fire can’t be evaluated in the subsidence area without thermal anomaly in this research. The specific flow chart is shown in Figure 5.
The two parameters on the far left of Figure 5 indicate the index parameters for evaluating the risk level of suspected coal fires. They are the total loss ratio of subsidence filtering (TLRSF) and the ratio of thermal anomaly area to subsidence area (ARTS). The two parameters are calculated as follows:
T L R S F j = S L i j T A i j 100 %
A R T S j = T A i j T S A j 100 %
where j is the number of subsidence areas (see Figure 2 for subsidence distribution), i is the number of thermal anomaly areas. SLij is the total loss area after subsidence filtering, TAij is the total area of the original thermal anomaly. TSA is the total area of the subsidence region.
The TLRSF serves as the criterion for the evaluation of the risk level of suspected coal fires. Thermal anomalies and surface subsidence are the two major characteristics of coal fire areas. A large value of TLRSF indicates that most thermal anomaly areas do not meet the subsidence threshold, which means that the probability of coal fire is low. These thermal anomaly areas are more likely to be ground objects with low specific heat capacity. The larger the value, the lower the risk of suspected coal fires.
The ARTS serves as the criterion for the evaluation of the suspected coal fire risk level. Thermal anomalies and surface subsidence are the two major characteristics of coal fire areas, but only a few subsidence areas are thermal anomaly areas, indicating that coal fire may not be the main cause of the subsidence, i.e., the lower the parameter, the lower the risk level of suspected coal fires.
Based on the analysis, the contribution of the above two parameters to the risk level of suspected coal fires is obtained, and an evaluation system table is established with a 20% interval. The quantized value represents the risk level of suspected coal fires, as shown in Table 2. According to Table 2 and the value of the two parameters in different regions, the total quantitative scores of different regions can be obtained. In this study, the total quantitative scores are divided into five risk levels of suspected coal fire by the natural break method, which are extremely low (1–2 score), low (3–4 score), medium (5–6 score), high (7–8 score), and extremely high (9–10 score) risk areas [39].
After determining the risk level of suspected coal fires, the total loss ratio of NDVI filtering (TLRNF) of high/extremely high suspected coal fire risk areas should be obtained, which can be used to analyze the overall situation of vegetation in coal fire areas. The TLRNF is calculated as follows:
T L R N F j = N L i j O S i j 100 %
where j is the number of subsidence areas (see Figure 2 for subsidence distribution), i represents each SFCR. NLij is the total loss area after NDVI filtering, and OSij is the total area of SFCR.
Then, different weights are given to every high or extremely high suspected coal fire risk area according to the total quantitative scores. Finally, the weighted average of TLRNF for every high or extremely high suspected coal fire risk area is obtained, which is the NFCT. Then, according to the NFCT and each NFLR of NFR, the filtering correction process is performed on NFR. The NFR whose NFLR is smaller than the NFCT is inversely filtered to restore the original SFCR, and the NFR whose SFLR is larger than the SFCT is completely filtered out.

3.4.2. Weak Constraint Process

Although the SCP has been corrected by the filtering results, stricter selection conditions may cause omission errors of coal fire areas. For example, the subsidence area without thermal anomaly is not necessarily a non-coal fire area, and it is possible that deep coal fire cannot conduct heat to the ground. Therefore, the WCP is needed to determine whether there are omission errors in the high/extremely high suspected coal fire areas for establishing the final coal fire areas. The main steps are as follows:
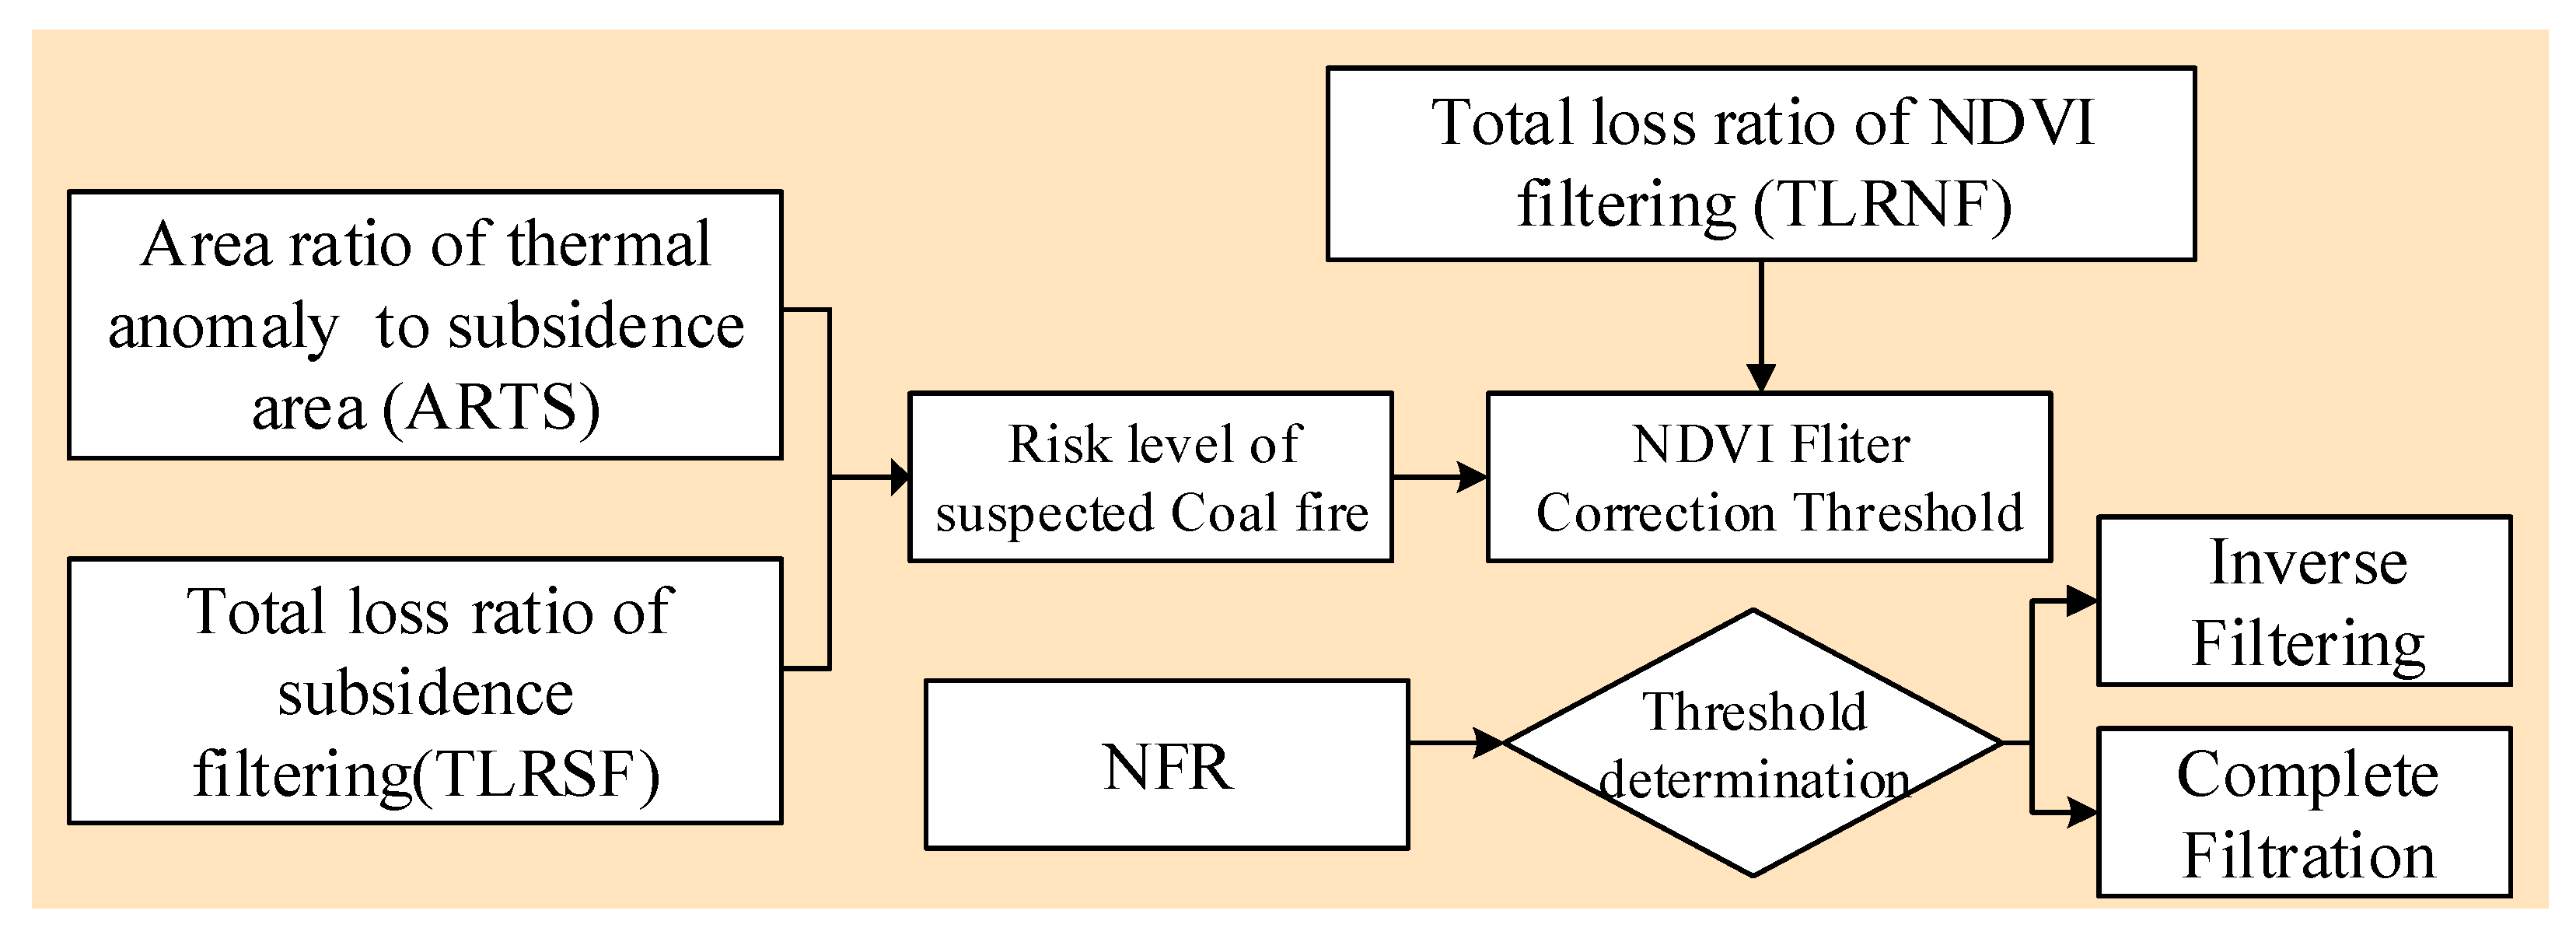
  • According to the risk level of suspected coal fires, the preliminary coal fire areas and the suspected coal fire areas are determined, and the weak constraint determination area is obtained. Specifically, the NFCR in the high/extremely high suspected coal fire area indicates the preliminary coal fire areas, and the NFCR in the other risk levels of suspected coal fire areas indicates the suspected coal fire areas. Then, the areas of the high/extremely high suspected coal fire, except the preliminary coal fire areas, are judged as weak constraint areas.
  • The temperature, subsidence, and NDVI information in the weak constraint areas are statically analyzed. Further, according to the anomaly threshold calculation method described in Section 3.4.1, the threshold values of thermal anomaly, subsidence anomaly, and NDVI anomaly are obtained. The areas that meet any two kinds of anomaly thresholds indicate the omission errors of coal fire areas, otherwise, they are judged as non-coal fire areas.
  • The initial coal fire areas and the omission errors of coal fire areas are the final coal fire areas.

4. Results and Analysis

4.1. Temperature Inversion and Thermal anomaly Extraction

The study area is snow-prone from January to March, which could affect the remote sensing of coal fire signal. Therefore, it is not feasible to use thermal infrared technology to detect coal fire areas in these months. Further, in summer (June-September), the study area is hot and dry, so many ground objects with low specific heat capacity are at a high temperature, which adversely affects the detection of coal fire areas. Combining experimental analysis and local weather data, we found that October to December is a suitable period for using thermal infrared remote sensing technology to detect coal fire areas in the study region. To facilitate time-series temperature monitoring of the coal fire areas, the temperature results of some months from 2015 to 2017 are inversed, as shown in Figure 6.
The thermal anomaly areas in 2015 are extracted using the traditional fixed threshold method and the SAGBT, as respectively shown in Figure 7a,b. It can be seen that compared with the thermal anomaly areas extracted by the traditional method, the ones extracted by SAGBT are significantly reduced. The main reduction areas are bare land (A, B, C, D, E in Figure 7b), buildings (F in Figure 7b), and mining areas (G in Figure 7b). These areas mostly exhibit surface features with low specific heat capacity, so their temperature values are relatively high. After using the SAGBT, the area of thermal anomaly is reduced from 7.2 km2 to 1.5 km2, and the coal fire determination area is reduced by 4.8 times.

4.2. Coal Fire Areas Based on Strong and Weak Constraints

Figure 8 shows the four results (SFR, SFCR, NFR, and NFCR) obtained during the SCP, and the filter reserve areas (red dotted line area) in each figure correspond to a filtering or filtering correction result. The subsidence filter is used to filter the thermal anomaly areas for obtaining the SFR. It can be seen from Figure 8a that the thermal anomaly areas, outside the obvious subsidence area, are completely filtered out, but those marked with numbers in the subsidence areas A and B are partially filtered out. To ensure the accuracy of the filter, the results need to be corrected. First, the SFLR of each SFR is calculated. The SFR is corrected according to the SFCT, and then the SFCR is obtained. After the correction, the thermal anomaly areas that are partially filtered in the subsidence area B are inversely filtered, and they are recovered as a whole, while the thermal anomaly areas that are partially filtered in the subsidence area A do not meet the correction threshold, and they are completely filtered out (Figure 8b). Then, the NDVI filter is used to filter the SFCR, and the NFR is shown in Figure 8c. It is clear from the figure that the areas, which are marked with a serial number, correspond to a small number of filtered areas. This is because the ability of NDVI to distinguish coal fire areas is weaker than subsidence. Next, the NFR should be corrected. First, the two parameters used for evaluating the risk level of suspected coal fires are calculated, as shown in Table 3.
Then, based on the quantization rule in Table 2, the total quantified values of areas A and B are obtained as 2 and 7, respectively. Finally, according to the different risk levels of suspected coal fire determination criteria, we can see that area A is an extremely low suspected coal fire area, while area B is a high suspected coal fire area. Then, the NFCT is evaluated according to the NFCT determination criteria mentioned before, where the NFCT is set to 18.2%. Subsequently, the NFLA of each NFR is calculated, and each NFLA is compared with NFCT. Finally, the NFCR is obtained according to the filtering correction rules. NFCR shows that the areas (no. 2–4) that are partially filtered out in subsidence area A do not meet the correction threshold. Therefore, the areas with no. 2–4 are completely filtered out, and the thermal anomaly areas in the subsidence area B meet the correction threshold, so the areas that are partially filtered out are recovered (Figure 8d).
The above results indicate that the area of the retained thermal anomaly region is continuously being reduced during the SCP. Specifically, the area is reduced from the initial 1.54 km2 to 0.445 km2, which corresponds to a reduction rate of 71.1%. The filtering effect is obvious.
The above process completes the SCP, which should be followed by the WCP. According to the law of WCP, the NFCR of subsidence areas B and A indicate the preliminary coal fire areas and the suspected coal fire areas, respectively (Figure 8d). In addition, the regions of area B, except the preliminary coal fire areas, indicate a weak constraint area (WCA). Since the WCA does not meet the thermal anomaly threshold, the subsidence and NDVI anomaly thresholds are calculated based on the above method.
After calculation, it is found that all WCA meet the subsidence anomaly threshold, and only some areas do not meet the NDVI anomaly threshold. The areas that do not meet the NDVI anomaly threshold are concentrated in the upper right corner of WCA. In view of the threshold calculation results, the area where the WCA meets the dual information threshold of subsidence and NDVI are considered as the omission errors of coal fire areas. Finally, the coal fire areas are determined according to the SWCM rules, as shown in Figure 9.

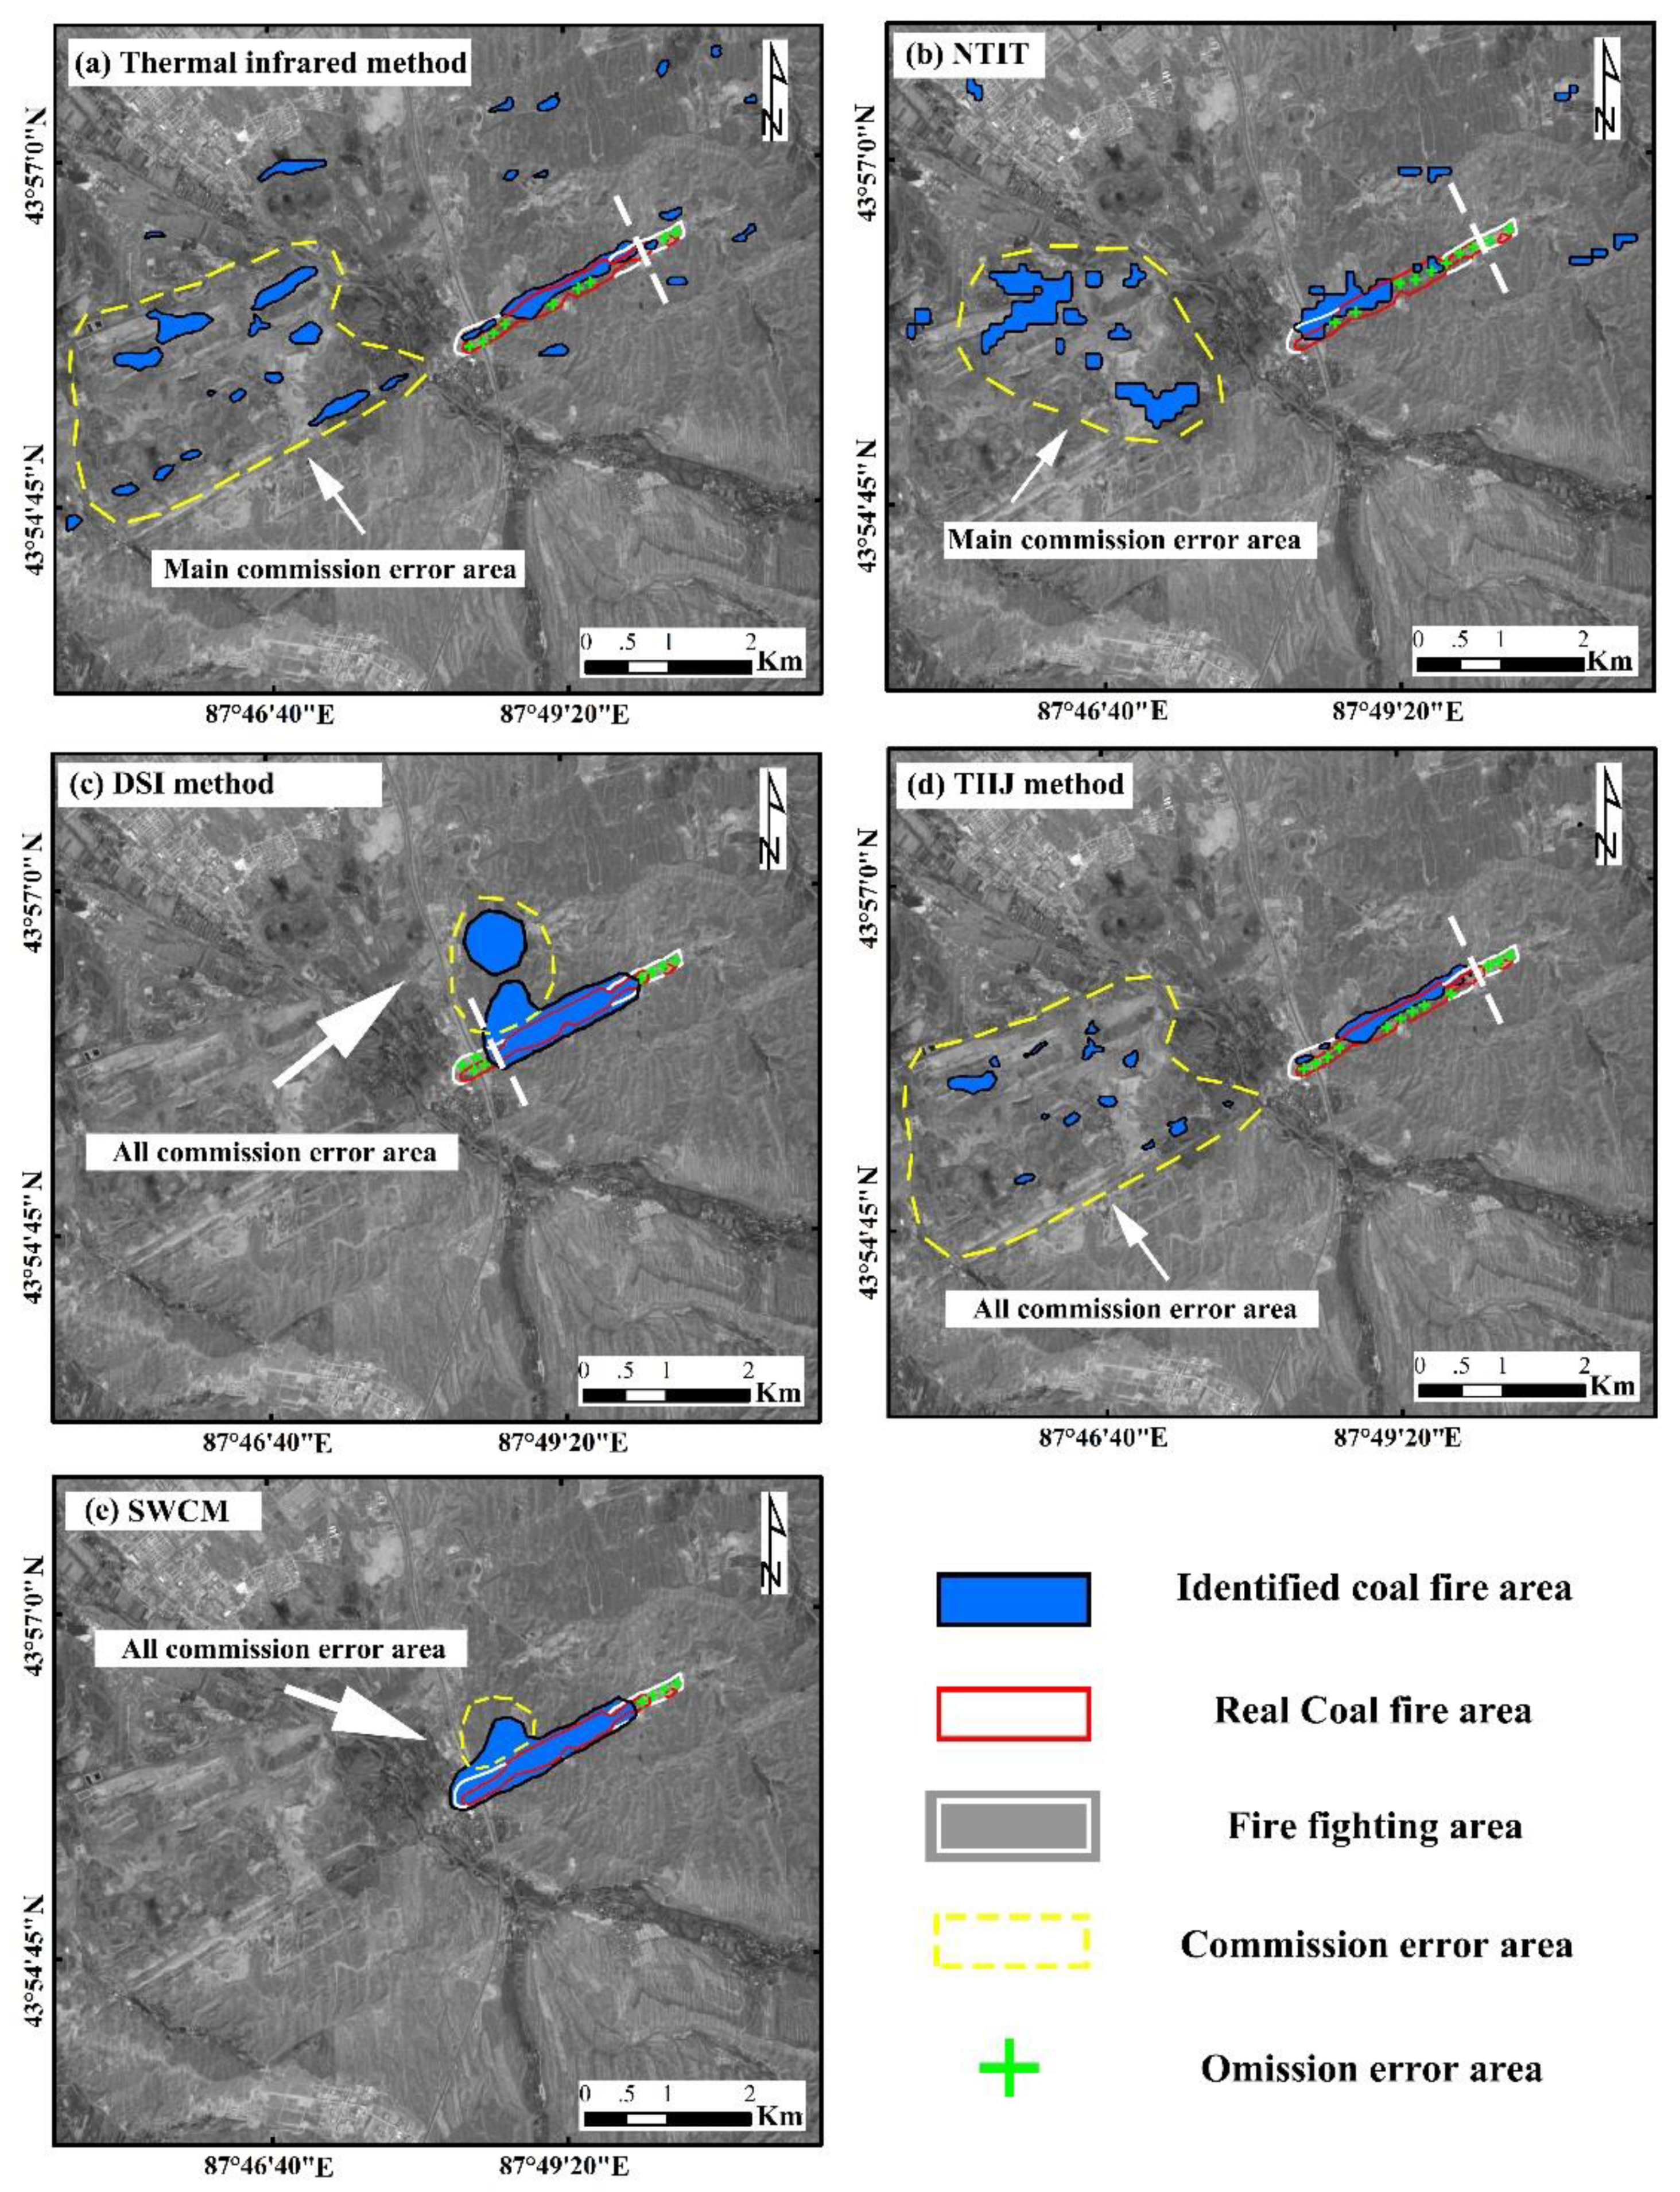
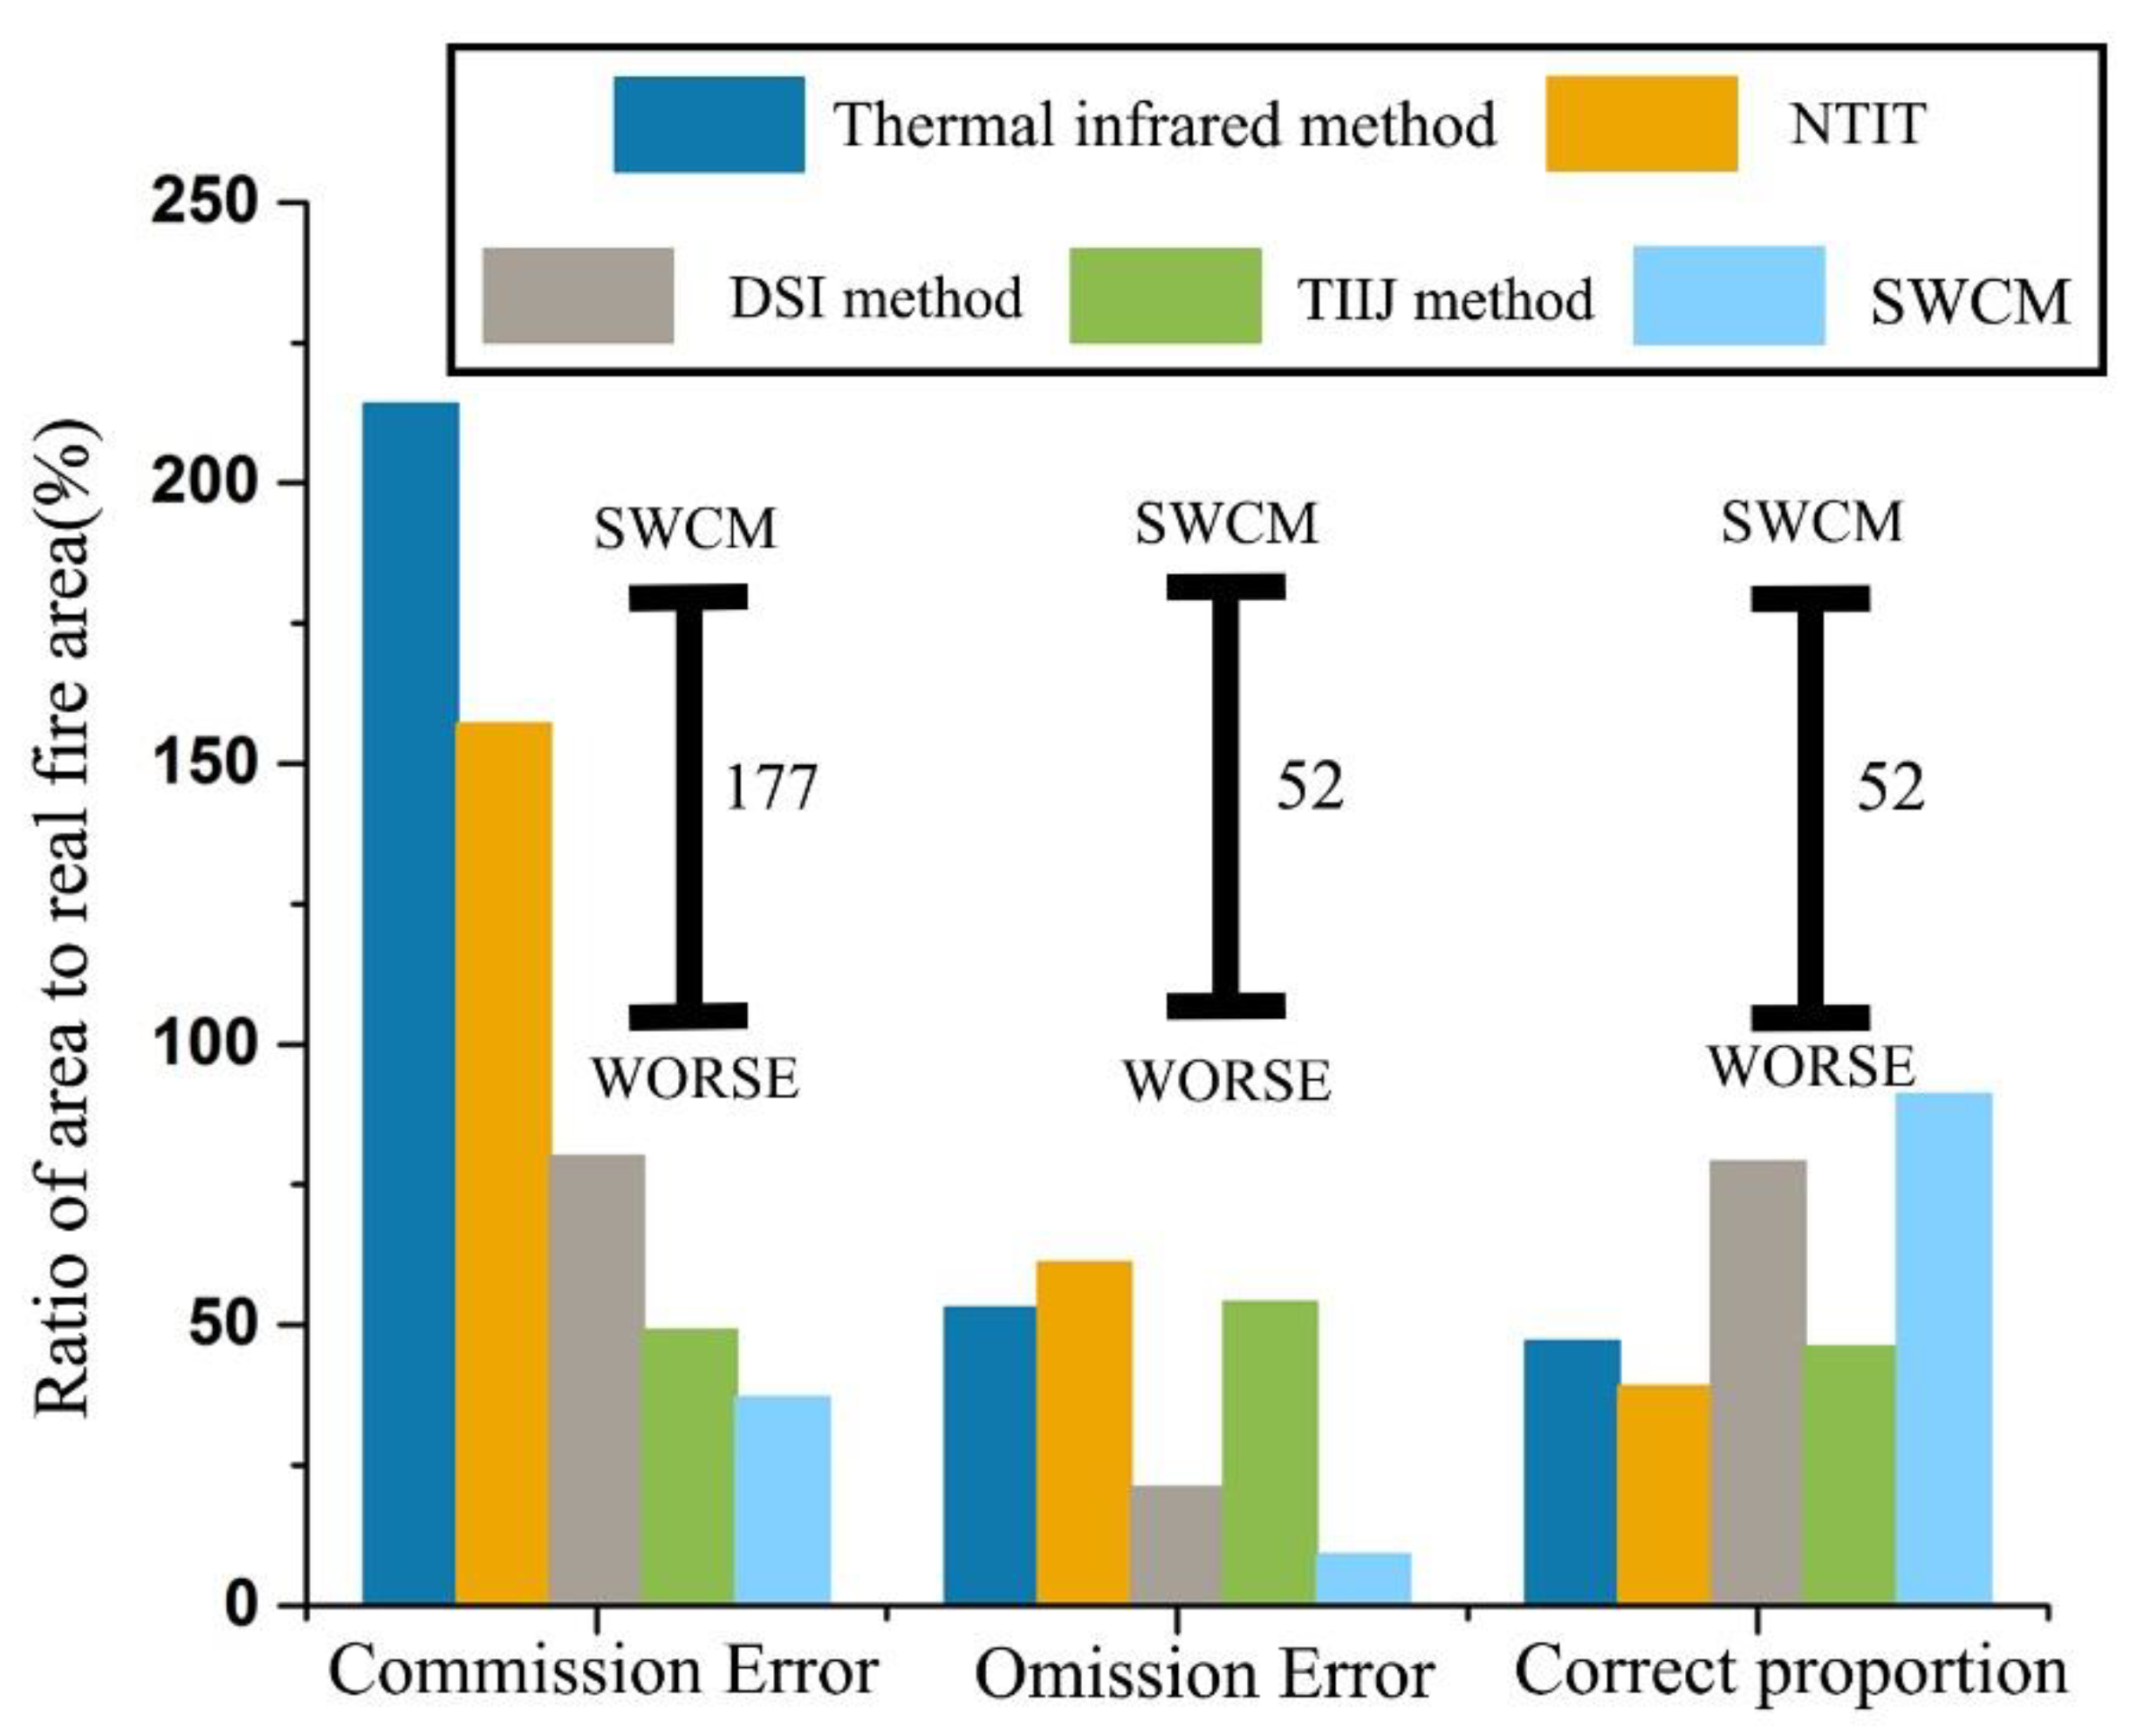
4.3. Coal Fire Detection Accuracy

A coal fire area survey report was obtained in August 2016 from the Xinjiang Coal Fire Prevention and Control Department. The investigation process involved a variety of survey methods to complement each other for ensuring the accurate identification of coal fire areas.
To highlight the advantages of SWCM, the thermal infrared technology [32], nighttime thermal infrared technology (NTIT) [12], DSI technology [20], and thermal infrared and interferometric synthetic aperture radar (InSAR) joint technology (TIIJ) [34] are also used to identify the coal fire areas. Based on the coal fire areas obtained by an in-situ investigation, four inversion results are compared. The results are shown in Figure 10 and Figure 11. Figure 10 shows the coal fire areas detected by each method, and Figure 11 shows the percentage of commission error, omission error, and correctly identified coal fire areas detected by each method with respect to the actual coal fire areas. Here, the areas of the misjudged coal fire, missed coal fire, and correctly identified coal fire regions detected by each method are calculated, and then the ratios of these statistical areas and the actual coal fire areas are used to obtain the percentages.
Combining Figure 10 and Figure 11, it is clear that the traditional thermal infrared method exhibits the maximum commission error of coal fire areas (214%), while the commission error of coal fire areas obtained by SWCM is the lowest (37%) and the difference between them is 177%. It is worth mentioning that both the thermal infrared method and NTIT use thermal anomalies to identify coal fire areas. The difference between them is that the former uses daytime data and the latter uses nighttime data. The commission error of NTIT is 157%, which is a 57% reduction relative to the thermal infrared method, showing that nighttime data can reduce the impact of daytime solar radiation, etc., on coal fire detection. The commission error obtained by SWCM is reduced by 70.4% on average when compared to that obtained by other methods. Further, it is observed that the omission error of coal fire areas identified by SWCM is the lowest (9%), and those obtained by the thermal infrared method, NTIT, and TIIJ are relatively high. The omission errors of them are nearly 56%. Compared to the omission errors obtained by the other four methods, omission errors of SWCM are reduced with an average reduction of 30.6%.
The commission errors of coal fire areas reduced by SWCM as compared to the other methods are marked with yellow dashed lines in Figure 10. Among them, the commission errors in Figure 10a,d are caused by ground objects with low specific heat capacity due to solar radiation, which corresponds to non-coal fire thermal anomaly. The area of commission errors in Figure 10b belongs to the coal yard, and the heat that accumulates in the area during the day does not seem to spread out easily. The specific reasons for these errors need further study. The commission errors in Figure 10c are due to the subsidence caused by the abandoned mining area, which is attributed to non-coal fire subsidence.
The omission errors on the left of the white dotted lines in Figure 10 indicate the main omission errors of coal fire areas reduced by the SWCM as compared to the other methods. Among them, the omission errors in Figure 10a,b,d are due to the undetected thermal anomaly areas. The reason could be that the surface thermal anomaly is relatively low or because of low image resolution. The temperature value of one pixel is affected by the surface with a low temperature around the fire area. The omission errors in Figure 10c are due to the fact that the subsidence law of the area does not match the subsidence law of the coal fire area initially found in [20].
There is a 91% overlap between the coal fire areas detected by SWCM and the actual coal fire areas, which is the highest among the four methods. It is nearly 12% higher than the DSI method, which has the second-highest accuracy rate, and the average increase is 30.6%. To conclude, based on the above analysis, i.e., the commission errors and omission errors, SWCM is the most effective method for identifying coal fire areas in the study area.

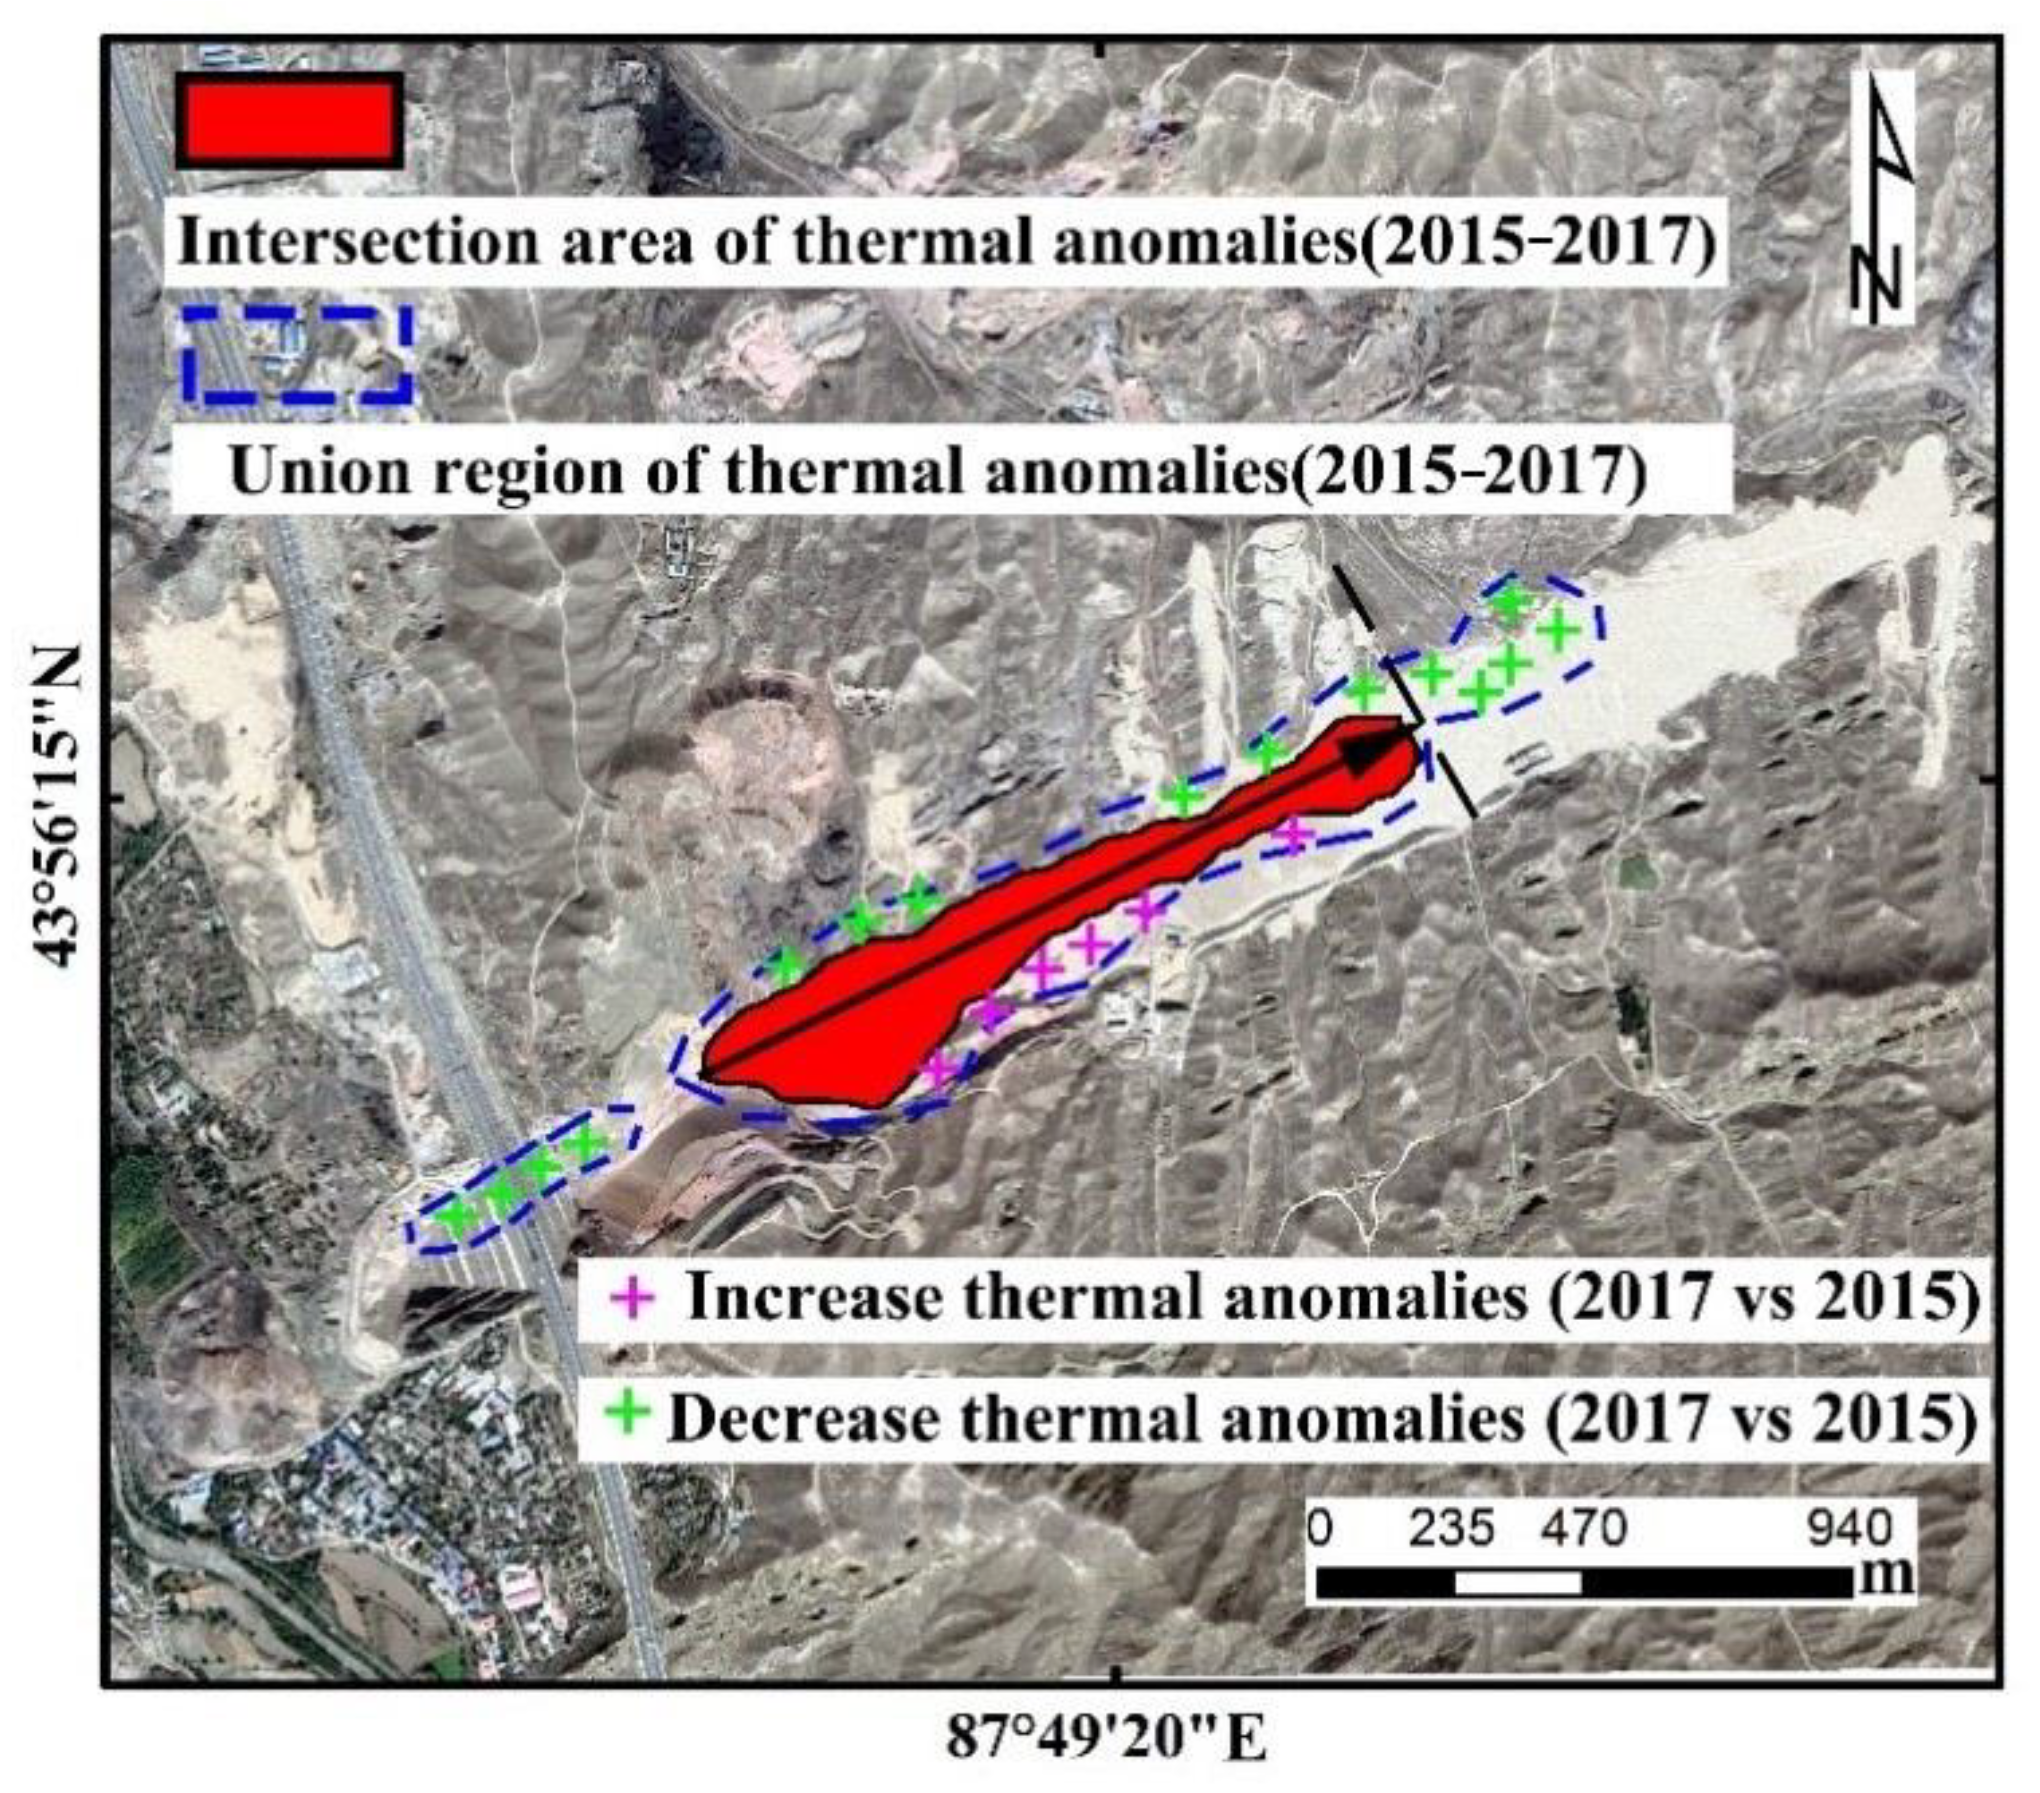
4.4. Spatio-temporal Evolution of Coal Fires

Understanding the spatio-temporal changes in the coal fire areas is crucial for the control and prevention of coal fires [40]. Among the physical and chemical changes caused by coal fires, the temperature is the most direct factor that can rapidly reflect the dynamic changes in coal fires [41]. Since there are some errors in the detection of coal fire areas by SWCM and the above results indicated that the thermal anomalies in the coal fire areas obtained by the SAGBT are all actual fire areas, it can be considered that the thermal anomalies identified by SAGBT in the coal fire areas represent a part of the actual coal fire areas. Therefore, the thermal anomalies in the coal fire areas were monitored to analyze the spatio-temporal changes of coal fires from 2015 to 2017.
To describe the changes in the coal fire areas, the intersection and union regions of thermal anomaly areas from 2015 to 2017 are shown in Figure 12. Through comparison, it can be found that the thermal anomaly areas in 2015 and 2016 are roughly the same, the difference is only 0.02 km2, with an overlap of 94.3%, but those in 2017 have changed significantly. The difference in the area of thermal anomalies between 2015 and 2017 is 0.07 km2, with an overlap of 69.7%. Therefore, Figure 12 is mainly used to compare the thermal anomaly changes in 2017 and 2015. The green and pink crosses represent the region where the thermal anomaly areas decreased and increased in 2017 as compared to that in 2015, respectively. According to statistical analysis, the decrease range is 2.8 times the increase range. The reduction area is mainly concentrated on the far left and right of the black dotted line (Figure 12). The decrease on the left side is attributed to the subgrade stabilization work on both sides of the highway, which caused the coal fire to extinguish. The obvious reduction area on the right side is ascribed to the extinguishing and remediation project (the extinguishing project was conducted in the area around April 2017). Based on the disappearance of a thermal anomaly in this area, it can be inferred that the extinguishing effect is good. Compared to 2015, the thermal anomaly areas are increased in 2017 in the southeast of the coal fire areas. This may be because more cracks and crevices were created in the southeast of the area. The heat generated by the coal fires was conducted to the surface along these cracks and crevices, leading to an increase in the thermal anomaly. This phenomenon may also be attributed to the fact that coal fires have indeed spread to the southeast, and the specific reasons need to be further examined.
The above analysis reveals changes in a part of the coal fire areas from 2015 to 2017. The coal fire areas are generally decreasing. In particular, the extinguishing project in 2017 has significantly reduced the coal fire areas in the east. In addition, the coal fire areas show signs of development to the southeast.

4.5. Relationship between Temperature and Subsidence of Coal Fires

The profile analysis method is used to analyze the temperature and subsidence of the coal fire areas. The position of the subsidence and temperature profile line is shown by an arrow in Figure 12. The main steps include the interpolation of DSI subsidence results, which is followed by the extraction of the subsidence rate of the profile. Subsequently, the average land surface temperature (LST) values of the six scene temperature results are obtained. Figure 13 is a superimposed diagram of the subsidence rate and average LST. The area with a large average LST corresponds to the obvious subsidence area. Especially, in the region from 750–1500 m, the average LST and the subsidence rate reach their peaks. It is clear from the profile results that the average LST and the subsidence rate have a strong negative correlation.
To further analyze the relationship between temperature and subsidence, the actual temperature value and subsidence rate corresponding to the in-situ coal fire points are obtained. The in-situ coal fire points and interpolation result of the subsidence rate are shown in Figure 14. Among them, the coal fire points are obtained through the field measurement conducted by relevant departments in August 2016, and they are mostly in the area around the cracks.
By extracting the coal fire points corresponding to the actual temperature and subsidence rate, we found that the numerical relationship between the actual temperature and the subsidence rate is chaotic, and it is hard to find a certain rule (Figure 15a). This is because the surface temperature is measured only once for the in-situ coal fire points, and the subsidence caused by the combustion of the coal fire area has a delay. The results obtained based on the temperature at a certain time and the subsidence rate of the coal fire points could exhibit random errors. Therefore, the relationship between temperature and subsidence in the coal fire area should be examined by using the time-series average temperature and subsidence rate. Consequently, the time-series average temperature of each in-situ coal fire point in the six images was calculated, and the relationship between time-series average temperature and the subsidence rate was then examined. The results are shown in Figure 15b.
From Figure 15b, it can be seen that the time-series average temperature and the subsidence rate have a good negative correlation in the study area, and the correlation coefficient reaches 0.82. Based on the above analysis, it can be concluded that the subsidence rate is large when the average temperature is high, but there is a delay time between them.

5. Discussion

5.1. Feasibility and Effectiveness of the Proposed Strong and Weak Constraints Method (SWCM)

After the verification of the actual measurement data, the shortcomings of the traditional technologies emerged. There are several commission errors and omission errors, so these traditional technologies are not suitable for coal fire area identification in the study area. In order to improve the identification accuracy of coal fires in the study area, SWCM is proposed to identify the coal fire areas. The SCP of this method can ensure accurate recognition of the coal fire areas to a significant extent, and then WCP is employed to delineate the omission errors to further improve the recognition accuracy of coal fire areas. It is able to effectively reduce the influence of non-coal fire thermal anomaly and subsidence on the identification. Specifically, the SCP can reduce the thermal anomaly areas by 71.1%. In addition, the obtained coal fire areas with WCP and the actual ones have an overlap of 91%, while the corresponding overlap without WCP is only 47%. This indicates that with the implementation of WCP, the overlap degree increases by 44%, and the commission errors caused by WCP accounts for 37% of the actual coal fire areas. Compared with the increase in commission errors, the accuracy rate is greatly improved, and the thermal anomaly areas are significantly reduced, which validates the feasibility and efficacy of the proposed method.
To further verify the feasibility and effectiveness of the proposed method in this paper, we conduct experiments in the Fukang fire area using the proposed SWCM. The relevant information of the Fukang coal fire area can be found in [34]. Figure 16 shows the results of coal fire area identification based on TIIJ and SWCM, and it is obvious that SWCM can significantly reduce the range of thermal anomalies. As there is no actual measurement of the coal fire area range, it is hard to evaluate the accuracy of coal fire identification by SWCM. However, based on the in-situ coal fire points, we can see that only one coal fire point (i.e., the coal fire point E) is missed in the fire area identification by SWCM, and there are only four small commission errors (marked by A-D). Moreover, the range of coal fire identified by TIIJ is 11.13 km2, while the range of coal fire identified by SWCM is only 3.11 km2, which is a 72.1% reduction. In summary, comparing with TIIJ, the coal fire area identified by SWCM has smaller commission errors and more accurate identification results. The results in the Fukang coal fire area confirm that the proposed SWCM is an effective method for coal fire identification. Further, it can better help managers to improve the efficiency of fire area reexaminations and evaluate the effect of firefighting and remediation projects.
Some commission and omission errors are observed in the coal fire areas detected by the proposed method (Figure 10e). The commission errors are obtained because they are in the high suspected coal fire areas and meet the subsidence and NDVI threshold. This area meets the NDVI threshold, which means that the NDVI value is low. So, the reason for errors should be that the subsidence in the misjudged area is more serious, and there are some mining residues in the area. The combined effect of the two factors leads to the low NDVI value in the area rather than the coal fires leading to low NDVI value. Although these areas are commission errors, based on the conditions for judging them as coal fire areas, it is likely that these areas may develop into coal fire areas in the future.
Omission errors are mainly caused by the SCP (Figure 10e). Before subsidence filtering, there are few thermal anomaly areas in the omission area, but due to the absence of subsidence information, they are completely filtered out. The absence of subsidence may be because the coal is not burning violently, and the underground combustion space area has not developed enough. The small thermal anomaly areas in the omission area may also be due to the deep burning coal seam and relatively insufficient combustion. These errors are due to the defect of the method in this paper. SWCM could miss some coal fire areas without subsidence. However, the coal fire areas that have no subsidence are mostly in the early stage of coal fires, so it is necessary to develop a method for identifying coal fire areas in the initial stage.
The errors may also be caused by more interference factors during the daytime. Using night-time data to inverse night-time temperatures could reduce the interference from solar radiation, etc. However, there are still thermal anomalies in some areas such as roads, which need further study.

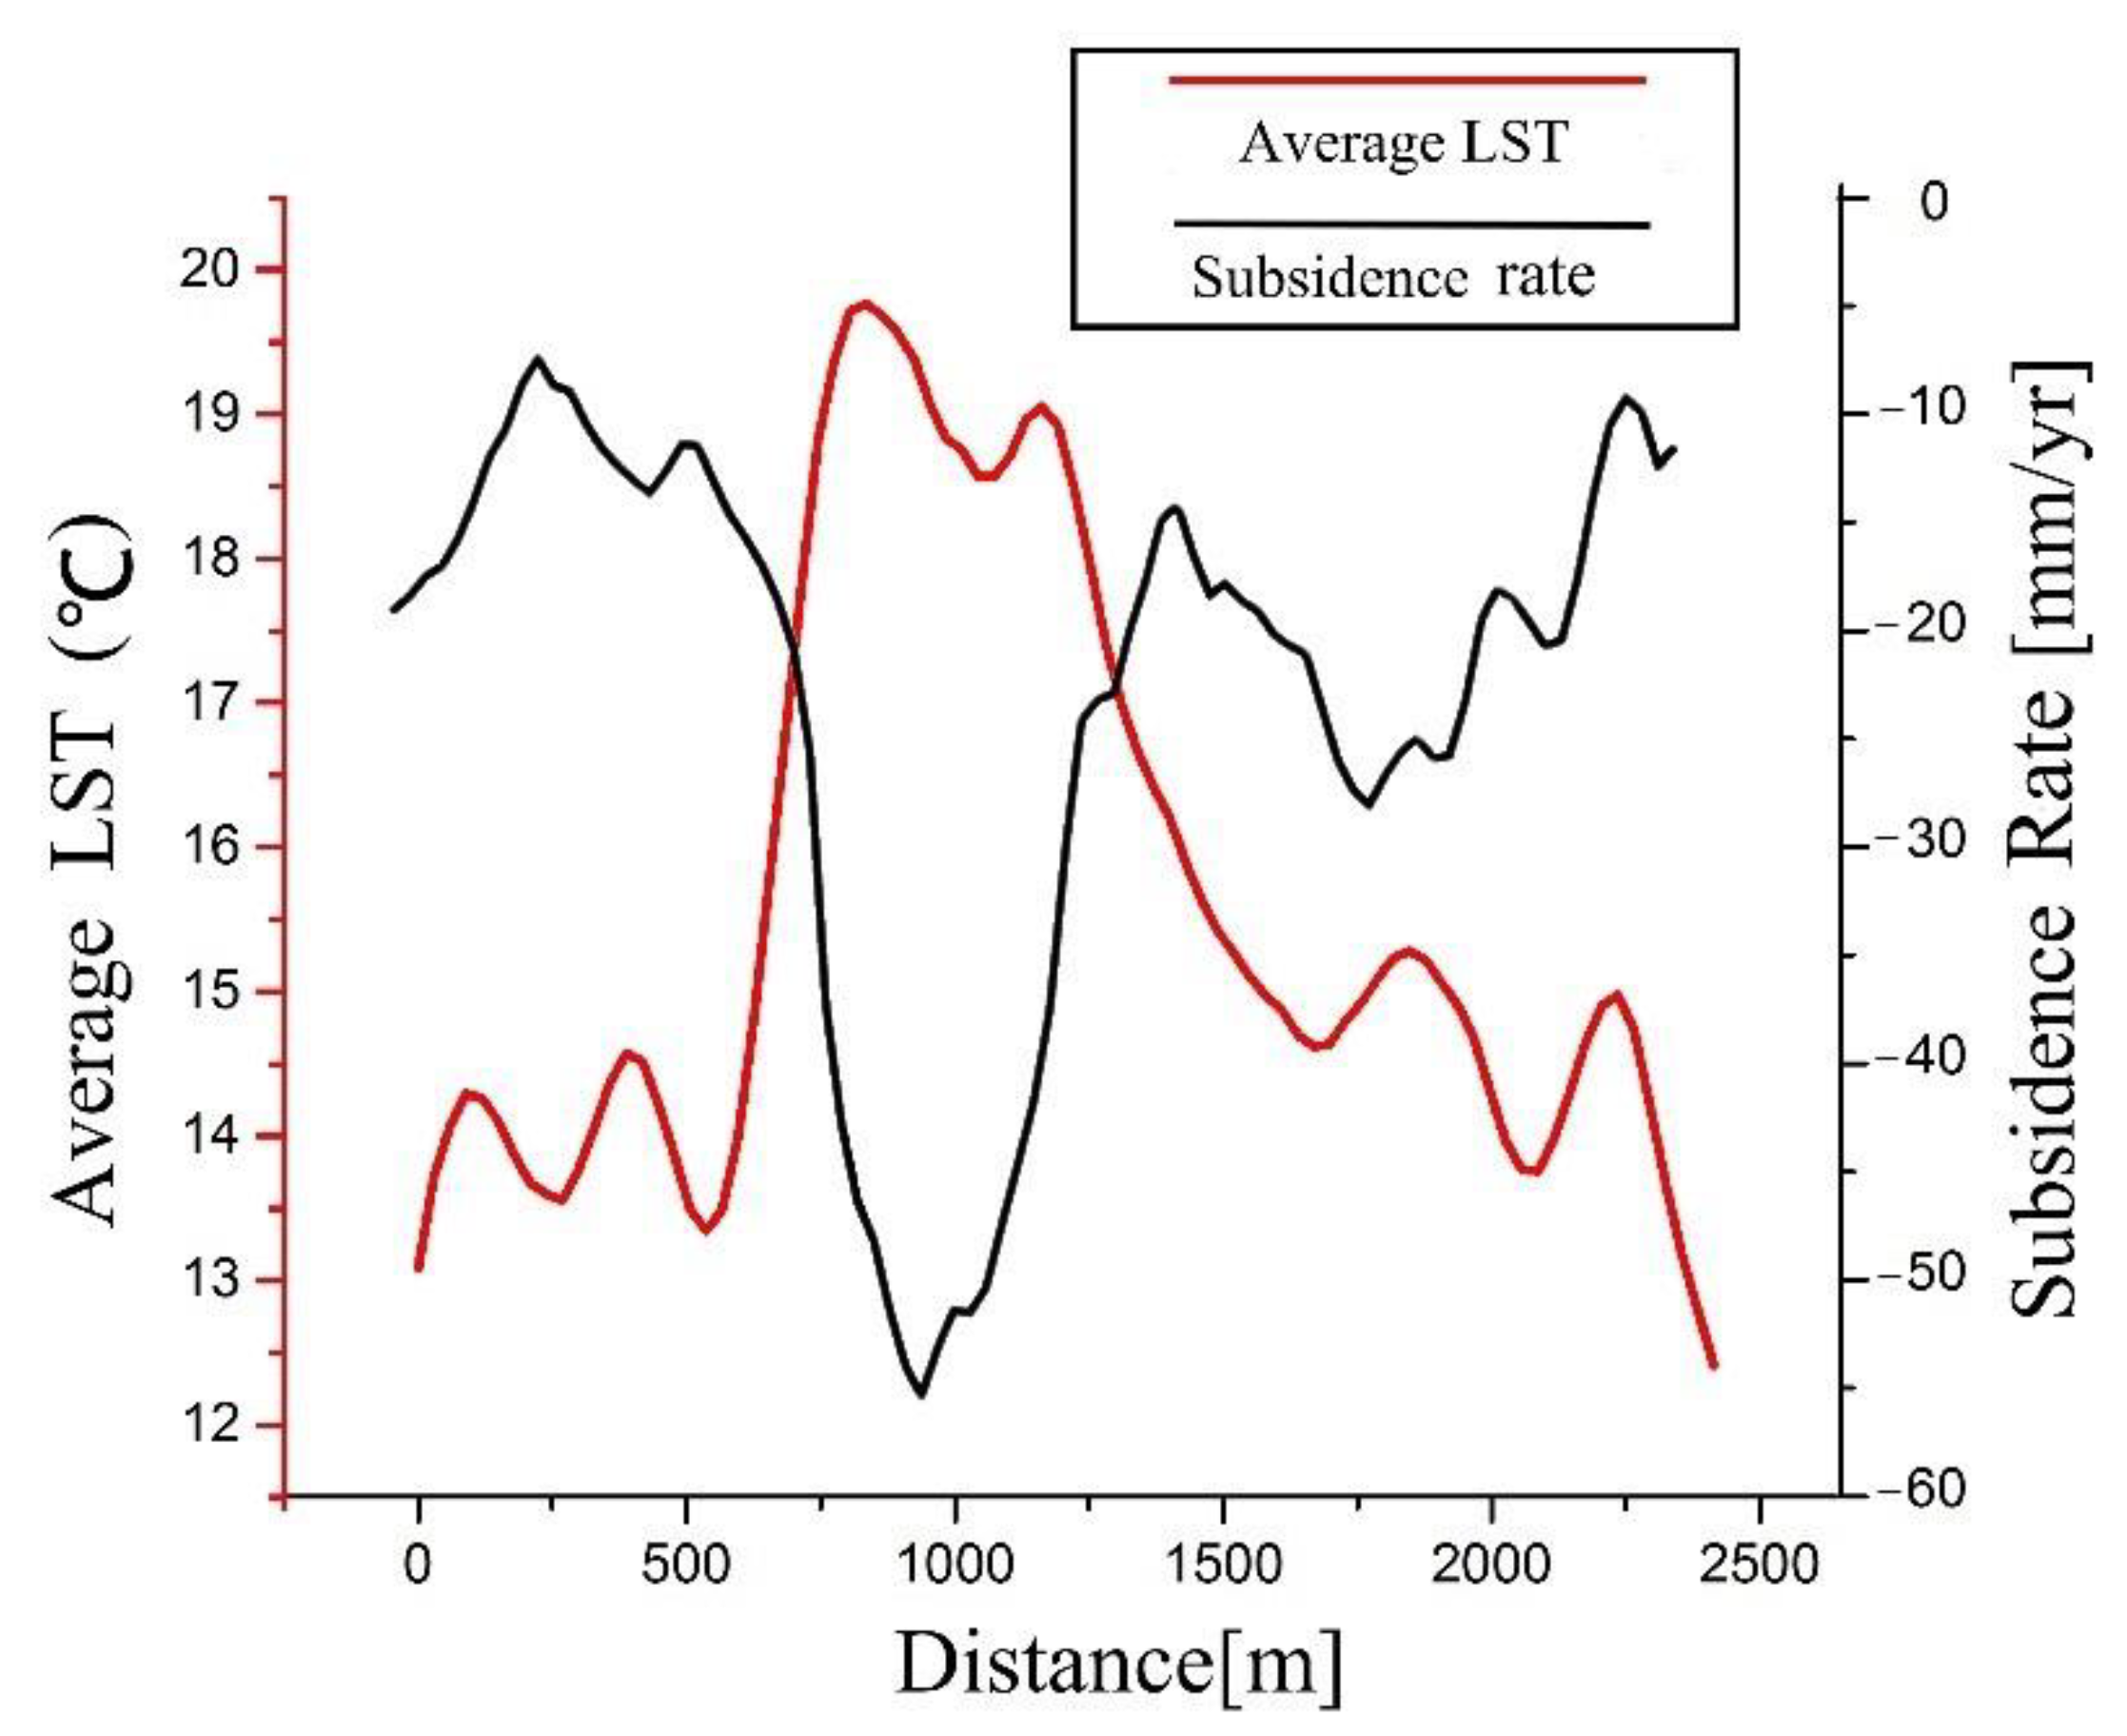
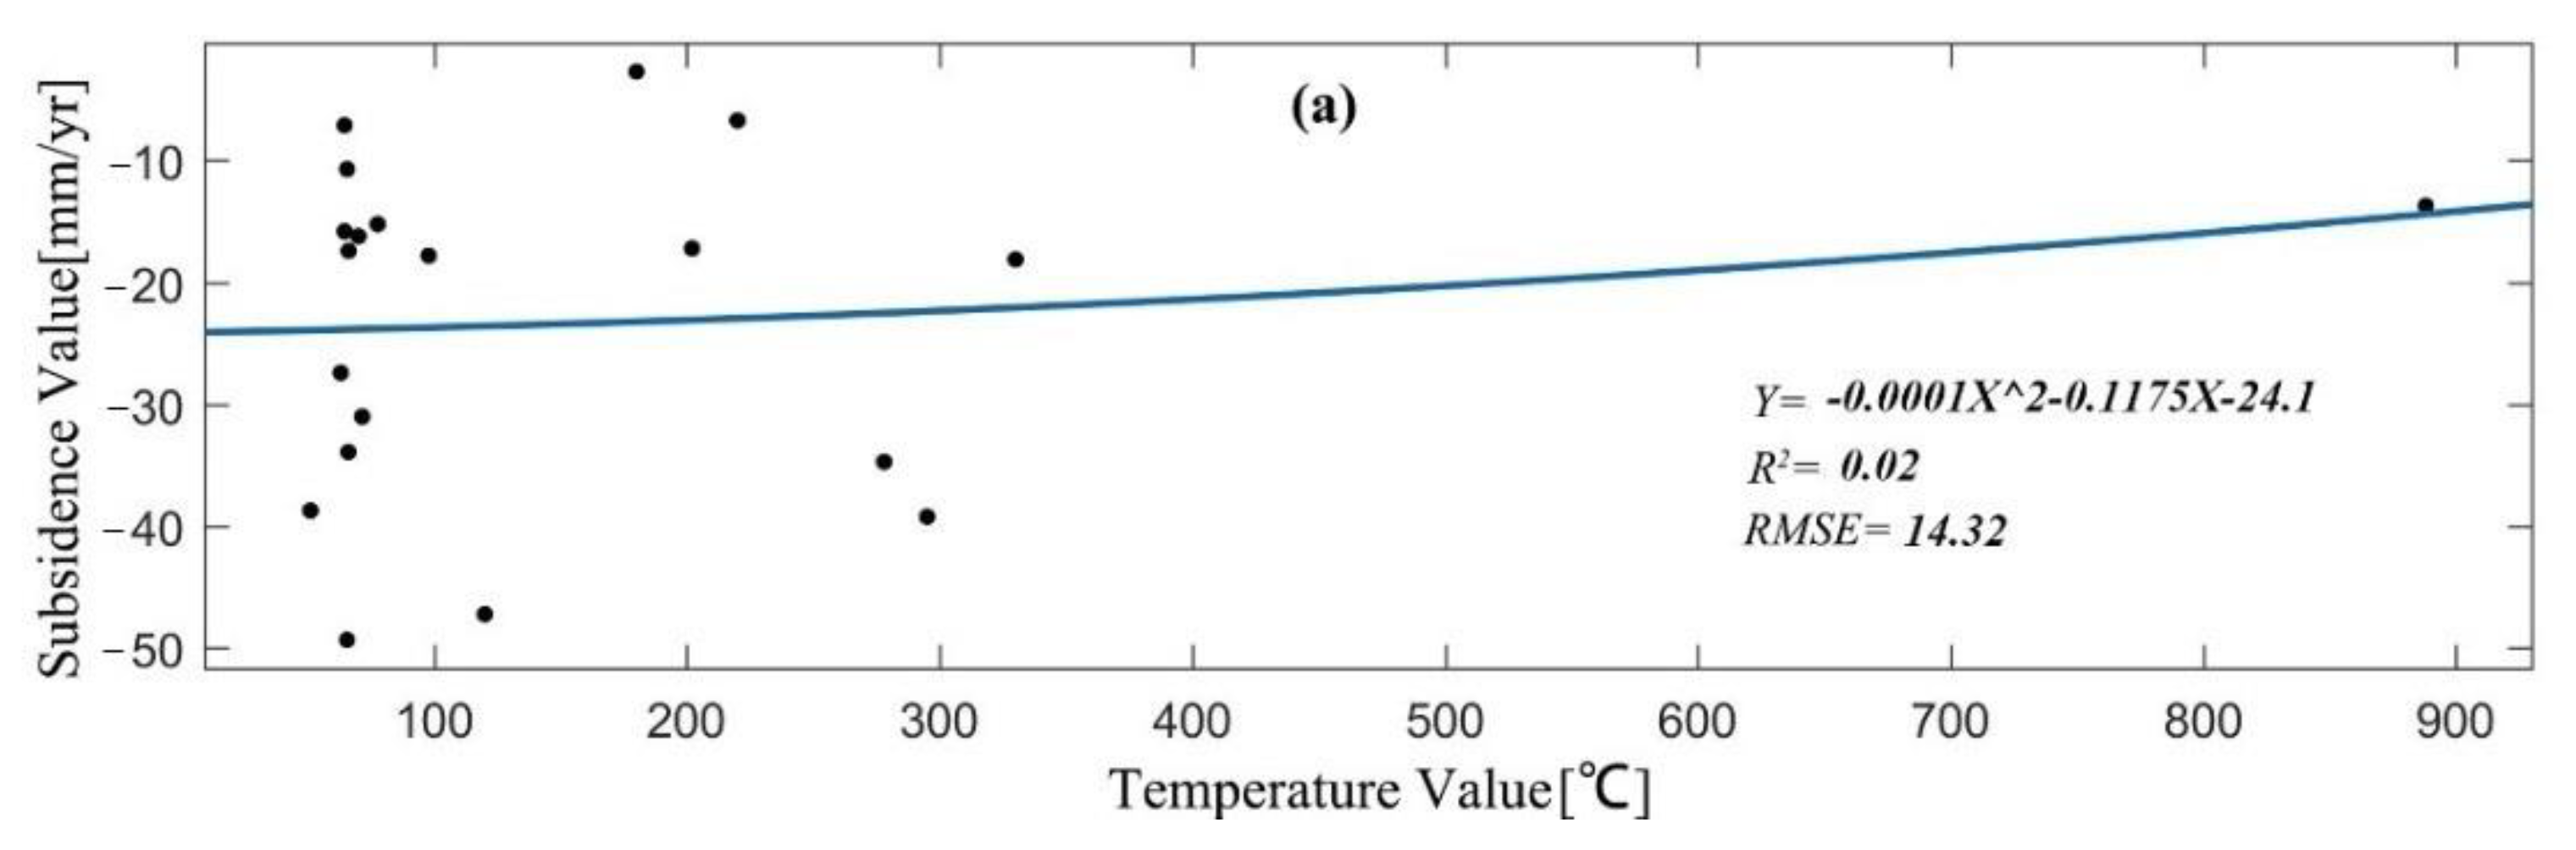
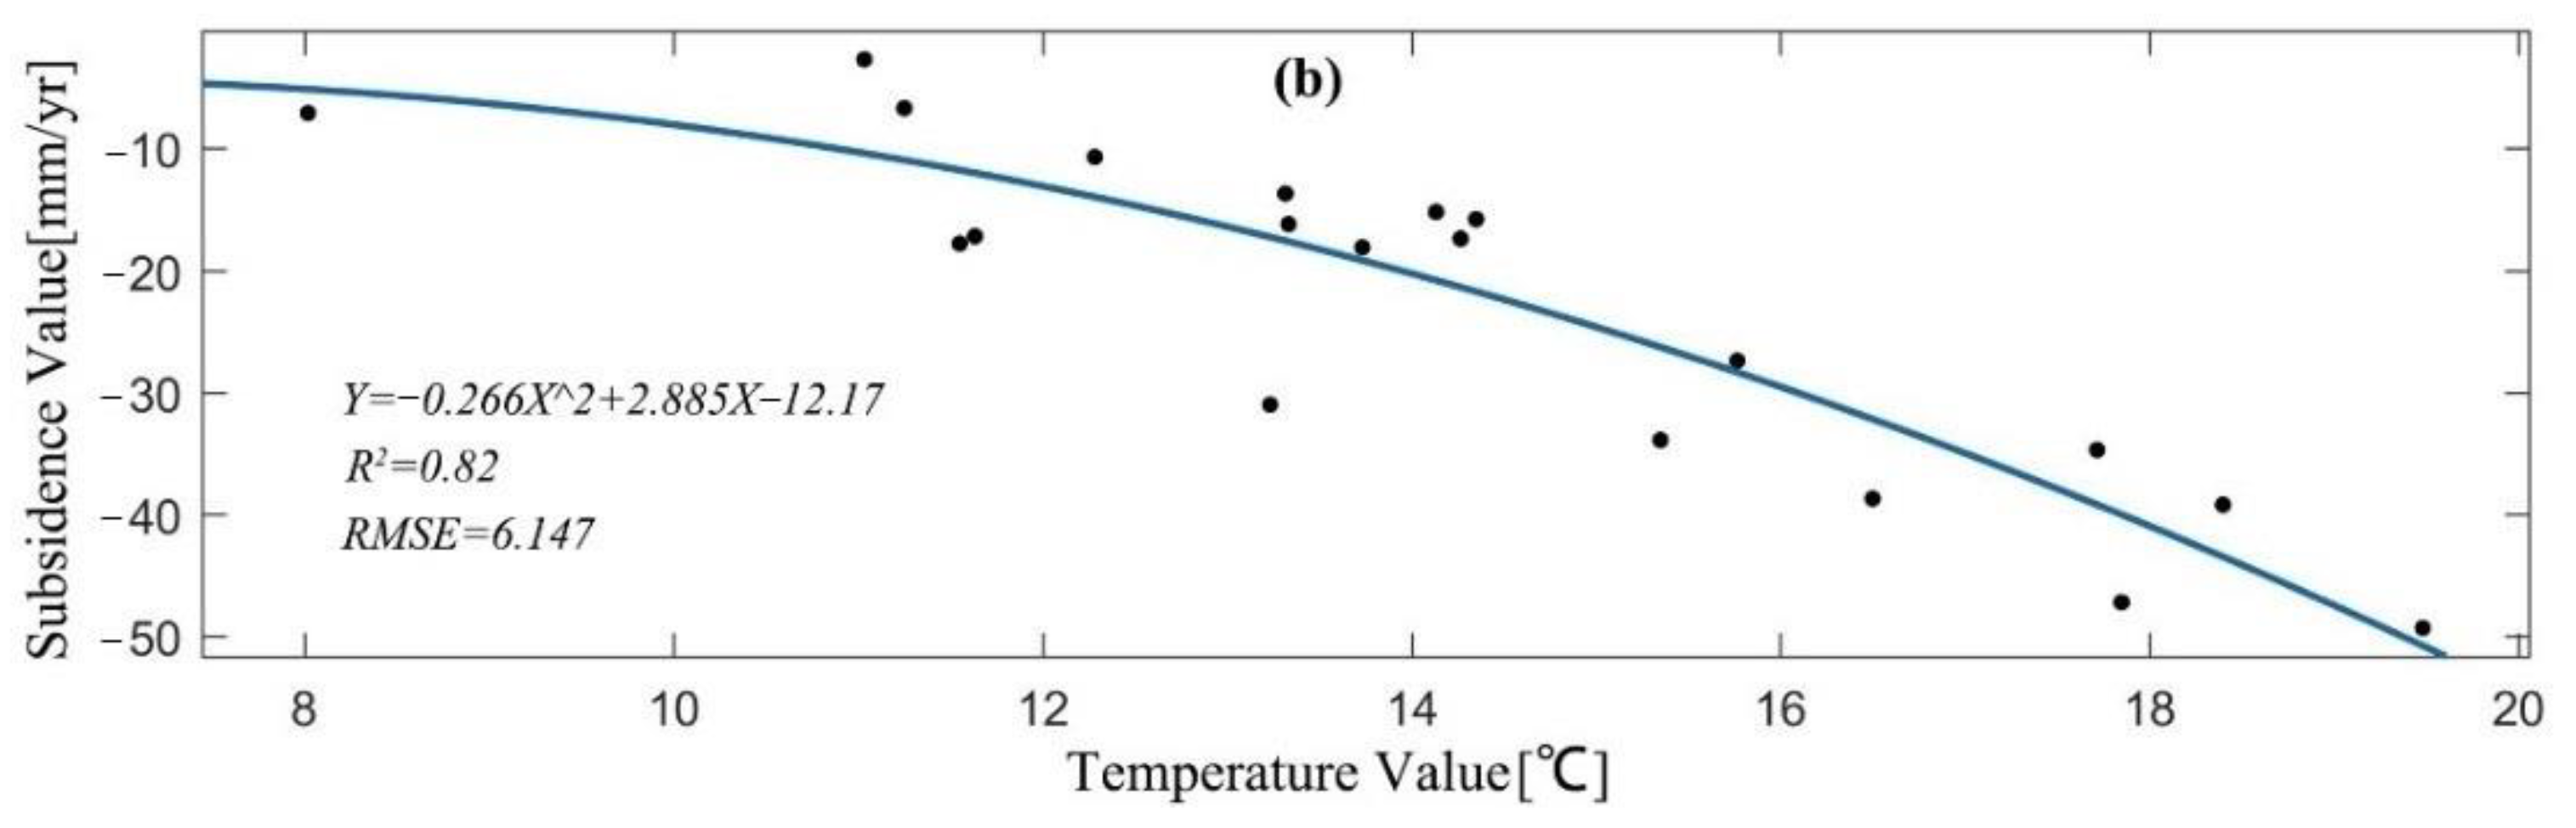
5.2. Relationship between Surface Temperature and Subsidence in Coal Fire Areas

Understanding the relationship between temperature and subsidence in coal fire areas is vital for the modeling of coal fires, and it can also establish a complete theoretical foundation for the fusion of temperature and subsidence information to monitor the coal fire areas. It is generally believed that the values of surface temperature and subsidence are large in areas where coal is burning violently [9,18,34]. However, a part of the heat generated by coal fires is conducted to the ground along the cracks and crevices, which is much higher than the heat that is conducted to the ground through the stratum. If the cracks are inclined, then a part of the vertical underground areas corresponding to the surface thermal anomaly areas may not be coal fire areas, and the real coal fire areas are beside the surface thermal anomaly areas. Based on the above analysis, it is important to further examine whether the subsidence value in the high-temperature areas of coal fires is large.
Although it has been shown in Section 4.5 that there is a negative correlation between temperature and subsidence, it can only be considered as an approximate relationship. Since the subsidence information is interpolated with the same 30 m resolution as the temperature result, one pixel in the temperature result must include the crack and other areas. Although the crack temperature is very high, the temperature of the rest of the surface is only higher than the normal surface temperature. The final inverted temperature is the average temperature within 900 m2, so the inverted surface temperature does not appear to be too high. Similarly, the subsidence information is also an average value of surface subsidence within 900 m2. The comparison of two 30 m resolution images will lose part of the true value. Therefore, to obtain a more accurate relationship between temperature and subsidence, a higher resolution of temperature and subsidence result is needed.

6. Conclusions

In this study, to reduce the impact of non-coal fire thermal anomaly and subsidence on coal fire detection using remote sensing technologies, an effective method named SWCM has been proposed. This method is based on the combination of subsidence, thermal anomaly, and NDVI to identify and monitor coal fires. To verify the efficiency and accuracy of the proposed method, it has been tested in Miquan coal fire areas of Xinjiang. With the help of the in-situ investigation data, the coal fire identification results of SWCM are compared with those obtained by the three conventional methods. The conclusions are as follows:
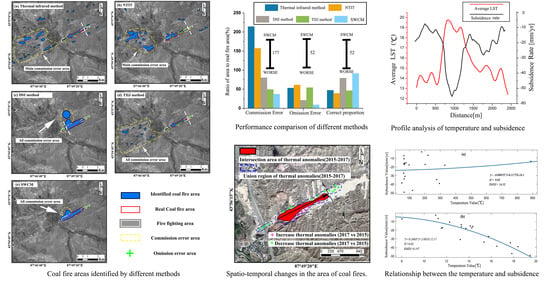
  • The results demonstrate that the proposed method has a good performance on the commission error rate, omission error rate, and identification accuracy of the coal fire area over the study area. Specifically, these three parameters are 9%, 37%, and 91%, respectively. Compared with the four conventional methods, the average commission error rate and omission error rate are decreased by 70.4 %, 30.6%, respectively. The average identification accuracy of the coal fire area is increased by 30.6%.
  • Spatio-temporal changes of coal fires have been analyzed. The coal fire tended to spread to the southeast from 2015 to 2017, and its reduction range was 2.8 times that of its increase range, so the overall combustion areas showed a decreasing trend over the study area.
  • The relationship between the temperature and subsidence of coal fire areas is investigated. The time-series average temperature of the coal fire areas has a strong negative correlation with the ground subsidence rate, and the correlation coefficient was 0.82 from 2015 to 2017. Nevertheless, more precise relationships between them over the coal fire areas need further investigation.
Overall, comparing with the other conventional remote sensing approaches, SWCM can effectively reduce the impact of non-coal fire thermal anomaly and subsidence on coal fire detection. However, there could be some commission and omission errors in the coal fire detection results of SWCM, and it is hard for it to identify coal fire areas in the initial stage. These two aspects are the further research directions of the authors.

Author Contributions

J.L., Y.W., S.Y., Y.L., F.Z., Y.S. and L.D. developed the methodologies and designed the experiments; Y.L. and J.L. performed the experiments; J.L., Y.W. and F.Z. analyzed and validated the results; J.L. and F.Z. wrote the paper. Then L.D., Y.S., X.L. and B.P. improved it. All authors have read and agreed to the published version of the manuscript.

Funding

This research was supported in part by the Natural Science Foundation of China (Grant No. 41874044, 42004011), in part by the China Postdoctoral Science Foundation (Grant No. 2020M671646), in part by the Fundamental Research Funds for the Central Universities of China (Grant No. 2020QN27) and in part by the Priority Academic Program Development (PAPD) of Jiangsu Higher Education Institutions (Science and Technology of Surveying and Mapping).

Institutional Review Board Statement

Not applicable.

Informed Consent Statement

Not applicable.

Data Availability Statement

Data available on request due to restrictions e.g. privacy or ethical.

Acknowledgments

We thanks the ESA and USGS for their remote sensing data. Further thanks to go to all miners and engineers, who supported the 2016 in-situ field campaign.

Conflicts of Interest

The authors declare no conflict of interest.

References

  1. Kuenzer, C.; Stracher, G.B. Geomorphology of coal seam fires. Geomorphology 2012, 138, 209–222. [Google Scholar] [CrossRef]
  2. Kuenzer, C.; Zhang, J.; Sun, Y.; Jia, Y.; Dech, S. Coal fires revisited: The Wuda coal field in the aftermath of extensive coal fire research and accelerating extinguishing activities. Int. J. Coal Geol. 2012, 102, 75–86. [Google Scholar] [CrossRef]
  3. Pandey, J.; Kumar, D.; Panigrahi, D.C.; Singh, V.K. Temporal transition analysis of coal mine fire of Jharia coalfield, India, using Landsat satellite imageries. Environ. Earth Sci. 2017, 76, 1–13. [Google Scholar] [CrossRef]
  4. Song, Z.; Kuenzer, C. Coal fires in China over the last decade: A comprehensive review. Int. J. Coal Geol. 2014, 133, 72–99. [Google Scholar] [CrossRef]
  5. Jianxin. Solving the problem of underground coal fire prevention and control in China. Mine Constr. Technol. 2018, 39, 9. [Google Scholar]
  6. Gangopadhyay, P.K.; Lahiri-Dutt, K.; Saha, K. Application of remote sensing to identify coalfires in the Raniganj Coalbelt, India. Int. J. Appl. Earth Obs. Geoinf. 2006, 8, 188–195. [Google Scholar] [CrossRef]
  7. Kumar, S.; Kumar, D.; Chaudhary, S.K.; Singh, N.; Malik, K.K. Land subsidence mapping and monitoring using modified persistent scatterer interferometric synthetic aperture radar in Jharia Coalfield, India. J. Earth Syst. Sci. 2020, 129. [Google Scholar] [CrossRef]
  8. Shao, Z.; Jia, X.; Zhong, X.; Wang, D.; Wei, J.; Wang, Y.; Chen, L. Detection, extinguishing, and monitoring of a coal fire in Xinjiang, China. Environ. Sci. Pollut. Res. 2018, 25, 26603–26616. [Google Scholar] [CrossRef] [PubMed]
  9. Syed, T.H.; Riyas, M.J.; Kuenzer, C. Remote sensing of coal fires in India: A review. Earth-Sci. Rev. 2018, 187, 338–355. [Google Scholar] [CrossRef]
  10. Sofan, P.; Bruce, D.; Jones, E. Detection and Validation of Tropical Peatland Flaming and Smouldering Using Landsat-8 SWIR and TIRS Bands. Remote Sens. 2019, 11, 465. [Google Scholar] [CrossRef] [Green Version]
  11. Sofan, P.; Bruce, D.; Jones, E. Detecting Peatland Combustion using Shortwave and Thermal Infrared Landsat-8 data. In Proceedings of the VIII International Conference on Forest Fire Research, Coimbra, Portugal, 9–16 November 2018. [Google Scholar]
  12. Huo, H.; Jiang, X.; Song, X.; Li, Z.L.; Ni, Z.; Gao, C. Detection of coal fire dynamics and propagation direction from multi-temporal nighttime landsat SWIR and TIR data: A case study on the Rujigou Coalfield, Northwest (NW) China. Remote Sens. 2014, 6, 1234–1259. [Google Scholar] [CrossRef] [Green Version]
  13. Voigt, S.; Tetzlaff, A.; Zhang, J.; Künzer, C.; Zhukov, B.; Strunz, G.; Oertel, D.; Roth, A.; van Dijk, P.; Mehl, H. Integrating satellite remote sensing techniques for detection and analysis of uncontrolled coal seam fires in North China. Int. J. Coal Geol. 2004, 59, 121–136. [Google Scholar] [CrossRef]
  14. Chatterjee, R.S. Coal fire mapping from satellite thermal IR data—A case example in Jharia Coalfield, Jharkhand, India. ISPRS J. Photogramm. Remote Sens. 2006, 60, 113–128. [Google Scholar] [CrossRef]
  15. Song, Z.; Kuenzer, C.; Zhu, H.; Zhang, Z.; Jia, Y.; Sun, Y.; Zhang, J. Analysis of coal fire dynamics in the Wuda syncline impacted by fire-fighting activities based on in-situ observations and Landsat-8 remote sensing data. Int. J. Coal Geol. 2015, 141–142, 91–102. [Google Scholar] [CrossRef]
  16. Hoffmann, J.; Roth, A.; Voigt, S. Detecting coal fires in China using differential Interferometric Synthetic Aperture Radar (INSAR). In Proceedings of the FRINGE 2003 Workshop, Frascati, Italy, 1–5 December 2003. [Google Scholar]
  17. Jiang, L.; Lin, H.; Ma, J.; Kong, B.; Wang, Y. Potential of small-baseline SAR interferometry for monitoring land subsidence related to underground coal fires: Wuda (Northern China) case study. Remote Sens. Environ. 2011, 115, 257–268. [Google Scholar] [CrossRef]
  18. Zhou, L.; Zhang, D.; Wang, J.; Huang, Z.; Pan, D. Mapping land subsidence related to underground coal fires in the wuda coalfield (Northern China) using a small stack of ALOS PALSAR differential interferograms. Remote Sens. 2013, 5, 1152–1176. [Google Scholar] [CrossRef] [Green Version]
  19. Gupta, N.; Syed, T.H.; Athiphro, A. Monitoring subsurface coal fires in Jharia coalfield using observations of land subsidence from differential interferometric synthetic aperture radar (DInSAR). J. Earth Syst. Sci. 2013, 122, 1249–1258. [Google Scholar] [CrossRef] [Green Version]
  20. Liu, J.; Wang, Y.; Li, Y.; Dang, L.; Liu, X.; Zhao, H.; Yan, S. Underground Coal Fires Identification and Monitoring Using Time-Series InSAR with Persistent and Distributed Scatterers: A Case Study of Miquan Coal Fire Zone in Xinjiang, China. IEEE Access 2019, 7, 164492–164506. [Google Scholar] [CrossRef]
  21. Zhao, F.; Mallorqui, J.J. Coherency matrix decomposition-based polarimetric persistent scatterer interferometry. IEEE Trans. Geosci. Remote Sens. 2019, 57, 7819–7831. [Google Scholar] [CrossRef] [Green Version]
  22. Zhao, F.; Mallorqui, J.J. SMF-POLOPT: An adaptive multitemporal pol(DIn)SAR filtering and phase optimization algorithm for PSI applications. IEEE Trans. Geosci. Remote Sens. 2019, 57, 7135–7147. [Google Scholar] [CrossRef]
  23. Prakash, A.; Fielding, E.J.; Gens, R.; Van Genderen, J.L.; Evans, D.L. Data fusion for investigating land subsidence and coal fire hazards in a coal mining area. Int. J. Remote Sens. 2001, 22, 921–932. [Google Scholar] [CrossRef]
  24. Jiang, M.; Ding, X.; Hanssen, R.F.; Malhotra, R.; Chang, L. Fast statistically homogeneous pixel selection for covariance matrix estimation for multitemporal InSAR. IEEE Trans. Geosci. Remote Sens. 2015, 53, 1213–1224. [Google Scholar] [CrossRef]
  25. Jimenez-Munoz, J.C.; Sobrino, J.A.; Skokovic, D.; Mattar, C.; Cristobal, J. Land surface temperature retrieval methods from landsat-8 thermal infrared sensor data. IEEE Geosci. Remote Sens. Lett. 2014, 11, 1840–1843. [Google Scholar] [CrossRef]
  26. Tang, B.H.; Shao, K.; Li, Z.L.; Wu, H.; Tang, R. An improved NDVI-based threshold method for estimating land surface emissivity using MODIS satellite data. Int. J. Remote Sens. 2015, 36, 4864–4878. [Google Scholar] [CrossRef]
  27. Goslee, S.C. Topographic corrections of satellite data for regional monitoring. Photogramm. Eng. Remote Sensing 2012, 78, 973–981. [Google Scholar] [CrossRef]
  28. Prakash, A.; Pereira, R.; Vekerdy, Z. Monitoring coal fires using multi-temporal night-time thermal images in a coalfield in north-west china. Int. J. Remote Sens. 1999, 20, 2883–2888. [Google Scholar] [CrossRef]
  29. Dozier, J. Satellite Identification of Surface Radiant Temperature Fields of Subpixel Resolution (Planck Function); Departament of Commerce: Washington, DC, USA, 1980; Volume 229.
  30. Zhang, J.; Wagner, W. Spatial and Statistical Analysis of Thermal Satellite Imagery for Extraction of Coal Fire Related Anomalies. Ph.D. Thesis, Institut für Photogrammetrie und Fernerkundung, Karlsruhe, Germany, 2004; p. 189. [Google Scholar]
  31. Kuenzer, C.; Zhang, J.; Li, J.; Voigt, S.; Mehl, H.; Wagner, W. Detecting unknown coal fires: Synergy of automated coal fire risk area delineation and improved thermal anomaly extraction. Int. J. Remote Sens. 2007, 28, 4561–4585. [Google Scholar] [CrossRef]
  32. Du, X.; Bernardes, S.; Cao, D.; Jordan, T.R.; Yan, Z.; Yang, G.; Li, Z. Self-adaptive gradient-based thresholding method for coal fire detection based on ASTER data-Part 2, validation and sensitivity analysis. Remote Sens. 2015, 7, 2602–2626. [Google Scholar] [CrossRef] [Green Version]
  33. Defries, R.S.; Townshend, J.R. Ndvi-Derived Land Cover Classifications At a Global Scale. Int. J. Remote Sens. 1994, 15, 3567–3586. [Google Scholar] [CrossRef]
  34. Yan, S.; Shi, K.; Li, Y.; Liu, J.; Zhao, H. Integration of satellite remote sensing data in underground coal fire detection: A case study of the Fukang region, Xinjiang, China. Front. Earth Sci. 2020, 14. [Google Scholar] [CrossRef]
  35. Du, X.; Cao, D.; Mishra, D.; Bernardes, S.; Jordan, T.R.; Madden, M. Self-adaptive gradient-based thresholding method for coal fire detection using ASTER thermal infrared data, Part I: Methodology and decadal change detection. Remote Sens. 2015, 7, 6576–6610. [Google Scholar] [CrossRef] [Green Version]
  36. Herrera, G.; Gutiérrez, F.; García-Davalillo, J.C.; Guerrero, J.; Notti, D.; Galve, J.P.; Fernández-Merodo, J.A.; Cooksley, G. Multi-sensor advanced DInSAR monitoring of very slow landslides: The Tena Valley case study (Central Spanish Pyrenees). Remote Sens. Environ. 2013, 128, 31–43. [Google Scholar] [CrossRef]
  37. Notti, D.; Herrera, G.; Bianchini, S.; Meisina, C.; García-Davalillo, J.C.; Zucca, F. A methodology for improving landslide PSI data analysis. Int. J. Remote Sens. 2014, 35, 2186–2214. [Google Scholar] [CrossRef]
  38. Bianchini, S.; Herrera, G.; Mateos, R.M.; Notti, D.; Garcia, I.; Mora, O.; Moretti, S. Landslide activity maps generation by means of persistent scatterer interferometry. Remote Sens. 2013, 5, 6198–6222. [Google Scholar] [CrossRef] [Green Version]
  39. Wu, J.; Liu, X.; Jiang, W.; Gu, L.; Cai, Z. Spatial analysis of risk for underground coal fire in Xinjiang, China. J. China Coal Soc. 2010, 35, 1145–1147. [Google Scholar] [CrossRef]
  40. Vu, T.D.; Nguyen, T.T. Spatio-temporal changes of underground coal fires during 2008–2016 in Khanh Hoa coal field (North-east of Viet Nam) using Landsat time-series data. J. Mt. Sci. 2018, 15, 2703–2720. [Google Scholar] [CrossRef]
  41. Huo, H.; Ni, Z.; Gao, C.; Zhao, E.; Zhang, Y.; Lian, Y.; Zhang, H.; Zhang, S.; Jiang, X.; Song, X.; et al. A study of coal fire propagation with remotely sensed thermal infrared data. Remote Sens. 2015, 7, 3088–3113. [Google Scholar] [CrossRef] [Green Version]
Figure 1. Sketch map of the study area: (a) Location and topography of the study area; (b) Sentinel-2 true-color image of the study area; (c) In-situ photo of the study area; (d) Ground feature classification map.
Remotesensing 13 01141 g001
Figure 2. Ground subsidence results: (a) persistent scatter interferometry (PSI); (b) distributed scatterer interferometry (DSI) method.
Remotesensing 13 01141 g002
Figure 3. Flow chart of strength and weakness constraint method (SWCM). D represents the result value of normalized difference vegetation index (NDVI), temperature, and subsidence. D0 represents the threshold values of a thermal anomaly, subsidence anomaly, and NDVI anomaly.
Remotesensing 13 01141 g003
Figure 4. Schematic of filtering correction: (a) Preliminary filtering result; (b) Filtering correction result (do not meet threshold); (c) Filtering correction result (meet threshold).
Remotesensing 13 01141 g004
Figure 5. Flow chart of the NDVI filtering result (NFR) correction.
Remotesensing 13 01141 g005
Figure 6. Ground temperature inversion results of the study area from 2015 to 2017.
Remotesensing 13 01141 g006
Figure 7. Thermal anomaly extraction results: (a) Extraction result based on the fixed threshold method [34]; (b) Extraction result based on the self-adaptive gradient-based thresholding method (SAGBT).
Remotesensing 13 01141 g007
Figure 8. Results of strong constraint process (SCP) (The base map is sentinel-2 optical image): (a) subsidence filtering result (SFR); (b) subsidence filtering correction result (SFCR); (c) NFR; (d) NDVI filtering correction result (NFCR).
Remotesensing 13 01141 g008
Figure 9. Final coal fire areas in the study region.
Remotesensing 13 01141 g009
Figure 10. Comparison of the real coal fire areas and coal fire areas identified by different methods: (a) thermal infrared method; (b) nighttime thermal infrared technology (NTIT); (c) DSI method; (d) thermal infrared and InSAR (interferometric synthetic aperture radar) joint method (TIIJ); (e) the proposed SWCM.
Remotesensing 13 01141 g010
Figure 11. Coal fire detection based on different methods in the study area. The percentages on the vertical axis are the ratio of omission error, commission error, and correctly identified coal fire areas to the real coal fire areas.
Remotesensing 13 01141 g011
Figure 12. Spatio-temporal changes in the area of coal fires.
Remotesensing 13 01141 g012
Figure 13. Profile analysis of average land surface temperature (LST) and subsidence rate in coal fire areas.
Remotesensing 13 01141 g013
Figure 14. Distribution of in-situ coal fire points and interpolation result of the subsidence rate in the study area.
Remotesensing 13 01141 g014
Figure 15. Relationship between the temperature and subsidence rate of coal fire points in the study area: (a) Relationship between the measured temperature and subsidence rate of coal fire points; (b) Relationship between time-series average temperature and subsidence rate of coal fire points.
Remotesensing 13 01141 g015aRemotesensing 13 01141 g015b
Figure 16. Fukang fire area identified by TIIJ and SWCM5.2. Reasons for commission errors and omission errors of coal fire areas.
Remotesensing 13 01141 g016
Table 1. Landsat 8 data list.
PeriodTrack NumberCloud Amount (%)
20151021143/290.26
20151030142/302.38
20161007143/290.17
20161016142/307.07
20171120142/308.05
20171206142/307.07
Table 2. Indices system of underground coal fire risk assessment for Xinjiang region.
IndexClassificationQuantized ValueIndexClassificationQuantized Value
TLRSF0–20%5ARTS0–20%1
21–40%421–40%2
41–60%341–60%3
61–80%261–80%4
81–100%181–100%5
Table 3. Comparison table for the evaluation of suspected coal fire risk level in the study area.
Serial NumberTLRSF (%)ARTS (%)Total Score
A81.642
B6.25367
Publisher’s Note: MDPI stays neutral with regard to jurisdictional claims in published maps and institutional affiliations.

