Article

Unsupervised Building Instance Segmentation of Airborne LiDAR Point Clouds for Parallel Reconstruction Analysis

School of Remote Sensing and Information Engineering, Wuhan University, Wuhan 430079, China
*
Author to whom correspondence should be addressed.
Remote Sens. 2021, 13(6), 1136; https://doi.org/10.3390/rs13061136
Submission received: 8 February 2021 / Revised: 11 March 2021 / Accepted: 15 March 2021 / Published: 17 March 2021
(This article belongs to the Special Issue 3D City Modelling and Change Detection Using Remote Sensing Data)

Abstract

:
Efficient building instance segmentation is necessary for many applications such as parallel reconstruction, management and analysis. However, most of the existing instance segmentation methods still suffer from low completeness, low correctness and low quality for building instance segmentation, which are especially obvious for complex building scenes. This paper proposes a novel unsupervised building instance segmentation (UBIS) method of airborne Light Detection and Ranging (LiDAR) point clouds for parallel reconstruction analysis, which combines a clustering algorithm and a novel model consistency evaluation method. The proposed method first divides building point clouds into building instances by the improved kd tree 2D shared nearest neighbor clustering algorithm (Ikd-2DSNN). Then, the geometric feature of the building instance is obtained using the model consistency evaluation method, which is used to determine whether the building instance is a single building instance or a multi-building instance. Finally, for multiple building instances, the improved kd tree 3D shared nearest neighbor clustering algorithm (Ikd-3DSNN) is used to divide multi-building instances again to improve the accuracy of building instance segmentation. Our experimental results demonstrate that the proposed UBIS method obtained good performances for various buildings in different scenes such as high-rise building, podium buildings and a residential area with detached houses. A comparative analysis confirms that the proposed UBIS method performed better than state-of-the-art methods.

1. Introduction

Light Detection and Ranging (LiDAR) is an active remote sensing system that is less affected by weather conditions such as light and can quickly, in real time, collect three-dimensional surface information of the ground or ground objects. The data points obtained by the LiDAR system are dense, accurate, and have three-dimensional location information, so they are regarded as an important data source, for example, for point cloud classification, building instance segmentation and reconstructing three-dimensional building models. Automatic building instance segmentation from airborne LiDAR point clouds creates new opportunities for cadastral management, urban planning and world population monitoring. Traditionally, building instances are delineated by manual labeling from photogrammetry software. However, this process requires expensive equipment and qualified people. For this reason, building instance segmentation using automatic techniques has great potential and importance. Airborne laser scanning (ALS) greatly reduces the workload, shortens the time of field measurement, improves the efficiency of work and can quickly acquire high-precision 3D surface information of objects [1,2,3], which has been widely used in many fields such as point cloud filtering [4,5,6,7], 3D point cloud classification [8,9,10]; 3D building modeling [11,12,13,14,15] and individual tree segmentation [16,17,18,19,20]. With the development of science and technology and the increase in the application range of laser point clouds, many scholars have studied instance segmentation of laser point clouds in recent years.
Instance segmentation is developed on the basis of object detection, positioning and semantic segmentation. Due to its wide range of application scenarios and research value, this technology has attracted more and more attention in academic and industrial circles. Object detection or localization is a step in progression from coarse to fine object inference and interpretation. It not only provides the classes of the objects but also the location of the objects classified. Semantic segmentation gives fine inference by predicting labels for every point or pixel in the input data, and then, each point or pixel is labeled according to the object class within which it is enclosed. Furthering this evolution, instance segmentation gives different labels for separate instances of objects belonging to the same class [21]. Different instance segmentation scenes often use different algorithms, most of which are usually only applicable to limited scenes. The segmentation object instance scene mainly includes the instance segmentation of indoor objects [22,23,24,25], the instance segmentation of cars and people on outdoor roads [26,27,28,29,30], the instance segmentation of buildings in urban scenes and others [31]. Instance segmentation of indoor scenes is mainly used in the field of robotics [32], while instance segmentation of cars and people on outdoor roads is mainly used in the field of autonomous driving [33,34,35,36]. In recent years, there has been more and more research on the instance segmentation of indoor objects or the instance segmentation of cars and people on outdoor roads; their data sources include two-dimensional image data, depth image data and point cloud data, and their processing methods include traditional methods and deep learning methods. Buildings in the urban scene are mainly used in the fields of urban planning and management. There is little research in the research field.
In order to meet the needs of the subject query, reconstructed three-dimensional building models must be physically distinguishable. Until now, there is no accepted standard definition of building instance. From an architectural point of view, buildings as small as a single house of a few tens of square meters to urban complexes of millions of square meters all are considered as building instances. In this paper, a building instance is defined as follows: the protruding ground part does not have a common set (common connection part) with other buildings and cannot be distinguished on computer vision. The current building instance segmentation methods can be divided into two categories: traditional methods [37,38,39,40,41,42,43] and the deep learning-based method [44].
Traditional methods are common methods for building instance segmentation. Ramiya et al. [37] used an adopted filtering algorithm to divide a point cloud into ground points and non-ground points, and then, the Euclidean distance clustering algorithm was used to divide non-ground points into a point cloud cluster. The local surface normal was computed for each of the points in the cluster. The direction cosines of the normal were found out and a histogram was generated. Histogram parameters such as mean and standard deviation can be adopted to separate a building cluster from a non-building cluster. Wang et al. [38] first detected regions of building blocks from LiDAR point clouds, and the Euclidean clustering method was introduced to segment the building point clouds into individual clusters. Matei et al. [39] used a voxel of a 3D grid to divide a point cloud into ground points and non-ground points, and then, building instances were segmented by a smaller voxel size compared to ground classification. LiDAR point clouds are divided into ground points and non-ground points, and then, the moving window algorithm is used to divide the non-ground points into a point cloud cluster. Each point cloud cluster represents an individual building or tree, and then, the set of trees is removed from the point cloud cluster [40,41,42]. Yan et al. [43] proposed a dense matching point cloud building instance segmentation method. Specifically, on the basis of filtering point cloud and horizontal point cloud extraction and clustering, the roof point clouds are projected into a two-dimensional grid, and then, the non-roof point clouds are deleted. According to the topological relationship between the grids, the coverage of each building instance point cloud is obtained, and the building instance segmentation is realized.
Deep learning is a new research tendency in the field of machine learning. In recent years, it has been extensively studied such as point cloud semantic segmentation, point cloud classification and point cloud filtering. There are also studies related to building instance segmentation. Iglovikov et al. [44] present TernausNetV2, a simple fully convolutional network that allows extracting objects from high-resolution satellite imagery on an instance level.
Although the existing instance segmentation methods generally provide satisfactory building instance segmentation results, they have limitations. Many existing instance segmentation methods (Euclidean segmentation methods, voxel segmentation methods and moving window algorithm) perform well in some simple scenes, but for complex scenes such as podium building, they do not. In this paper, we propose a novel unsupervised building instance segmentation (UBIS) method of airborne LiDAR point clouds for parallel reconstruction analysis which combines a clustering algorithm and a model consistency evaluation method. First, an improved kd tree shared nearest neighbor clustering algorithm is used to segment building point clouds. Next, an improved minimum area bounding rectangle (MBR) algorithm can be used to determine whether the cluster is an isolated point cloud cluster or a cluster to be evaluated according to the thresholds of the point cloud cluster’s MBR length and width. Finally, a model consistency evaluation method is used to detect whether the cluster to be evaluated is a single building instance or a multi-building instance, which is segmented again for multi-building instance to improve the completeness, accuracy and quality of building instance segmentation.
The remainder of this paper is organized as follows. Section 2 presents building instance segmentation. Section 3 gives the experiments and analysis. Finally, Section 4 presents our conclusions and future research directions.

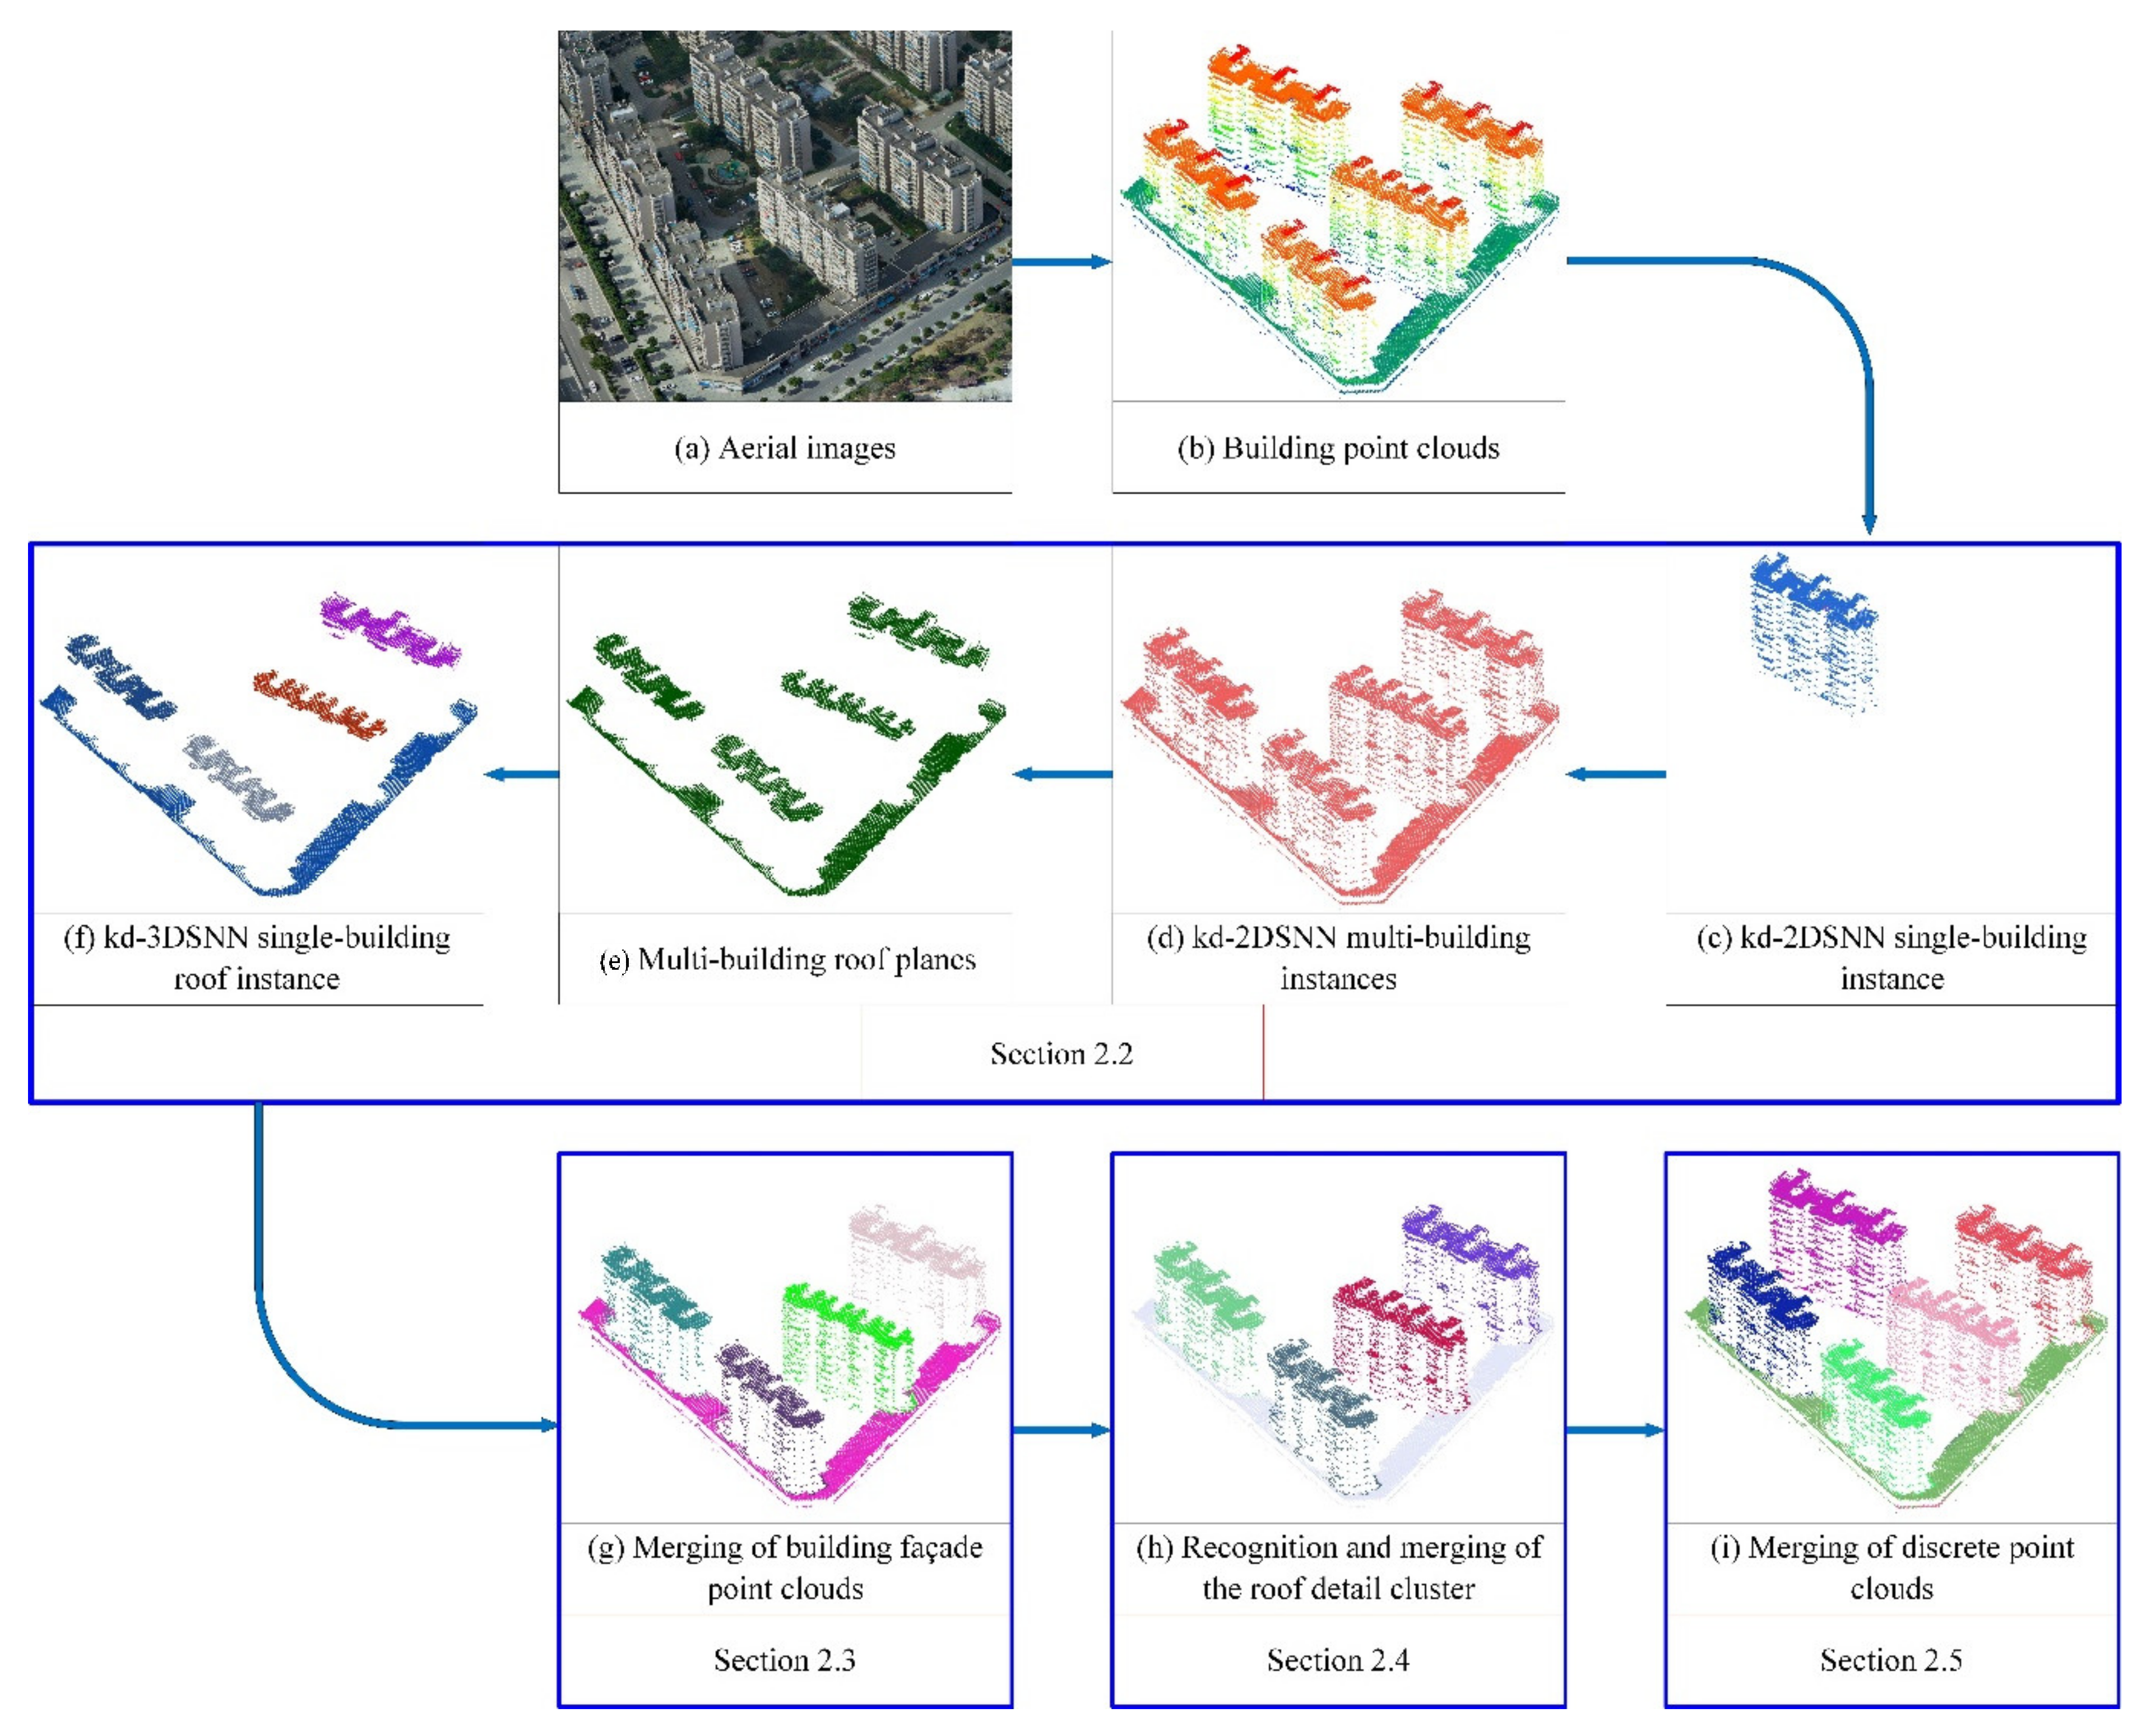
2. Building Instance Segmentation

In this paper, we propose a novel unsupervised building instance segmentation (UBIS) method with a successive scheme that includes definition of building types (Section 2.1), building point cloud segmentation (Section 2.2), merging of building façade point clouds (Section 2.3), recognition and merging of roof detail instance (Section 2.4) and merging of isolated point cloud clusters (Section 2.5). An illustration of the UBIS method is given in Figure 1. The LiDAR datasets used in this study are classified as building regions, which are marked by manual labeling and a published benchmark dataset. Ground filtering and building segmentation are conducted as preprocessing, which is not studied in this article. First, Figure 1a and Figure 1b represent aerial images corresponding to inputted building point clouds and the inputted building point clouds, respectively. Second, based on the kd tree 2D shared nearest neighbor clustering algorithm (Ikd-2DSNN) algorithm, the building point clouds are divided into single-building (single-building means that a point cloud cluster only contains one building) and multi-building (multi-building means that a point cloud cluster contains multiple buildings) instances, as shown in Figure 1c,d. Third, octree-based regional growing is used to remove façade point clouds from the multi-building instances, as shown in Figure 1e. Fourth, based on the kd tree 3D shared nearest neighbor clustering algorithm (Ikd-3DSNN) algorithm, multi-building roof planes from the multi-building instances are divided into single-building roof instances, as shown in Figure 1f. Fifth, according to the characteristics of the building facade directly below the building roof, the building façade point cloud is merged into building roof instance as shown in Figure 1g. Sixth, according to the characteristics of the roof detail above the roof and roof instance MBR size, the roof detail cluster is recognized and merged into building instance, as shown in Figure 1h. Finally, the isolated point cloud cluster is merged into the nearest neighbor building instance, as shown in Figure 1i.

2.1. Definition of Building Types

A building is an artificial environment created by man, which is of great significance to human life. In order to manage, analyze and subject query building, a building is classified by its complexity.
High-rise building: Generally refers to high-rising residential buildings, as shown in Figure 2.
Podium building: Generally refers to the ancillary building body at the bottom of the main body of a multi-storey, high-rise or super-high-rise building, which occupies an area larger than the standard floor area of the main body of the building, as shown in Figure 3.
Residential area with detached houses: Generally refers to buildings with relatively low floors, as shown in Figure 4.

2.2. Building Point Clouds Segmentation

The completeness, accuracy and quality of building instance segmentation are low with general instance segmentation for complex building scenes such as podium buildings and residential areas with detached houses. In this paper, we propose a building instance segmentation method which combines an improved Ikd-SNN clustering algorithm (Section 2.2.1) and a model consistency evaluation method (Section 2.2.2). The key steps of building instance segmentation are as follows.
Step 1: The point spacing d c 1 and ratio k t 1 are the neighbor search radius and the ratio of shared neighbor number to neighbor number, respectively. d c 1 and k t 1 are used as parameters of Ikd-2DSNN.
Step 2: The building point clouds are divided into building instances by Ikd-2DSNN.
Step 3: According to the thresholds of minimum bounding rectangle length and width, the improved minimum bounding rectangle algorithm (Section 2.2.3) is used to determine whether the building point cloud cluster is an isolated point cloud cluster or a building instance to be evaluated.
Step 4: The model consistency evaluation method is used to calculate the geometric feature of the building instance.
Step 5: The geometric feature of building instance is used to determine whether the building instance to be evaluated is a single building instance or a multi-building instance.
Step 6: Octree-based regional growing [45] is used to extract multi-building planes from multi-building instances. Then, according to the angle θ between multi-building planes’ normal vector and horizontal direction, the multi-building facade point clouds are deleted. The multi-building non-facade point clouds are regarded as multi-building roof point clouds.
Step 7: Multi-building roof point clouds are divided into building roof instance by the Ikd-3DSNN algorithm. The parameters of neighbor search radius d c 2 and ratio k t 2 are used in the Ikd-3DSNN algorithm.

2.2.1. The Improved kd Tree Shared Nearest Neighbor Clustering Algorithm

Since the density-based spatial clustering of applications with noise (DBSCAN) algorithm [46] is not affected by noise, it is widely used in point cloud segmentation. DBSCAN is used to discover clusters of arbitrary shape in the presence of noise. Czerniawski et al. [47] used the DBSCAN clustering algorithm to detect major planes in cluttered point clouds. Plane sets were separated into individual planes by DBSCAN in x y z space [48]. Due to reflections from building materials, point cloud density is relatively uneven. While DBSCAN can find clusters of arbitrary shapes, it cannot handle data containing clusters of differing densities, since its density-based definition of core points cannot identify the core points of varying density clusters. A shared nearest neighbor approach to similarity was proposed by Jarvis and Patrick in [49] and also later by Levent [50] and Faustino [51]; it finds clusters that these approaches overlook, i.e., clusters of low or medium density which represented relatively uniform regions “surrounded” by non-uniform or higher density areas. However, the shared nearest neighbor approach may incorrectly connect distant points. In this paper, we propose an improved kd tree shared nearest neighbor clustering algorithm (Ikd-SNN).
The kd-SNN clustering algorithm uses a density based approach to find core points. First, the algorithm calculates the similarity matrix, and then, sparsify the similarity matrix is constructed by keeping only the k most similar neighbors and the shared nearest neighbor graph from the sparsified similarity matrix is constructed. Next, the shared nearest neighbor density of each point and the core points are found, and clusters from the core points are formed. Those points that do not form a shared nearest neighbor graph from the sparsified similarity matrix with the core point are regarded as noise points. Finally, all noise points are discarded and all non-noise, non-core points are assigned to clusters.
The kd-SNN clustering algorithm includes two parameters, which are neighbor number and shared neighbor number. Since the point cloud density is relatively uneven, it is possible to connect distant points from different building instances by kd-SNN clustering. Points within a point neighborhood radius are more likely to be the same instance than points within a point neighborhood number. Meanwhile, the point spacing is not affected by repeated scanning point clouds and farther points are not connected.
The point cloud density of the same building does not change much, and the point cloud density between different buildings will vary greatly. Shared neighbor number cannot distinguish the density changes within the neighborhood of each point, so the same instance and different instances cannot be distinguished well. Because the ratio of shared neighbor number to neighbor number can better distinguish the changes in point cloud density, the neighbor number is replaced by the ratio of shared neighbor number to neighbor number. The key steps of the improved kd tree shared nearest neighbor (Ikd-SNN) clustering algorithm are as follows.
(1) A point in the point cloud is selected and it is marked that the point has been visited. The point is regarded as the center point c t 1 and d c 1 is regarded as the radius of the sphere, and the sphere is the neighbor of the point. The number of points in the neighborhood radius d c 1 of the center point c t 1 is num 1 .
(2) Each point in the neighborhood radius is taken as the center point c t 2 , and the number of points num 2 within the radius d c 1 of the center point c t 2 is calculated.
(3) The number of shared points in num 1 and num 2 is num 3 ; num 1 and num 2 are compared, and the smaller value is assigned to num. The ratio k t of num to num 3 is the ratio of the number of shared neighbors to the number of neighbors.
(4) A point is added to the c t 1 cluster center if the ratio k t is greater than the threshold, and then, the point is marked as visited; otherwise, it is not marked.
(5) Repeat steps (2), (3) and (4) until the points in each center point c t 2 are calculated.
(6) Repeat steps (1), (2), (3), (4) and (5) until all points are visited.
Building point clouds are divided into building instances by the improved kd tree 2D shared nearest neighbor clustering algorithm (Ikd-2DSNN). Then, the model consistency evaluation method is used to distinguish whether the building instance is a single-building instance or a multi-building one. Next, octree-based regional growing is used to extract multi-building roof planes from the multi-building instances. Then, the multi-building roof planes are divided into single-building roof instances by the improved kd-tree 3D shared nearest neighbor clustering algorithm (Ikd-3DSNN). In the process of building instance segmentation, the kd-SNN algorithm is called the kd-2DSNN algorithm when calculating two-dimensional Euclidean distance in x o y space. The two-dimensional Euclidean distance d c is equal to d c 1 . The ratio k t is equal to k t 1 . In the same way, the Ikd-3DSNN algorithm calculates three-dimensional Euclidean distance in x y z space; the three-dimensional Euclidean distance d c is equal to d c 2 and the ratio k t is equal to k t 2 .

2.2.2. Model Consistency Evaluation Method

Based on the visual psychology of Gestalt theory, the factors that can attract human visual attention into some basic structures and structure clustering methods, including color constancy law, vicinity law, similarity law, Rubin’s closure law, constant width law, symmetry law and convexity law, are summarized [52]. The height of the same building roof point cloud is basically similar and the density of that is uniform. Meanwhile, each building instance point cloud is a cluster, and the distance between buildings is much larger than the distance between points. The ratio of the actual building volume to the building volume based on the projected area stretch is close to 1. Based on the characteristics of Gestalt theory and buildings, a building is regarded as a column structure. According to the approximate consistency between a abuilding and a column structure model, this paper proposes a model consistency evaluation method based on the ratio of the actual building volume to the building volume based on the projected area stretch, which is used to determine whether the building instance is a single-building instance or a multi-building one. A multi-building instance is further segmented to improve the completeness, correctness and quality of the building instance segmentation. The key steps of the model consistency evaluation method are as follows.
Step 1: Maximum and minimum of point clouds are calculated. The lateral dimensions of the grid are d c , and d c is equal to the point spacing d c 1 . A grid is established in xoy space, and then, the grid is filled with point clouds, as shown in Figure 5a.
Step 2: The grid with point clouds is marked as true. Otherwise, it is marked as false, as shown by the gray area in Figure 5b. The grid marked number n u m 2 d is counted, and the building projected area a r e a 2 d t is calculated by n u m 2 d and d c .
Step 3: The height of the three-dimensional grid is equal to dc , and then, the number of the grid rows ( n x ), columns ( n y ) and layers ( n z ) is calculated by the maximum, minimum and dc . A three-dimensional grid is established according to step 1, and it is filled with point clouds, as shown in Figure 6a.
Step 4: The grid with point clouds is marked as true starting from the top layer of row zero and column zero for the three-dimensional grid, as shown in Figure 6b, and it is marked as visited. Then, all grids below the marked grid are marked as true, as shown in Figure 6c, and they are marked as visited.
Step 5: Step 4 is repeated until all grids are marked as visited, as shown in Figure 6d.
Step 6: The three-dimensional grid marked as true number n u m 3 d is counted. According to length, width and height of the grid and the marked grid number n u m 3 d , the actual volume v o l 3 d of the building is calculated.
Step 7: According to the characteristics of the building column structure, the building projected area a r e a 2 d t in the two-dimensional grid and the layer number n z of the three-dimensional grid, the building volume v o l 3 d t based on the projected area stretch is counted as Equation (1), as shown in Figure 5c.
v o l 3 d t = a r e a 2 d n z
where v o l 3 d t represents the building volume based on the projected area stretch; a r e a 2 d t represents building projected area; n z represents the layer number of the three-dimensional grid.
Step 8: Since the same building roof height is basically similar, whether the point cloud instance is a single-building instance or a multi-building instance is determined by the ratio of the actual building volume to the building volume based on the projected area stretch. The ratio is calculated as Equation (2).
r t   =   v o l 3 d / v o l 3 d t
where rt is a ratio of the actual building volume to the building volume based on the projected area stretch. The closer the ratio is to 1, the more likely it is to be a single-building cluster.

2.2.3. The Improved Minimum Bounding Rectangle (MBR) Algorithm

The MBR algorithm can obtain the minimum area among a rectangle with any shape and is often used to detect building boundaries [53,54,55]. The most classic MBR algorithm is the rotation method. According to a rotating point cloud cluster, a bounding rectangle area is calculated, and the MBR algorithm is improved based on the monotonicity change of the bounding rectangle area. The improved MBR algorithm is used to determine whether the cluster is an isolated point cloud cluster or an evaluated cluster according to the minimum bounding rectangle thresholds of the length and width. The pseudocode of the improved MBR algorithm is detailed in Algorithm 1.
Algorithm 1. The improved minimum bounding rectangle (MBR) algorithm.
1. Notation:
2.    bc : current building point cloud instance
3.  θ   : current rotation angle
4.  Δ θ : The degree of increase or decrease for each rotation
5.  S : area of building point cloud cluster bounding rectangle without rotation
6.  S : area of last rotated building point cloud cluster bounding rectangle
7.  S : area of next rotated building point cloud cluster bounding rectangle
8.  L length , W width : improved MBR length and width
9. Input:   bc
10. Output: L length , W width
1 initialization: θ Δ θ 1 , S S S 0
2 Calculate area S of building point cloud cluster bounding rectangle
3 Rotate point cloud θ   degrees and calculate area S of rotated point cloud cluster bounding rectangle
4 if S > S do
5   for θ θ + Δ θ to 90 do
6    Rotate point cloud θ   degrees and calculate area S of current rotated building point cloud cluster;
7   if S > S do
8     S S ; θ θ + Δ θ
9    else
10     θ θ Δ θ ; Rotate point cloud θ   degrees and calculate length L length and width W width of building point cloud cluster bounding rectangle
11    L length L length ; W width W width
12   end if
13  end for
14 else
15  for θ θ Δ θ −90 do
16   Rotate point cloud θ degrees and calculate area S by current building point cloud cluster
17   if S > S do
18     S S ; θ θ Δ θ
19   else
20     θ θ + Δ θ ; Rotate point cloud θ   degrees and calculate length L length and width W width of building point cloud cluster bounding rectangle
21     L length L length ; W width W width
22   end if
23  end for
24 end if

2.3. Merging of Building Façade Point Clouds

Based on the characteristics of the building facade below the building roof, the building roof instance is projected into the xoy plane, and then, a projection region growing algorithm is utilized to obtain single-building instances with the building façade point clouds and building attachment point clouds. Figure 7 illustrates the projection region growing algorithm (the red point clouds represent the building roof and the blue point clouds represent the building facade point clouds). The key steps of the projection region growing are as follows:
Step 1: Maximum and minimum values of the building roof instance point clouds are calculated. The lateral dimensions of the grid are d c , and d c is equal to the point spacing d c 1 . Two-dimensional grid 1 is established, and then, it is filled with the building roof instance point clouds.
Step 2: The same grid 2 as in step 1 is created, and two-dimensional grid 2 is filled with the multi-building instances point clouds.
Step 3: In grid 2, the point clouds corresponding to the point cloud in grid 1 are point clouds of projection region growing.
Step 4: Repeat step 2 and step 3 for each single-building roof instance; the single-building instances with building facade point clouds and building attachment point clouds are obtained.
Figure 7. An illustration of region growing.
Remotesensing 13 01136 g007

2.4. Recognition and Merging of Roof Detail Instance

The building attachment point clouds are obtained as shown in Section 2.3, and then, the building attachment point clouds are divided into building instances by Ikd-2DSNN. The instance is judged by the MBR maximum M B R max (i.e., MBR length and MBR width are equal to M B R max ), the maximum difference value ( d v max ) and the minimum difference value ( d v min ). The instance is a roof detail instance if the length and width of the building roof instance MBR are less than M B R max and the difference value is within the range of d v max and d v min . The maximum difference threshold and the minimum difference threshold between the maximum height value of roof detail instance and the maximum height value of the single-building instance with building facade point clouds are d v max and d v min , respectively. The instance is a small building instance if it is not a roof detail instance and the length and width of the cluster point clouds MBR are larger than the length and width thresholds of minimum building MBR M B R min ; otherwise, it is an isolated point cloud cluster.

2.5. Merging of Isolated Point Cloud Clusters

After merging of building façade point clouds and roof detail instance point clouds, there are still some isolated point cloud clusters (an isolated point cloud cluster generally refers to some building outlier point clouds or sparse roof point clouds caused by material reflection). Each point of isolated point cloud clusters is treated as the search center to find the nearest building point to the discrete point. The label of the nearest building point is assigned to the point, and then, the discrete points are merged into the nearest building instance.

3. Experiments and Analysis

The implementation details of the experiments including the descriptions of the benchmark datasets, the evaluation criteria and the parameter settings of the UBIS method are described in this section. The UBIS method was implemented in C++. The experiments were conducted on a computer with 8 GB RAM and an Intel Core i7-9750H @ 2.59 GHz CPU.

3.1. Datasets Description

The performance of the UBIS method was evaluated with five airborne LiDAR datasets. The mean flying height of dataset 1 and dataset 2 was 900 m in Ningbo, China, and the average LiDAR point spacing was roughly 0.35 m. The median point density of building point clouds was 8 points/m2. Dataset 1 was a purely high-rise building scene. Dataset 2 was a podium building scene. Dataset 3 was the international society for photogrammetry and remote sensing (ISPRS) benchmark dataset captured over Vaihingen in Germany [56,57]. The LiDAR data used in this paper have been classified as building regions [58]. The airborne LiDAR point clouds were acquired by a Leica ALS50 system at an average flying height of 500 m with a median point density of 6.7 points/m2. The average LiDAR point spacing was roughly 0.4~0.5 m. The dataset was a purely residential area with small, detached houses [59]. Dataset 4 and dataset 5 were dayton annotated LiDAR earth scan (DALES) datasets, which were collected using a Riegl Q1560 dual-channel system flown in a Piper PA31 Panther Navajo aircraft [60]. The entire aerial LiDAR collection spanned 330 km2 over the city of Surrey in British Columbia, Canada [60]. The altitude was 1300 m, with a 400% minimum overlap. The median point cloud density was 6 points/m2. The average LiDAR point spacing was roughly 0.5~0.6 m. Dataset 4 and dataset 5 were purely residential areas with small, detached houses. The LiDAR datasets used in this study are classified as “building” regions, which are marked by manual labeling and published benchmark datasets. Ground filtering and building segmentation were conducted as preprocessing, which is not studied in this article.

3.2. Evaluation Criteria

For building instance segmentation, point-based evaluation and object-based evaluation based on point-in-polygon tests are not applicable. Object-based evaluation by evaluating the mutual overlap is calculated by IoU to evaluate building instance segmentation, which is correctly segmented building instance, under-segmented building instance or over-segmented building instance [61]. When IoU is larger than the threshold of minimum overlap, the automatically segmented building instance is a correctly segmented building instance. The automatically segmented building instance is an over-segmented building instance if IoU is less than the threshold of minimum overlap and contains only one building instance point cloud in the ground truth. The automatically segmented building instance is an under-segmented building instance if IoU is less than the threshold of minimum overlap and contains multiple building instance point clouds in the ground truth. IoU is counted as Equation (3).
IoU = p o i n t c p o i n t g p o i n t c p o i n t g
where p o i n t c represents automatically segmented building instance point clouds and p o i n t g represents building instance point clouds in the ground truth.
Completeness is also referred to as the detection rate [62] or as the producer’s accuracy [63] and is the percentage of entities in the reference that were detected. Correctness, also referred to as user’s accuracy [63], indicates how well the detected entities match the reference and is closely linked to the false alarm rate. A good segmentation should have both high completeness and correctness, and quality is a comprehensive evaluation parameter for completeness and correctness. Based on the manual marking test data as the ground truth, the UBIS method utilized completeness, correctness and quality to verify building instance segmentation effect [64]. The completeness, correctness and quality are calculated as Equation (4), Equation (5) and Equation (6), respectively.
completeleness = TP TP + FN
correctness = TP TP + FP
quality = TP TP + FP + FN
where TP, FP and FN represent the number of correctly segmented building instances, the number of under-segmented building instances and the number of over-segmented building instances, respectively.

3.3. Parameter Settings

Five datasets were processed by the proposed UBIS method. Table 1 shows the key parameter settings of the UBIS method, which were set by trial and error. These parameter settings were used for all the experiments in this paper. r t , θ , M B R max , M B R min , d v max and d v min were set for the five datasets. However, five parameters (i.e., d c 1 , k t 1 , d c 2 , k t 2 and d c ) were tuned according to the building point cloud density.

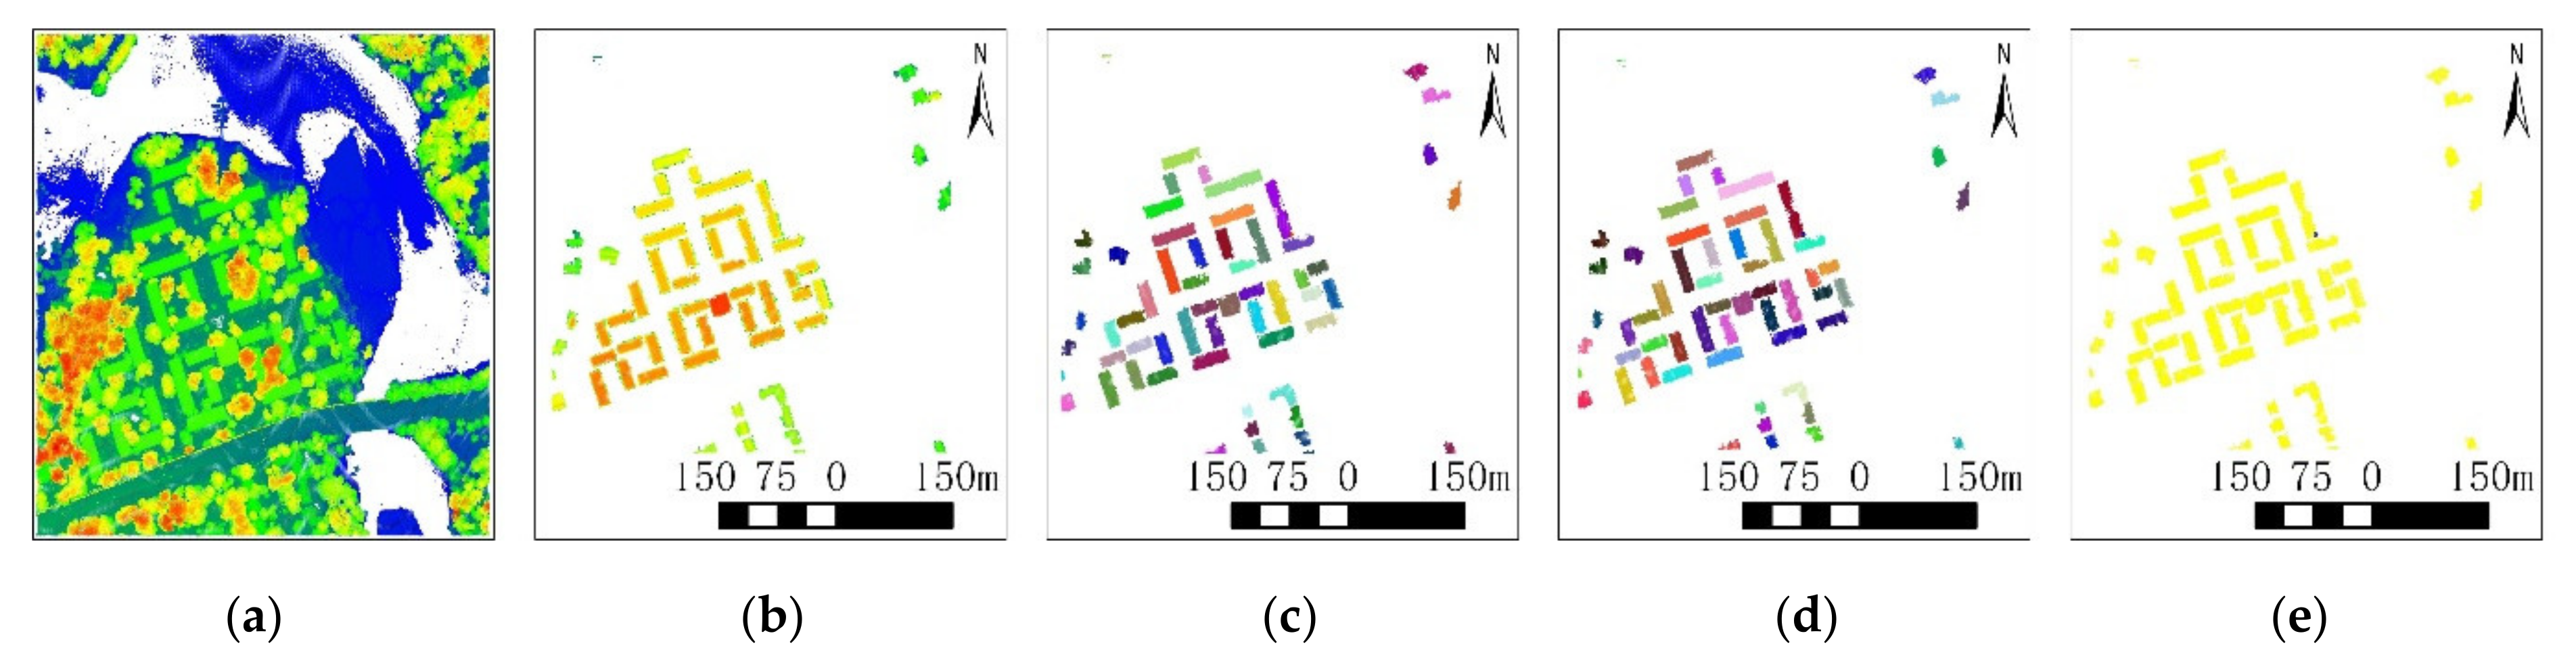
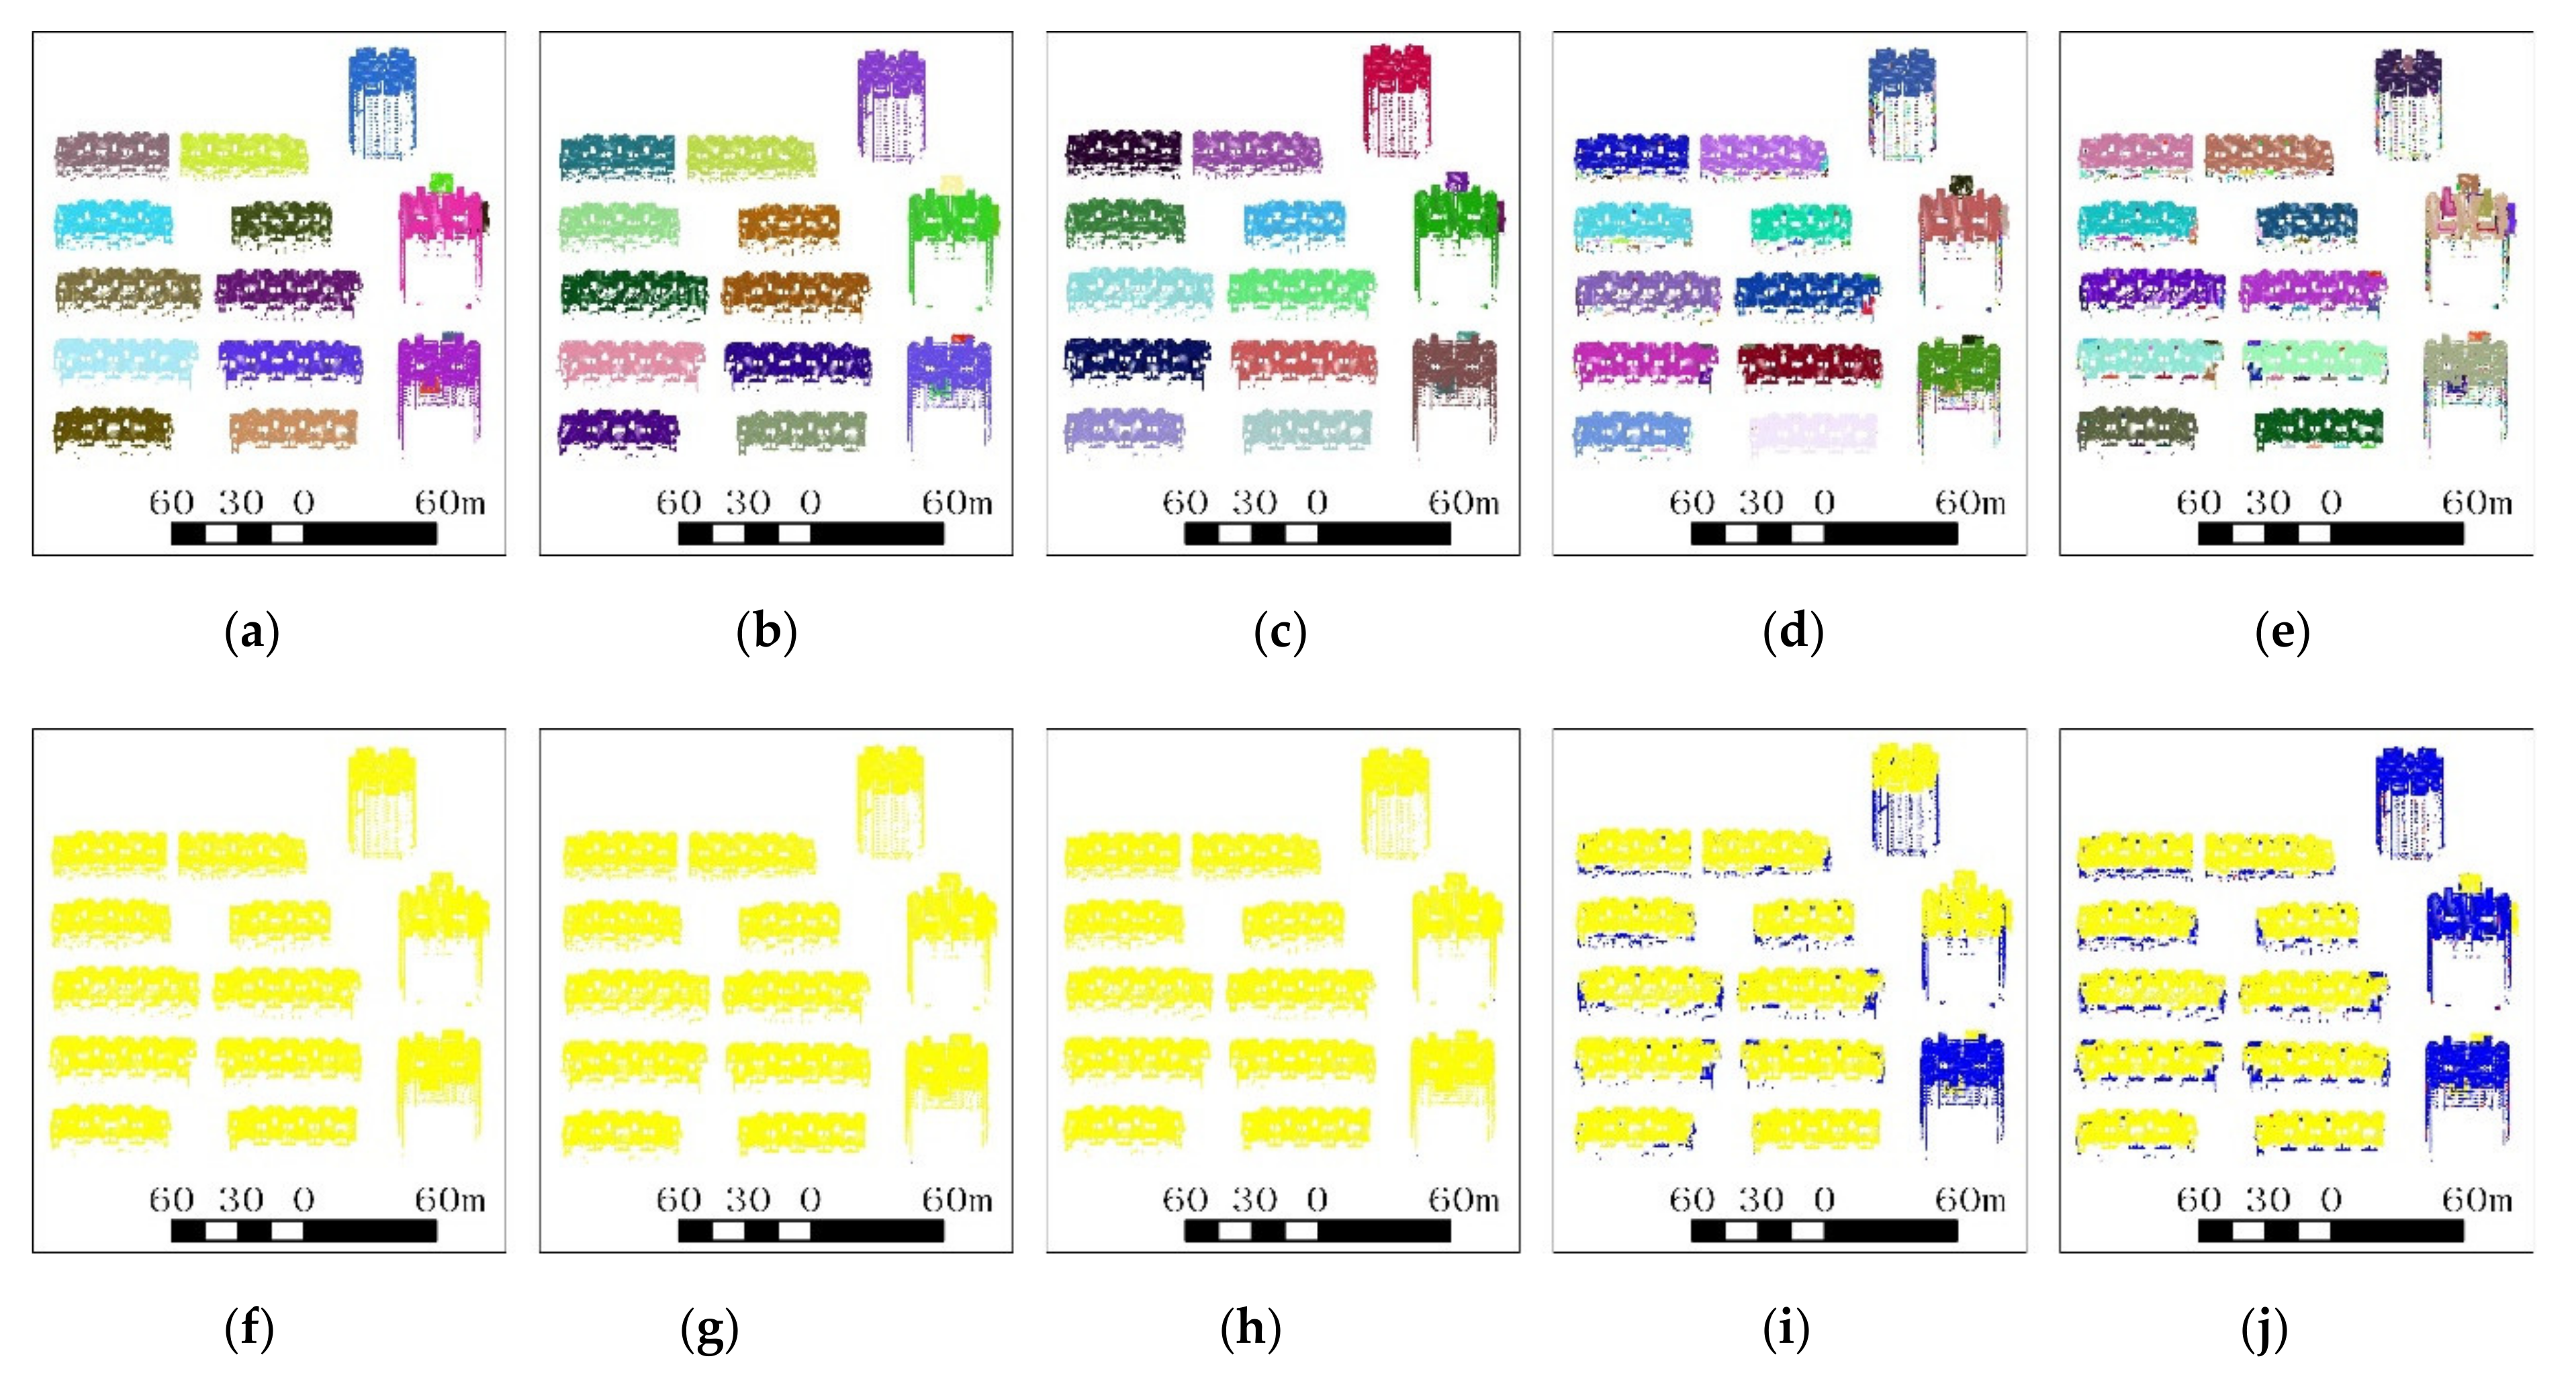
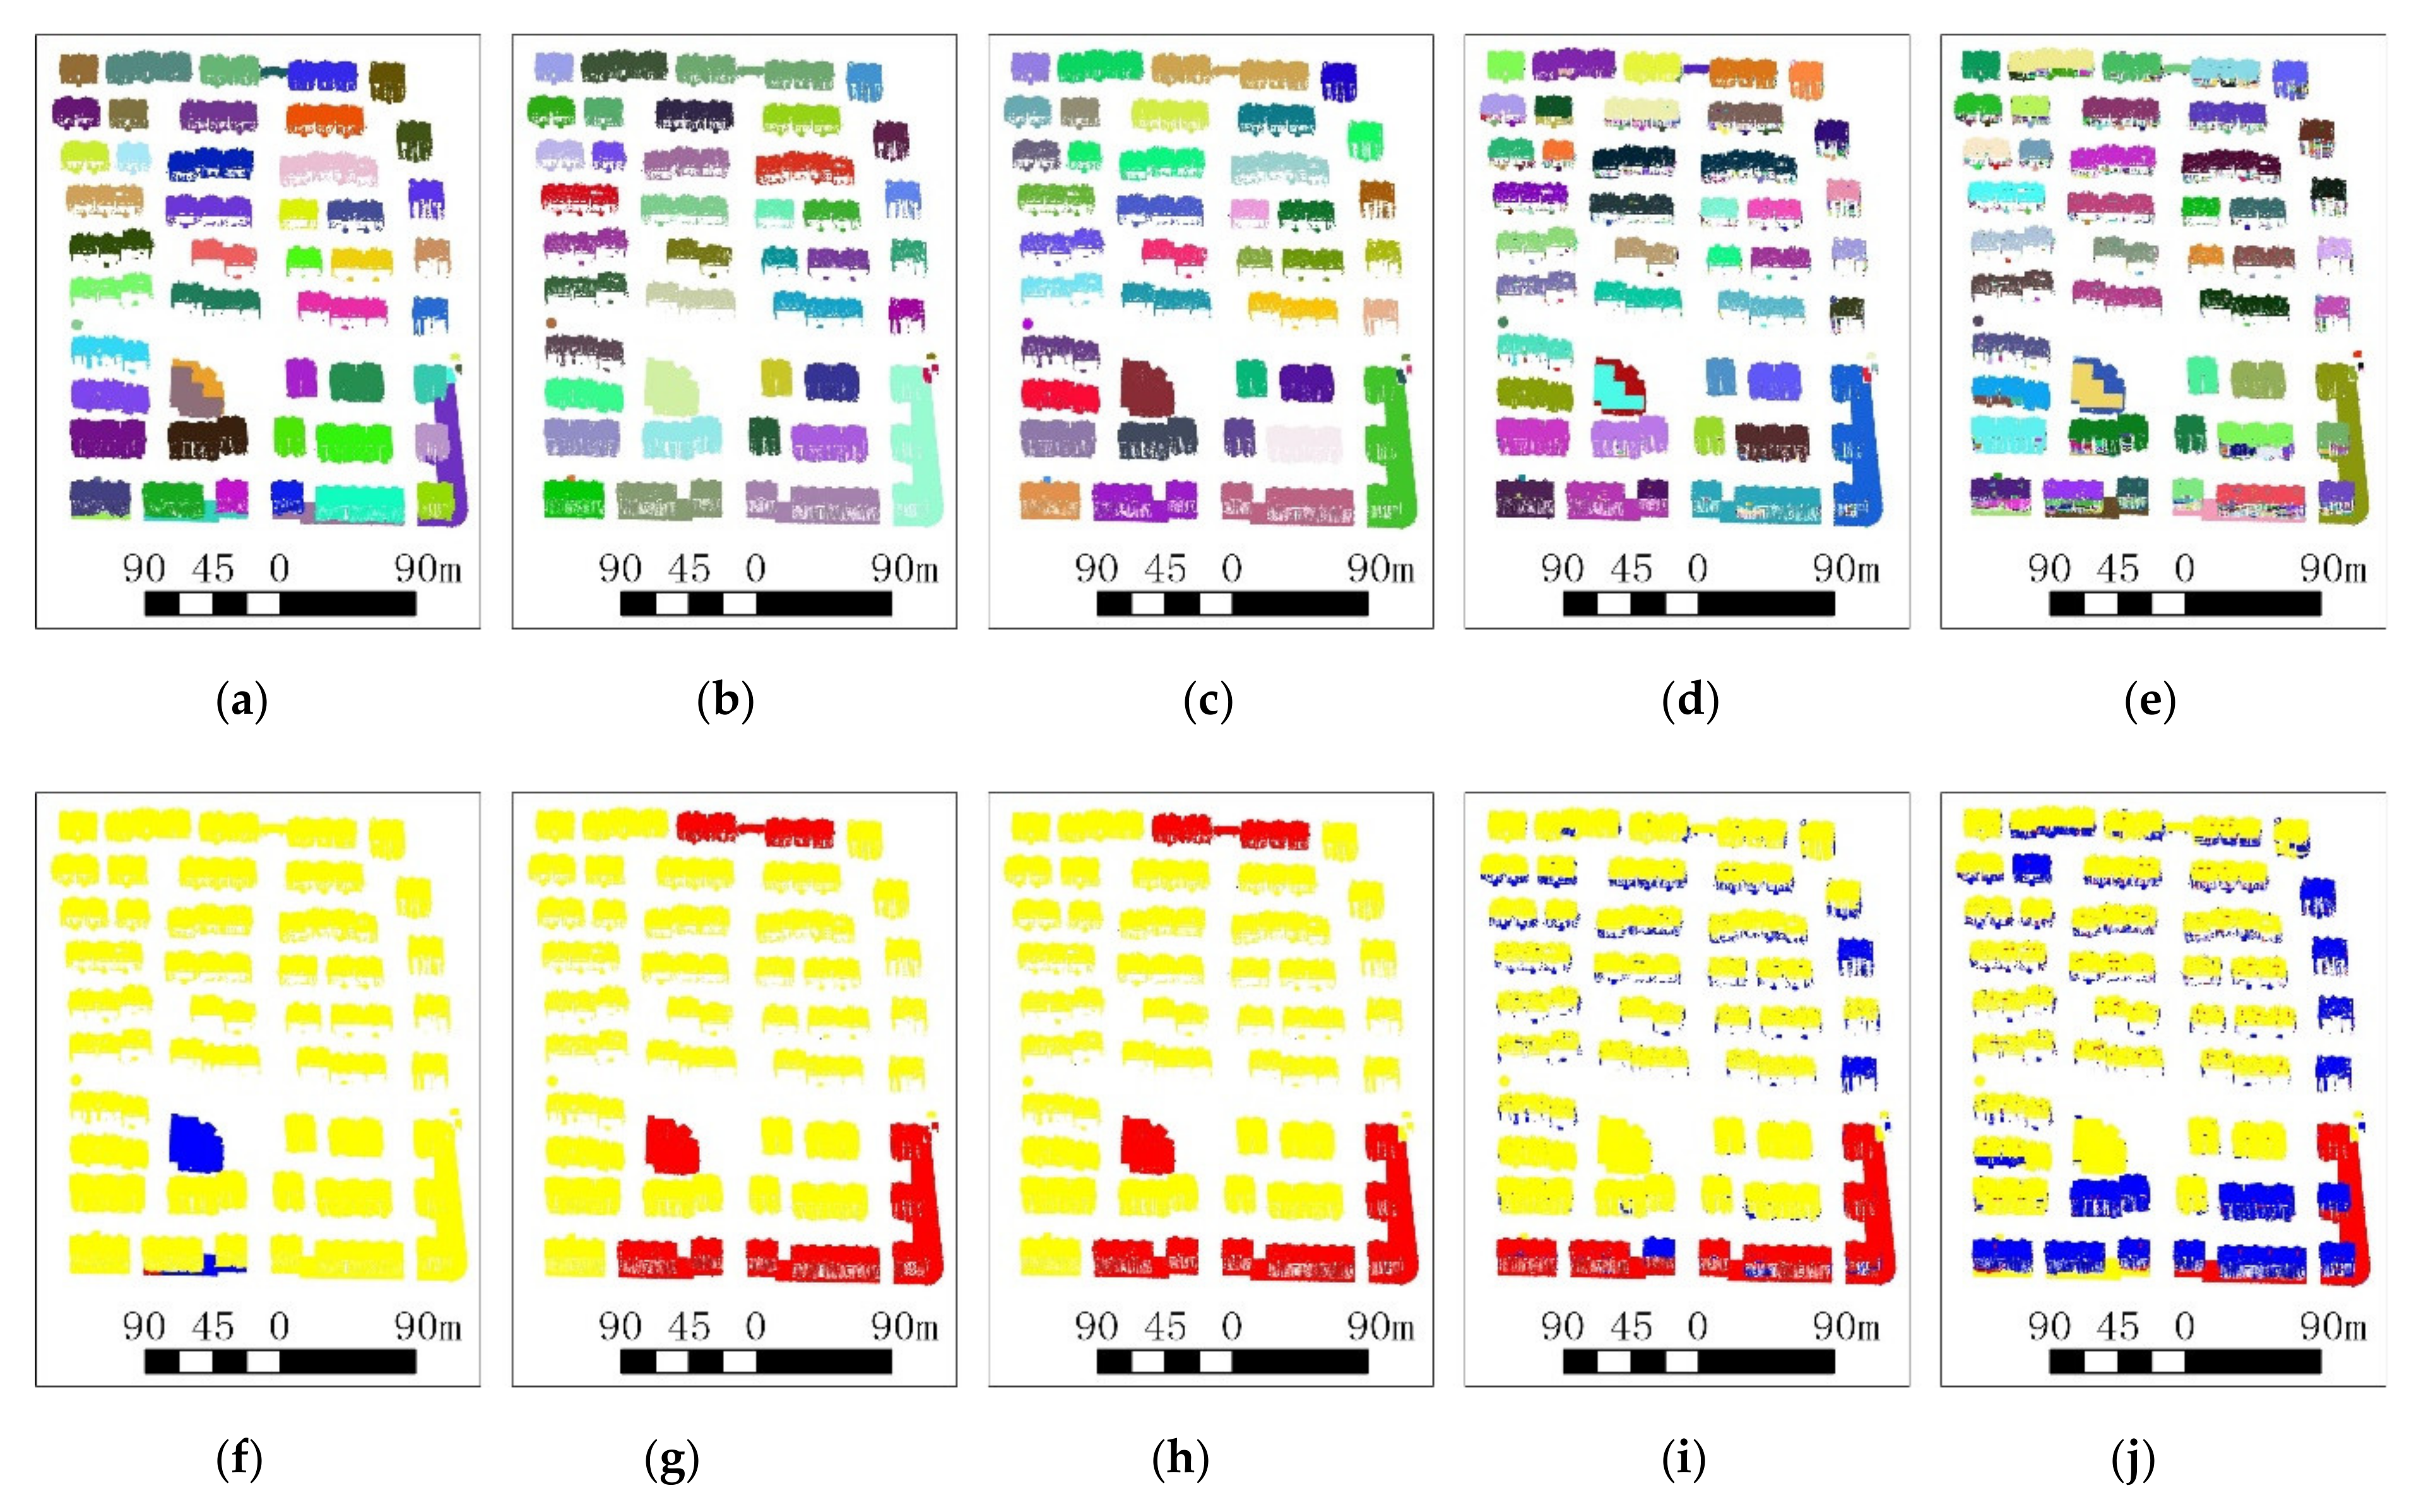
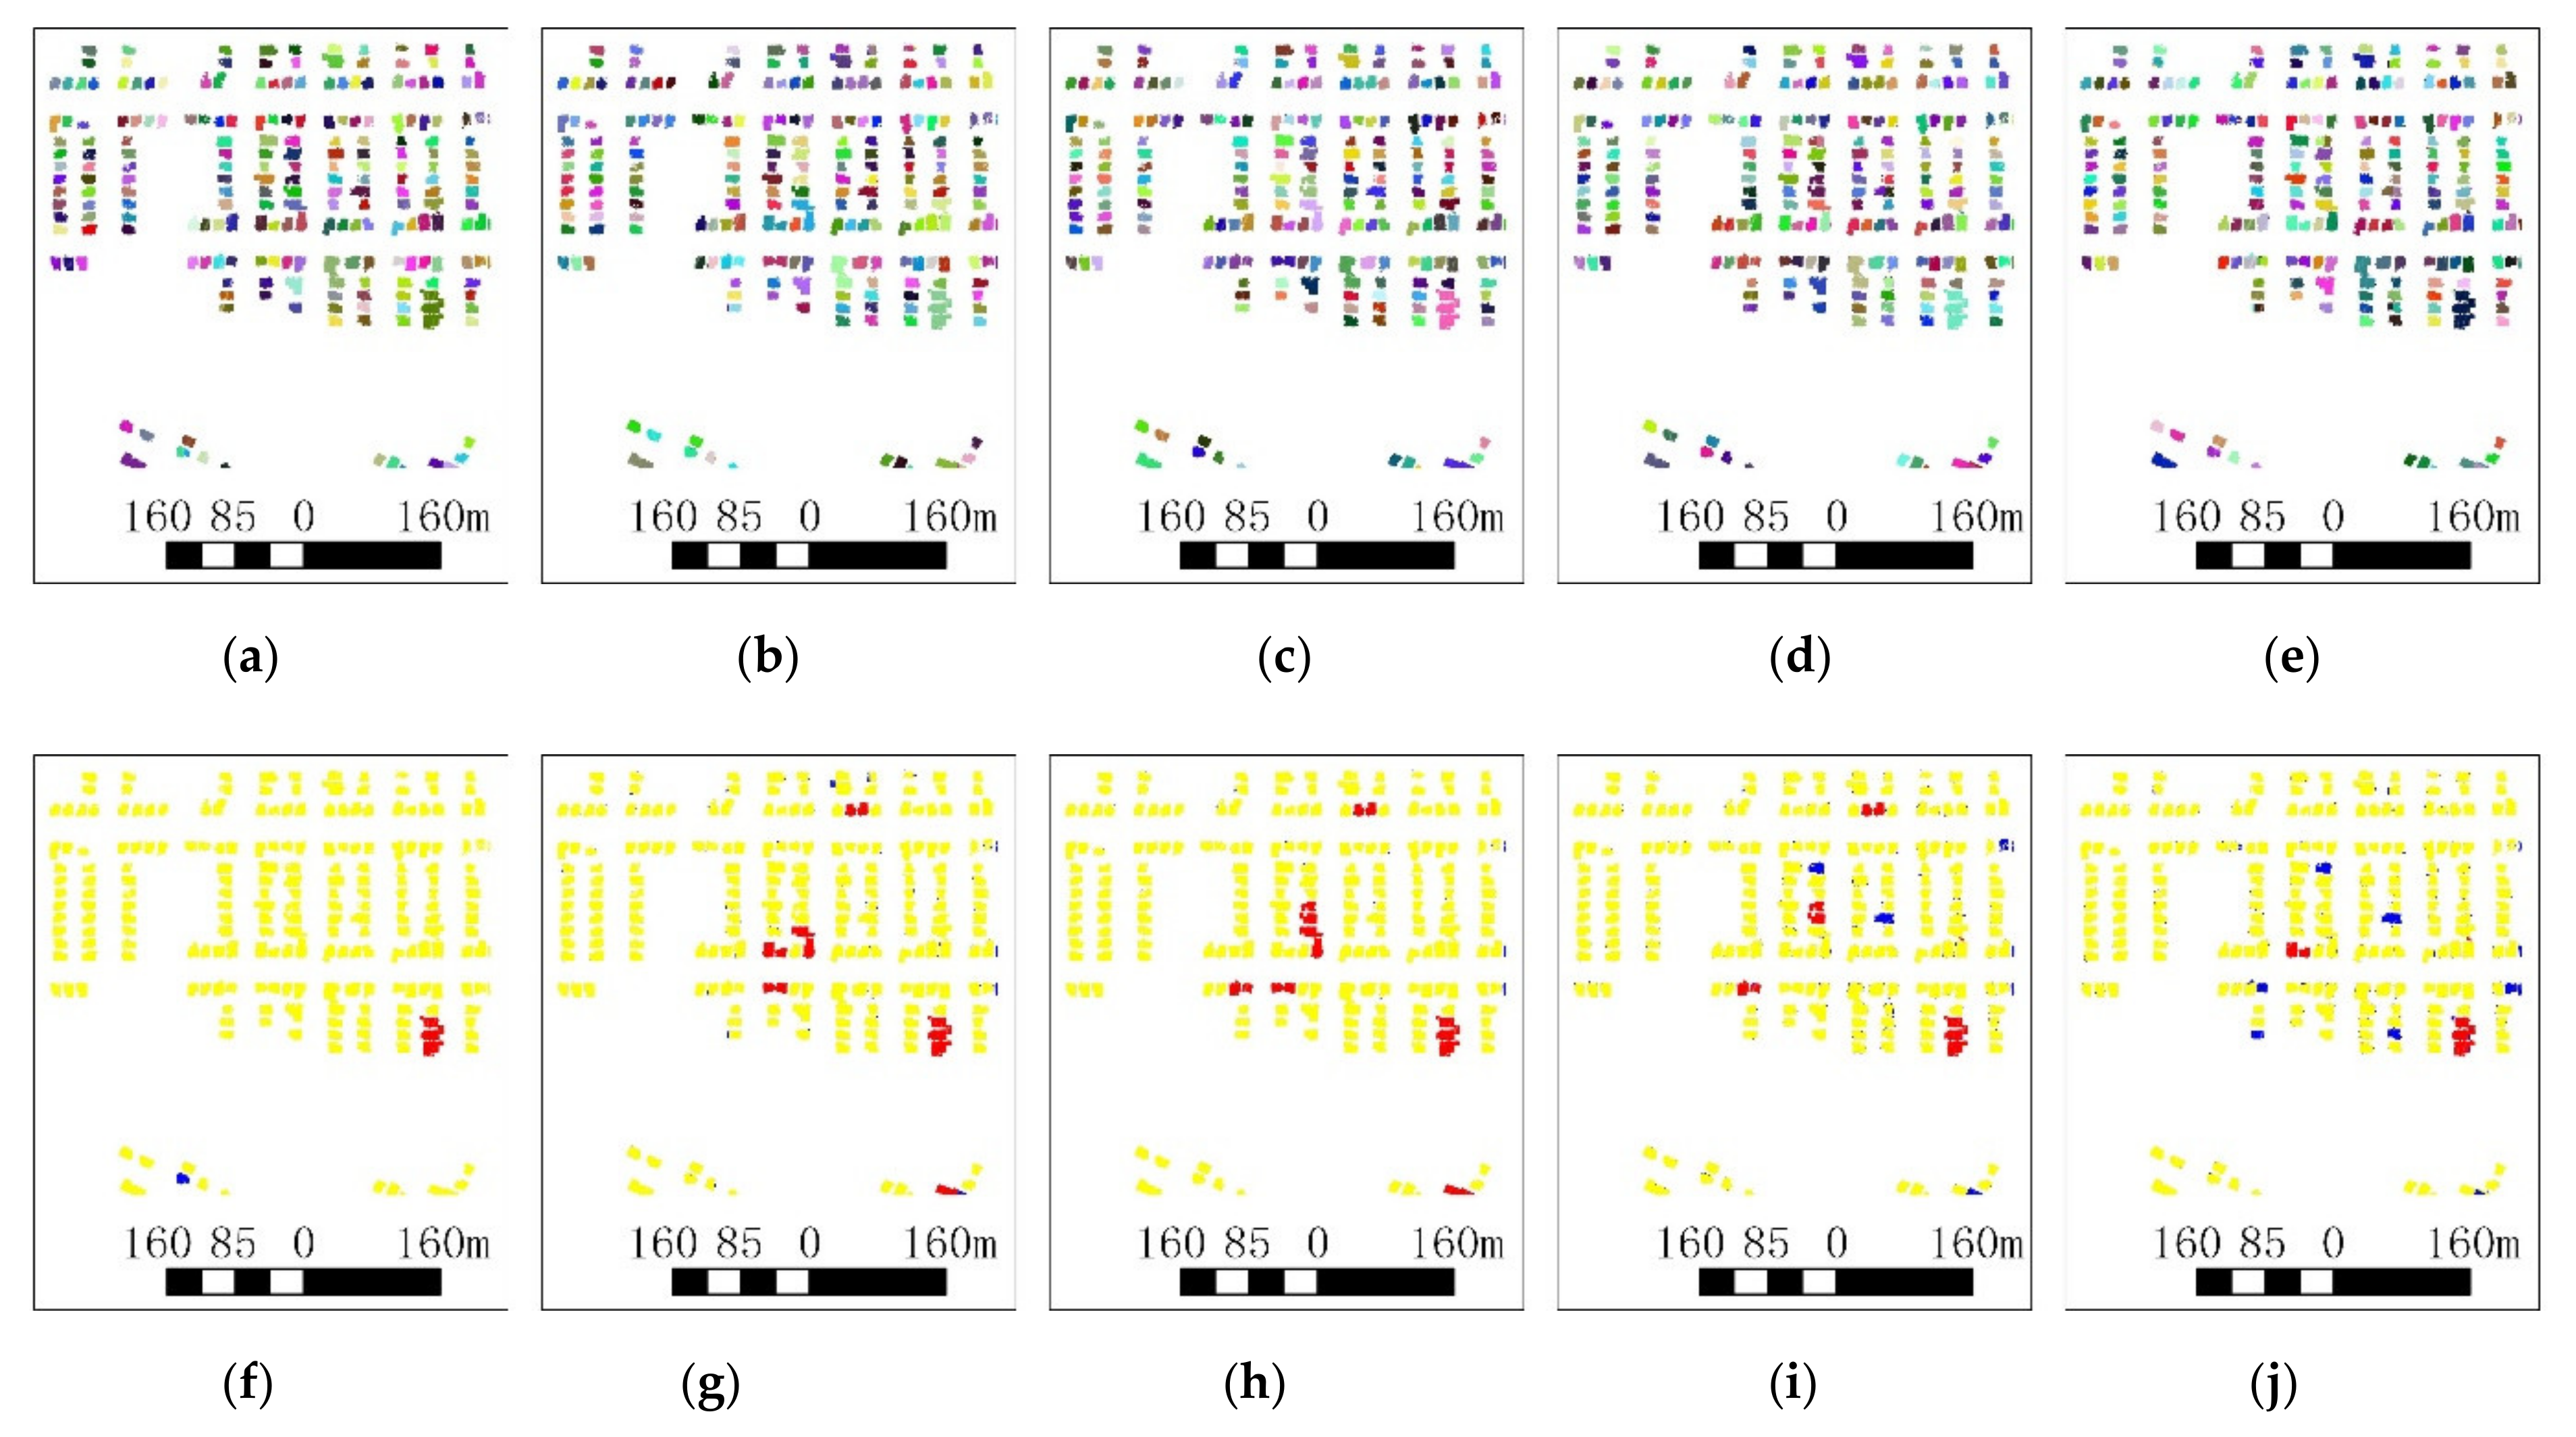
3.4. Experimental Results

Figure 8, Figure 9, Figure 10, Figure 11 and Figure 12 show the outcomes of the UBIS method for various types of buildings in different scenes. Five building point clouds datasets were selected from Ningbo, China, Germany (the ISPRS benchmark dataset) and Canada (DALES datasets). This building instance contains the evaluation on a per-building instance level. Figure 8a, Figure 9a and Figure 10a represent aerial images corresponding to input point clouds. Figure 11a and Figure 12a do not provide the corresponding aerial images on the public dataset. They represent the point clouds of the entire scene displayed in different colors according to their heights. Figure 8b, Figure 9b, Figure 10b, Figure 11b and Figure 12b represent the five selected building point clouds, which show the LiDAR data displayed in different colors according to their heights. Figure 8c, Figure 9c, Figure 10c, Figure 11c and Figure 12c represent the results of the UBIS method, where each single-building instance is dotted in one color. It is worth noting that the proposed UBIS method combines building point cloud segmentation, merging of building façade point clouds, recognition and merging of roof detail instances and merging of isolated point cloud clusters, which significantly improves the problem of building instance segmentation in complex scenes. Figure 8d, Figure 9d, Figure 10d, Figure 11d and Figure 12d are the ground truth of each point cloud, which was manually labeled using CloudCompare point cloud software [65]. Figure 8e, Figure 9e, Figure 10e, Figure 11e and Figure 12e show the main differences between the UBIS method results and the ground truth (the minimum overlap between the UBIS method results and the ground truth is 0.75), where the yellow, red and blue regions represent correctly segmented buildings instance, under-segmented building instances and over-segmented building instances, respectively. More specifically, complex scenes’ buildings, for example, where multiple building roofs are adjacent, the height of the building roof is similar and the density of the roof point cloud is uniform, are difficult to divide into different roof instances (e.g., the red region in Figure 8e, Figure 9e, Figure 10e, Figure 11e and Figure 12e). Because the point cloud density is sparse or some buildings are partially missing, or the structure of the building roof is extremely complex, it makes the building over-segmented (e.g., the blue region in Figure 8e, Figure 9e, Figure 10e, Figure 11e and Figure 12e). Dataset 1 contains high-rise buildings. Dataset 2 contains podium buildings. The scale and orientation of each figure are lower and upper of that, respectively, as shown in (a–e) of Figure 8, Figure 9, Figure 10, Figure 11 and Figure 12. Dataset 3, dataset 4 and dataset 5 are purely residential areas with detached houses. The building point clouds collected contain various buildings in different scenes, all of which pose great challenges for building instance segmentation. The experimental results show that the UBIS method can acquire a good performance of building instance segmentation on high-rise buildings, podium buildings and residential areas with detached houses. The implementation of UBIS will be available soon at http://skyearth.org/publication/project/UBIS/ (accessed on 8 February 2021).
To evaluate the performance of the UBIS method for building instance segmentation, the building instance segmentation result was compared to the manually marked ground truth in terms of the completeness, correctness and quality. IoU 0.5 and IoU 0.75 are two typical IoU levels [55] (i.e., IoU 0.5 and IoU 0.75 are minimum overlaps of 50% and 75% with the corresponding building instance in the ground truth, respectively). The units are %. The corresponding metrics and runtime on the selected point clouds are listed in Table 2. It was found that the UBIS method can acquire a good performance for building instance segmentation of airborne LiDAR point clouds with high-rise buildings, podium buildings and a residential area with detached houses. In the high-rise building scene, each point cloud cluster only contains one building instance, and its instance segmentation accuracy is the highest. In the podium building scene, due to occlusion of buildings or extremely complex building roof structure, the building instance segmentation includes over-segmented building instances. The instance segmentation accuracy is lower than that of the high-rise building scene instance segmentation. In the residential area with detached houses, the distance between the buildings is relatively close, and some adjacent buildings have the same height and uniform density, so the segmentation result contains some under-segmented building instances. The completeness, correctness and quality of the UBIS method are above 92% for the five datasets.

3.5. Performance Comparison

To further compare the performance of the UBIS method with other state-of-the-art approaches, we conducted building instance segmentation using different selected methods on the point clouds of the five datasets. The three-dimensional Euclidean-based segmentation method (ES3D) [37,38] and the moving window algorithm (MV) [40,41,42] are the most popular building instance segmentation methods; Locally convex connected patches (LCCP) [32] is an efficient learning- and model-free approach for the segmentation of 3D point clouds into object parts. To further illustrate that the proposed UBIS method fully combines the advantages of the two-dimensional clustering algorithm and three-dimensional clustering algorithm, the two-dimensional Euclidean based-segmentation method is introduced and compared with the method proposed in this paper. The two-dimensional Euclidean-based segmentation method (ES2D) is similar to ES3D and calculates two-dimensional Euclidean distance in xoy space. For the existing building instance segmentation method, the authors only mention those algorithms or mention those algorithms and show the result of the processing, and they do not use public datasets or open, own datasets and those algorithms’ parameters. The key parameters of the ES3D method, the MV method, the ES2D method and the LCCP method were set by experiment.
Figure 13, Figure 14, Figure 15, Figure 16 and Figure 17 show the outcomes of the five methods on the five selected point clouds datasets, the scale and orientation of each figure, respectively. Table 3 lists their corresponding metrics; IoU 0.75 is used to evaluate the completeness, correctness and quality of building instance segmentation (i.e., IoU 0.75 is minimum overlap of 75% with the corresponding building instance in the ground truth). It was found that the UBIS method outperformed the benchmark methods on the selected point clouds. More specifically, many observations can be noted based on these comparison results: (1) The building instance segmentation completeness and quality of the ES2D method and MV method are lower than that of the UBIS method. The building instance segmentation completeness and quality of the ES3D method and LCCP method are far lower than that of the UBIS method. The building instance segmentation correctness of the ES2D method, MV method, ES3D method and LCCP method is lower than that of the UBIS method. (2) The building instance segmentation completeness and quality of the ES2D method and MV method are far higher than that of the ES3D method and LCCP method. The building instance segmentation correctness of the ES2D method and MV method is close to that of the ES3D method and LCCP method. (3) In this article, the proposed UBIS method combines building point cloud segmentation, merging of building façade point clouds, recognition and merging of roof detail instance and merging of isolated point cloud clusters, which significantly improve the completeness, correctness and quality of building instance segmentation in different scenes.
Figure 18 shows typical area results of dataset 3 and the scale and orientation of each figure. Figure 18a is the building point clouds. Figure 18b shows that the UBIS method can not only segment high-rise buildings in the blue circle but also podium buildings in the green circle. Figure 18c,d show that the MV method and the ES2D method can only segment high-rise buildings in the blue circle, while the podium buildings in the red circle will cause under-segmentation. Figure 18e and Figure 18f show the results of the ES3D method and the LCCP method, respectively. The blue circle and the green circle respectively contain under-segmented and over-segmented podium buildings and over-segmented buildings with façade point clouds. Figure 18g shows that the UBIS method can segment interconnected buildings in the blue circle. Figure 18h,i show that the MV method and the ES2D method will cause under-segmentation for interconnected buildings in the blue circle. Figure 18j,k show the ES3D method and the LCCP method results in the blue circle, which contain under-segmentation and over-segmentation for podium buildings and buildings with façade point clouds.

4. Conclusions

In this paper, we propose a novel unsupervised building instance segmentation (UBIS) method for parallel reconstruction analysis, which combines a clustering algorithm and a model consistency evaluation method. The proposed building instance segmentation method makes full use of the advantages of the two-dimensional clustering algorithm and the three-dimensional clustering algorithm. Building point clouds are divided into building instances by a two-dimensional clustering algorithm (Ikd-2DSNN), which avoids the over-segmentation of building facade and roof detail point cloud. The model consistency evaluation method is used to distinguish whether the building instance is a single-building instance or a multi-building one. The three-dimensional clustering algorithm (Ikd-3DSNN) is used to segment multi-building instances again to improve the accuracy of building instance segmentation. The experimental results in Section 3.2 have demonstrated that the proposed UBIS method obtained good performance in various scenes of building point clouds and outperformed four state-of-the-art approaches, whose completeness, correctness and quality remained above 92% with five datasets. We found that the UBIS method also has = limitations for more complex cities with various typologies of buildings—for example, the point cloud density is sparse, some buildings are partially missing or the building roof is extremely complex. In future work, we will further extend the method to improve the robustness of the building instance segmentation.

Author Contributions

W.Y. and Y.Z. conceived the study and designed the experiment. W.Y. and X.L. performed the analysis. Y.W., X.Z. and Y.T. performed the design, literature search, data collection and proofreading. All authors took part in the manuscript preparation. All authors have read and agreed to the published version of the manuscript.

Funding

This research was funded by the National Natural Science Foundation of China under Grant No. 41871368 and the National Key Research and Development Program of China under Grant No. 2017YFB0503004.

Acknowledgments

This work was jointly supported by the National Natural Science Foundation of China and the National Key Research and Development Program of China. The authors also are grateful to ISPRS for providing the ALS dataset and the Dayton Annotated LiDAR Earth Scan (DALES) dataset.

Conflicts of Interest

We declare that we do not have any commercial or associative interest that represents a conflict of interest in connection with the work submitted.

References

  1. Baltsavias, E.P. A comparison between photogrammetry and laser scanning. ISPRS J. Photogramm. Remote Sens. 1999, 54, 83–94. [Google Scholar] [CrossRef]
  2. Wehr, A.; Lohr, U. Airborne laser scanning-an introduction and overview. ISPRS J. Photogramm. Remote Sens. 1999, 54, 68–82. [Google Scholar] [CrossRef]
  3. Zhang, Y.; Shen, X. Direct georeferencing of airborne LiDAR data in national coordinates. ISPRS J. Photogramm. Remote Sens. 2013, 84, 43–51. [Google Scholar] [CrossRef]
  4. Zhang, J.; Lin, X. Filtering airborne LiDAR data by embedding smoothness-constrained segmentation in progressive TIN densification. ISPRS J. Photogramm. Remote Sens. 2013, 81, 44–59. [Google Scholar] [CrossRef]
  5. Zhao, X.; Guo, Q.; Su, Y.; Xue, B. Improved progressive TIN densification filtering algorithm for airborne LiDAR data in forested areas. ISPRS J. Photogramm. Remote Sens. 2016, 117, 79–91. [Google Scholar] [CrossRef] [Green Version]
  6. Kang, X.; Liu, J.; Lin, X. Streaming Progressive TIN Densification Filter for Airborne LiDAR Point Clouds Using Multi-Core Architectures. Remote Sens. 2014, 6, 7212–7232. [Google Scholar] [CrossRef] [Green Version]
  7. Sithole, G.; Vosselman, G. Experimental comparison of filter algorithms for bare-Earth extraction from airborne laser scanning point clouds. ISPRS J. Photogramm. Remote Sens. 2004, 59, 85–101. [Google Scholar] [CrossRef]
  8. Hackel, T.; Savinov, N.; Ladicky, L.; Wegner, J.D.; Schindler, K.; Pollefeys, M. Semantic3D.net: A new Large-scale Point Cloud Classification Benchmark. arXiv 2017, arXiv:1704.03847. [Google Scholar] [CrossRef] [Green Version]
  9. Uy, M.A.; Pham, Q.; Hua, B.; Nguyen, T.; Yeung, S. Revisiting Point Cloud Classification: A New Benchmark Dataset and Classification Model on Real-World Data. In Proceedings of the 2019 IEEE/CVF International Conference on Computer Vision (ICCV), Seoul, Korea, 27 October–3 November 2019. [Google Scholar]
  10. Benshabat, Y.; Lindenbaum, M.; Fischer, A. 3D Point Cloud Classification and Segmentation using 3D Modified Fisher Vector Representation for Convolutional Neural Networks. arXiv 2017, arXiv:1711.08241. [Google Scholar]
  11. Liu, X.; Zhang, Y.; Ling, X.; Wan, Y.; Li, Q. Topolap: Topology recovery for building reconstruction by deducing the relationships between linear and planar primitives. Remote Sens. 2019, 11, 1372. [Google Scholar] [CrossRef] [Green Version]
  12. Cao, R.; Zhang, Y.; Liu, X.; Zhao, Z. 3d building roof reconstruction from airborne lidar point clouds: A framework based on a spatial database. Int. J. Geogr. Inf. Sci. 2017, 31, 1359–1380. [Google Scholar] [CrossRef]
  13. Filip, B.; Jantien, S.; Hugo, L.; Sisi, Z.; Çöltekin, A. Applications of 3d city models: State of the art review. ISPRS Int. J. Geo-Inf. 2015, 4, 2842–2889. [Google Scholar]
  14. Haala, N.; Kada, M. An update on automatic 3D building reconstruction. ISPRS J. Photogramm. Remote Sens. 2010, 65, 570–580. [Google Scholar] [CrossRef]
  15. Wang, R.; Peethambaran, J.; Dong, C. LiDAR Point Clouds to 3D Urban Models: A Review. IEEE J. Sel. Top. Appl. Earth Obs. Remote Sens. 2018, 11, 606–627. [Google Scholar] [CrossRef]
  16. Ferraz, A.; Bretar, F.; Jacquemoud, S.; Gonçalves, G.; Pereira, L.; Tomé, M.; Soares, P. 3-D mapping of a multi-layered Mediterranean forest using ALS data. Remote Sens. Environ. 2012, 121, 210–223. [Google Scholar] [CrossRef]
  17. Dai, W.; Yang, B.; Dong, Z.; Shaker, A. A new method for 3d individual tree extraction using multispectral airborne lidar point clouds. ISPRS J. Photogramm. Remote Sens. 2018, 144, 400–411. [Google Scholar] [CrossRef]
  18. Yang, B.; Dai, W.; Dong, Z.; Liu, Y. Automatic Forest Mapping at Individual Tree Levels from Terrestrial Laser Scanning Point Clouds with a Hierarchical Minimum Cut Method. Remote Sens. 2016, 8, 372. [Google Scholar] [CrossRef] [Green Version]
  19. Wang, D. Unsupervised semantic and instance segmentation of forest point clouds. ISPRS J. Photogramm. Remote Sens. 2020, 165, 86–97. [Google Scholar] [CrossRef]
  20. Liang, X.; Hyyppa, J.; Kaartinen, H.; Lehtomaki, M.; Pyorala, J.; Pfeifer, N.; Wang, Y. International benchmarking of terrestrial laser scanning approaches for forest inventories. ISPRS J. Photogramm. Remote Sens. 2018, 144, 137–179. [Google Scholar] [CrossRef]
  21. Hafiz, A.M.; Bhat, G.M. A survey on instance segmentation: State of the art. Int. J. Multimed. Inf. Retr. 2020, 9, 171–189. [Google Scholar] [CrossRef]
  22. Wang, X.; Liu, S.; Shen, X.; Shen, C.; Jia, J. Associatively Segmenting Instances and Semantics in Point Clouds. arXiv 2019, arXiv:1902.09852. [Google Scholar]
  23. Jia, Z.; Gallagher, A.C.; Saxena, A.; Chen, T. 3D Reasoning from Blocks to Stability. IEEE Trans. Pattern Anal. Mach. Intell. 2015, 37, 905–918. [Google Scholar] [CrossRef]
  24. Bonde, U.; Badrinarayanan, V.; Cipolla, R. Robust Instance Recognition in Presence of Occlusion and Clutter. Lect. Notes Comput. Sci. 2014, 8690, 520–535. [Google Scholar]
  25. Wang, T.; He, X.; Barnes, N. Learning Structured Hough Voting for Joint Object Detection and Occlusion Reasoning. In Proceedings of the 2013 IEEE Conference on Computer Vision and Pattern Recognition, Portland, OR, USA, 23–28 June 2013. [Google Scholar]
  26. Zermas, D.; Izzat, I.; Papanikolopoulos, N. Fast Segmentation of 3D Point Clouds: A Paradigm on LiDAR Data for Autonomous Vehicle Applications. In Proceedings of the 2017 IEEE International Conference on Robotics and Automation (ICRA), Singapore, 29 May–3 June 2017. [Google Scholar]
  27. Bogoslavskyi, I.; Stachniss, C. Efficient Online Segmentation for Sparse 3D Laser Scans. Photogramm. Fernerkund. Geoinf. 2017, 85, 41–52. [Google Scholar] [CrossRef]
  28. Bogoslavskyi, I.; Stachniss, C. Fast Range Image-Based Segmentation of Sparse 3D Laser Scans for Online Operation. In Proceedings of the 2016 IEEE/RSJ International Conference on Intelligent Robots and Systems (IROS), Daejeon, Korea, 9–14 October 2016; pp. 163–169. [Google Scholar]
  29. Korchev, D.; Cheng, S.; Owechko, Y.; Kim, K. On Real-Time LIDAR Data Segmentation and Classification. In Proceedings of the IPCV’13—2013 International Conference on Image Processing, Computer Vision, and Pattern Recognition, Las Vegas, VA, USA, 23–25 July 2013. [Google Scholar]
  30. Chen, S.; Liu, B.; Feng, C.; Vallespi-Gonzalez, C.; Wellington, C. 3D Point Cloud Processing and Learning for Autonomous Driving. IEEE Signal Process. Mag. 2020, 38, 68–86. [Google Scholar] [CrossRef]
  31. Kaiming, H.; Georgia, G.; Piotr, D.; Ross, G. Mask r-cnn. IEEE Trans. Pattern Anal. Mach. Intell. 2020, 42, 386–397. [Google Scholar]
  32. Stein, S.C.; Wrgtter, F.; Schoeler, M.; Papon, J.; Kulvicius, T. Convexity Based Object Partitioning for Robot Applications. In Proceedings of the 2014 IEEE International Conference on Robotics and Automation (ICRA), Hong Kong, China, 31 May–7 June 2014. [Google Scholar]
  33. Choy, C.B.; Park, J.; Koltun, V. Fully Convolutional Geometric Features. In Proceedings of the IEEE/CVF International Conference on Computer Vision (ICCV), Seoul, Korea, 27 October–3 November 2019. [Google Scholar]
  34. Gu, X.; Wang, Y.; Wu, C.; Lee, Y.J.; Wang, P. HPLFlowNet: Hierarchical Permutohedral Lattice FlowNet for Scene Flow Estimation on Large-Scale Point Clouds. arXiv 2017, arXiv:1906.05332. [Google Scholar]
  35. Liu, X.; Qi, C.R.; Guibas, L.J. FlowNet3D: Learning Scene Flow in 3D Point Clouds. arXiv 2019, arXiv:1806.01411. [Google Scholar]
  36. Chen, T.; Dai, B.; Wang, R.; Liu, D. Gaussian-Process-Based Real-Time Ground Segmentation for Autonomous Land Vehicles. J. Intell. Robot. Syst. 2014, 76, 563–582. [Google Scholar] [CrossRef]
  37. Ramiya, A.M.; Nidamanuri, R.R.; Krishnan, R. Segmentation based building detection approach from LiDAR point cloud. Egypt. J. Remote Sens. Space Sci. 2017, 20, 71–77. [Google Scholar] [CrossRef] [Green Version]
  38. Wang, H.; Zhang, W.; Chen, Y.; Chen, M.; Yan, K. Semantic Decomposition and Reconstruction of Compound Buildings with Symmetric Roofs from LiDAR Data and Aerial Imagery. Remote Sens. 2015, 7, 13945–13974. [Google Scholar] [CrossRef] [Green Version]
  39. Matei, B.C.; Sawhney, H.S.; Samarasekera, S.; Kim, J.; Kumar, R. Building Segmentation for Densely Built Urban Regions Using Aerial LIDAR Data. In Proceedings of the 2008 IEEE Conference on Computer Vision and Pattern Recognition, Anchorage, AK, USA, 23–28 June 2008. [Google Scholar]
  40. Awrangjeb, M.; Fraser, C.S. Rule-based segmentation of lidar point cloud for automatic extraction of building roof planes. ISPRS Ann. Photogramm. 2013, II-3/W3, 1–6. [Google Scholar] [CrossRef] [Green Version]
  41. Mohammad, A.; Clive, F. Automatic Segmentation of Raw LIDAR Data for Extraction of Building Roofs. Remote Sens. 2014, 6, 3716–3751. [Google Scholar]
  42. Sampath, A.; Shan, J. Building Boundary Tracing and Regularization from Airborne Lidar Point Clouds. Photogramm. Eng. Remote Sens. 2007, 73, 805–812. [Google Scholar] [CrossRef] [Green Version]
  43. Yan, L.; Wei, F. Single Part of Building Extraction from Dense Matching Point Cloud. Chin. J. Lasers 2018, 499, 270–277. [Google Scholar]
  44. Iglovikov, V.; Seferbekov, S.; Buslaev, A.; Shvets, A. Ternausnetv2: Fully convolutional network for instance segmentation. arXiv 2018, arXiv:1806.00844. [Google Scholar]
  45. Bertolotto, M.; Anh-Vu, V.; Linh, T.; Laefer, D.F. Octree-based region growing for point cloud segmentation. ISPRS J. Photogramm. Remote Sens. 2015, 104, 88–100. [Google Scholar]
  46. Ester, M. A Density-Based Algorithm for Discovering Clusters in Large Spatial Databases with Noise. In Proceedings of the Second International Conference on Knowledge Discovery and Data Mining, Portland, OR, USA, 2–4 August 1996. [Google Scholar]
  47. Czerniawski, T.; Nahangi, M.; Walbridge, S.; Haas, C. Automated Removal of Planar Clutter from 3D Point Clouds for Improving Industrial Object Recognition. In Proceedings of the International Symposium in Automation and Robotics in Construction, Auburn, AL, USA, 18–21 July 2016. [Google Scholar]
  48. Czerniawski, T.; Sankaran, B.; Nahangi, M.; Haas, C.; Leite, F. 6D DBSCAN-based segmentation of building point clouds for planar object classification. Autom. Constr. 2018, 88, 44–58. [Google Scholar] [CrossRef]
  49. Jarvis, R.A.; Patrick, E.A. Clustering Using a Similarity Measure Based on Shared Near Neighbors. IEEE Trans. Comput. 2006, C-22, 1025–1034. [Google Scholar] [CrossRef]
  50. Ertöz, L.; Steinbach, M.; Kumar, V. Finding Clusters of Different Sizes, Shapes, and Densities in Noisy, High Dimensional Data. In Proceedings of the Third SIAM International Conference on Data Mining, San Francisco, CA, USA, 1–3 May 2003. [Google Scholar]
  51. Faustino, B.F.; João, M.S.; Moreira, G. kd-SNN: A Metric Data Structure Seconding the Clustering of Spatial Data. In Proceedings of the Computational Science and Its Applications—ICCSA 2014, Guimarães, Portugal, 30 June–3 July 2014. [Google Scholar]
  52. Delsolneux, A.; Moisan, L.; Morel, J.M. From Gestalt Theory to Image Analysis: A Probabilistic Approach; Springer: New York, NY, USA, 2008. [Google Scholar]
  53. Freeman, H.; Shapira, R. Determining the minimum-area encasing rectangle for an arbitrary closed curve. Commun. ACM 1975, 18, 409–413. [Google Scholar] [CrossRef]
  54. Chaudhuri, D.; Samal, A. A simple method for fitting of bounding rectangle to closed regions. Pattern Recognit. 2007, 40, 1981–1989. [Google Scholar] [CrossRef]
  55. Kwak, E.; Habib, A. Automatic representation and reconstruction of DBM from LiDAR data using Recursive Minimum Bounding Rectangle. J. Photogramm. Remote Sens. 2017, 93, 171–191. [Google Scholar] [CrossRef]
  56. Cramer, M. The DGPF test on digital aerial camera evaluation—Overview and test design. Photogrammetrie Fernerkundung Geoinf. 2010, 2010, 73–82. [Google Scholar] [CrossRef] [PubMed]
  57. ISPRS Test Project on Urban Classification and 3D Building Reconstruction. GIM International, 2013. Available online: https://www.isprs.org/news/newsletter/03-Apr-2011/3_ISPRS_test_on_urban_object_detection_and_3D_building_reconstruction_will_be_carried_out.pdf (accessed on 15 March 2021).
  58. Niemeyer, J.; Rottensteiner, F.; Soergel, U. Contextual classification of lidar data and building object detection in urban areas. ISPRS J. Photogramm. Remote Sens. 2014, 87, 152–165. [Google Scholar] [CrossRef]
  59. Rottensteiner, F.; Sohn, G.; Jung, J.; Gerke, M.; Breitkopf, U. The ISPRS Benchmark on Urban Object Classification and 3D Building Reconstruction. In Proceedings of the XXII ISPRS Congress, Melbourne, Australia, 25 August–1 September 2012. [Google Scholar]
  60. Varney, N.; Asari, V.K.; Graehling, Q. DALES: A Large-scale Aerial LiDAR Data Set for Semantic Segmentation. arXiv 2020, arXiv:2004.11985. [Google Scholar]
  61. Wu, C.; Hu, X.; Happold, M.; Xu, Q.; Neumann, U. Geometry-Aware Instance Segmentation with Disparity Maps. arXiv 2020, arXiv:2006.07802. [Google Scholar]
  62. Song, W.; Haithcoat, T.L. Development of comprehensive accuracy assessment indexes for building footprint extraction. IEEE Trans. Geoence Remote Sens. 2005, 43, 402–404. [Google Scholar] [CrossRef]
  63. Foody, G.M. Status of land cover classification accuracy assessment. Remote Sens. Environ. 2002, 80, 185–201. [Google Scholar] [CrossRef]
  64. Rutzinger, M.; Rottensteiner, F.; Pfeifer, N. A comparison of evaluation techniques for building extraction from airborne laser scanning. IEEE J. Sel. Top. Appl. Earth Obs. Remote Sens. 2009, 2, 11–20. [Google Scholar] [CrossRef]
  65. Dong, Z.; Yang, B.; Hu, P.; Scherer, S. An efficient global energy optimization approach for robust 3d plane segmentation of point clouds. ISPRS J. Photogramm. Remote Sens. 2018, 137, 112–133. [Google Scholar] [CrossRef]
Figure 1. Illustration of the unsupervised building instance segmentation (UBIS) method: (a) aerial images corresponding to inputted building point clouds; (b) inputted building point clouds; (c) the output of a single-building instance; (d) the output of a multi-building instances; (e) the output of multi-building roof planes; (f) the output of a single-building roof instance; (g) the output of merging of building façade point clouds; (h) the recognition and merging of roof detail cluster; (i) the output of isolated point cloud clusters merged into building instances.
Remotesensing 13 01136 g001
Figure 2. High-rise building: (a) aerial image corresponding to high-rise buildings; (b) high-rise building point clouds.
Remotesensing 13 01136 g002
Figure 3. Podium building: (a) aerial image corresponding to podium buildings; (b) podium building point clouds.
Remotesensing 13 01136 g003
Figure 4. Residential area with detached houses: (a) aerial image corresponding to a residential area with detached houses; (b) residential area with detached houses point clouds.
Remotesensing 13 01136 g004
Figure 5. Marking of a 2D grid: (a) Building point cloud projected into a two-dimensional grid of xoy plane; (b) marking grid with a point cloud; (c) building volume based on the projected area stretch.
Remotesensing 13 01136 g005
Figure 6. Marking of 3D grids (the 3D grid is projected into the xoz plane to display the result): (a) Three-dimensional grid being filled with building point clouds; (b) searching grid with point clouds from the top with zero rows and zero columns and then marking it; (c) marking all grids below the marked grid layer as true; (d) marking all grids according to (b,c).
Remotesensing 13 01136 g006
Figure 8. Building instance segmentation result of dataset 1: (a) Aerial image corresponding to input data; (b) the building point clouds; (c) the result of UBIS method; (d) the ground truth; (e) the main differences between the UBIS method result and the ground truth.
Remotesensing 13 01136 g008
Figure 9. Building instance segmentation result of dataset 2: (a) Aerial image corresponding to input data; (b) the building point clouds; (c) the result of UBIS method; (d) the ground truth; (e) the main differences between the UBIS method result and the ground truth.
Remotesensing 13 01136 g009
Figure 10. Building instance segmentation result of dataset 3: (a) Aerial image corresponding to input data; (b) the building point clouds; (c) the result of UBIS method; (d) the ground truth; (e) the main differences between the UBIS method result and the ground truth.
Remotesensing 13 01136 g010
Figure 11. Building instance segmentation result of dataset 4: (a) The point clouds of the entire scene displayed in different colors according to their heights; (b) the building point clouds; (c) the result of UBIS method; (d) the ground truth; (e) the main differences between the UBIS method result and the ground truth.
Remotesensing 13 01136 g011
Figure 12. Building instance segmentation result of dataset 5: (a) The point clouds of the entire scene displayed in different colors according to their heights; (b) the building point clouds; (c) the result of UBIS method; (d) the ground truth; (e) the main differences between the UBIS method result and the ground truth.
Remotesensing 13 01136 g012
Figure 13. Building instance segmentation result comparison of dataset 1: (a) Result of the UBIS method; (b) result of the MV method; (c) result of the two-dimensional Euclidean-based segmentation method (ES2D) method; (d) result of the three-dimensional Euclidean-based segmentation method (ES3D) method; (e) result of the LCCP method; (f) the main differences between the result of the UBIS method and the ground truth; (g) the main differences between the result of the moving window (MV) method and the ground truth; (h) the main differences between the result of the ES2D method and the ground truth; (i) the main differences between the result of the ES3D method and the ground truth; (j) the main differences between the result of the LCCP method and the ground truth.
Remotesensing 13 01136 g013
Figure 14. Building instance segmentation result comparison of dataset 2: (a) Result of the UBIS method; (b) result of the MV method; (c) result of the ES2D method; (d) result of the ES3D method; (e) result of the LCCP method; (f) the main differences between the result of the UBIS method and the ground truth; (g) the main differences between the result of the MV method and the ground truth; (h) the main differences between the result of the ES2D method and the ground truth; (i) the main differences between the result of the ES3D method and the ground truth; (j) the main differences between the result of the LCCP method and the ground truth.
Remotesensing 13 01136 g014
Figure 15. Building instance segmentation result comparison of dataset 3: (a) Result of the UBIS method; (b) result of the MV method; (c) result of the ES2D method; (d) result of the ES3D method; (e) result of the LCCP method; (f) the main differences between the result of the UBIS method and the ground truth; (g) the main differences between the result of the MV method and the ground truth; (h) the main differences between the result of the ES2D method and the ground truth; (i) the main differences between the result of the ES3D method and the ground truth; (j) the main differences between the result of the LCCP method and the ground truth.
Remotesensing 13 01136 g015
Figure 16. Building instance segmentation result comparison of dataset 4: (a) Result of the UBIS method; (b) result of the MV method; (c) result of the ES2D method; (d) result of the ES3D method; (e) result of the LCCP method; (f) the main differences between the result of the UBIS method and the ground truth; (g) the main differences between the result of the MV method and the ground truth; (h) the main differences between the result of the ES2D method and the ground truth; (i) the main differences between the result of the ES3D method and the ground truth; (j) the main differences between the result of the LCCP method and the ground truth.
Remotesensing 13 01136 g016
Figure 17. Building instance segmentation result comparison of dataset 5: (a) Result of the UBIS method; (b) result of the MV method; (c) result of the ES2D method; (d) result of the ES3D method; (e) the result of LCCP method; (f) the main differences between the result of the UBIS method and the ground truth; (g) the main differences between the result of the MV method and the ground truth; (h) the main differences between the result of the ES2D method and the ground truth; (i) the main differences between the result of the ES3D method and the ground truth; (j) the main differences between the result of the LCCP method and the ground truth.
Remotesensing 13 01136 g017
Figure 18. Typical area building instance segmentation result of dataset 3: (a) the building point clouds; (b) result of the UBIS method; (c) result of the MV method; (d) result of the ES2D method; (e) result of the ES3D method; (f) result of LCCP the method; (g) result of the UBIS method; (h) result of the MV method; (i) result of the ES2D method; (j) result of the ES3D method; (k) result of the LCCP method.
Remotesensing 13 01136 g018
Table 1. Parameters of building instance segmentation.
ProcedureParameterDescriptorValue
NingboISPRSDALES
Building point cloud segmentation d c 1 The neighbor radius of Ikd-2DSNN algorithm 1.5 m1.5 m1.7 m
k t 1 The ratio of shared neighbor number to neighbor number of Ikd-2DSNN algorithm0.50.50.5
d c 2 The neighbor radius of Ikd-3DSNN algorithm1.5 m1.5 m1.7 m
k t 2 The ratio of shared neighbor number to neighbor number of Ikd-3DSNN algorithm0.20.20.2
r t The threshold of model consistency evaluation 0.82
θ The threshold of the angle between multi-building planes’ normal vector and horizontal direction30°
Merging of building façade point clouds d c The lateral dimensions of the grid1.5 m1.5 m1.7 m
Recognition and merging of roof detail instance M B R max The maximum threshold of building roof detail MBR width and length10 m
M B R min The minimum threshold of building MBR width and length3 m
d v max The maximum difference threshold between the maximum height value of roof detail instance and the height maximum value of the single-building instance with building facade point clouds8 m
d v min The minimum difference threshold between the maximum height value of roof detail instance and the height maximum value of the single-building instance with building facade point clouds−4 m
Table 2. Quantitative evaluation of building instance segmentation result.
DataPointRuntime (s) Completeness (%)Correctness (%)Quality (%)
Dataset 1139,99726.99 IoU 0.5 100.00100.00100.00
IoU 0.75 100.00100.00100.00
Dataset 2676,233577.66 IoU 0.5 98.2198.2196.49
IoU 0.75 94.6498.1592.98
Dataset 369,8344.94 IoU 0.5 100.00100.00100.00
IoU 0.75 100.0092.3192.31
Dataset 477,2282.38 IoU 0.5 98.28100.0098.28
IoU 0.75 98.28100.0098.28
Dataset 545,5900.80 IoU 0.5 99.54100.0099.54
IoU 0.75 99.0899.5498.62
Table 3. Performance comparison of building instance segmentation results.
Dataset UBISMVES2DES3DLCCP
Dataset 1Completeness (%)100.0095.0090.481.651.45
Correctness (%)100.00100.00100.00100.0094.12
Quality (%)100.0095.0090.481.561.22
Dataset 2Completeness (%)94.6488.3783.331.591.12
Correctness (%)98.1586.3688.8984.3175.00
Quality (%)92.9877.5575.471.581.12
Dataset 3Completeness (%)100.0083.3371.4324.7317.02
Correctness (%)92.3180.6578.1390.0090.57
Quality (%)92.3169.4459.5224.0616.72
Dataset 4Completeness (%)98.2837.1449.534.705.22
Correctness (%)100.0094.5596.3689.8389.83
Quality (%)98.2836.3648.624.675.19
Dataset 5Completeness (%)99.0871.5389.8732.8537.23
Correctness (%)99.5497.1796.6897.6398.10
Quality (%)98.6270.0787.1832.5936.96
Publisher’s Note: MDPI stays neutral with regard to jurisdictional claims in published maps and institutional affiliations.

