Article

Self-Secondaries Formed by Cold Spot Craters on the Moon

1
State Key Laboratory of Lunar and Planetary Sciences, Macau University of Science and Technology, Macau 999078, China
2
Planetary Environmental and Astrobiological Research Laboratory, School of Atmospheric Sciences, Sun Yat-Sen University, Zhuhai 519000, China
3
Centre for Excellence in Comparative Planetology, Chinese Academy of Science, Hefei 230026, China
4
State Key Laboratory of Space Weather, National Space Science Center, Chinese Academy of Sciences, Beijing 100190, China
*
Author to whom correspondence should be addressed.
Remote Sens. 2021, 13(6), 1087; https://doi.org/10.3390/rs13061087
Submission received: 5 February 2021 / Revised: 7 March 2021 / Accepted: 11 March 2021 / Published: 12 March 2021

Abstract

:
Self-secondaries are a population of background secondaries, and they have been observed on top of impact melt and ballistically emplaced ejecta deposits on various planetary bodies. Self-secondaries are formed by impacts of sub-vertically launched ejecta, but the launch mechanism is not confirmed. The potential threat of self-secondaries to the theoretical and applicable reliability of crater chronology has been noted, but not constrained. Hitherto discovered self-secondaries were located around complex impact craters, but their potential existence around simple craters has not been discovered. Here we report the first discovery of self-secondaries around lunar cold spot craters, which are an extremely young population of simple craters formed within the past ~1 million years on the Moon. Self-secondaries are widespread on layers of cascading flow-like ejecta deposits around cold spot craters. The spatial density of self-secondaries dwarfs that of potential primary craters. The spatial distribution of self-secondaries is highly heterogeneous across the ejecta deposits. With respect to the impactor trajectory that formed cold spot craters, self-secondaries formed at the downrange of the ejecta deposits have the largest spatial density, while those at the uprange have the smallest density. This density pattern holds for all cold spot craters that were formed by non-vertical impacts, but self-secondaries do not exhibit other systematic density variations at different radial distances or at other azimuths with respect to the impactor trajectory. Among known mechanics of ejecting materials to the exterior of impact craters, impact spallation is the most likely scenario to account for the required large ejection velocities and angles to form self-secondaries. The production population of self-secondaries is estimated based on the highly diverse crater size-frequency distributions across the ejecta deposits of cold spot craters. For a better understanding of the impact history on the Moon, a systematic investigation for the effect of self-secondaries on lunar crater chronology is required.

Graphical Abstract

1. Introduction

Impact craters formed by hypervelocity collisions between celestial materials are the most common landforms on planetary bodies [1]. The spatial density of impact craters records age information of planetary surfaces, as older surfaces accumulate more craters than younger surfaces. Crater statistics have been the most-frequently used technique in the remote age determination for planetary surfaces [2,3]. If the formation rates of different-sized craters are known [4], absolute ages of planetary surfaces can be modelled based on the observed crater size-frequency distribution (SFD). The crater production function, which describes the SFD of various-sized impact craters formed in a given time interval, and the crater chronology function, which describes the production rate of a given-sized crater, are the two fundamental parts to construct a crater chronology [5]. Samples returned from the Moon by the Apollo and Luna missions have interpreted geological contexts, so their radiometric ages can be connected with crater SFDs on the related geologic units to build the crater production and chronology functions [6]. It is a consensus that impactor populations are similar on different planetary bodies in the inner Solar System [7]. Therefore, based on assumed ratios of impact fluxes between the Moon and terrestrial planets, the lunar crater chronology system can be transferred to terrestrial planets [8]. Most of our knowledge about the timeline of planetary evolution is gained through crater statistics, and this method has been a basic technique in the research of planetary geology [2]. Since the Moon is the only extraterrestrial body where in situ samples have been obtained, the lunar crater chronology is the base of building crater chronologies for the other terrestrial planets [3].
Before samples were returned from the Moon and after Martian meteorites were recognized, the first-order reliability of crater statistics in modelling ages for planetary surfaces was validated by several trial tests [3]. However, it is also known that both the lunar crater production and chronology functions have many caveats, some may severely affect the theoretical reliability and restrict the applicability of this technique. For example, it has been long debated about whether or not different impactor populations existed in the history of the inner solar system [7], the 14 anchor points that established the lunar crater chronology function did not cover stratigraphic ages from ~3.9 to 0.8 Ga [6], so possible changes of impact fluxes might have occurred in over half of the solar system history. Assigning lunar samples to certain geological units involve large uncertainties [9], since most returned samples are from the surface regolith, which has a stochastic mixing history. Given the fundamental importance of the lunar crater chronology, improving the accuracy of the lunar crater chronology system has been a scientific target of utmost importance for most ongoing and planned sample return missions. Recently, the Chang’E-5 mission successfully returned samples from a previously unsampled age unit, which would contribute new data within the large gap between ~3.9 to 0.8 Ga in the crater chronology function [10].
Among the many potential caveats in the lunar crater chronology system, possible contamination by secondary craters (i.e., secondaries) have been a persistent debate [11,12]. Secondaries are formed by impacts of ejecta blocks that were excavated from a parent crater [13]. Unlike primary craters (i.e., primaries) that are formed by asteroids and comets, secondaries are not randomly formed in space or time. Containing secondaries in crater statistics would yield densities larger than those of actually accumulated primaries, invalidating the basic requirement for the application of crater statistics [11]. Depending on their morphology and spatial distribution, secondaries are classified into different forms [14]. Most recognizable secondaries on terrestrial bodies occur in clusters and chains, featuring irregular shapes [15,16], and they can be safely avoided when counting craters on a given surface. However, many secondaries are relatively scattered in the spatial distribution, and they share nearly identical morphology with similar-sized primaries [14]. Such secondaries, termed as background secondaries, are a center of debate about their potential effects on crater chronology. Observations have confirmed that during impact cratering, background secondaries have a high formation efficiency and widespread spatial extent [17], even with global distributions [18]. However, compared to similar-sized primaries, the relative abundances of background secondaries at different diameter ranges or at surfaces with different ages have not been constrained.
Self-secondaries formed on top of their parent craters are a special group of background secondaries. Their potential existence on the Moon was proposed during the Apollo era [19], but this crater population was only recently discovered thanks to the available of high-resolution images that have pixel scales of up to <1 m/pixel [14,20,21,22,23,24]. So far, self-secondaries have been discovered on Mercury [25], the Moon [20,21], Mars [26], 1Ceres [27], 4Vesta [27], and Rhea [28]. Featuring identical plane morphology with same-sized primaries, self-secondaries are a serious contaminator to crater populations that are accumulated on ejecta facies of impact craters [14,29]. Specifically, 5 of the 14 anchor points that built the lunar crater chronology function are for Copernican-aged fresh impact craters (i.e., Copernicus, Tycho, North Ray, South Ray, and Cone craters), and their crater SFDs were derived from the continuous ejecta deposits [9]. Therefore, possible contamination by self-secondaries would threaten the accuracy of the lunar crater chronology [14,29]. A similar issue exists when applying crater statistics on continuous ejecta deposits of individual craters. However, the production efficiency of self-secondaries has not been constrained, because on top of continuous ejecta deposits, observable crater populations already contain both primaries and background secondaries.
The launch mechanism of ejecta that formed self-secondaries is not confirmed. Resolving this remaining issue is important to further our understanding of shock physics. The time interval between the formation of self-secondaries and the settlement of underlying ejecta is short. It has been proposed that ejecta that formed self-secondaries should have high ejection angles with respect to the surface tangent [25,28,29,30]. However, the high ejection angles cannot be easily explained by known mechanisms of ejecting solid fragments. Self-secondaries were discovered around complex craters [14], and their potential existence around simple craters is unknown, raising further questions about their abundances and formation mechanisms. Impact spallation [25,28] and detachment of uplifting central peaks [28] were proposed as possible mechanisms to launch fragments that formed self-secondaries, but these scenarios have not been validated by theoretical, physical or numerical simulations. If simple craters are also commonly accompanied by self-secondaries, uplifting of transient crater floors would not be their formation mechanism.
One of the youngest crater populations on the Moon, cold spot craters, appears to be a key target to resolve both the production SFD of self-secondaries and their formation mechanism(s). Lunar cold spot craters are fresh simple craters, whose widespread impact rays have nighttime temperatures ~2–10 K lower than the surrounding rock-free regolith [31,32]. The low temperature rays were detected by the Diviner lunar radiometer [33] onboard the Lunar Reconnaissance Orbiter (LRO). Their thermophysical characteristics suggest that materials within the diurnal thermal wave depth of ~40 cm [34] have a low thermal inertia, which is caused by a low bulk density. Extending about 10–244 radii of the parent crater, the low thermal inertia rays occasionally contain visible small secondaries as seen in high-resolution images (better than 1 m/pixel), but the majority of the cold rays do not show detectable indications of impact deposition or erosion [35]. Compared to surrounding regolith, cold rays do not exhibit different reflectance spectra in the visible to near-infrared wavelengths [35]. The formation mechanism of the cold rays is not known, but thermophysical and geological studies reveal that the abnormally low thermal inertia is due to a small bulk density, which is caused by the decrease of regolith porosity. Local regolith within the cold rays might have been fluffed up by impact-induced vapor or secondary impacts [35]. More than 2200 cold spot craters have been discovered at latitudes between 50°S and 50°N [35], with rim-to-rim diameters (D) ranging from 20 m to 2.3 km [36]. Crater statistics on continuous ejecta deposits of individual cold spot craters yielded a maximum model age of 1.1 Ma, and the average model age for the entire population of cold spot craters is ~220 ka [32,35,37]. It has been noted that all impact craters on the Moon should have produced similar low thermal inertia rays [37], but cold rays formed by craters older than ~1 Ma have lost the distinctive thermophysical characteristics due to surface degradation, e.g., by continuous impact bombardment [35].
This study reports the first discovery of widespread self-secondaries formed by cold spot craters (Section 3.1). We investigated the heterogeneous spatial distribution (Section 3.2) and abundances (Section 3.3) of the self-secondaries. New insights on the possible launch mechanism of ejecta that formed self-secondaries are discussed (Section 4.1). We further estimated the production population of self-secondaries around cold-spot craters and suggested a systematic evaluation on the importance of self-secondaries on crater chronology (Section 4.2).

2. Materials and Methods

We searched for self-secondaries around lunar cold spot craters using images obtained by the Lunar Reconnaissance Orbiter Camera (LROC) Narrow Angle Camera (NAC), which have pixel scales better than ~1 m [38]. The Integrated Software for Imagers and Spectrometers [39] was used for the calibration and map-projection of LROC NAC data. Proximal ejecta deposits around rims of lunar cold spot craters were emplaced as cascading granular flows [35], and the flows had different termination times. We used the momentary time interval between the emplacement of different flow layers to search for self-secondaries. Self-secondaries are recognized based on the following two criteria [25]: small craters are formed on top of earlier ejecta deposits of cold spot craters, and their rims are transected by subsequently arrived ejecta deposits. Some small craters are transected by ejecta flows, but they were not necessarily formed on top of earlier emplaced ejecta deposits. Such ambiguous cases are not regarded as confirmed self-secondaries. While primaries on the Moon have a random distribution, it has been noticed that the spatial distribution of self-secondaries may be heterogeneous [23,40]. We used LROC NAC images to investigate the spatial distribution of small craters on ejecta deposits of cold spot craters.
On continuous ejecta deposits of cold spot craters, it has been noticed that the population of superposed craters did not conform to known production function of lunar primaries [37], indicating additional contributions exist in addition to primary craters. We investigated the abundance of self-secondaries at different azimuths and radial distances with respect to the parent crater. Proximal ejecta of cold spot craters are blocky and hummocky due to the excavation of subsurface boulders [32]. Crater statistics were performed on smooth ejecta deposits, avoiding complicated topography. Each count area is a continuous, smooth, and individual ejecta layer, so the crater SFD at different layers of ejecta flows can be compared. Only craters formed on top of ejecta deposits were collected, and potentially older craters that have been completely flooded by ejecta flows were not used. Based on LROC NAC data that have incidence angles of ~58° to 77° [41,42], crater collection was conducted using the Cratertools plugin in ArcMap [43]. Although craters as small as 3 pixels were visible during the crater count, the minimum confidence diameter for completeness was set to ~10 pixels of the base image, as this size limit was believed to be adequate for most purposes [44]. This treatment, together with the usually small sizes of counting areas, mean that the number of usable craters may not be statistically enough [37]. The limited number of usable craters is further complicated due to the extremely young ages and small diameters of cold spot craters. To partly remedy this issue, we designed lengths and widths for each counting area that are much larger than 10 times of the diameter of the biggest visible crater in the counting area.
We investigated the spatial distribution of self-secondaries around cold spot craters based on crater SFDs collected at different azimuths and radial distances with respect to the parent crater. The heterogeneous spatial distribution of self-secondaries also provides additional indications on their possible formation mechanism. One-dimensional thermal modeling for lunar regolith found that an exponentially increasing density and thermal conductivity with depths could explain the cooling rate of nighttime brightness temperatures observed by Diviner [45]. This depth profile is characterized by an average e-folding scale, i.e., H values [34]. The global map of H-values has removed the effect of topography on surface temperature [34], so the distribution of low thermal inertia rays around cold spot craters are better shown compared to those seen in normal temperature maps [37]. Most impact craters on planetary bodies are formed by non-vertical impacts [1], and we judged the incidence and azimuth angles of impactors that formed cold spot craters based on the asymmetric distribution of various impact ejecta. The global H-map (128 pixel/degree), LROC NAC images, and high-resolution digital terrain models (i.e., DTM) constructed using LROC NAC stereopairs were employed for this purpose. We specifically selected ejecta deposits at the uprange and downrange directions with respect to the impactor trajectory, and superposed small craters were extracted to further study the spatial heterogeneity of self-secondaries.
We employed the new algorithm recently advocated [46] to analyze crater SFD. In terms of statistical reliability, this new method is more rigorous than traditional method [47], especially for small numbers of craters [46]. The crater SFD was constructed using a Gaussian kernel density estimator, the bootstrap process (i.e., hybrid sampling) was used to estimate the confidence intervals, and slopes of crater SFDs and absolute ages were modelled using a maximum likelihood estimator. To further show the possible dominance of self-secondaries over primaries, we used different lunar crater chronology functions [8,9] and crater production functions [8,17,48] to analyze discrepancies between the predicted and observed crater SFDs around cold spot craters. The relative advantages of the different production and chronology functions are introduced when used, especially for the recently updated lunar crater chronology function [9] and crater production function [17].
All the base data (imagery, topography, and H-map) used in this study and their available addresses are listed in the Supplementary Table S1, thus they are not listed redundantly in the figure captions. The spatial distributions and crater size-frequency distributions data derived are uploaded to the data repository in the public domain (available at https://doi.org/10.5281/zenodo.4505866 since 5 February 2021).

3. Results

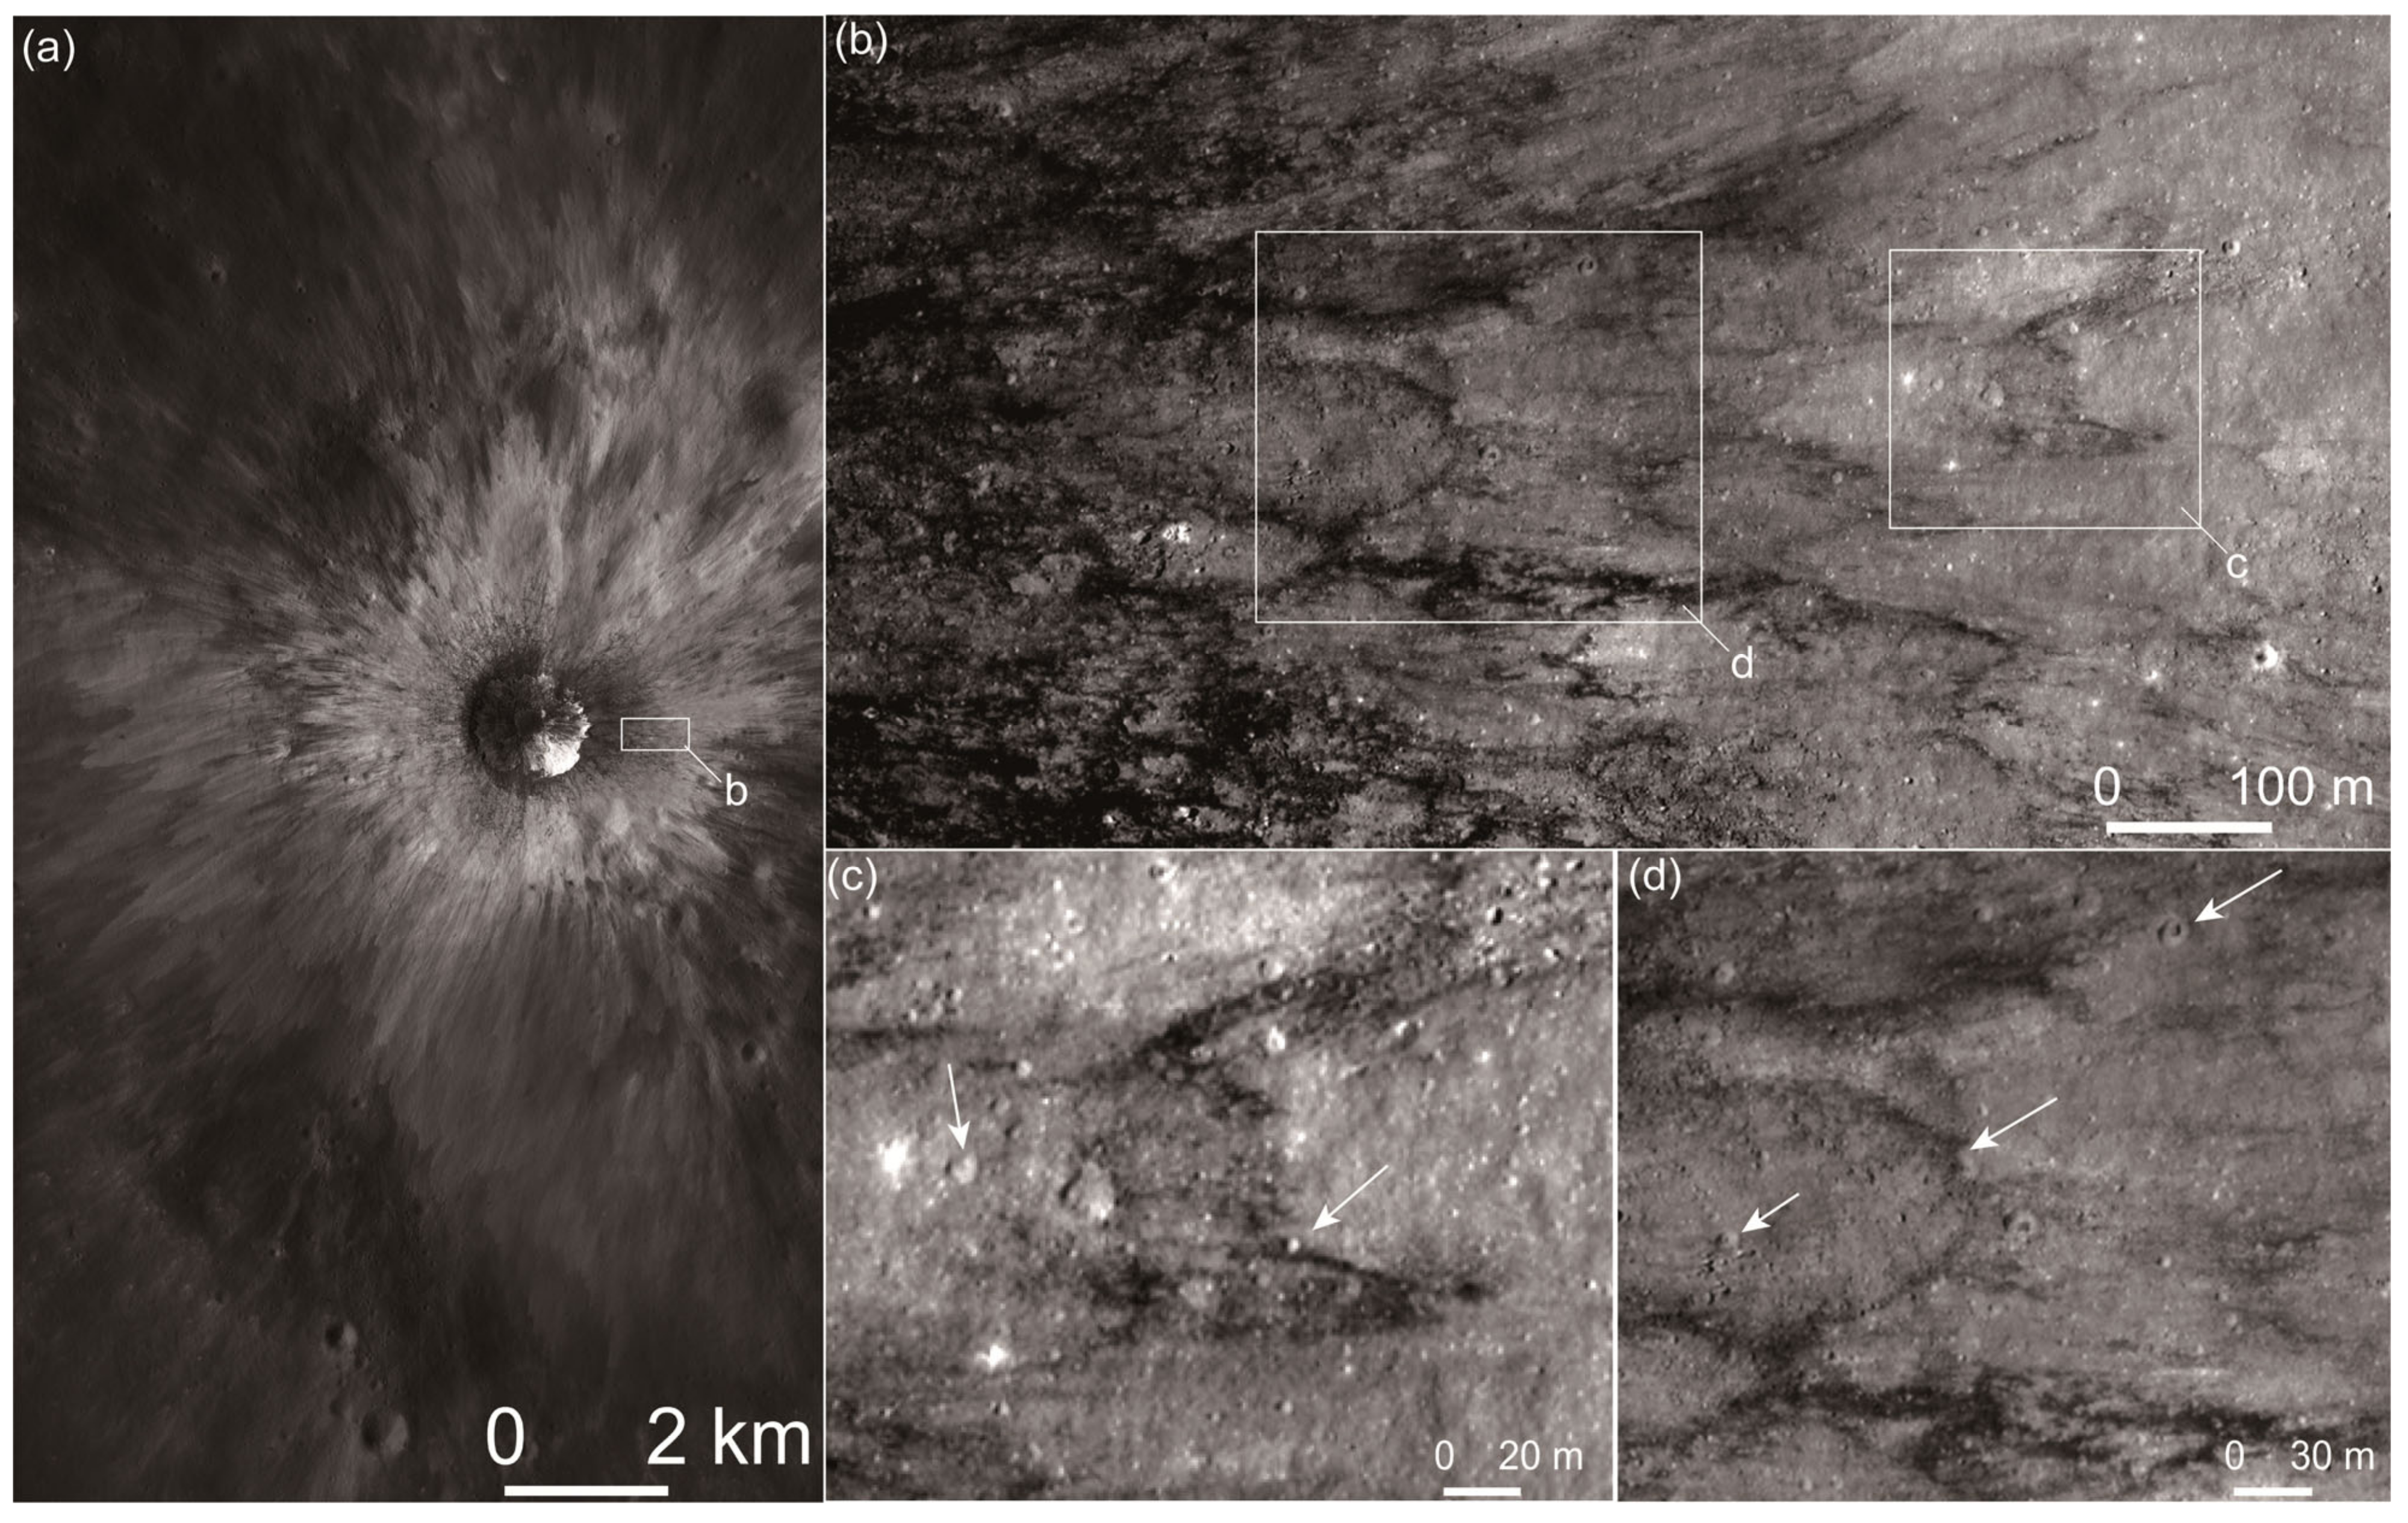
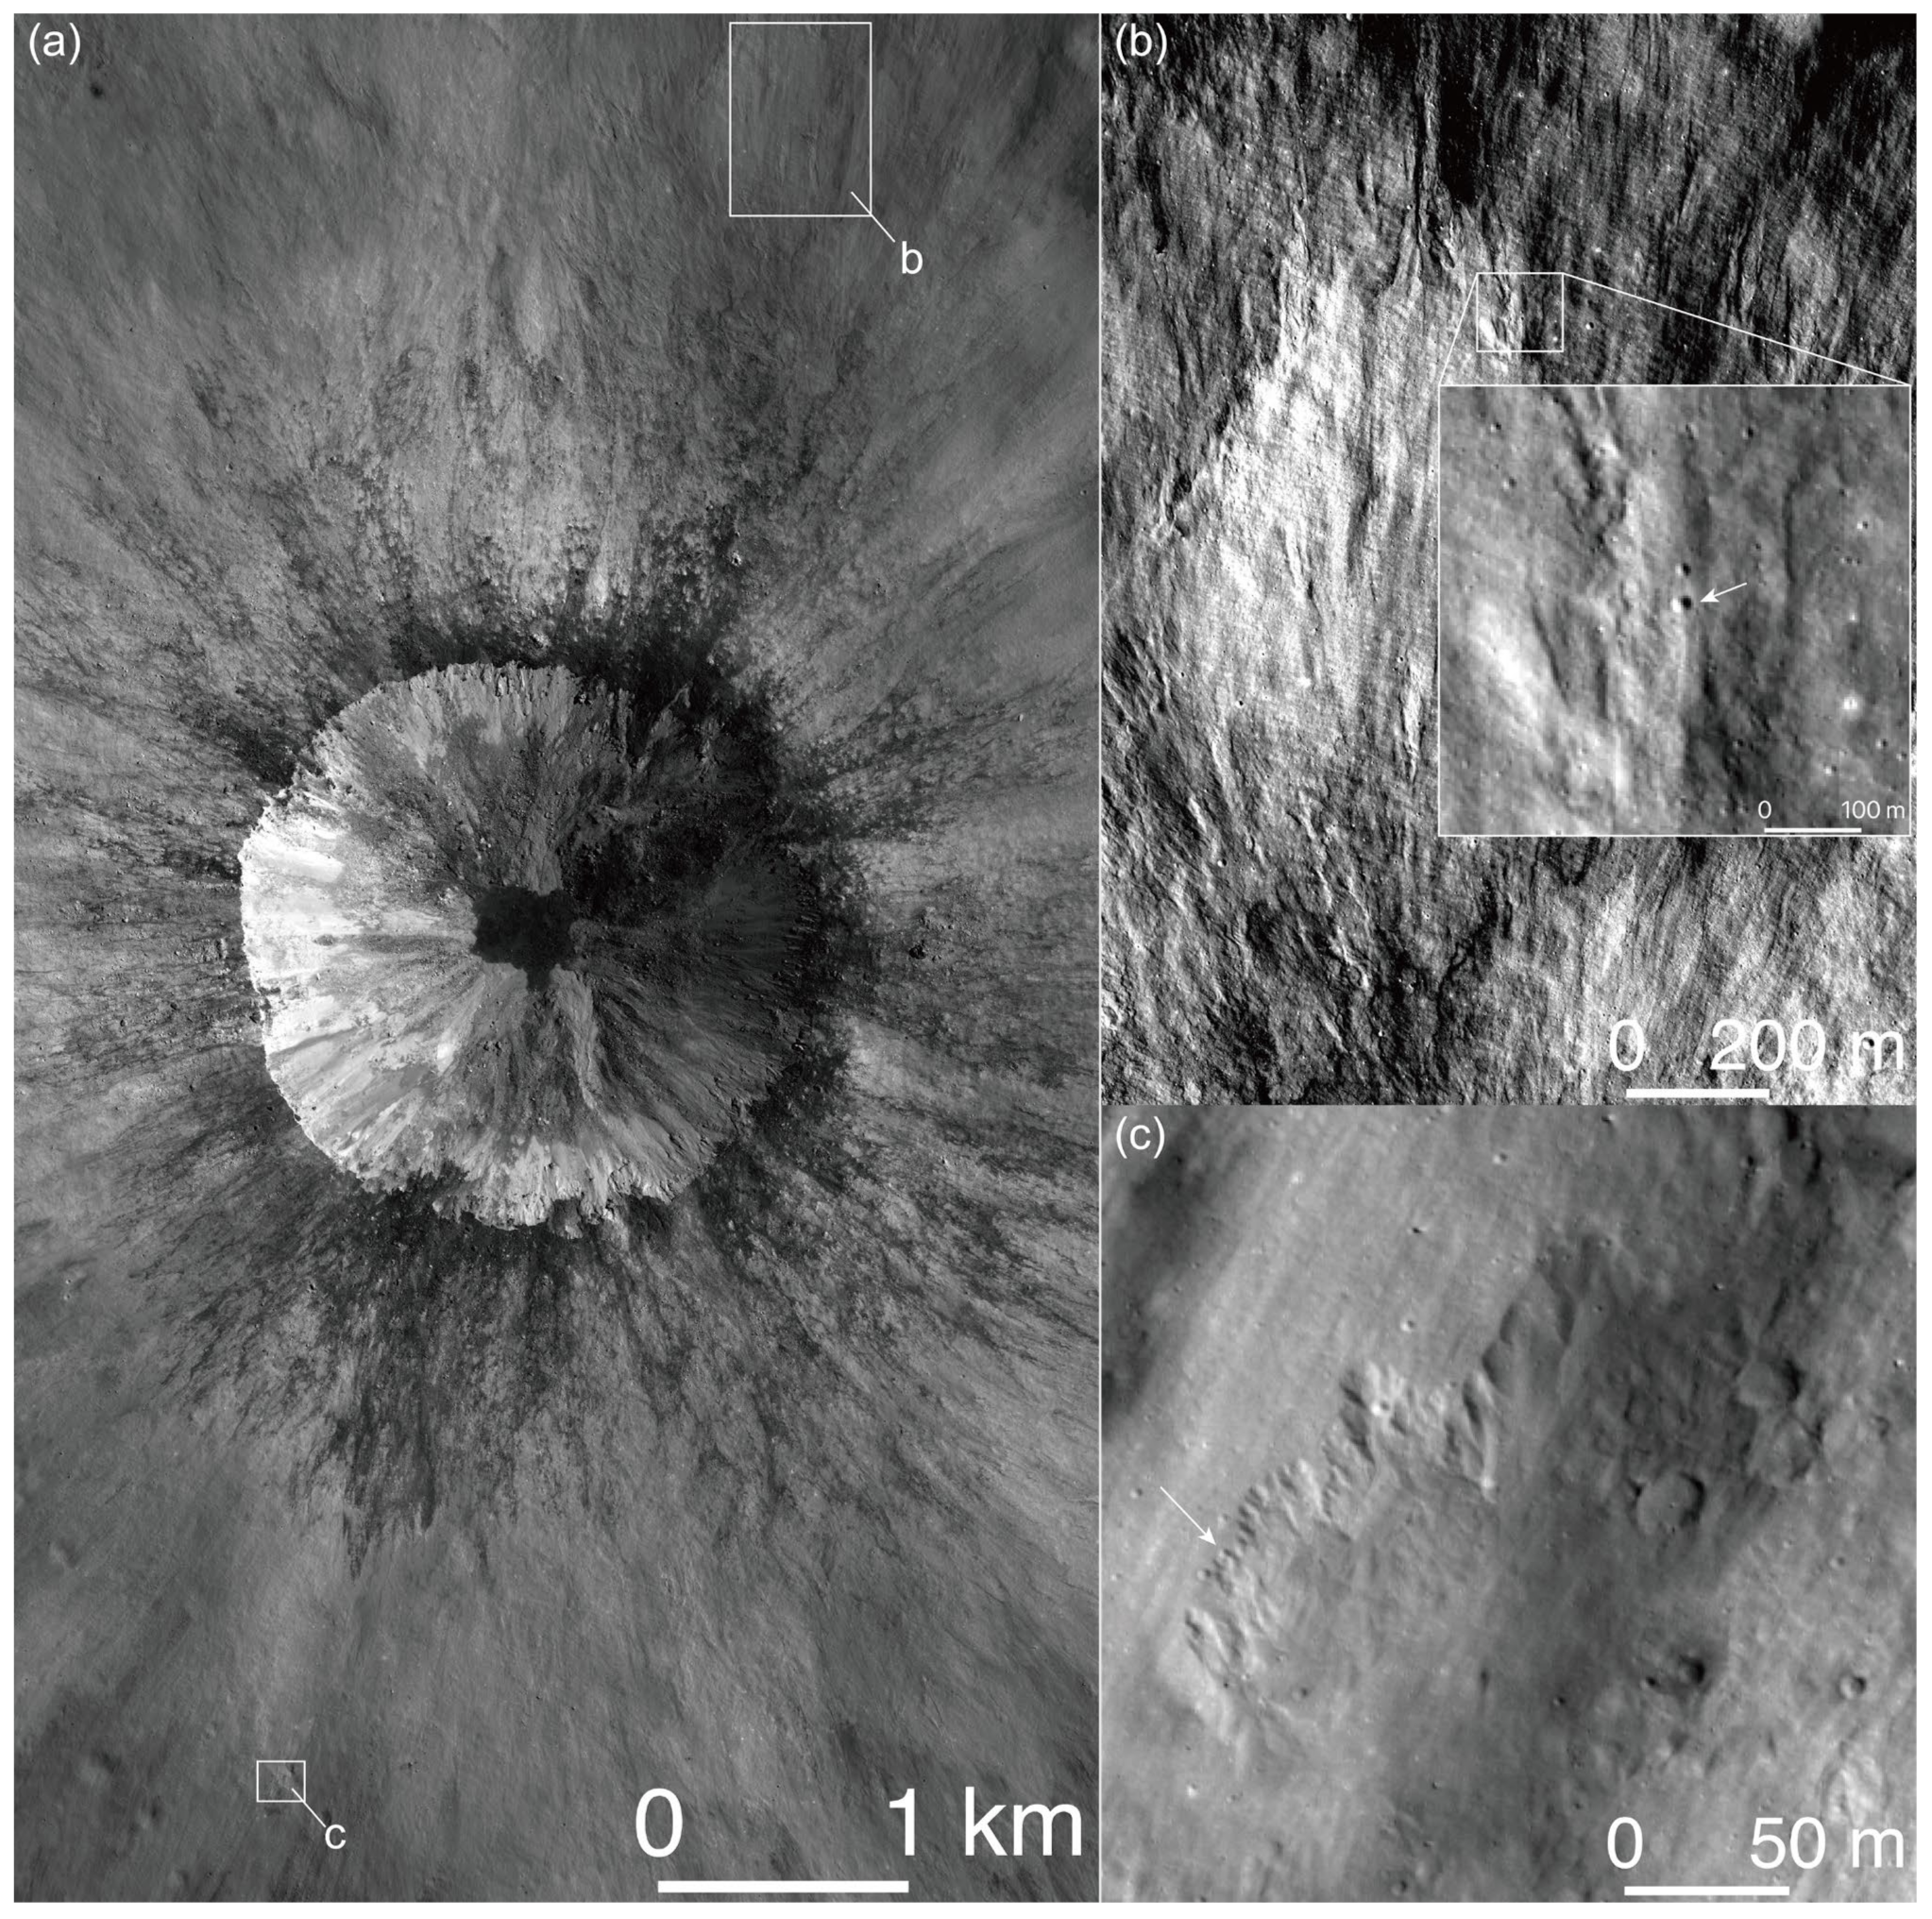
3.1. Morphological Evidence of Self-Secondaries around Cold Spot Craters

Immediately adjacent to blocky rims of cold spot craters, ejecta deposits are composed of layers of bright and dark materials (Figure 1 and Figure 2). Sourced from crater rims, the ejecta layers exhibit radial and streaming patterns, and they have distinct edges [32]. Most of the ejecta layers occur as continuous granular flows covering underling terrains. The flow paths are not obviously deflected by local topography, except at the flow margins. The layers were emplaced at high speed that can overcome the dragging by basal friction. The layers have different runout distances and thicknesses, and some have lengths of about 10 radii of the parent cold spot craters (Figure 1). Those moved further are overlain by more proximal layers, suggesting a history of cascading deposition (Figure 2). Thicknesses of layer fronts are mostly less than the detection limits of the LROC NAC DTM (~2 m), but some can be up to 15 m thick [35]. Post-deposition flows are also common in the layers of ejecta (Figure 1), similar to those formed by melt-rich ejecta deposits around typical lunar complex craters [21,49]. The layers of ejecta were not directly emplaced by ballistic impact of impact ejecta. Earlier studies suggested that the layering may be caused by expansion of impact vapor that was formed during the collision of a volatile-rich impactor (e.g., comets), but the mechanism of triggering the pulsating source conditions is not known [35]. The layering was regarded as a relatively unique ejecta pattern that only accompanies cold spot craters [32], and it was also interpreted to be emplaced by ground-hugging flows [35]. However, recent discoveries suggest that such layers are actually quite common in both proximal and distal impact ejecta [25]. Those formed by lunar simple craters and impact basins have been detected by the lunar penetrating radar onboard the Chang’E-3 [50] and Chang’E-4 [51] missions. During the excavation stage of impact cratering, ejecta are launched at different times and velocities, and those launched closer to the impact point have larger ejection velocities [1]. The layers of ejecta deposits are formed due to the horizontal velocity component of the landing ejecta, which would be transferred to local materials that are entrained in secondary impacts [15,52]. The cratering process that formed cold spot craters was brief, within seconds or less [1]. However, the emplacement of the multiple layers of ejecta took a longer time, considering both the trajectory flight of the ejecta and lateral flows after landing. The time interval between the emplacement of different layers of ejecta flows provides the hiatus for the preservation of self-secondaries, since the flows have different extents.
Abundant self-secondaries are recognized around lunar cold spot craters. Figure 1 and Figure 2 show some examples around two cold spot craters. The recognized self-secondaries are located at margins of ejecta flows, as they are formed in ejecta deposits that were emplaced slightly earlier, and subsequently arrived ejecta flows transected parts of their crater rims (Figure 1b–d). With favored illumination conditions and pixel scales, such crosscutting relationships are visible on each of the ejecta layers along a same flow direction (Figure 1b). Most self-secondaries have diameters much less than 10 m, and subsequently arrived flows can have thicknesses of >2 m (e.g., Figure 1d). The crosscutting relationship suggests that during the emplacement of the layers of ejecta flows, fragments that formed self-secondaries were continuously landed. Therefore, self-secondaries on the topmost ejecta flows, which are not necessarily the closest to the rim of the parent cold-spot crater, appeared to have formed last.
Continual bombardment of fragments that formed self-secondaries may have lasted until most ejecta flows were emplaced. Figure 2 shows self-secondaries that were partly embayed by flows, which are developed on top of ejecta layers. Around rims of lunar complex craters [21,49], such high viscosity flows are commonly visible on top of ballistic ejecta deposits. The flows may be melt-rich ejecta deposits that were emplaced during the collapse stage of impact cratering [52], which are evidenced by the occurrence of cooling fractures in the flows [53]. Similar flows have been observed in distal ejecta deposits, and they were interpreted as melt-rich flows that seeped from distal ejecta [54]. The morphology of the flow features shown in Figure 2b–c is also consistent with melt-rich flows that were formed shortly after the emplacement of the main ejecta. The flow margins have transected rims of small craters that were formed on top of the ejecta layers, indicating that the small craters are self-secondaries.

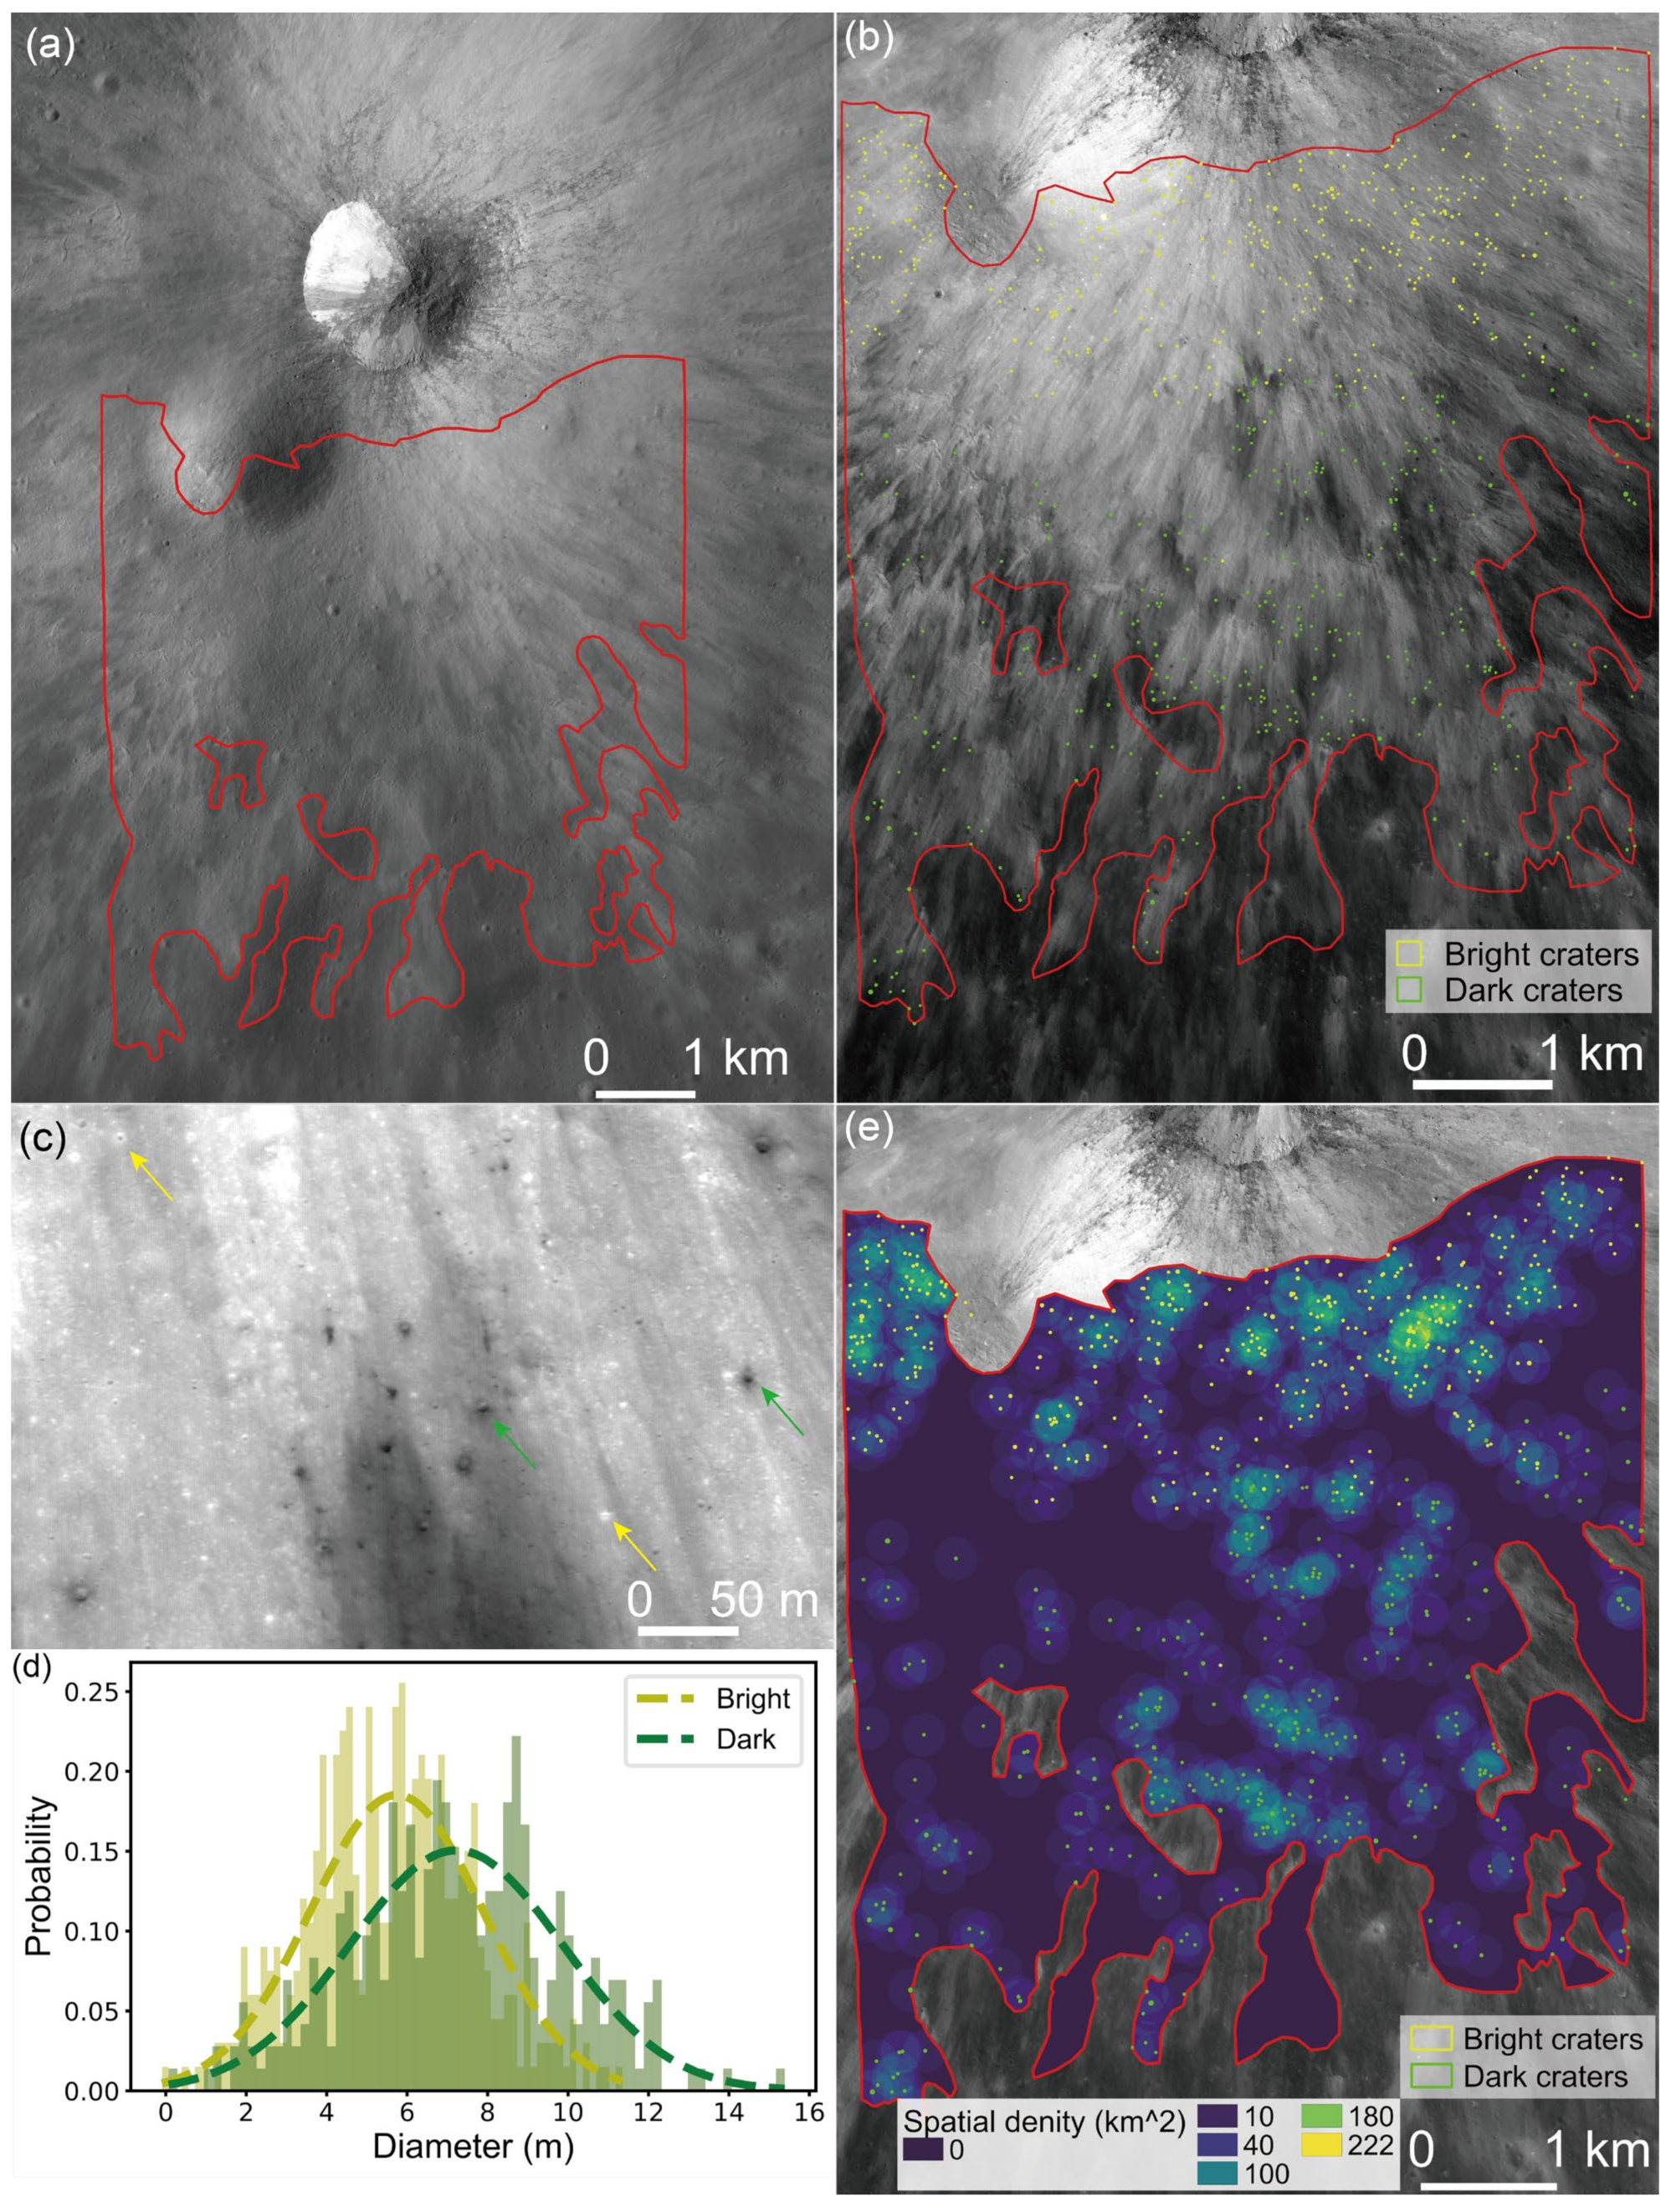
3.2. Heterogeneous Distribution of Self-Secondaries

Unlike primary craters, self-secondaries have heterogeneous spatial distributions. Craters superposed on ejecta deposits of cold spot craters are much fewer than those accumulated around similar-sized older craters that do not have cold rays. However, highly clustered craters are occasionally visible on ejecta deposits around many cold spot craters, and such high crater density areas have a heterogeneous spatial distribution. Figure 3 shows such a case on the western ejecta deposits of a cold spot crater. The ejecta deposits here have an abnormally large number of black dots compared to adjacent layers of ejecta (Figure 3b). As shown in images with larger incidence angles (i.e., enhanced shadows), the black dots are small impact craters that have excavated low-reflectance materials that were located beneath the bright flow materials (Figure 3c). Such small craters are highly unlikely to be primaries, considering their clustered spatial distribution. The dark-toned craters are located radially to the center of the parent crater, and their low-reflectance ejecta are preferentially distributed away from the rim of the parent cold spot crater (Figure 3b). Therefore, the small craters are self-secondaries by the cold spot crater.
Low incidence angle images show that self-secondaries can have either bright or dark ejecta deposits, depending on their diameters and thicknesses of local ejecta flows. Figure 4 shows such examples on the southern ejecta deposits of a cold spot crater. Abundant bright and dark dots are visible on top of the layers of ejecta (Figure 4c), and the different albedos are caused by whether or not the small craters have penetrated through the bright ejecta flows and exposed subsurface darker materials (Figure 4b). Ejecta sedimentation models predict thicker ejecta at places closer to the final crater rim [55], but actual ejecta deposition is highly heterogeneous at regional scales [51]. In this area, similar-sized craters that are located nearby can exhibit either dark or bright ejecta (Figure 4c), and the dark-toned craters have a larger median diameter (Figure 4d), consistent with the larger excavation depths and thus deeper materials being excavated. Available LROC NAC images with large and small incidence angles are used to catalog dark-toned craters that are larger than ~4.5 m and light-toned craters that are larger than ~3.8 m (Figure 4b). We performed spatial analyses for the observed small craters. In the calculation, the raster size was set to 4.5 m/grid, the radius of the moving window was set of 160 m for the density calculation, and the yielded densities were numbers of craters per square meters. The result show significant clustering in their spatial distribution (Figure 4e), suggesting that many of the small craters are self-secondaries.

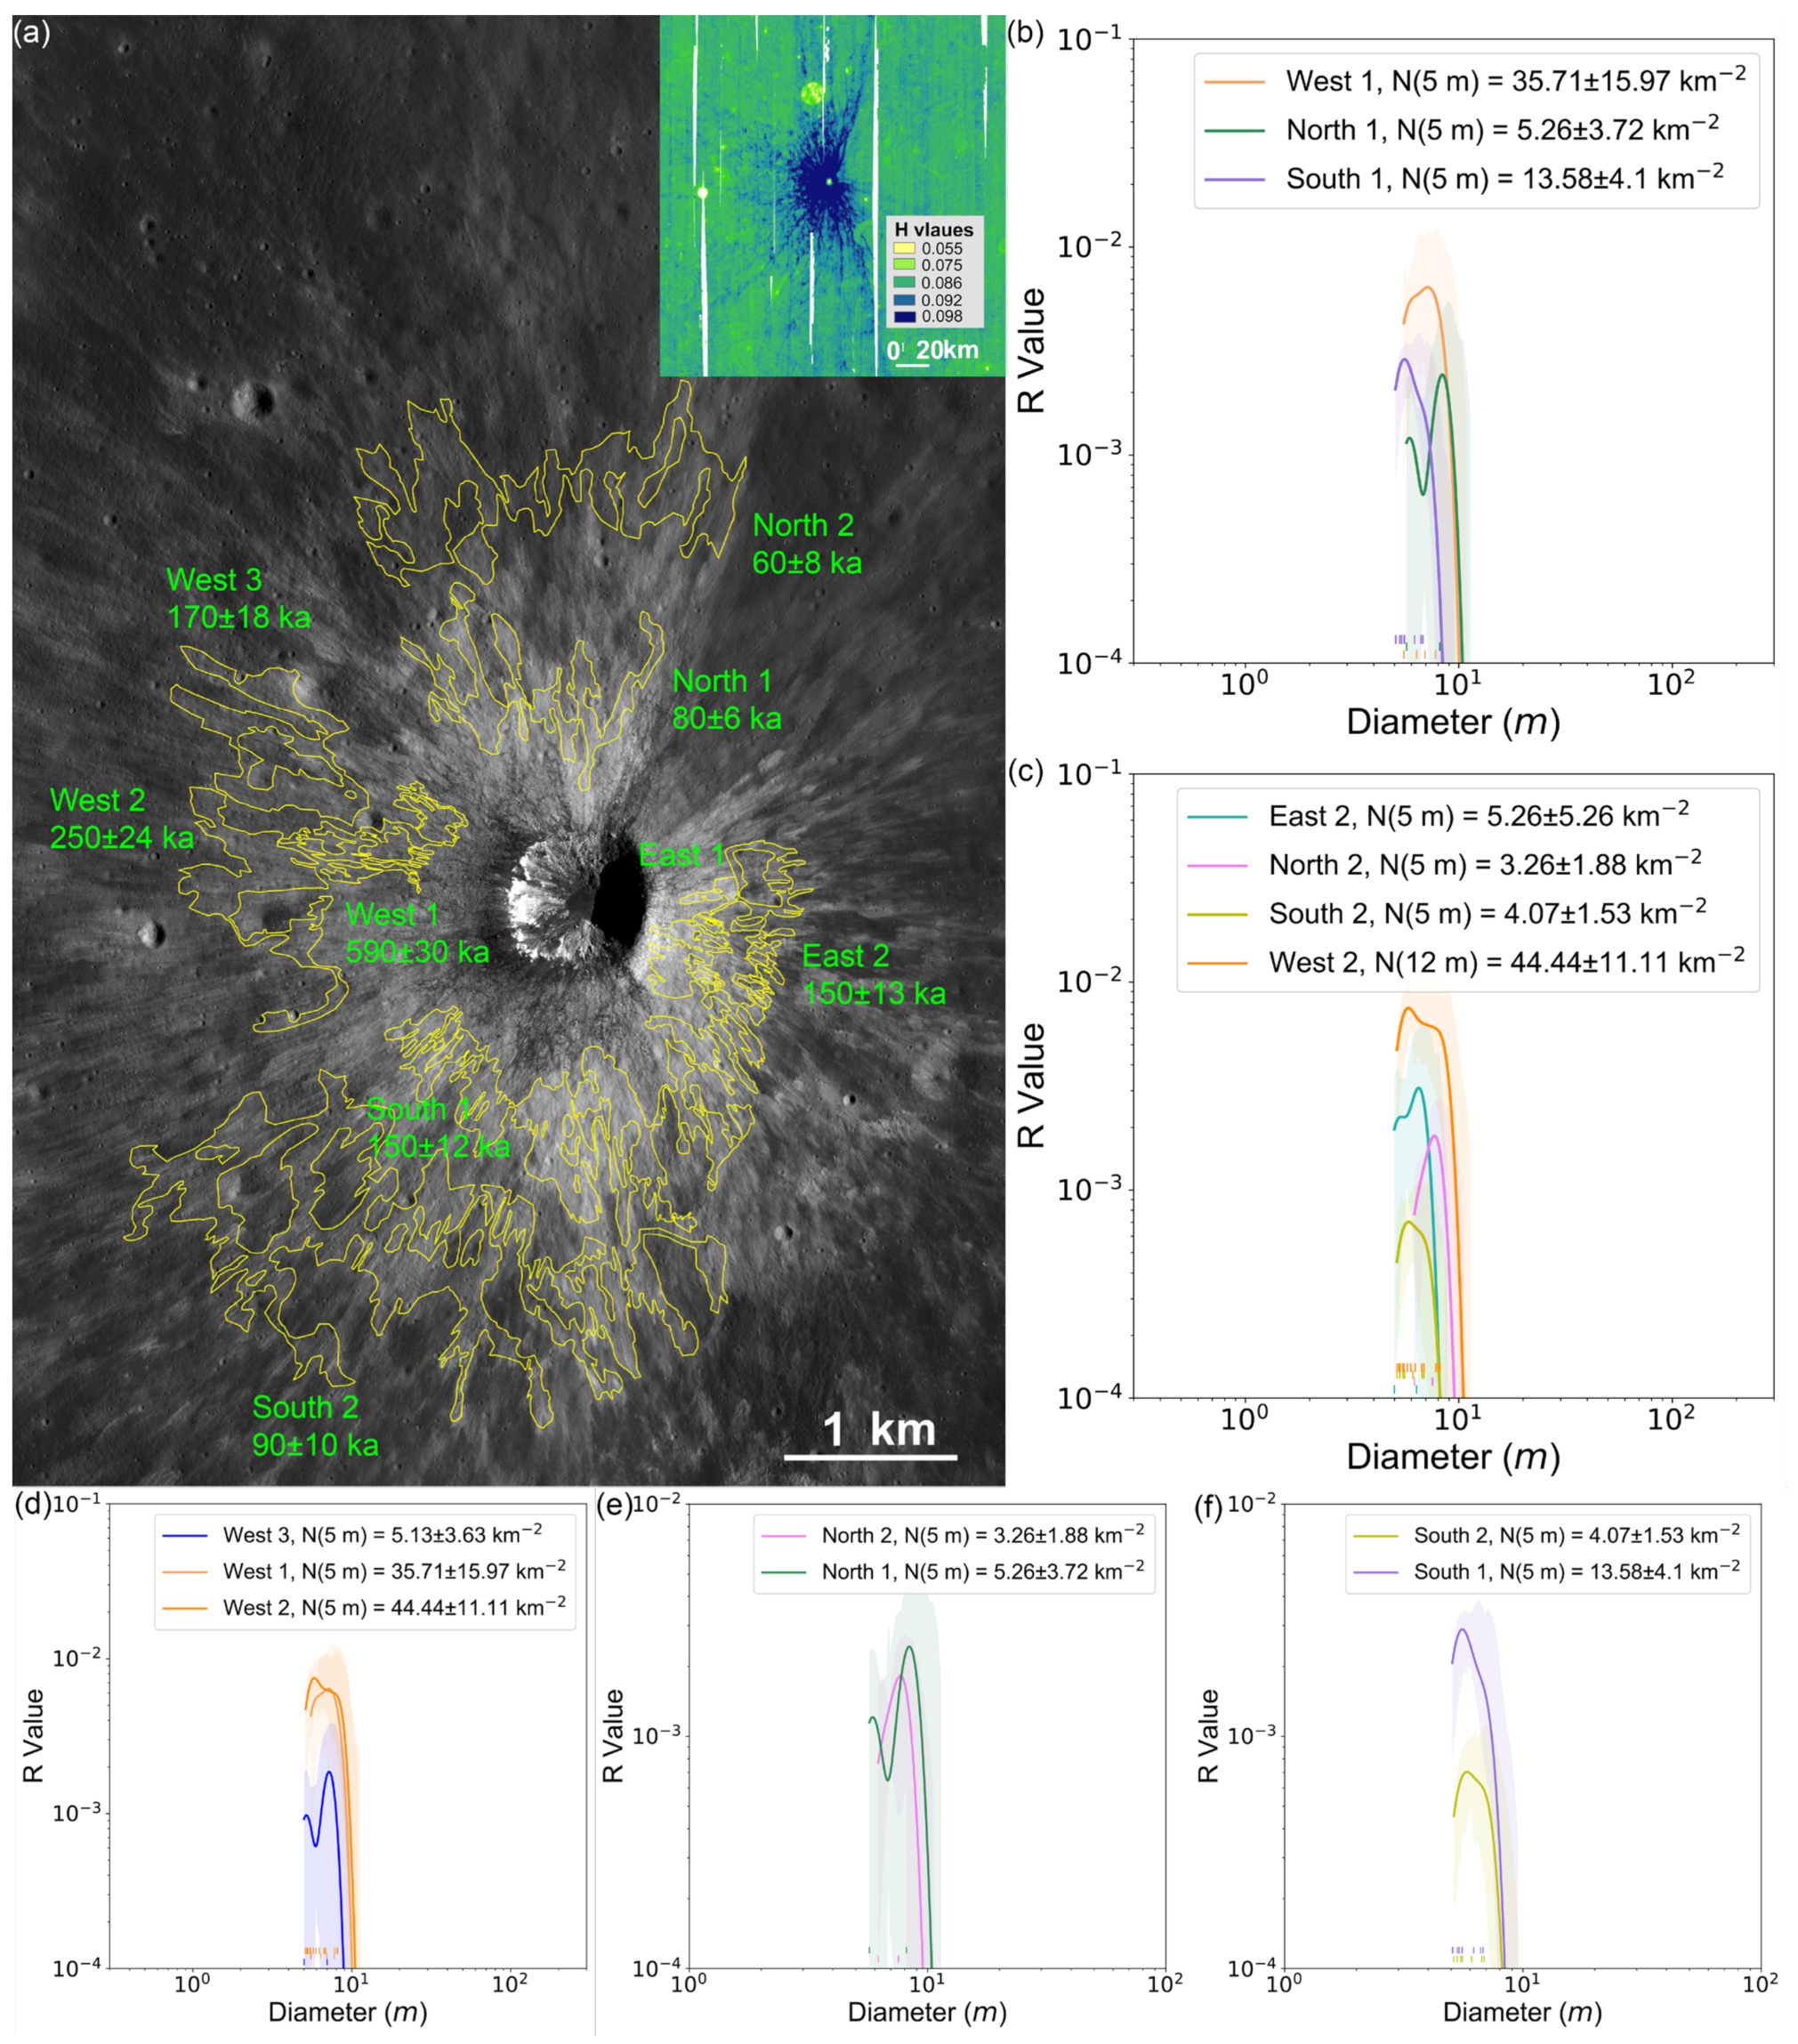
3.3. Size-Frequency Distribution (SFD) of Self-Secondaries

Around a given cold spot crater, the SFD of self-secondaries can be estimated by comparing the SFDs of crater populations that are accumulated on different layers of ejecta deposits. For this purpose, we selected multiple (normally eight depending on the surface topography, extent of ejecta flows, and imaging conditions) counting areas around each cold spot crater. With respect to the interpreted trajectory of the impactor that formed the cold spot crater, the counting areas were selected at different azimuths and radial distances to the parent crater rim. Figure 5 and Figure 6 show crater statistics around two cold spot craters that were formed with relatively large and small impactor incidence angles with respect to the surface tangent, respectively. According to absolute model ages of cold spot craters that are larger than ~800 m in diameters [37], the two cold spot craters are among the youngest, so the density of potentially accumulated primaries is the smallest.
Eight areas were selected on the ejecta flows around the cold spot crater shown in Figure 5a, and each major azimuth (east, south, west, and north) contains two counting areas that have different radial distances (Figure 5a). Both the cold rays and visible ejecta deposits of this crater do not exhibit clear asymmetric distributions (Figure 5a), suggesting that the impactor trajectory was relatively steep, perhaps with an incidence angle of >~60° [56,57]. Figure 5b–i compare crater SFDs on the counting areas. As a common phenomenon of crater populations that are accumulated on top of cold spot craters, their crater SFDs have large statistical uncertainties due to the small number of superposed craters (Figure 5). We further employed the N(Dmin) number (i.e., number of craters with diameters equal to and larger than Dmin per square kilometers) to represent the cumulative crater density, where Dmin is the minimum confidence diameters of complete statistics. The error of N(Dmin) is set as the 1 sigma uncertainty. The results show that the inner four counting areas (Figure 5b–c) exhibit both similar crater SFDs and N(5 m) values, and the same is true for the outer four counting areas, except for the East2 area that contains no craters larger than 5 m in diameter (Figure 5d–e). At the same azimuth, however, each of the outer four counting areas exhibits a lower SFD and/or smaller N(5 m) than the inner counting area (Figure 5f–i).
To further show the effect of self-secondaries on absolute model ages derived from crater statistics, we estimated absolute model ages for the eight counting areas using the updated lunar crater chronology function [9], which has a better control on the crater SFD of the anchored stratigraphic units. A new production function of craters larger than 7 m in diameter on the Moon was used here, which was constructed based on repeated imaging for identical lunar surfaces by LROC NAC [17]. Our results show that model ages of the eight units vary from ~100–310 ka (Figure 5a), which are less than that (380 ± 40 ka) predicted earlier [37]. The main reason for this discrepancy is two fold: our counting areas were selected based on high-resolution geological study, instead of simply using the entire continuous ejecta deposits; and the detailed crater counts here have deliberately avoided small craters that are potentially older than the cold spot crater.
Many lunar cold spot craters were formed by highly oblique impacts. As evidenced by the asymmetric distribution of cold rays and ejecta deposits, the impactor that formed the cold spot crater shown in Figure 6a came from the north–northeast. Both the visible ejecta and cold rays exhibit a forbidden zone at the northeast, although proximal ejecta and melt flows are still visible in a limited region at the uprange direction (Figure 6a). Therefore, the incidence angle of the impactor was rather small, possibly less than ~30° [56,57]. While layers of ejecta are developed at all azimuths of this cold spot crater (including the uprange direction at the northeast), those at the two wing sides of the impactor trajectory are much more pronounced. Ejecta at the downrange are covered by low-reflectance melt flows (Figure 6a).
To resolve the detailed emplacement history of self-secondaries, we assigned 11 counting areas around the cold spot crater (Figure 6a). Both the eastern (East 1, East 2, East 3) and western ejecta (West 1, West 2, and West 3) are covered by three counting areas that have different radial distances. Only one area can be assigned for the ejecta deposits at the uprange direction (North), due to its limited extent (Figure 6a). Ejecta deposits at the downrange direction have been largely covered by melt veneers, so only one area (Downrange) was assigned as well (Figure 6a). Two areas at the southwestern ejecta were selected (Southwest 1 and Southwest 2), and one area on the melt flow at the downrange was selected (Melt).
The crater SFDs for the 11 areas exhibit large variations (Figure 6b–g). Within error bars, the three crater populations on the eastern ejecta deposits (Figure 6b) do not show obvious radial differences in the SFDs or N(12 m). The same is true for the two crater populations on the southeastern ejecta (Figure 6c) and the three crater populations on the western ejecta deposits (Figure 6d). Combining the three populations on the western ejecta deposits as a single population (termed as West), the SFD is compared with that of the combined populations at the eastern ejecta deposits (termed as East) and that at the southeastern ejecta deposits (termed as Southeast). Figure 6e shows that the three populations have comparable crater SFDs and N(12 m). The largest density difference exists between the crater populations at the uprange (i.e., North) and downrange (Figure 6f), which is up to 7 times. Interestingly, the melt flows exhibit a slightly lower density than the downrange population, but it is much larger than crater densities on all the other azimuths and radial distances (Figure 6g).
The earlier study has derived a model age of 420 ± 70 ka for this cold spot crater [37]. Likewise, we investigated the effect of self-secondaries on absolute model ages based on the 11 crater populations collected, and the results are annotated in Figure 6a. The updated crater chronology and production functions [9,37] were used in this calculation. The model ages can be as small as ~300 ka and as large as ~3.05 Ma. This sharp contrast suggests that self-secondaries should be abundant across the ejecta deposits, and they have highly heterogeneous spatial densities. The ~10 times maximum difference in the model ages further suggests that self-secondaries dominate the ejecta deposits.

4. Discussion

4.1. Formation Mechanism of Self-Secondaries

The occurrence of widespread self-secondaries around lunar simple craters suggests that the fragments that formed these self-secondaries cannot only be launched due to uplifting of transient crater floors [28]. The observed crosscutting relationships between self-secondaries and layers of ejecta flows suggest that fragments that formed self-secondaries were launched early during the cratering processes, and they had larger ejection angles with respect to the surface tangent than those launched during the excavation stage. During the excavation stage, ejecta that moved along a given excavation path have identical ejection angles (~45°; [58]) and velocities, so the ejecta landed at the same location after ballistic trajectories. Most of these ejecta are deposited in the proximal ejecta of the final crater [1]. Self-secondaries are recognized on top of proximal ejecta deposits, suggesting that other mechanisms have launched solid fragments with higher velocities. On the other hand, with similar ejection angles, fragments with larger ejection velocities should have larger ballistic ranges. The occurrence of self-secondaries on top of proximal ejecta suggests that fragments that formed self-secondaries had larger ejection velocities and ejection angles, yielding shorter ballistic ranges, longer flight times, and larger landing velocities. These requirements are consistent with the highly circular rims of self-secondaries (Figure 1 and Figure 2).
For kilometer-sized and smaller craters, their entire formation process lasts seconds or shorter [1], so all forms of impact ejecta were launched within a very transient time interval. When the layers of ejecta flows were emplaced, fragments that formed self-secondaries were continuously landed to the surface (Figure 1). Some of these fragments may have landed after most of the ejecta layers were emplaced. The flow time of the ejecta layers is critically important to constrain the minimum trajectory time (thus ejection velocity), but the initiation position of the ejecta flows was not known. Tracing back to the source locations, individual layers of ejecta flow could be sourced directly from the parent crater rim [52], or they could be triggered by the landing of ejecta closer to the parent crater [52]. The example in Figure 1b shows that along a continuous flow path of ~500 m, at least three layers of ejecta flows have embayed self-secondaries. This area (Figure 1b) is ~1.4 km from the center of the source crater (Figure 1a), so normal ballistic ejecta (assuming ejection angles of 45°) should have landed here with a velocity of ~45 m/s (equivalent to a minimum trajectory time of ~20 s). Assuming that the flows here (Figure 1b) have a maximum flow velocity that equaled the horizontal component of the landing velocity, the flow time should be at least ~15 s. Therefore, the ejecta that formed the self-secondaries should have trajectory times much larger than ~35 s.
Before the initiation of the excavation stage, impact spallation is the most likely mechanism to launch solid fragments with high ejection speed, near vertical angles, and large fragment sizes [25,28]. High-speed impact experiences have captured spalled fragments that were launched near vertically with large velocities [59], but the detailed fragment population was not systematically investigated. Recently, high-resolution numerical simulations appear capable of recovering the entire process of impact spallation, but the evolution of ejection angles during spallation were not tracked [60]. Analytical models of shock mechanics predict that both particle velocities and angles after shock-release are determined by the angle between the propagation directions of shock waves and refraction waves [60], so vertical ejections of spalled fragments are reasonable in natural impacts, because interfaces between impactors and target surfaces normally feature highly irregular shapes.

4.2. Production SFD of Self-Secondaries and Its Effect on Lunar Crater Chronology

Based on the maximum and minimum crater densities observed on the ejecta deposits, we estimated the production SFD of self-secondaries around cold spot craters. In theory, each of the crater populations observed consists a combination of self-secondaries and primaries. Possible contributions by distant background secondaries are negligible, considering the extremely young ages of the cold spot craters. Therefore, around a given cold spot crater, by subtracting the lowest SFD from the highest, the approximated SFD of extra self-secondaries can be determined. We must note that this approach would not derive the actual production SFD of self-secondaries, because the lowest crater SFD (i.e., that on the uprange ejecta deposits) already contains an unknown portion of self-secondaries. If the radiometric sample age of a cold spot crater could be constrained by future sample return missions, the actual SFD of self-secondaries can be constrained with a higher confidence.
The cold spot crater shown in Figure 7 is the youngest one (~230 ± 20 ka) that was cataloged in previous studies [37]. This crater was also formed by an oblique impact, as evidenced by the highly asymmetric cold rays (Figure 7a). However, the visible ejecta do not exhibit such obvious asymmetry, suggesting that the impactor trajectory was less oblique compared to the case shown in Figure 6a. Nine areas are selected on the ejecta deposits to study the SFDs of superposed craters: Three areas on the western ejecta deposits (West 1, West 2, and West 3), along with two areas on each of the eastern (East 1 and East 2), northern (North 1 and North 2), and southern ejecta (South 1 and South 2). The one extra area selected on the western ejecta (West 3) is used to compare potential lateral differences of crater SFDs in adjacent areas that have similar radial distance to the parent crater. For further analyses, the two eastern areas are then combined as the uprange ejecta (Uprange), and the three western areas are combined as the downrange ejecta (Downrange). Figure 7b–f and Figure 8a compare the crater SFDs. For the four counting areas on the inner ejecta (Figure 7b), the downrange ejecta exhibit the largest SFD and N(5 m), the uprange ejecta have no craters larger than 5 m (hence its absence from Figure 7b), and that on the North 1 and South 1 are comparable. A similar density pattern is visible on the four counting areas on the outer ejecta (Figure 7c), but the uprange ejecta here (North 2) have a comparable crater density with the East 2 and South 2 areas (Figure 7c). However, at a given azimuth, areas with different radial distances from the parent cold spot crater do not exhibit systematic density variations (Figure 7d–f), unlike the cases shown in Figure 5. The downrange ejecta (Figure 8a) exhibit a much higher SFD than the uprange ejecta, confirming a concentrated formation of self-secondaries at the downrange. Compared to the model age derived in earlier study [37], model ages updated for the nine counting areas are mostly smaller, which are ~60 to 250 ka (Figure 7a).
Based on the two cases shown in Figure 6 and Figure 7, the crater populations at the uprange and downrange ejecta deposits are used to estimate the SFD of self-secondaries (i.e., extra self-secondaries). Figure 8b shows that both of the SFDs of the extra self-secondaries have a cumulative SFD slope of about –3, consistent with that of typical secondaries [11,12,61]. Employing the updated crater chronology and production functions, the SFD of the extra self-secondaries is equivalent to that of primary craters ~317 ka and 2.05 Ma old in model ages, respectively (Figure 8b). These equivalent model ages do not have geological meanings, since they are based on secondaries. However, this comparison shows that self-secondaries produced by different impact events may have similar shapes of crater SFDs, but their production densities are significantly different. The comparison also shows that for each of the two cases, the extra self-secondaries have larger crater densities than craters at the uprange, demonstrating the dominance of self-secondaries over the ejecta deposits. Therefore, considering the large density diversity of self-secondaries, the 5 Copernican-aged calibration points of the lunar crater chronology should be systematically re-calibrated to the remove the potential effect of self-secondaries, especially for the three craters that are less than ~100 Ma old (i.e., South Ray, North Ray, and Cone).

5. Conclusions

For the first time, potential self-secondaries formed by lunar cold-spot craters are observed, representing the first discovery of self-secondaries around simple craters. The self-secondaries have highly heterogeneous spatial distributions, which are manifested in both visible density variations and different crater size-frequency distributions azimuthally and radially around the parent crater. Their crosscutting relationships with different layers of ejecta deposits suggest that impact spallation is the most likely mechanism to account for the early ejection with large velocities, steep angles, and short trajectory distances. We performed detailed crater size-frequency distribution measurements around different ejecta facies of the cold spot craters, demonstrating that self-secondaries dominate small crater populations on recently formed craters. The extracted density of self-secondaries further shows their importance to the calibration of the lunar crater chronology.

Supplementary Materials

The following are available online at https://www.mdpi.com/2072-4292/13/6/1087/s1, Table S1: IDs and available addresses of data used in this work.

Author Contributions

Conceptualization, Z.X.; methodology, Z.X.; software, Y.C. and Z.X.; validation, Z.X., J.C., Y.L. and Y.C.; formal analysis, Z.X. and Y.C; investigation, Z.X. and Y.C.; resources, Z.X. and J.C.; data curation, Y.C.; writing—original draft preparation, Z.X. and Y.C.; writing—review and editing, Z.X., J.C., Y.L. and Y.C.; visualization, Y.C.; supervision, Z.X. and J.C.; project administration, Z.X.; funding acquisition, Z.X. and J.C. All authors have read and agreed to the published version of the manuscript.

Funding

The authors are supported by the B-type Strategic Priority Program of the Chinese Academy of Sciences (grant XDB41000000), the National Natural Science Foundation of China (41773063), the pre-research Project on Civil Aerospace Technologies (D020201 and D020202) funded by Chinese National Space Administration, the Key Research Program of Frontier Sciences of the Chinese Academy of Sciences (No.QYZDY-SSW-DQC028), and the Science and Technology Development Fund of Macau (grant 0042/2018/A2).

Data Availability Statement

All the base data (imagery, topography, and H-map) used in this study and their available addresses are listed in the Table S1. The spatial distributions and crater size-frequency distributions data derived are uploaded to the data repository in the public domain (available at https://doi.org/10.5281/zenodo.4505866 since 5 February 2021).

Acknowledgments

The three reviewers are acknowledged for their comments.

Conflicts of Interest

The authors declare no conflict of interest.

References

  1. Melosh, H.J. Impact Cratering: A Geologic Process; Oxford University: New York, NY, USA, 1989; pp. 1–255. [Google Scholar]
  2. Werner, S.C.; Ivanov, B.A. Exogenic dynamics, cratering, and surface ages. In Treatise on Geophysics, 2nd ed.; Elsevier: Amsterdam, The Netherlands, 2015; Volume 10, pp. 327–365. [Google Scholar] [CrossRef]
  3. Fassett, C.I. Analysis of impact crater populations and the geochronology of planetary surfaces in the inner solar system. J. Geophys. Res. Planets 2016, 121, 1900–1926. [Google Scholar] [CrossRef]
  4. Hartmann, W.K. Terrestrial and lunar flux of meteorites in the last two billion years. Icarus 1965, 4, 157–165. [Google Scholar] [CrossRef]
  5. Neukum, G. Meteoritenbombardement and Datierung Planetarer Oberflächen. In Habilitation Dissertation for Faculty Membership; University of Munich: Munich, Germany, 1983. [Google Scholar]
  6. Stöffler, D.; Ryder, G. Stratigraphy and isotope ages of lunar geologic units: Chronological standard for the inner solar system. Space Sci. Rev. 2001, 96, 9–54. [Google Scholar] [CrossRef]
  7. Strom, R.G.; Malhotra, R.; Takashi, I.; Yoshida, F.; Kring, D.A. The origin of planetary impactors in the inner solar system. Science 2005, 309, 1847–1850. [Google Scholar] [CrossRef] [PubMed] [Green Version]
  8. Neukum, G.; Ivanov, B.A.; Hartmann, W.K. Cratering records in the inner solar system in relation to the lunar reference system. Space Sci. Rev. 2001, 96, 55–86. [Google Scholar] [CrossRef]
  9. Robbins, S.J. A new crater calibrations for the lunar crater-age chronology. Earth Planet. Sci. Lett. 2014, 403, 188–198. [Google Scholar] [CrossRef]
  10. Qian, Y.; Xiao, L.; Head, J.W.; van der Bogert, C.; Hiesinger, H.; Wilson, L. Young lunar mare basalts in the Chang’e-5 sample return region, northern Oceanus Procellarum. Earth Planet. Sci. Lett. 2021, 555, 116702. [Google Scholar] [CrossRef]
  11. McEwen, A.S.; Bierhaus, E.B. The importance of secondary cratering to age constraints on planetary surfaces. Annu. Rev. Earth Planet. Sci. 2005, 34, 535–567. [Google Scholar] [CrossRef] [Green Version]
  12. Bierhaus, E.B.; McEwen, A.S.; Robbins, S.J.; Singer, K.N.; Dones, L.; Kirchoff, M.R.; Williams, J.P. Secondary craters and ejecta across the solar system: Populations and effects on impact-crater based chronologies. Meteorit. Planet. Sci. 2018, 53, 638–671. [Google Scholar] [CrossRef] [Green Version]
  13. Shoemaker, E.M. Preliminary analysis of the fine structure of the lunar surface in Mare Cognitum. In The Nature of the Lunar Surface; Johns Hopkins Press: Baltimore, MD, USA, 1966; pp. 75–134. [Google Scholar]
  14. Xiao, Z. On the importance of self-secondaries. Geosci. Lett. 2018, 5, 17. [Google Scholar] [CrossRef]
  15. Oberbeck, V.R. The role of ballistic erosion and sedimentation in lunar stratigraphy. Rev. Geophys. Space Phys. 1975, 13, 337–362. [Google Scholar] [CrossRef]
  16. Schultz, P.H.; Gault, D.E. Clustered impacts: Experiments and implications. J. Geophys Res. 1985, 90, 3701–3732. [Google Scholar] [CrossRef]
  17. Speyerer, E.J.; Povilaitis, R.Z.; Robinson, M.S.; Thomas, P.C.; Wagner, R.V. Quantifying crater production and regolith overturn on the Moon with temporal imaging. Nature 2016, 538, 215–218. [Google Scholar] [CrossRef]
  18. Xiao, Z. Size-frequency distribution of different secondary crater populations: 1. Equilibrium caused by secondary impacts. J. Geophys. Res. Planets 2016, 121, 2404–2425. [Google Scholar] [CrossRef] [Green Version]
  19. Shoemaker, E.M.; Batson, R.M.; Holt, H.E.; Morris, E.C.; Rennilson, J.J.; Whitaker, E.A. Observations of the lunar regolith and the Earth from the television camera on Surveyor 7. J. Geophys. Res. 1969, 74, 6081–6119. [Google Scholar] [CrossRef]
  20. Plescia, J.B.; Robinson, M.S. New constraints on the absolute lunar crater chronology. In Proceedings of the 42nd Lunar & Planetary Science Conference, The Woodlands, TX, USA, 7–11 March 2011. [Google Scholar]
  21. Xiao, Z.; Werner, S.C. Size-frequency distribution of crater populations in equilibrium on the Moon. J. Geophys. Res. Planets 2015, 120, 2277–2292. [Google Scholar] [CrossRef]
  22. van der Bogert, C.H.; Hiesinger, H.; Dundas, C.M.; Kruger, T.; McEwen, A.S.; Zanetti, M.; Robinson, M.S. Origin of discrepancies between crater size-frequency distributions of coeval lunar geologic units via target property contrasts. Icarus 2017, 298, 49–63. [Google Scholar] [CrossRef]
  23. Zanetti, M.; Stadermann, A.; Joliff, B.; Hiesinger, H.; van der Bogert, C.H.; Plescia, J.B. Evidence for self-secondary cratering of Copernican-age continuous ejecta deposits on the Moon. Icarus 2017, 298, 64–77. [Google Scholar] [CrossRef]
  24. Williams, J.; van der Bogert, C.H.; Pathare, A.V.; Michael, G.G.; Kirchoff, M.R.; Hiesinger, H. Dating very young planetary surfaces from crater statistics: A review of issues and challenges. Meteorit. Planet Sci. 2017, 53, 554–582. [Google Scholar] [CrossRef] [Green Version]
  25. Xiao, Z.; Prieur, N.C.; Werner, S.C. The self-secondary crater population of the Hokusai crater on Mercury. Geophys. Res. Lett. 2016, 43, 7424–7432. [Google Scholar] [CrossRef] [Green Version]
  26. Boyce, J.M.; Mouginismark, P.J. Anomalous areas of high crater density on the rim of the Martian crater Tooting. In Proceedings of the Workshop on Issues in Crater Studies and the Dating of Planetary Surfaces, Laurel, MD, USA, 19–22 May 2015; pp. 19–22. [Google Scholar]
  27. Neesemann, A.; Gasselt, S.V.; Schmedemann, N.; Marchi, S.; Walter, S.; Preusker, F.; Michael, G.G.; Kneissl, T.; Hiesinger, H.; Jaumann, R.; et al. The various ages of Occator crater, Ceres: Results of a comprehensive synthesis approach. Icarus 2019, 320, 60–82. [Google Scholar] [CrossRef]
  28. Schenk, P.; Kirchoff, M.; Hoogenboom, T.; Rivera-Valentin, E. The anatomy of fresh complex craters on the mid-sized icy moons of Saturn and self-secondary cratering at the rayed crater Inktomi (Rhea). Meteorit. Planet. Sci. 2020, 55, 2440–2460. [Google Scholar] [CrossRef]
  29. Plescia, J.B.; Robinson, M.S. Lunar self-secondary cratering: Implications for cratering and chronology. Proc. Lunar Planet. Sci. 2015, 46, 16–20. [Google Scholar]
  30. Plescia, J.B.; Robbins, M.S. Giordano Bruno: Small crater populations––Implications for self-secondary cratering. Icarus 2019, 321, 974–993. [Google Scholar] [CrossRef]
  31. Mendell, W.W.; Low, F.J. Preliminary results of the Apollo 17 infrared scanning radiometer. Moon 1974, 9, 97–103. [Google Scholar] [CrossRef]
  32. Bandfield, J.L.; Ghent, R.R.; Vasavada, A.R.; Paige, D.A.; Lawrence, S.J.; Robinson, M.S. Lunar surface rock abundance and regolith fines temperatures derived from LRO Diviner radiometer data. J. Geophys. Res. 2011, 116, E00H02. [Google Scholar] [CrossRef]
  33. Paige, D.A.; Foote, M.C.; Greenhagen, B.T.; Schofield, J.T.; Calcutt, S.; Vasavada, D.J.; Preston, A.R.; Taylor, F.W.; Allen, C.C.; Snook, K.J.; et al. The Lunar Reconnaissance Orbiter Diviner Lunar Radiometer Experiment. Space Sci. Rev. 2010, 150, 125–160. [Google Scholar] [CrossRef] [Green Version]
  34. Hayne, P.O.; Bandfield, J.L.; Siegler, M.A.; Vasavada, A.R.; Ghent, R.R.; Williams, J.P.; Greenhagen, B.T.; Aharonson, O.; Elder, C.M.; Lucey, P.G.; et al. Global regolith thermophysical properties of the Moon from the Diviner Lunar Radiometer Experiment. J. Geophys. Res. 2017, 122, 2371–2400. [Google Scholar] [CrossRef] [Green Version]
  35. Bandfield, J.L.; Song, E.; Hayne, P.O.; Brand, B.D.; Ghent, R.R.; Vasavada, A.R.; Paige, D.A. Lunar cold spots: Granular flow features and extensive insulating materials surrounding young craters. Icarus 2014, 231, 221–231. [Google Scholar] [CrossRef] [Green Version]
  36. Powell, T.M.; Greenhagen, B.T.; Taylor, S.; Williams, J.P.; Hayne, P.O.; Paige, D.A. Lunar cold spot properties and degradation. In Proceedings of the Lunar and Planetary Science Conference, The Woodlands, TX, USA, 19–23 March 2018; p. 49. [Google Scholar]
  37. Williams, J.P.; Bandfield, J.L.; Paige, D.A.; Powell, T.; Greenhagen, B.T.; Taylor, S.; Hayne, P.O.; Speyerer, E.J.; Ghent, R.R.; Costello, E.S. Lunar cold spots and crater production on the Moon. J. Geophys. Res. Planets 2018, 123, 2380–2392. [Google Scholar] [CrossRef] [Green Version]
  38. Robinson, M.S.; Brylow, S.M.; Tschimmel, M.; Humm, D.; Lawrence, S.J.; Thomas, P.C.; Denevi, B.W.; Bowman-Cisneros, E.; Zerr, J.; Ravine, M.A.; et al. Lunar Reconnaissance Orbiter Camera (LROC) instrument overview. Space Sci. Rev. 2010, 150, 81–124. [Google Scholar] [CrossRef]
  39. Becker, K.J.; Anderson, J.A.; Weller, L.A.; Becker, T.L. ISIS Support for NASA Mission Instrument Ground Data Processing Systems. In Proceedings of the 44th Lunar and Planetary Science Conference, The Woodlands, TX, USA, 18–22 March 2013. [Google Scholar]
  40. Plescia, J.B.; Robinson, M.S.; Paige, D.A. Giordano Bruno: The young and the restless. In Proceedings of the 41st Lunar and Planetary Science Conference, The Woodlands, TX, USA, 1–5 March 2010; p. 41. [Google Scholar]
  41. Antonenko, I.; Robbins, S.J.; Gay, P.L.; Lehan, C.; Moore, J. Effects of incidence angle on crater detection and the lunar isochron system: Preliminary results from the cosmoquest moonmappers citizen science project. In Proceedings of the Lunar and Planetary Science Conference, The Woodlands, TX, USA, 18–22 March 2013; Volume 44, p. 2705. [Google Scholar]
  42. Ostrach, L.R.; Robinson, M.S.; Denevi, B.W.; Thomas, P.C. Effects of incidence angle on crater counting observations. In Proceedings of the 42nd Lunar and Planetary Science Conference, The Woodlands, TX, USA, 7–11 March 2011; p. 42. [Google Scholar]
  43. Kneissl, T.; van Gasselt, S.; Neukum, G. Map-projection-independent crater size–frequency determination in GIS environments—New software tool for ArcGIS. Planet. Space Sci. 2010, 59, 1243–1254. [Google Scholar] [CrossRef]
  44. Wang, Y.C.; Xie, M.G.; Xiao, Z.Y.; Cui, J. The minimum confidence limit for diameters in crater counts. Icarus 2020, 341, 113645. [Google Scholar] [CrossRef]
  45. Vasavada, A.R.; Bandfield, J.L.; Greenhagen, B.T.; Hayne, P.O.; Siegler, M.A.; Williams, J.P.; Paige, D.A. Lunar equatorial surface temperatures and regolith properties from the Diviner Lunar Radiometer Experiment. J. Geophys. Res. 2012, 117. [Google Scholar] [CrossRef]
  46. Robbins, S.J.; Riggs, J.D.; Weaver, B.P.; Bierhaus, E.B.; Chapman, C.R.; Kirchoff, M.R.; Singer, K.N.; Gaddis, L.R. Revised recommended methods for analyzing crater size-frequency distributions. Meteorit. Planet. Sci. 2018, 53, 891–931. [Google Scholar] [CrossRef]
  47. Crater Analysis Techniques Working Group; Arvidson, R.; Boyce, J.; Chapman, C.; Cintala, M.; Fulchignoni, M.; Moore, H.; Neukum, G.; Schultz, P.; Soderblom, L.; et al. Standard techniques for presentation and analysis of crater size–frequency data. Icarus 1979, 37, 467–474. [Google Scholar] [CrossRef] [Green Version]
  48. Williams, J.P.; Pathare, A.V.; Aharonson, O. The production of small primary craters on Mars and the Moon. Icarus 2014, 235, 23–36. [Google Scholar] [CrossRef] [Green Version]
  49. Denevi, B.W.; Koeber, S.D.; Robinson, M.S.; Garry, W.B.; Hawke, B.R.; Tran, T.N.; Lawrence, S.J.; Keszthelyi, L.P.; Barnouin, O.S.; Ernst, C.M.; et al. Physical constraints on impact melt properties from Lunar Reconnaissance Orbiter Camera images. Icarus 2012, 219, 665–675. [Google Scholar] [CrossRef]
  50. Ding, C.; Li, C.; Xiao, Z.; Su, Y.; Xing, S.; Wang, Y.; Feng, J.; Xiao, S.D.Y.; Yao, M. Layering structures in the porous material beneath the Chang’e-3 landing site. Earth Space Sci. 2020, 7, e2019EA000862. [Google Scholar] [CrossRef]
  51. Xiao, Z.; Ding, C.; Xie, M.; Cai, Y.; Cui, J.; Zhang, K.; Wang, J. Ejecta from the orientale basin at the Chang’E-4 landing site. Geophys. Res. Lett. 2021, 48, e2020GL090935. [Google Scholar] [CrossRef]
  52. Osinski, G.R.; Tornabene, L.L.; Grieve, R.A.F. Impact ejecta emplacement on terrestrial planets. Earth Planet. Sci. Lett. 2011, 310, 167–181. [Google Scholar] [CrossRef]
  53. Xiao, Z.; Zeng, Z.; Li, Z.; Blair, D.M.; Xiao, L. Cooling fractures in impact melt deposits on the Moon and Mercury: Implications for cooling solely by thermal radiation. J. Geophys. Res. Planets 2014, 119, 1496–1515. [Google Scholar] [CrossRef]
  54. Bray, V.J.; Atwood-Stone, C.; Neish, C.D.; Artemieva, N.A.; McEwen, A.S.; Mcelwaine, J.N. Lobate impact melt flows within the extended ejecta blanket of Pierazzo crater. Icarus 2018, 301, 26–36. [Google Scholar] [CrossRef] [Green Version]
  55. Pike, R.J. Depth/diameter relations of fresh lunar craters: Revision from spacecraft data. Geophys. Res. Lett. 1974, 1, 291–294. [Google Scholar] [CrossRef]
  56. Gault, D.E.; Wedekind, J.A. Experimental studies of oblique impact. Lunar Planet. Sci. 1978, 9, 3843–3875. [Google Scholar]
  57. Herrick, R.R.; Forsberg-Taylor, N.K. The shape and appearance of craters formed by oblique impact on the Moon and Venus. Meteorit. Planet. Sci. 2003, 38, 1551–1578. [Google Scholar] [CrossRef]
  58. Maxwell, D.E. Simple Z model of cratering, ejection, and the overturned flap. In Impact and Explosion Cratering; Pergamon Press: New York, NY, USA, 1977; pp. 1003–1008. [Google Scholar]
  59. Polanskey, C.A.; Ahrens, T.J. Impact spallation experiments: Fracture patterns and spall velocities. Icarus 1990, 87, 140–155. [Google Scholar] [CrossRef]
  60. Kurosawa, K.; Okamoto, T.; Genda, H. Hydrocode modeling of the spallation process during hypervelocity impacts: Implications for the ejection of Martian meteorites. Icarus 2018, 301, 219–234. [Google Scholar] [CrossRef] [Green Version]
  61. Xiao, Z.; Strom, R.G. Problems determining relative and absolute ages using the small crater population. Icarus 2012, 220, 254–267. [Google Scholar] [CrossRef]
Figure 1. Self-secondaries around a cold spot crater (D = 1442 m) that is centered at 151.68°E, 4.08°S. Solar illumination is from the left, and north is up in all the panels. (a) Layers of ejecta deposits are visible around crater rim, and they have different reflectances. (b–d) Crosscutting relationships between layers of ejecta and self-secondaries. Location of (b) is indicated in (a) and locations of (c,d) are indicated in (b). Self-secondaries (white arrows) formed on ejecta layers that were emplaced earlier were transected by subsequently arrived flows, suggesting a continuous landing of fragments during the emplacement of ejecta. IDs of data used in this figure are compiled in the Supplementary Materials.
Remotesensing 13 01087 g001
Figure 2. Self-secondaries and layers of ejecta deposits around a cold spot crater (D = 2315 m) that is centered at 144.40°E, 17.68°S. Solar illumination is from the right, and north is up in all the panels. (a) Morphology of the crater. Darkish melt-rich deposits are emplaced on top of bright granular ejecta. (b,c) Embayment of self-secondaries by post-deposition flows that are developed in the layers of ejecta deposits (white arrows). The locations of the two frames are marked in panel (a). IDs of data used in this figure are compiled in the Supplementary Materials.
Remotesensing 13 01087 g002
Figure 3. Heterogeneous distribution of craters on the ejecta deposits of a cold spot crater (D = 898 m), which is centered at 90.76°E, 5.39°S. North is up in all the panels. (a) The cold spot crater is produced by an oblique impact coming from the northeast. (b) An area on the western ejecta deposits features abnormally high density of superposed craters compared to adjacent ejecta. The location is marked in panel (a). (c) Detailed view of highly clustered craters on the ejecta flows, and the small craters have penetrated through the high-reflectance ejecta, exposing subsurface lower-reflectance regolith. The location of this frame is annotated in panel (b). IDs of data used in this figure are compiled in the Supplementary Materials.
Remotesensing 13 01087 g003
Figure 4. Spatial distribution of self-secondaries that have excavated materials with different reflectances on ejecta flows around a cold spot crater (D = 1714 m; central coordinates 166.64°E, 19.38°N). Solar illumination is from the right, and north is up in all the panels. (a,b) Layers of ejecta deposits are visible around the cold spot crater, and the layers have different albedos (panel b). Craters with dark (green circles) and bright ejecta (yellow circles) are visible on the ejecta deposits. (c) Examples of dark (green arrows) and bright craters (yellow arrows) formed in the ejecta. (d) Diameters of the bright- and dark-toned self-secondaries. In the histogram, the bin width of crater diameters is 2 m. (e) Spatial density map of the bright- and dark-toned craters shows the clustered distribution. The green (D > 4.5 m) and yellow circles (D > 3.8 m) are the recognized small craters that have excavated dark and bright local materials, respectively. IDs of data used in this figure are compiled in the Supplementary Materials.
Remotesensing 13 01087 g004
Figure 5. Crater size-frequency distributions on layers of ejecta flows around a cold spot crater (D = 1051 m) that is centered at 120.12°E, 29.73°S. (a) The ejecta deposits do not exhibit obvious azimuth asymmetry, although dark ejecta are preferentially on at the western rim. Solar illumination is from the right, and north is up. The inset figure is the H-map of the cold rays, whose distributions do not exhibit obvious azimuth asymmetries either. The yellow areas show the locations of the eight counting areas that are aligned with their model ages. IDs of data used in this figure are compiled in the Supplementary Materials. (be) compare the crater size-frequency distributions (SFDs) between the East1 and West1, South1 and North1, East2 and West2, South2 and North2, respectively. (fi) compare the crater SFDs between the East1 and East2, South1 and South2, West1 and West2, North1 and North2, respectively.
Remotesensing 13 01087 g005
Figure 6. Crater size-frequency distribution on layers of ejecta flows around a cold spot crater (D = 2112 m) that is centered at 121.31°E, 18.68°N. (a) This crater was formed by an oblique impactor, which is evidenced by the highly asymmetric rim and distributions of visible ejecta and cold rays. North is up. The inset figure shows the H-map of the cold rays. The eleven counting areas are outlined as yellow polygons. IDs of data used in this figure are compiled in the Supplementary Materials. (bg) compare the crater SFDs on the three counting areas on the western ejecta, two counting areas on the southeastern ejecta, three counting areas on the western ejecta, three combined counting areas (East, West, and Southwest), counting areas at the downrange and uprange, counting areas at the melt flows and western ejecta, respectively.
Remotesensing 13 01087 g006
Figure 7. Size-frequency distribution of crater populations on the ejecta deposits of a cold spot crater (D = 898 m), which is centered at 90.76°E, 5.39°S. (a) This crater is produced by an oblique impact coming from the northeast, but the impactor trajectory was less shallow compared to that shown in Figure 6a. Solar illumination is from the right, and north is up. The yellow areas show the locations of the nine counting areas that are aligned with their model ages. IDs of data used in this figure are compiled in the Supplementary Materials. (bf) compare crater SFDs on the three counting areas on the inner ejecta (b), the four areas on the outer ejecta (c), three areas on the western ejecta (d), two areas on the northern ejecta (e), and two areas on the southern ejecta (f).
Remotesensing 13 01087 g007
Figure 8. Crater size-frequency distribution of the extra self-secondaries that were formed on the downrange ejecta but not on the uprange. Crater populations superposed on the two cold spot craters shown in Figure 6 and Figure 7 are used in this calculation. (a) Crater SFDs on the uprange and downrange ejecta deposits of the cold spot crater shown in Figure 7a. (b) SFD differences of crater populations on the downrange and uprange ejecta of the cold spot craters shown in Figure 6 and Figure 7. The equivalent absolute model ages for the two populations of extra self-secondaries are estimated based on the updated crater production [17] and chronology [9] functions.
Remotesensing 13 01087 g008
Publisher’s Note: MDPI stays neutral with regard to jurisdictional claims in published maps and institutional affiliations.

