Abstract
Unmanned aerial vehicles (UAVs) can capture high-quality aerial photos and have been widely used for large-scale urban 3D reconstruction. However, even with the help of commercial flight control software, it is still a challenging task for non-professional users to capture full-coverage aerial photos in complex urban environments, which normally leads to incomplete 3D reconstruction. In this paper, we propose a novel path planning method for the high-quality aerial 3D reconstruction of urban scenes. The proposed approach first captures aerial photos, following an initial path to generate a coarse 3D model as prior knowledge. Then, 3D viewpoints with constrained location and orientation are generated and evaluated, according to the completeness and accuracy of the corresponding visible regions of the prior model. Finally, an optimized path is produced by smoothly connecting the optimal viewpoints. We perform an extensive evaluation of our method on real and simulated data sets, in comparison with a state-of-the-art method. The experimental results indicate that the optimized trajectory generated by our method can lead to a significant boost in the performance of aerial 3D urban reconstruction.
1. Introduction
With the advantages of small size and affordable price, UAVs have been widely used in various fields, such as urban monitoring [1], intelligent transportation [2], precision agriculture [3], and industrial inspection [4]. Moreover, camera-mounted consumer UAVs have the ability to capture aerial photos in complex urban environments [5], which can be used to reconstruct accurate 3D structures with the aid of state-of-the-art structure from motion (SfM) and multi-view stereo (MVS) algorithms [6,7,8]. Typically, these high-quality 3D models are essential to many high-level applications, including augmented reality (AR), virtual reality (VR), and robotic navigation [9]. As the key idea behind 3D reconstruction algorithms is to exploit the geometric information from multiple views, the reconstruction quality essentially depends on the information availability of the input images [10,11,12,13]. Thus, aerial photos should cover the entire scene as fully as possible, in order to avoid incomplete or low-quality modeling.
UAV-based 3D scanning is typically performed either under manual control or automated navigation operation; however, neither can fully satisfy the requirement of achieving complete coverage for urban scenes. On the one hand, simultaneous manipulation of the motion and viewing direction of a UAV is highly challenging, even for experienced drone pilots. Furthermore, human factors can easily lead to UAV accidents in complex urban scenes. On the other hand, existing commercial flight planning applications, such as Pix4Dcapture (https://www.pix4d.com/product/pix4dcapture/ (accessed on 1 March 2021)) and DJI Flight Planner (https://www.djiflightplanner.com (accessed on 1 March 2021)), generally choose pre-defined flight patterns (e.g., grid, zigzag, or circular trajectory) at a safe overhead distance, with the camera pointing in a default direction. However, the use of such software, in many cases, leads to incomplete reconstructions due to important information not being captured (e.g., due to occlusions by walls or convex structures). More specifically, due to the huge computational burden and long process of the reconstruction, it is often impractical to find and rescan the incomplete regions immediately.
Path planning methods for high-quality 3D reconstruction have been developed over the past decade, including model-free and model-based schemes. The next-best-view (NBV) algorithm is a typical representative of the former, which iteratively calculates the best view for the next scan without prior knowledge of the scene. However, full coverage cannot be guaranteed, due to the local optimum problem. Recently, planning a 3D UAV path based on a coarse proxy model of the scene has been shown to be a better solution, which is also referred to as the ‘explore-and-exploit’ method [14,15]. The ‘explore’ stage acquires an initial observation and reconstructs the target scene from the first flight pass; then, the ‘exploit’ stage designs an optimized trajectory, according to the coarse model. Finally, the UAV captures aerial photos again in the second flight, following the designed trajectory in order to generate a better reconstruction. Even with the tremendous advances in the mentioned two-stage technologies, existing methods require higher computational power, due to the doubled visit and reconstruction.
In this paper, we propose a novel explore-and-exploit path planning approach for aerial 3D urban reconstruction, as shown in Figure 1. First, an initial flight path (e.g., pre-defined or manual motion) is chosen to capture aerial photos. Then, a coarse 3D point cloud is generated by a SfM and MVS pipeline [13,16]. To speed up the initial reconstruction, key images are selected to eliminate tedious images. Similar to the NBV algorithm proposed by Xu et al. [17], a Poisson-based reconstruction quality assessment [18] is used to locate low-quality regions of the prior 3D model. Combined with a sampling-based view planning method, candidate viewpoints that cover these undersampled areas, as well as the remained overall scene, are generated according to their constrained location and orientation. Finally, an optimized trajectory is generated by smoothly connecting the optimum viewpoints, while minimizing a unified cost function, which consists of the angle and distance difference of viewpoints. We evaluate our method on both simulated and real-world urban scenes. The experimental results indicate that following the optimized trajectory generated by our method can lead to a significant boost in the performance of aerial 3D urban reconstruction.
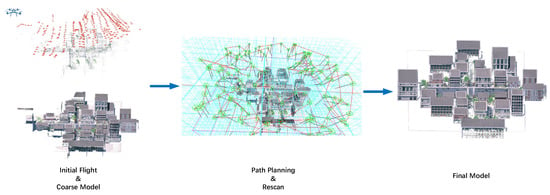
Figure 1.
Overview of our method. The prior coarse model is first generated from an initial flight. Then, an optimized trajectory is extracted from the decomposed view space, based on the prior knowledge. Finally, the high-quality model is reconstructed after rescanning the scene. Note that all models are represented as point clouds.
The main contributions of this work are as follows:
- We devise a simple, yet effective viewpoint generation method, which significantly reduces the search space by the association with the surface clusters of the 3D prior of the scene estimated by an initial flight pass.
- We propose a novel viewpoint selection method that combines candidate viewpoints with sample points to fully cover the entire scene, especially for undersampled areas in the initial flight pass, which gives rise to a highly complete 3D reconstruction with as few acquired images as possible.
An extensive evaluation on real and simulated data sets is performed using urban scenes at different scales, in order to illustrate the effectiveness of our approach.
2. Related Work
2.1. Aerial Reconstruction
In recent years, aerial reconstruction has been widely used in diverse applications, such as Archaeology [19] or Smart Cities [20]. To date, various solutions have been proposed, which are correlated to the onboard sensors of UAVs, such as monocular RGB cameras, stereo cameras, RGB-D sensors, multi-spectral cameras, or LiDARs. Compared to monocular RGB cameras, other sensors require special hardware, making them more cumbersome and expensive. Therefore, considering the complex environment of urban scenes and the payload of the UAV, it is a natural choice to leverage monocular camera-mounted UAVs to acquire rich visual information of the surroundings. Meanwhile, methods based on multi-view geometry [21] have been proved to be effective and efficient to recover 3D models from aerial photos.
Generally, the following two main approaches have been used for vision-based aerial 3D reconstruction. Mainstream aerial reconstruction software are generally based on SfM [11], such as Pix4DMapper (https://www.pix4d.com/product/pix4dmapper-photogrammetry-software/ (accessed on 1 March 2021)) and DJI Flight Planner. However, traditional SfM methods take hours to generate the final reconstruction models; thus, these approaches are not suitable for real-time usage. In contrast, another option aimed at real-time reconstruction is simultaneous localization and mapping (SLAM) [22], which is able to output the 3D map of an environment together with camera poses simultaneously. Therefore, some researchers have utilized SLAM for real-time aerial reconstruction [23,24]. However, traditional monocular SLAM methods are always conducted on tracking, and can obtain only sparse or semi-dense maps. In addition, compared with the SfM method, the accuracy of the generated 3D map is much worse.
2.2. Path Planning for Scene Reconstruction
The selection of appropriate viewpoints for 3D reconstruction has been studied for decades. There have been extensive prior works using NBV planning methods, which can process exploration and reconstruction in real-time. Kriegel et al. [25] proposed an autonomous 3D object modeling system, which searches for scan paths to maximize the quality of the 3D model using both object surface and volumetric models. Wu et al. [18] proposed an autonomous high-quality scanning method for complex physical objects, which computes NBVs based on the Poisson-based reconstruction quality measurement. Combined with an RGB-D based SLAM system [26], Xu et al. [17] focused on the automatic scanning of indoor scenes through object-guided scanning and reconstruction. More specifically, a consumer depth camera (i.e., the Microsoft Kinect) provides the ability for real-time scanning and reconstruction of indoor scenes. Meanwhile, the reconstruction quality measure proposed in [18] also helps to select NBVs for the Kinect sensor.
These mentioned works have achieved high-quality and detailed reconstruction of objects or indoor scenes; however, these approaches are difficult to apply to large-scale outdoor scenes, due to their high computational complexity. Moreover, full coverage cannot be guaranteed, as areas with less geometric information in the scene may be ignored.
Recent promising works have focused on explore-then-exploit methods. In the “explore” phase, a coarse estimate of the scene geometry is generated, which can be used to compute an optimized “exploit” trajectory for high-quality 3D reconstruction. Roberts et al. [14] proposed a mathematical model to estimate the usefulness of a camera trajectory for multiple view stereo reconstruction. Peng and Isler [27] tackled the view planning problem using an adaptive viewing rectangles algorithm; however, their view planning method needs more than two iterations to build a high-quality reconstruction. Hepp et al. [15] employed a hierarchical volumetric occupancy map and a submodular optimization formulation to select optimal viewpoint candidates. Smith et al. [28] proposed a reconstructability heuristic method to continually optimize the path planning. For these methods, the initial mesh models were obtained from open-source SfM and MVS approaches [14,15,28] or commercial software [27]. However, wrong triangular meshes often appear in the initial model and interfere with subsequent processes, usually caused by outliers scattered in space and the incorrect connection of adjacent 3D points. In our approach, the input is a point cloud without meshing, which allows the system to be more robust to noisy coarse models.
3. Proposed Method
3.1. Overview
In this section, we introduce our proposed path planning method for high-quality aerial 3D reconstruction. Our goal is to plan an optimized 3D trajectory for overall aerial scanning in urban scenes, where following this path could help to improve the accuracy and completeness of the final reconstruction. To this end, the key problem is how to successfully select appropriate viewpoints from the infinite space for the UAV. Intuitively, this problem would be solvable if prior knowledge of the scene could be gathered. Thus, a two-stage strategy consisting of two flights is proposed in this work, where the first flight explores the target scene and generates an initial coarse geometric model, which is further exploited to plan the second path, in order to ensure full coverage and high-quality reconstruction.
More specifically, our approach involves an initial flight to generate the prior coarse reconstruction, followed by sampling-based point cloud quality evaluation and viewpoint selection. In addition, two kinds of candidate viewpoints are successively chosen in the constrained view sampling space. The first corresponds to incomplete or low-quality areas, according to previous quality evaluation, while the second is used to fully cover the entire scene. Finally, an optimized 3D trajectory is generated by smoothly connecting the optimum viewpoints. The pipeline of our approach is presented in Figure 1. More details are given in the following sections.
3.2. Prior Model Construction
3.2.1. Coarse Reconstruction
The first step of our approach includes an initial flight pass and a subsequent coarse reconstruction, which acquires the scene information while providing a target reconstruction zone. The initial flight is not limited to manual control or automated navigation operation. A state-of-the-art SfM and MVS framework [13,16] is used to reconstruct a coarse point cloud from the captured aerial photos. Considering the possible environmental changes (e.g., sunlight or weather) during the initial reconstruction process, it is intuitively beneficial for the entire system if the coarse model can be generated quickly. However, due to the possible tedious capture of the first flight, a lot of computing resources may be consumed. Thus, we need to improve the process efficiency. Inspired by the rapid 3D reconstruction method [29], we select key images for the initial reconstruction from the captured aerial photos. More specifically, we first extract ORB features [30] for each image. Then, the features of the current image and the adjacent key image are matched to evaluate the overlap. Once the number of matched feature points is less than a threshold, the current image is used as a new key image, in order to ensure that the selected images retain sufficient overlap. It is worth noting that images with very few feature points are directly discarded, which mainly occurs in the simulated scenes. In our experiments, we found that discarding these images can greatly reduce the reconstruction error caused by mismatching. As ORB features are extremely fast to compute and match [31], the key image selection can be finished immediately (i.e., during the initial flight).
3.2.2. Pre-Processing
For safety reasons, the initial flight path usually adopts scanning the entire scene at a safe altitude, which is generally insufficient to generate complete and high-quality models. In contrast to other explore-and-exploit methods [14,15,28], our method directly analyzes the reconstructed dense point cloud, instead of the recovered mesh. In order to efficiently locate incomplete and low-quality regions, the following pre-processing step (shown in Figure 2) is proposed.
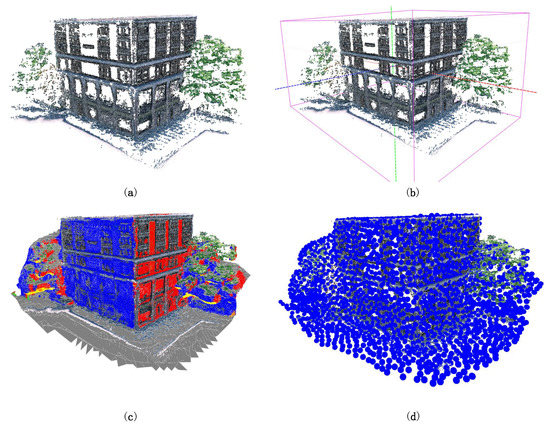
Figure 2.
Overview of the pre-processing: (a) Initial point cloud; (b) Extracted dominant axes and the bounding box; (c) Poisson surface reconstruction, where implicit surfaces belonging to different clusters are shown in different colors; and (d) Surface sampling, where the radius of the sample point is scaled for visualization.
Bounding box extraction. The bounding box of the prior model helps to determine the target reconstruction zone, which can reduce unnecessary computational overhead. To choose the appropriate bounding box, we calculate the normal for each point and extract three dominant axes from oriented points. The normal, , of each point is defined as the normal of the local surface around by taking into account the k-nearest neighbors. Specifically, the normal is calculated by performing principal component analysis on the neighborhood of point . After the normals of all points are calculated, we extract three dominant axes to construct the bounding box, one of which is perpendicular to the ground, as shown in Figure 2b.
Poisson surface reconstruction. Due to a variety of circumstances, such as the occlusions by walls in the scene, the initial model is usually incomplete, as shown in Figure 2a. In practice, we have the following two observations: (i) Incomplete areas are typically represented as holes that are difficult to accurately locate from discrete points; and (ii) probably due to the richer features, most areas close to the edge are better recovered. Inspired by the work of Wu et al. [18], we reconstruct a Poisson iso-surface, based on the previous per-point normal calculation. As shown in Figure 2c, implicit Poisson surfaces can fully cover all incomplete areas in the initial model. Furthermore, we cluster all surfaces according to the locations and normals to obtain a series of clusters , which can be used for the subsequent parallel viewpoint selection and path planning.
Surface sampling. Due to the huge number of points in the initial model, it is necessary to reduce the computational complexity through a sampling algorithm, in order to estimate the reconstruction quality. In this work, we use Poisson disk sampling [32], one of the most common sampling schemes with blue noise properties, to evenly sample on the surface of the initial model. By pre-defining the radius R of Poisson disks, we obtain a set of directed discrete sample points , where denotes the average normal of the points belonging to the sampling area . As shown in Figure 2d, uniform random distribution sampling can be performed on the implicit Poisson surfaces.
3.2.3. Quality Evaluation of the Initial Point Cloud
The goal of our work is to plan a 3D trajectory that fully covers the entire scene, especially the under-captured areas of the initial flight. Thus, it is necessary to find these corresponding incomplete and low-quality parts of the coarse model.
As mentioned in the pre-preprocessing stage, it is worth noting that the implicit Poisson surfaces can fully cover the whole scene, and that the sampled points are regularly distributed on the iso-surface. Intuitively, we could use the quality of the sample points to estimate the quality of the coarse model, which is derived based on the following observations: (i) If the local point cloud is sufficiently accurate and dense, the recovered Poisson surface will be very accurate and the sample point will be very close to the local model surface; (ii) on the contrary, if the local point cloud has low quality or missing areas, the Poisson surface will also lack the corresponding geometric details and the sample points will be quite different from the local 3D points.
More specifically, we calculate a completeness score, , and a smoothness score, , for each sample point , where represents the degree of completeness of the local point cloud around and indicates the degree of surface change of the local point cloud.
Completeness score. The completeness score indicates the likelihood of holes existing in the initial point cloud around the sample point .
Inspired by [18], the completeness score for the sample point is calculated as,
where denotes the gradient calculated during the Poisson surface reconstruction at sample point , is the normal of computed in the pre-processing step, is a density weighting function, and is the largest number of points in all sampling areas. According to the Poisson surface reconstruction algorithm [33], if the surface is of high quality and consistent with the initial point cloud, Equation (1) will have a higher value. Conversely, if holes exist in the local point cloud, the result will lead to a lower score.
Smoothness score. The smoothness score indicates the local normal changes in the initial point cloud around the sample point, which is calculated based on the distance-weighted normal change rate between the initial point cloud and the sample points S. For a sample point , the smoothness score is defined as
where R is the sample radius defined in the Poisson disk sampling; is a distance weighting, which is related to the Euclidean distance between the sample point and the point in the initial point cloud; and is the pre-defined threshold of the angle.
A higher smoothness score means that the local area in the initial point cloud around this sample point is smoother and the normal change rate is lower; on the contrary, a lower score indicates that the local surface reconstruction quality is relatively poor and may contain more geometric details that need to be rescanned carefully.
The final quality score of is calculated using the product of these two indicators:
In order to obtain a quantitative description of the overall reconstruction quality of the initial point cloud, the quality scores of all sample points are normalized at the end:
By normalizing the quality scores of sample points, the scores of all sample points are within [0, 1]. If the score of a sample point is close to 0, it means that the local point cloud at this sample point is more likely to have holes or contains more geometric details. If the score of a sample point is close to 1, it means that the local point cloud is relatively complete and consistent with the corresponding smooth surface.
3.3. Aerial Viewpoint Generation
3.3.1. View Sampling Space
In order to avoid collisions between the UAV and the buildings in the urban environment, it is necessary to determine the view sampling space for the flight. As shown in Figure 3, given the closest distance and the farthest distance , which are the specified safe distances from the UAV to the objects of the scene, we can obtain the restricted view sampling space to select viewpoints for the UAV. The no-fly space can also be defined when the distance to the object is closer than . Note that the planned trajectory is also prohibited from entering any of the no-fly space in the scene.
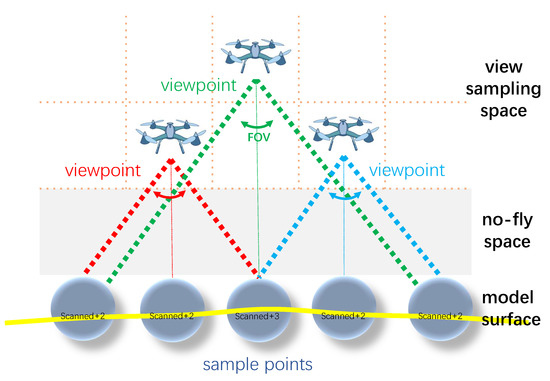
Figure 3.
Overview of viewpoint generation. Given the distance constraint of the UAV during the flight, the no-fly and view sampling space can be determined. Then, candidate viewpoints are obtained by uniformly sampling in the view sampling space. The final viewpoints are selected from these candidates, according to the scanned sample points on the surface of the coarse model.
3.3.2. Viewpoint Selection
To reduce the computational complexity, we divide the view sampling space into voxels of equal size, where the center of each voxel is regarded as one candidate viewpoint. The goal of viewpoint selection is to obtain a set of viewpoints from all candidate viewpoints that sufficiently observe all parts of the scene, especially the incomplete and low-quality areas. To achieve this goal, we select two kinds of candidate viewpoints: The first category is the local viewpoints which rescan the incomplete and low-quality areas; the second type is the global viewpoint , corresponding to the overall coverage.
Local viewpoints. By analyzing the reconstruction quality of the initial point cloud, we observe that sample points with lower quality score tend to be rescanned with higher priority. Thus, we first sort all the sample points according to the quality score, and select an ascending set whose score is lower than a pre-defined threshold. Then, for each sample point in , we try to find the best corresponding candidate viewpoint.
The candidate viewpoint can be formally defined as , where denotes the position and is the orientation of the candidate viewpoint. As mentioned earlier, the position is determined as the center of the voxel in the view sampling space and, so, we only need to estimate the optimum orientation .
Note that the possible orientation may point to any sample point in . We argue that the combination of sample point and candidate viewpoint has higher confidence from the following three aspects:
(i) It is necessary that the sample point should be visible from the candidate viewpoint . Intuitively, when there is no point cloud between and , the UAV could observe from . It is worth noting that the UAV is empirically not set to observe upwards, in practice; thus, the sample points above the candidate viewpoint are invisible by default. Then, we define a visibility weight and set if is visible from ; otherwise, .
(ii) The Euclidean distance between and is at a suitable observation interval. We define the optimal distance as the mean value of the pre-defined safety distances and . Then, a distance confidence, , can be calculated as:
(iii) The angle between the view ray and the normal of the sample point should be within a threshold (same as Equation (2)). The orientation confidence is calculated as:
where denotes the vector from the sample point to the candidate viewpoint and is the normal of .
Finally, for each pair , we can obtain a confidence score as:
For each sample point in , we use the greedy method to iteratively select the best unchosen candidate viewpoint with the highest confidence score. All selected viewpoints are added to the set of local viewpoints with determined orientation . To speed up the calculation, the local viewpoint selection is processed in parallel for each sample point cluster.
Global viewpoint. When the local viewpoint set has been determined, we compute the coverage range of these viewpoints. For each viewpoint in , the coverage range can be calculated according to the FoV of the camera and the distance between and its corresponding sample point . To simplify the calculation, we add the “scanned” mark by 1 for all sample points in the neighborhood of with the Euclidean distance smaller than .
To scan the entire scene completely, all sample points should be viewed at least twice for triangularization. Then, we need to select the global viewpoint set for all sample points added into with the “scanned” mark smaller than 2. More specifically, for each sample point in , we select the best candidate viewpoint with the highest confidence score (calculated by Equation (8)) in the view sample space, excluding . In order to make the global viewpoint as uniform as possible, the candidate viewpoints adjacent to selected viewpoints are also excluded. Similar to the previous local viewpoint selection, the global viewpoint selection is also performed in parallel for each sample point cluster, in order to improve calculation efficiency.
3.4. Path Planning
After obtaining the scanning viewpoints , a proper sequence is designed to connect the viewpoints, so that the UAV can fly safely and smoothly with a shorter path.
To ensure a fast and smooth flight path, the following requirements need to be fulfilled by our methodology: (i) The distance between the two viewpoints is short; and (ii) the orientation of the camera changes less when switching between viewpoints. Thus, we designed a unified cost function consisting of the translation and rotation changes between two viewpoints and .
(1) Translation Cost
The translation cost is related to the Euclidean distance between and , and can be calculated as:
where is the Euclidean distance between viewpoints and , is the maximum distance between all viewpoints, and is the minimum value.
(2) Rotation Cost
The rotation cost is related to the angle change of the orientation between viewpoints, and can be calculated as:
The minimum angle between the viewpoint orientations is defined as , while the maximum angle is . When the angle is closer to , the rotation cost is closer to 0; when the angle is closer to , the direction cost is closer to 1.
After separately calculating the above two kinds of cost, the switching cost can be obtained as:
Then, we can calculate the total switching cost of one sequence by accumulating the switching cost between two viewpoints on the path.
To generate a continuous path that travels through all viewpoints with the smallest switching cost, we formulate the problem as a standard Traveling Salesman Problem (TSP) and choose the Ant Colony Optimization (ACO) algorithm [34] to solve it. More specifically, the generated viewpoints are used as the cities and the switching cost between viewpoints is taken as the distance between cities in the TSP optimization problem. Then, the ant-cycle system [35] is applied to the TSP. Please refer to [35] for more technical details. Finally, the generated path is smoothed using a cubic Bezier curve.
4. Results
4.1. Experimental Setting
4.1.1. Data Set
To validate our method, we conducted a series of experiments in both virtual and real environments. Specifically, for comparison with a state-of-the-art method, we conducted our main experiments on thrual scenes (NY-1, GOTH-1, and UK-1) from the benchmark of [28], which consists of urban environments at different scale. Figure 4 shows an overview of the three scenes, including the proxy models provided by [28] and aerial photos captured from above in the virtual scenes.
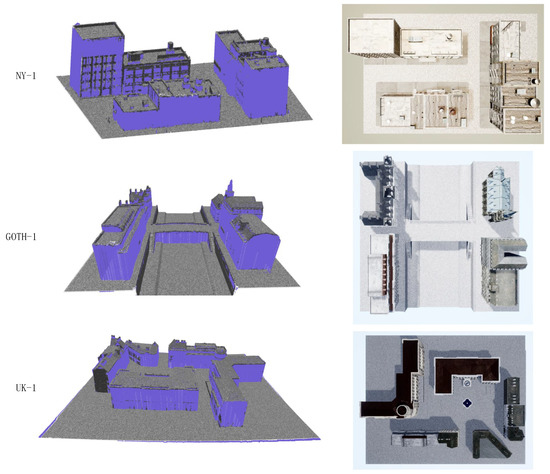
Figure 4.
Overview of the thrual scenes (NY-1, GOTH-1, and UK-1) from the benchmark of [28]. Note that the proxy models (left) are provided by the benchmark. The pictures on the (right) are captured from the top of the virtual scenes.
In order to conduct a comparison with the pre-defined flight paths commonly used by commercial software, we captured different sequences ual and real urban scenes. Specifically, we controlled the virtual camera in Unreal4 to scan the virtual scene “Urban City” (https://www.unrealengine.com/marketplace/product/urban-city (accessed on 1 March 2021)), a fully realized urban city environment, following the simulated pre-defined path and the path optimized by our method, respectively. We captured the virtual scene at different scales, including three small (Building-1, Building-2, and Building-3) and one large (City-1) captures. We also used a DJI Phantom 4 Pro to capture aerial photos from the real scene. Figure 5 shows an overview and the basic information about all of the scenes. We can see that the three selected buildings had typical characteristics: Building-1 was a two-story structure, where the lower layer was easy to scan insufficiently; Building-2 was a more symmetrical rectangular structure, but nearby buildings were more likely to cause occlusions; and there were some trees around Building-3, which could cause occlusions.
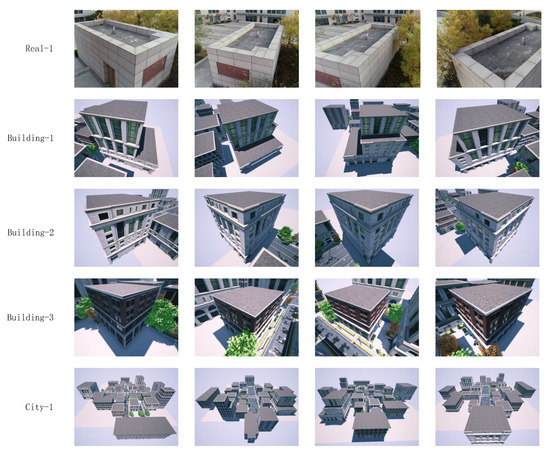
Figure 5.
Overview of the self-collected data sets. From top to bottom, the scenes are: Real-1 captured by one DJI Phantom 4 Pro; and the virtual scenes Building-1, Building-2, Building-3, and City-1, respectively.
4.1.2. Reconstruction
After the images were captured by the drone (or rendered at the viewpoints for virtual scenes), we used the open-source software COLMAP [13,16] to reconstruct the scene, using the default software settings.
4.1.3. Evaluation Metrics
For the benchmark data set, we adopted the automated benchmarking tool provided by [28] to compute the two metrics, error and completeness, which, respectively, quantify how close the recovered model is to the ground truth and the coverage in the benchmark. Specifically, the error statistics evaluate the threshold x that the given percentage of the reconstructed points have distance to the ground truth model less than. For example, the “error 90% (m)” gives the distance threshold x for which of the points in the reconstructed point cloud were closer to the ground truth within x. Similarly, the completeness statistics evaluate the percentage of points in the ground truth model that have distance to the reconstructed model within a defined threshold.
For the self-collected data sets, we adopted the uniform quality evaluation, as mentioned in Section 3.2.3, to measure the accuracy of the reconstruction model. To compare on the same scale, unified normalization was processed for each quality score. To compare the completeness, we transformed the recovered models to the same scale using the Iterative Closest Point (ICP) method and divided them into voxels of equal size. Then. the voxel occupancy percentage was calculated, which represented the completeness. Specifically, we defined different occupancy scales, according to the number of points in one voxel, to avoid the interference of discrete points.
4.1.4. Sample Scale
As mentioned in Section 3, we used the sample radius R to control the number of sample points and the division of voxels for candidate viewpoints. In order to adapt to models with different scales, R is set to the given percentage of the longest axis of the bounding box in practice. Figure 6 shows some examples of the sampling for the self-collected data sets, where the density of sample points directly corresponds to R. It is worth noting that all sample points were evenly distributed on the models, including those in incomplete areas; thus, planning a 3D trajectory that fully scans the entire scene based on sample points is theoretically feasible.
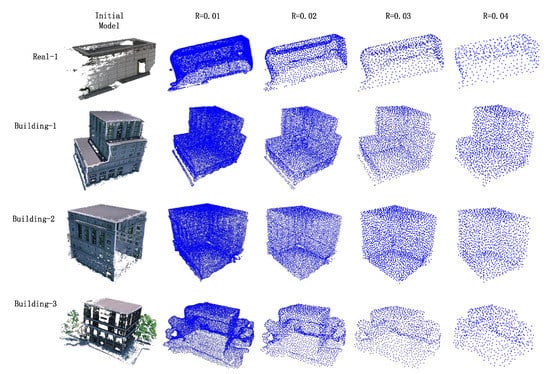
Figure 6.
Visualization of sample point density. In each row, from left to right, the initial coarse model and four sample results using different sample radiuses are shown.
4.2. Method Analysis
We conducted an experimental analysis of the key modules of the proposed framework, including an ablation study.
Coarse reconstruction. We analyzed the efficiency of key image selection. In practice, this plays a role more ual scenes or manual collection. Intuitively, as pre-defined flight paths are usually used in the first flight, the key image selection does not affect the reconstruction quality too much, due to the limitation of coverage; however, the reduced number of pictures will greatly reduce the reconstruction time. As shown in Figure 7, we collected 484 images in the NY-1 scene from an overhead pre-defined grid trajectory and extracted 347 and 228 key images using different overlap constraints for comparison. Figure 7a visualizes the reconstruction cost comparison of the three image sequences, which clearly shows that the computational cost decreases sharply as the number of pictures decreases. Figure 7b exhibits four examples that were discarded because of too few features, which commonly occur at the boundary of the virtual scenes. Figure 7c,d illustrate the distance point clouds corresponding to changes in the completeness, where the vertex-to-vertex distance is performed from the model of original 484 images to the ones of extracted key images.
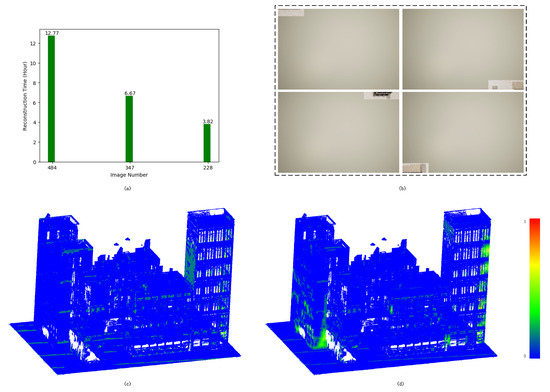
Figure 7.
Visualization of the effect of the key image selection: (a) Reconstruction cost comparison; (b) Examples of discarded images; (c,d) are distance point clouds between the recovered models from the original 484 images and extracted 347 and 228 key images, respectively. Hotter colors encode the larger difference.
Quality evaluation. Quality evaluation of the coarse model plays an important role in our work, directly determining the priority of the corresponding candidate viewpoints. Figure 8 shows a visualization of sample points, colored according to the two types of scores that comprised the quality evaluation (i.e., the completeness score and the smoothness score). As indicated by the co-display of the colored sample points and the initial coarse model in Figure 8a,c, the sample points belonging to the holes on the surface can be displayed more clearly. It can be seen that the scores of these sample points were very low, regardless of the completeness score or the smoothness score.
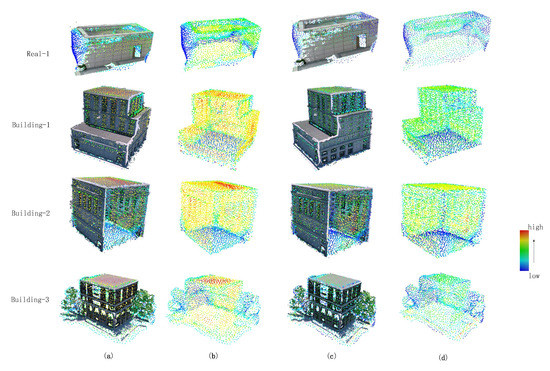
Figure 8.
Visualization of the quality evaluation on the four scenes of self-collected data sets: (a) Initial coarse models and sample points, colored according to the completeness score on the surface; (b) Sample points, colored according to the completeness score; (c) Initial coarse models and sample points, colored according to the smoothness score on the surface; and (d) Sample points, colored according to the smoothness score.
Viewpoint generation. We divided the viewpoints into local viewpoints for low-quality sample points and global viewpoints for complete scanning. The local viewpoints effectively achieved the goal of our work—namely, complete rescanning of the scenes—especially for incomplete areas. We removed the local viewpoints in the viewpoint generation, in order to evaluate its effectiveness.
Table 1 shows that the local viewpoints significantly helped to generate better reconstructions, in terms of the completeness metrics, and more beneficial viewpoints were generated in a similar time. Note that the statistical time cost was only for the viewpoint generation step, and the voxels adjacent to the initial model surface were chosen when computing the completeness.

Table 1.
Effectiveness of the local viewpoints.
Path planning. After the viewpoints were determined, we formulated the problem of path planning into a TSP, which is NP-hard. We chose the ACO algorithm to solve this problem, which is more effective than exhaustive search methods. As shown in Table 2, we randomly selected viewpoints from the flight path of the NY-1 scene, compared the time cost, and evaluated the shortest path length between the ACO algorithm and the Branch and Bound (BnB) method. It can be seen that, when the number of viewpoints increased, the computational cost of the BnB algorithm increased sharply, while the computational cost of the ACO algorithm increased slowly. Both algorithms obtained the same optimal solution. We also compared the ACO algorithm with the Particle Swarm Optimization (PSO) algorithm, as shown in Table 3, from which we can notice that, although the PSO algorithm is much faster when the number of viewpoints was larger, the ACO algorithm was relatively robust. It is worth noting that the comparison was implemented in a single thread and, thus, parallel calculations can be used to improve the calculation speed in practice. In addition, Figure 9 shows the comparison of the convergence performance using 50 viewpoints. It can be seen that the PSO algorithm can converge quickly, but it is also easier to fall into the local optimum.

Table 2.
Comparison of the ACO algorithm and the BnB algorithm.

Table 3.
Comparison of the ACO algorithm and the PSO algorithm.
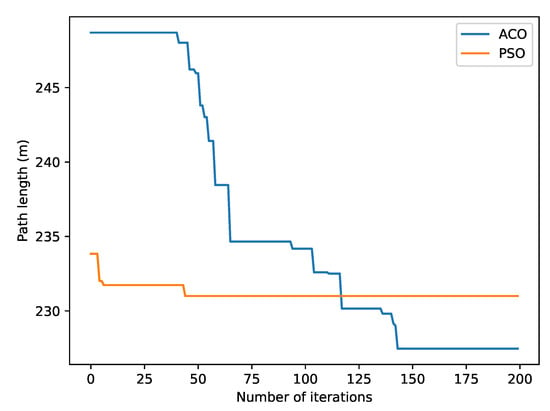
Figure 9.
Comparison of the convergence performance between the ACO algorithm and the PSO algorithm for 50 viewpoints.
4.3. Comparison with a State-of-the-Art Approach
For comparison, we selected a state-of-the-art approach [28]. Note that, as the released files included the planned trajectory and corresponding captured images from [28] in the thrual scenes (i.e., NY-1, UK-1, and GOTH-1), we directly used their aerial images to recover the 3D models in COLMAP. The benchmark also provides proxy models for each scene, which were used to plan our paths. Figure 10 shows the quality evaluation results on these proxy models. It is worth noting that most sample points with lower quality scores were located at the edges of buildings or structures with more geometric details (see, e.g., the top of the tower in the GOTH-1 scene). The reason for this is that the point distributions of these proxy models were relatively uniform and there were no obvious holes; thus, the smooth score dominated the final quality estimate.
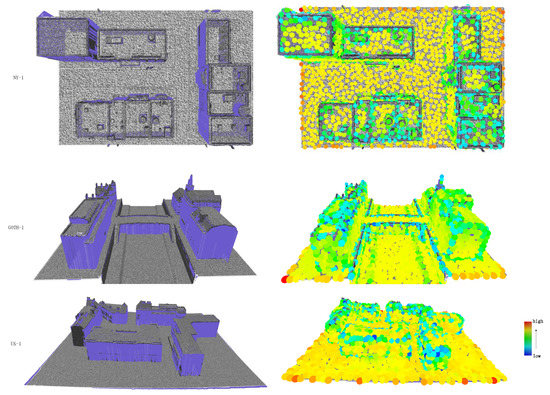
Figure 10.
Visualization of the quality evaluation on the proxy models (left) provided by the benchmark [28].
For each scene, we planned two trajectories using our method, named ‘low’ and ‘high’, with a different number of captured aerial photos, while the scale was controlled by adjusting the sample radius R, as mentioned above. In order to simulate real conditions, we defined the flight path length to be no more than 4800 m (i.e., the UAV will fly at 4 m/s for 20 min).
Table 4 provides the quantitative evaluation of the final reconstruction. For each scene, we also simulated the grid acquisition path of the commercial flight software. It is worth noting that the number of images refers to the final reconstruction, and the coarse models were all acquired from the released file of the benchmark [28]. Compared to [28], our approach achieved comparable reconstruction results, in terms of both error and completeness statistics, with fewer images. More importantly, as shown in Figure 11, the total time cost of our approach for scene reconstruction was significantly less than [28].

Table 4.
Quantitative comparison to the state-of-the-art [28] and the pre-defined grid path.
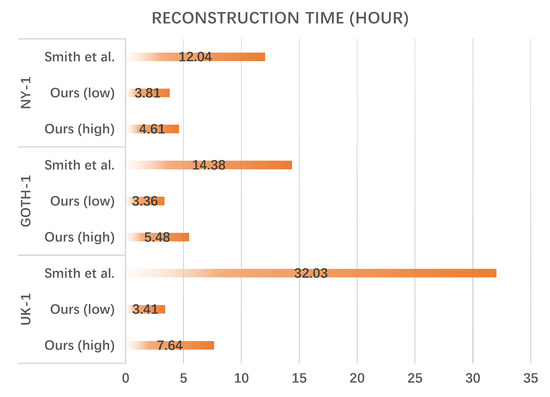
Figure 11.
Reconstruction cost comparison between our method and the state-of-the-art [28] on the thrual scenes from the benchmark [28].
Table 5 records the running times of our approach, corresponding to the ‘high’ trajectories. Note that the total path planning process for the three scenes could be finished within one minute, demonstrating the efficiency of the sampling-based method.

Table 5.
Running time cost of our path planning method on the benchmark [28].
Table 6 summarizes the comparison of the average angle change of the viewpoints along the flight path of our proposed approach and the state-of-the-art method [28]. From the table, we can observe that our proposed approach achieved smaller angle switching, which means that the flight path will be smoother. Note that the roll was zero for each viewpoint.

Table 6.
Comparison of the average angle changes of the final flight path planned by our method and the state-of-the-art [28] on the benchmark.
Figure 12 visualizes the final reconstruction comparison of the NY-1 scene, including the entire point clouds and zoomed-in views of detailed regions. Column (a) visualizes the recovered point cloud from the captured 433 images using the released trajectory of [28]. We can observe that some convex structures and easily occluded areas were incomplete in their model (see, e.g., the towers on the roof and the wall under the stairs). As shown in columns (b) and (c), by emphasizing non-smooth area scanning, our method was able to fully rescan these regions and make the reconstructions more complete, even with fewer images captured and sparser points recovered.
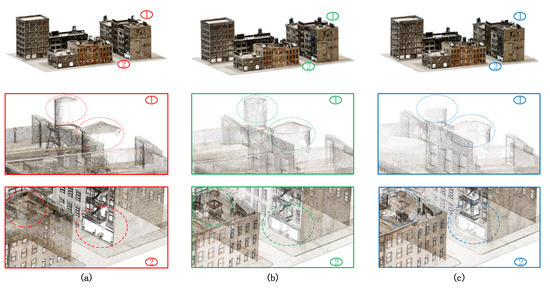
Figure 12.
Qualitative comparison with the state-of-the-art [28] on the virtual scene NY-1: (a) Reconstruction of the 433 captured images using the released trajectory of [28]; (b) Reconstruction of our planned trajectory using 247 images; and (c) Reconstruction of our planned trajectory using 204 images. The top row shows the final reconstructions and the bottom two rows show zoomed-in views.
Figure 13 shows the comparison of reconstructed meshes, in addition to the point clouds, of the GOTH-1 scene. The bottom row shows zoomed-in views of the regions near the clock tower which contain many convex structures. It is worth noting that even when using less than half of the images of [28], our reconstruction contained more visual details.

Figure 13.
Comparison between the state-of-the-art approach [28] (a,b) and our method (c,d) on the virtual scene GOTH-1: (a,b) are the recovered point and mesh models of [28] using 588 images, respectively; and (c,d) are corresponding reconstructions of our method using 291 captured images from the ‘high’ trajectory. The bottom row shows zoomed-in comparisons on a detailed region of the clock tower.
Figure 14 shows that our method could achieve reconstruction results similar to the state-of-the-art in the large virtual scene UK-1, while the number of pictures required was much smaller.
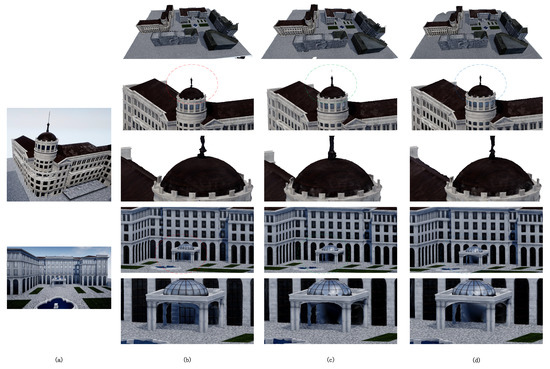
Figure 14.
Comparison between the state-of-the-art approach [28] (b) and our method (c,d) on the virtual scene UK-1: (a) Corresponding aerial photos of the scene; (b) Mesh model recovered by the state-of-the-art [28] using 923 images; (c) Reconstructed mesh model of our method using 362 captured images from the ‘high’ trajectory; and (d) Recovered mesh model of our method using 203 captured images from the ‘low’ trajectory. The zoomed-in comparison shows that the final reconstruction quality of our ‘high’ trajectory and the state-of-the-art was very close, but their method required more than twice as many pictures as ours.
4.4. Comparison with the Pre-Defined Flight Paths
To verify our method, we compared the reconstructed results using our method to the pre-defined flight paths. Virtual and real urban scenes (see Figure 5) were selected for the experiment.
Table 7 shows a comparison of the number of captured pictures, the number of points in the reconstructed models, the proportion of sampling points with a quality score of more than 0.5, the number of voxels with equal size, and the proportion of voxels with points more than a given amount using pre-defined flight paths (i.e., circular, grid, and zigzag) and our planned paths. Our approach achieved comparable reconstruction results, in terms of both quality and completeness.

Table 7.
Quantitative comparison to pre-defined flight paths. refers to the quality score (see Equation (5)).
Figure 15 further visualizes the differences between the reconstructed point clouds, which indicates that our method can effectively refine local details.
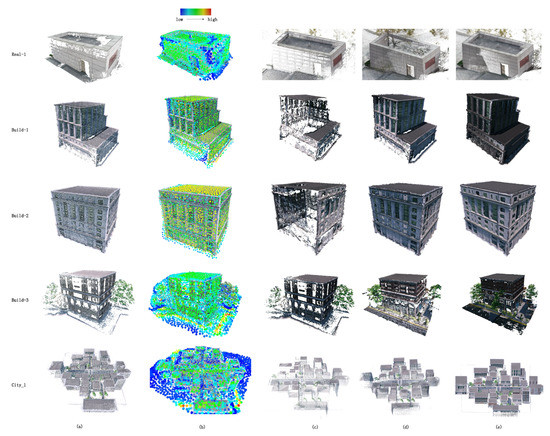
Figure 15.
Visual comparison between reconstruction results on the self-collected data sets, based on pre-defined flight paths and those of our method. The left two columns are (a) the initial coarse models using key images from the grid paths; and (b) the corresponding quality evaluation of sample points; (c,d) are the reconstruction results using zigzag and circular paths, respectively; and (e) shows the recovered models using our planned trajectories.
5. Conclusions
In this paper, we addressed the 3D path planning problem for the high-quality aerial 3D reconstruction of urban scenes. We proposed a novel viewpoint generation method, based on a prior coarse model reconstructed from an initial flight path, which restricts the planned flight space within a limited distance while selecting significant viewpoints to fully cover the entire scene, especially the incomplete areas. By integrating surface sampling of the coarse model and cell decomposition of the view space together, our method can aid the reconstruction in adapting to urban scenes with various spatial scales, thus recovering models with varying degrees of refinement. Extensive experiments on five self-collected scenes and thrual scenes from the benchmark [28] demonstrated that our approach can achieve comparable reconstruction quality while largely reducing the number of aerial photos to be collected. In the future, we hope to integrate other automatic and rapid coarse modeling approaches (e.g., dense SLAM systems), in order to further reduce the computational budget of the coarse reconstruction.
Author Contributions
Conceptualization, Z.Z.; methodology, F.Y.; software, E.X. and F.Y.; validation, E.X. and F.Y.; formal analysis, F.Y. and Z.L.; investigation, E.X. and F.Y.; resources, Z.Z.; data curation, F.Y.; writing—original draft preparation, F.Y.; writing—review and editing, Z.L. and Z.Z.; visualization, F.Y. and Z.L.; supervision, Z.L. and Z.Z.; project administration, Z.Z.; funding acquisition, Z.Z. All authors have read and agreed to the published version of the manuscript.
Funding
This research was funded by National Key Research and Development Program of China (2018YFB2100601), and National Natural Science Foundation of China (61872024, 61702482).
Conflicts of Interest
The authors declare no conflict of interest.
References
- Boonpook, W.; Tan, Y.; Liu, H.; Zhao, B.; He, L. UAV-BASED 3D Urban Environment Monitoring. ISPRS Ann. Photogramm. Remote Sens. Spat. Inf. Sci. 2018, 37–43. [Google Scholar] [CrossRef]
- Barmpounakis, E.N.; Vlahogianni, E.I.; Golias, J.C. Unmanned Aerial Aircraft Systems for transportation engineering: Current practice and future challenges. Int. J. Transp. Sci. Technol. 2016, 5, 111–122. [Google Scholar] [CrossRef]
- Zhang, C.; Kovacs, J.M. The application of small unmanned aerial systems for precision agriculture: A review. Precis. Agric. 2012, 13, 693–712. [Google Scholar] [CrossRef]
- Nikolic, J.; Burri, M.; Rehder, J.; Leutenegger, S.; Huerzeler, C.; Siegwart, R. A UAV system for inspection of industrial facilities. In Proceedings of the 2013 IEEE Aerospace Conference, Big Sky, MT, USA, 2–9 March 2013; pp. 1–8. [Google Scholar]
- Majdik, A.; Till, C.; Scaramuzza, D. The Zurich urban micro aerial vehicle dataset. Int. J. Robot. Res. 2017, 36, 269–273. [Google Scholar] [CrossRef]
- Vu, H.; Labatut, P.; Pons, J.; Keriven, R. High Accuracy and Visibility-Consistent Dense Multiview Stereo. IEEE Trans. Pattern Anal. Mach. Intell. 2012, 34, 889–901. [Google Scholar] [CrossRef] [PubMed]
- Garcia-Dorado, I.; Demir, I.; Aliaga, D.G. Automatic urban modeling using volumetric reconstruction with surface graph cuts. Comput. Graph. 2013, 37, 896–910. [Google Scholar] [CrossRef]
- Li, M.; Nan, L.; Smith, N.; Wonka, P. Reconstructing building mass models from UAV images. Comput. Graph. 2016, 54, 84–93. [Google Scholar] [CrossRef]
- Wu, M.; Popescu, V. Efficient VR and AR Navigation Through Multiperspective Occlusion Management. IEEE Trans. Vis. Comput. Graph. 2018, 24, 3069–3080. [Google Scholar] [CrossRef] [PubMed]
- Seitz, S.M.; Curless, B.; Diebel, J.; Scharstein, D.; Szeliski, R. A Comparison and Evaluation of Multi-View Stereo Reconstruction Algorithms. In Proceedings of the 2016 IEEE Computer Society Conference on Computer Vision and Pattern Recognition, New York, NY, USA, 17–22 June 2006; Volume 1, pp. 519–528. [Google Scholar]
- Mancini, F.; Dubbini, M.; Gattelli, M.; Stecchi, F.; Fabbri, S.; Gabbianelli, G. Using Unmanned Aerial Vehicles (UAV) for High-Resolution Reconstruction of Topography: The Structure from Motion Approach on Coastal Environments. Remote Sens. 2013, 5, 6880–6898. [Google Scholar] [CrossRef]
- Schönberger, J.L.; Zheng, E.; Frahm, J.M.; Pollefeys, M. Pixelwise View Selection for Unstructured Multi-View Stereo. In Computer Vision—ECCV 2016; Leibe, B., Matas, J., Sebe, N., Welling, M., Eds.; Springer International Publishing: Cham, Switzerland, 2016; pp. 501–518. [Google Scholar]
- Schönberger, J.L.; Zheng, E.; Pollefeys, M.; Frahm, J.M. Pixelwise View Selection for Unstructured Multi-View Stereo. In Proceedings of the European Conference on Computer Vision (ECCV), Amsterdam, The Netherlands, 11–14 October 2016. [Google Scholar]
- Roberts, M.; Shah, S.; Dey, D.; Truong, A.; Sinha, S.N.; Kapoor, A.; Hanrahan, P.; Joshi, N. Submodular Trajectory Optimization for Aerial 3D Scanning. In Proceedings of the IEEE International Conference on Computer Vision, Venice, Italy, 22–29 October 2017; pp. 5334–5343. [Google Scholar]
- Hepp, B.; Nießner, M.; Hilliges, O. Plan3D: Viewpoint and Trajectory Optimization for Aerial Multi-View Stereo Reconstruction. ACM Trans. Graph. 2018, 38, 1–7. [Google Scholar] [CrossRef]
- Schönberger, J.L.; Frahm, J.M. Structure-from-Motion Revisited. In Proceedings of the 2016 IEEE Conference on Computer Vision and Pattern Recognition (CVPR), Las Vegas, NV, USA, 27–30 June 2016. [Google Scholar]
- Xu, K.; Huang, H.; Shi, Y.; Li, H.; Long, P.; Caichen, J.; Sun, W.; Chen, B. Autoscanning for Coupled Scene Reconstruction and Proactive Object Analysis. Acm Trans. Graph. 2015, 34, 177:1–177:14. [Google Scholar] [CrossRef]
- Wu, S.; Sun, W.; Long, P.; Huang, H.; Cohen-Or, D.; Gong, M.; Deussen, O.; Chen, B. Quality-Driven Poisson-Guided Autoscanning. ACM Trans. Graph. 2014, 33. [Google Scholar] [CrossRef]
- Fernández-Hernandez, J.; González-Aguilera, D.; Rodríguez-Gonzálvez, P.; Mancera-Taboada, J. Image-Based Modelling from Unmanned Aerial Vehicle (UAV) Photogrammetry: An Effective, Low-Cost Tool for Archaeological Applications. Archaeometry 2015, 57, 128–145. [Google Scholar] [CrossRef]
- Mohammed, F.; Idries, A.; Mohamed, N.; Al-Jaroodi, J.; Jawhar, I. UAVs for smart cities: Opportunities and challenges. In Proceedings of the 2014 International Conference on Unmanned Aircraft Systems (ICUAS), Orlando, FL, USA, 27–30 May 2014; pp. 267–273. [Google Scholar]
- Hartley, R.I.; Zisserman, A. Multiple View Geometry in Computer Vision, 2nd ed.; Cambridge University Press: Cambridge, UK, 2004; ISBN 0521540518. [Google Scholar]
- Cadena, C.; Carlone, L.; Carrillo, H.; Latif, Y.; Scaramuzza, D.; Neira, J.; Reid, I.; Leonard, J.J. Past, Present, and Future of Simultaneous Localization and Mapping: Toward the Robust-Perception Age. IEEE Trans. Robot. 2016, 32, 1309–1332. [Google Scholar] [CrossRef]
- Suzuki, T.; Amano, Y.; Hashizume, T.; Shinji, S. 3D Terrain Reconstruction by Small Unmanned Aerial Vehicle Using SIFT-Based Monocular SLAM. J. Robot. Mechatron. 2011, 23, 292–301. [Google Scholar] [CrossRef]
- Teixeira, L.; Chli, M. Real-time local 3D reconstruction for aerial inspection using superpixel expansion. In Proceedings of the 2017 IEEE International Conference on Robotics and Automation (ICRA), Singapore, 29 May–3 June 2017; pp. 4560–4567. [Google Scholar] [CrossRef]
- Kriegel, S.; Rink, C.; Bodenmüller, T.; Narr, A.; Hirzinger, G. Next-Best-Scan Planning for Autonomous 3D Modeling. In Proceedings of the 2012 IEEE/RSJ International Conference on Intelligent Robots and Systems, Vilamoura-Algarve, Portugal, 7–12 October 2012. [Google Scholar]
- Newcombe, R.A.; Izadi, S.; Hilliges, O.; Molyneaux, D.; Kim, D.; Davison, A.J.; Kohi, P.; Shotton, J.; Hodges, S.; Fitzgibbon, A. KinectFusion: Real-time dense surface mapping and tracking. In Proceedings of the 2011 10th IEEE International Symposium on Mixed and Augmented Reality, Basel, Switzerland, 26–29 October 2011; pp. 127–136. [Google Scholar]
- Peng, C.; Isler, V. Adaptive View Planning for Aerial 3D Reconstruction. In Proceedings of the 2019 International Conference on Robotics and Automation (ICRA), Montreal, QC, Canada, 20–24 May 2019; pp. 2981–2987. [Google Scholar]
- Smith, N.; Moehrle, N.; Goesele, M.; Heidrich, W. Aerial Path Planning for Urban Scene Reconstruction: A Continuous Optimization Method and Benchmark. ACM Trans. Graph. 2018, 37. [Google Scholar] [CrossRef]
- Qu, Y.; Huang, J.; Zhang, X. Rapid 3D Reconstruction for Image Sequence Acquired from UAV Camera. Sensors 2018, 18, 225. [Google Scholar]
- Rublee, E.; Rabaud, V.; Konolige, K.; Bradski, G. ORB: An efficient alternative to SIFT or SURF. In Proceedings of the 2011 International Conference on Computer Vision, Barcelona, Spain, 6–13 November 2011; pp. 2564–2571. [Google Scholar]
- Mur-Artal, R.; Tardós, J.D. ORB-SLAM2: An Open-Source SLAM System for Monocular, Stereo, and RGB-D Cameras. IEEE Trans. Robot. 2017, 33, 1255–1262. [Google Scholar] [CrossRef]
- Corsini, M.; Cignoni, P.; Scopigno, R. Efficient and Flexible Sampling with Blue Noise Properties of Triangular Meshes. IEEE Trans. Vis. Comput. Graph. 2012, 18, 914–924. [Google Scholar] [CrossRef]
- Kazhdan, M.; Bolitho, M.; Hoppe, H. Poisson Surface Reconstruction. In Proceedings of the Fourth Eurographics Symposium on Geometry Processing (SGP ’06), Cagliari, Italy, 26–28 June 2006; Eurographics Association: Goslar, Germany, 2006; pp. 61–70. [Google Scholar]
- Dorigo, M.; Gambardella, L.M. Ant colonies for the travelling salesman problem—ScienceDirect. Biosystems 1997, 43, 73–81. [Google Scholar] [CrossRef]
- Stützle, T.; Dorigo, M. ACO Algorithms for the Traveling Salesman Problem. Evol. Algorithms Eng. Comput. Sci. 1999, 4, 163–183. [Google Scholar]
Publisher’s Note: MDPI stays neutral with regard to jurisdictional claims in published maps and institutional affiliations. |
© 2021 by the authors. Licensee MDPI, Basel, Switzerland. This article is an open access article distributed under the terms and conditions of the Creative Commons Attribution (CC BY) license (http://creativecommons.org/licenses/by/4.0/).