Abstract
The use of unmanned aircraft vehicles (UAVs) in volcanological contexts is a key challenge in studying volcanoes and improving efficiency in the monitoring of volcanic activity. The coupling of ground and satellite measurements has been reinforced at an intermediate scale thanks to UAV measurements. Along with carrying out visible and infrared measurements, UAVs can conduct geophysical measurements for more in-depth studies. Magnetic field measurements are a powerful tool in volcanic contexts for (i) mapping structural contacts between formations of different ages or type, and (ii) imaging deep thermal anomalies and intrusive systems. Here, we focus on magnetic sensors, which are becoming operational, and in particular on a scalar system recently implemented on a light drone that can be deployed quickly and efficiently in the field. This paper presents several flight test results in order to discuss any artifacts of the UAV or environmental conditions in the magnetic measurements. The results of the comparison between simultaneous UAV and ground surveys are presented. We demonstrate that low altitude measurements are particularly relevant to well-imaged magnetic anomalies and their variation through time in a volcanic context. Some potential uses for this technology and associated applications are also discussed in the fields of exploring and monitoring active volcanoes, for the 4D imaging of volcanoes.
1. Introduction
Aeromagnetic surveying techniques using UAV have been the focus of intense interest over the last few years. Airborne geophysical measurements can be carried out using this technology and can perform fast and safer prospecting in sensitive and dangerous contexts prone to volcanic activity. A review of UAVs used for geohazard response is provided by [1] and more specifically for volcanological applications by [2]. Among the issues addressed by the UAVs is the fundamental need to image the structure of a volcano in detail by mapping pre-existing structures, as well as characterizing the active ones and their manifestations at various scales (e.g., intrusions at depth, lava flows, fissures and domes, collapse structures, and associated deformation; see [2] and references therein). Another important issue for volcano monitoring is mapping the spatial distribution of thermal expressions in order to quantify heat flux associated with volcanic activity at the surface [3]. The common goal for all these applications is to quantify the spatio-temporal evolution of the volcano-related structures, especially through repeated surveys to monitor volcanoes. In this context, great benefits can be derived from combining the low payload of miniaturized geophysical instruments with the small programmable capacity of UAVs.
In this study, we focus on UAV magnetic field measurements that can span both issues. Firstly, magnetic field measurements are particularly relevant in volcanic contexts to map structural contacts between formations of different ages or type [4]. Secondly, the strong influence of temperature on the magnetic field measurements and associated local magnetic anomalies provide more in-depth information on fluid transfer, and hydrothermal and magma dynamics [5]. Lastly, the recent miniaturization of magnetic sensors now opens the door to consistent and repeated magnetic surveys using UAVs in order to efficiently detect any temporal changes in magnetic signals due to volcanic activity [6].
Here, we have selected one total field magnetometer, the QuSpin Total Field (QTFM), which is particularly relevant for highly magnetized volcanic environments, being highly compact and sensitive, as well as easy and fast to deploy in the field. We present a series of validation tests as well as comparisons with ground measurements whose purpose were to highlight the effects of the drone and environmental conditions on the UAV measurements, and to quantify the sensitivity and resolution of the selected sensor in a volcanic context.
2. Geological Background and Choice of Field Sites
Due to its accessibility, the monogenetic volcanic field of the Chaîne des Puys (French Massif Central) is an excellent experimental site to test and develop emerging approaches such as UAV geophysical equipment. For our purposes, two test sites were selected based on their strong but highly stable magnetization signatures (Figure 1). The first one (Figure 1a) is well known for its magnetic signature since it is where the Laschamps terrestrial magnetic field excursion was discovered [7]. This is particularly interesting because of the high amplitude reverse magnetizations found within basaltic flows emplaced during the normal Brunhes period. The second one, the Petit Puy de Dôme volcano (Figure 1c) has been selected in order to address longer-term scientific issues relating to active volcanoes. This Strombolian trachy-andesitic edifice is located on the northeastern flank of the Puy de Dôme volcano (Figure 1a). Although its age is not known precisely [8], lava flows were emplaced during the normal Brunhes period, between 42,000 and 35,000 years ago [9,10]. The summit of the volcanic complex Creux de la Berte-Petit Puy de Dôme-Nid de la Poule, has been clearly affected by post-eruptive tectonics, forming a graben zone oriented N10°-N20° (e.g., [11]), as shown by the high-resolution LiDAR (Figure 1b). This site is particularly interesting since high amplitude and long wavelength magnetic anomalies are observed along these zones of deformation [12].
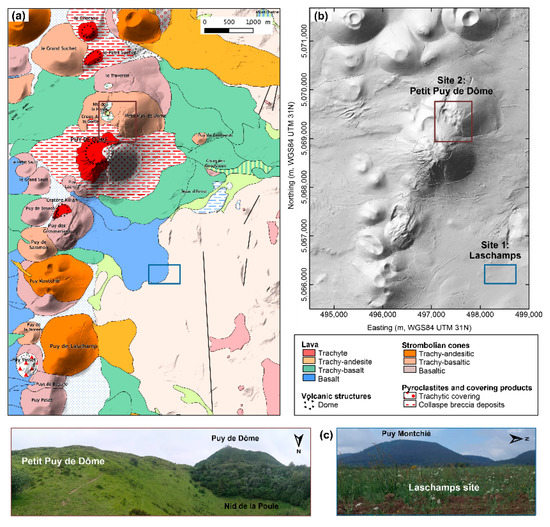
Figure 1.
Location of the two field sites in the center-east part of the Chaîne des Puys (French Massif Central) on (a) the volcanological map [13] and (b) the DTM generated from the Lidar survey performed in 2015 (precision of 0.5 m). (c) Field views of both test sites.
3. Datasets: Ground versus UAV Magnetometer
Volcanic fields are commonly associated with very high amplitude and long wavelength magnetic field values usually reaching several thousands of nanoTeslas (nT) in magnitude. For volcano monitoring, repeated measurements with even higher resolution measurements are required. This is now possible thanks to various technical developments involving UAV magnetic sensors that enable more consistent and rapid surveys compared with normal ground surveys [6].
3.1. UAV Magnetic Measurements
UAV magnetic surveys are progressively becoming common practice for two types of sensors measuring either the total magnetic intensity (scalar magnetometers, optically pumped alkali vapor, proton precession) or the three components of the magnetic field (fluxgate magnetometers). Numerous studies have been carried out to compare the two, with a focus on how to achieve high precision data at low altitude (e.g., [14,15,16]). Briefly, fluxgate magnetometers need a scalar calibration to accurately compute the sensitivity, non-orthogonality, and offset errors of the three components of the magnetic field in order to compensate for the remanent and induced magnetization of the UAV after the flight. Conversely, absolute scalar magnetometers need to integrate an active compensation system or simultaneous measurements of the total magnetic intensity using vector magnetometers in order to correct the disturbances generated by the UAVs carrier [14]. However, recent UAVs are mostly constructed from plastic and/or carbon, which have very low magnetic signatures [2].
Here, we present a detailed analysis of a high-sensitivity and high-performance scalar magnetometer, the QuSpin Total-Field Magnetometer (QTFM). The technology is based on an optically pumped rubidium sensor that gives high-accuracy magnetic field measurements with low intrinsic noise. The well-defined resonance frequency of the atoms is directly proportional to the magnitude of the measured field, which is therefore obtained directly by multiplying this frequency by a known scaling factor. An index of quality is also provided for each magnetic measurement, corresponding to the signal strength that makes it possible to check the quality of the measurements. Data with an index higher than 20 are considered to be reliable. More specifically, it is designed to measure the total magnetic field of the Earth, with a dynamic range from 103 to 105 nT, a field sensitivity lower than 1 pT/√Hz in the 0.1–100 Hz band, and a magnetic effect due to the heading error of less than 3 nT without any calibration required. In terms of temporal resolution, it can therefore resolve very minute field changes. The final assembly (Figure 2a) is composed of the sensor head, the Electronic Control Unit (ECU), an Advanced Communication Board (ACB) and we have added a GPS receiver (1s acquisition), leading to an overall weight of less than 200 g. It enables us to embed the whole system on a light, compact UAV, such as the DJI® Mavic Pro2 we used, which can be quickly and efficiently deployed in the field (Figure 2a). In addition, the low power supply needed for the sensor enables it to draw directly on the UAV’s battery without adversely affecting the flight time.
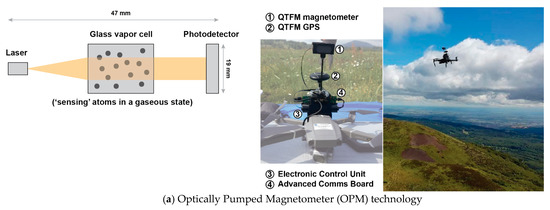
Figure 2.
(a) QuSpin Total Field (QTFM) magnetic sensor (mounted on a DJI Mavic Pro2) and (b) GSM 19 (GEM system) ground magnetometer, both deployed in the field (petit Puy de Dôme volcano). Simplified diagrams of the Optically Pumped Magnetometer (OPM, © QUSPIN) and the Overhauser technology are shown above and below the photos.
Due to the very small size of the Mavic Pro2, the carrier should generate even less magnetic noise compared to higher payload drones. Accordingly, we have chosen to install the sensor on top of the drone, where the electromagnetic effects due to the rotors do not significantly affect the field of measurements, as we demonstrate below.
3.2. Ground Magnetic Measurements
The UAV measurements were compared with high resolution ground magnetic ones, carried out using the same portable Overhauser proton-precession magnetometer (GSM19, GEM System) with an instrumental accuracy on the magnetic measurements of 0.2 nT. Measurements were performed at a base station and in walking mode (0.5 s sampling interval), depending on the field site and the tests involved. Here, too, the GPS position was recorded simultaneously while surveying. We used part of the extensive magnetic ground survey performed in 2014 at the scale of the Chaîne des Puys [12,17] with a sensor mounted on a 2.5 m surveying pole. Additional measurements were also performed in 2020, with a sensor mounted on a 1.8 m surveying pole, simultaneously with the UAV surveys. This was to help quantify the resolution of the UAV measurements specifically in a volcanic environment (signal/noise ratio, influence of the flight altitude, and directional and environmental effects).
4. Results of the Magnetic Surveys and Tests
As described above, two sites were selected with two ancillary goals: 1) the site of Laschamps to quantify the resolution and sensitivity of the sensor, and 2) the petit Puy de Dôme volcano to provide a direct comparison between UAV and ground measurements on map. In the following, we use ‘QTFM’ and ‘GSM19′ for the UAV and ground sensors, respectively.
4.1. QTFM Resolution and Sensitivity (Laschamps Site)
A comparison between various sensors was carried out by [18] and we present here some additional tests using the QTFM for volcano issues. Different tests were performed, as shown in Figure 3a. The first test was designed to quantify the carrier, electronic, and rotor effects on the magnetic measurements. The initialization of the QTFM before the UAV started is marked by a quite constant value of around 40,000 nT ± 4 nT (Figure 3b). This averaged value is the same for all flights before take-off (Figure 3c). When the rotors start up, they create a spike and a signal depletion for a few tens of seconds before returning to the initial mean value of about 40,000 nT. This confirms that the sensor has a highly stable background value on the ground and that the rotors have a small one-off effect that stabilizes in a couple of seconds. Additional tests were carried out by accelerating the speed of the motors progressively while the drone was grounded. Measurement disturbances due to electromagnetism effects are related to variations in the power transmitted to the rotors. Before stabilization, these measurements are associated with an index quality of less than 30 and can therefore easily be ignored and removed from the final dataset. We show below that such effects are reduced to such a degree in flight that they are not noticeable.
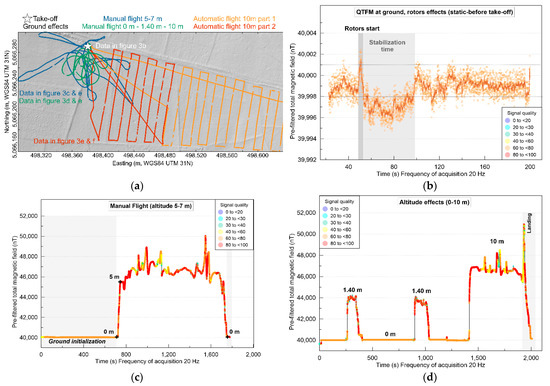
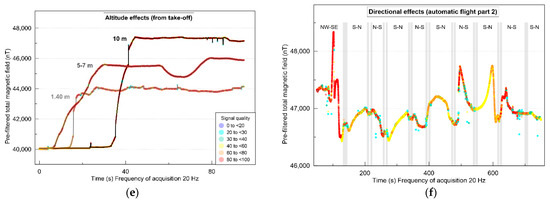
Figure 3.
(a) Locations of the different test flights. (b) Static ground recording before, during, and after the rotors start. (c) Example of a recording over a complete manual flight. (d) Example of a recording over several manual flights at various altitudes, with intervening landings and take-offs. (e) Altitude effects from various flights for comparison (static flight at 1.40 m, manual flight at 5–7 m and automatic flight at 10 m). (f) Directional effects along the second part of the automatic flight (gyration points in grey area).
Secondly, we compared the measurements recorded simultaneously by the QTFM and the GSM19 in static mode at the same altitude, i.e., at 1.40 m above the ground. An averaged difference of less than 300 nT is found between the two sensors (QTFM mean value = 43,729 nT - GSM19 ground mean value = 43,445 nT, STD of the residuals ~ 150 nT). This difference is correlated with a high STD for the QTFM value, and this feature is probably related to the manual control of the altitude.
Several flights were performed in various modes (manual and automatic) and at various altitudes in order to test the effects of speed and altitude on the magnetic measurements (Figure 3c). Manual flights were performed at an altitude of about 5 m above the ground and the automatic ones at 10 above the ground (the lowest at which to fly automatically). Since it is very difficult to maintain a steady altitude manually, manual flights are considered to fluctuate between 5 and 7 m in altitude. We noted a marked effect during large and rapid variations in altitude (take-off, landing; Figure 3c and d). The effects of altitude can also be tested by comparing the field values measured on the ground with the measurements before take-off, when the drone has reached various altitudes above a same point, and on landing after the flight. The magnetic field measurements increase consistently but not linearly with increasing altitude (1.4, 5–7, and 10 m; Figure 3e) and become very stable once the target altitude is reached. We also note that the signal quality remains relatively high during the overall flight. It is slightly altered by sudden variations in altitude due to manual handling of the altitude for manual flights, and to gusts of wind. However, the measurements restabilize very quickly after each perturbation.
A clover leaf pattern flight was also performed to test the yaw, roll and pitch effects on the measurements at various altitudes (Figure 3d). No significant effects were found using these quadcopters. We did find very small directional effects of less than a few tens of nT, as shown along the second part of the automatic flight performed at 10 m in altitude (Figure 3f).
Lastly, in order to quantify the stability of the QTFM and the directional effects, we estimated the difference in values at all crossing points for each flight. The statistics are presented in Table 1 and show a higher shift in values at crossing points for manual flights. This is not surprising since the altitude is manually controlled and varies between 5 and 7 m. An important point is the highly consistent overlap between the two automatic flights, from the end of the first part to the beginning of the second one (3.6 nT).

Table 1.
Statistics at crossing points for each flight.
4.2. Mapping Comparison (Petit Puy de Dôme Site)
Looking in greater detail, we now focus on the petit Puy de Dôme volcano (Figure 1), which is already covered by a high-resolution ground magnetic survey [12]. Additional ground measurements were performed simultaneously with the UAV surveys, all of them using the GSM19 sensor. The main goal in this study was to compare the UAV and ground measurements at the scale of a complex volcanic area. For this validation step, the flights covered three main areas (Figure 4a) where major magnetic anomalies had been revealed by Portal et al. (2016): in the continuation of the northeastern flank of the Puy de Dôme, the petit Puy de Dôme summit, and along the main area of deformation close to the Nid de la Poule crater. Due to flight time limitations, several flights were performed at different points of take-off in automatic mode at an altitude of 10 m above the ground (Figure 4a). After removing all data with a quality index lower than 20, the flights were manually filtered to remove spikes, take-off and landing data. All flights were separately leveled at crossing points. Lastly a spline filter was applied to remove high frequency noise in the data. A similar treatment was applied to the ground measurements by filtering the data based on their signal quality index (SQ) linked to each measurement. As detailed in Portal et al. (2016), the SQ factor limit was fixed to 7. All data were also filtered for spikes and then spline filtered. The “large scale” dataset was acquired at 2.5 m above the ground in 2014, and more locally at 1.80 m above the ground in 2020. Accordingly, the final dataset was compiled at an altitude of 2.5 m above the ground for consistency, and to reduce the effect of shallow noises that appears when measurements are performed closer to the surface. For each dataset, QTFM and GSM19, due to the commonly observed very large amplitude of the magnetic signal in this type of volcanic context (up to several thousands of nT, e.g., Piton de la Fournaise volcano [4]; Kilauea volcano [19]), no corrections were made for the diurnal variation (a few tens of nT; [19]). An overall comparison was performed on the map (Figure 4b). Due to the QTFM acquisition at different altitudes, all datasets were merged using the Oasis Montaj stitching subroutine (Grid Knitting, Geosoft 2013) which is particularly suitable for joining grids that overlap at different altitudes. The suture method was selected for the grid stitching process which also estimates the appropriate static shift to apply to the stitched grid. This method is used to define a line to determine where the grids will be joined using a multi-frequency approach. In more detail, an FFT-based approach is applied to the different grids to automatically remove trends between one grid and another. Secondly, suture paths are defined automatically between each grid since we merge several grids together with multiple suture lines. The differences along these paths are extracted and split using a Fourier transform function into one curve per frequency. For each frequency, a grid is computed on both sides of the suture line to define a proportional correction for each frequency. These corrections are then added up to compute a correction grid which is applied to the initial dataset according to a user-defined weighting [18]. Since the quality of the grids is similar, we use the default weighting that is equal between the grids. The final map (Figure 4b) is then compared to the ground one computed at an altitude of 2.50 m above the ground. At the first order there is very good consistency between the two measurements. The high amplitude and long wavelength positive anomalies observed in the northeastern continuation of the Puy de Dôme volcano (anomaly M2 in Portal et al., 2016) and in the area of Nid de la Poule (anomaly M3 in [12]) are well imaged by the QTFM measurements. These two observations were interpreted as the effect of a large intrusion of a viscous trachytic magma in depth overlain by more mafic bodies. Lower amplitude small wavelength anomalies are also identified in both datasets (anomalies M4a to c).
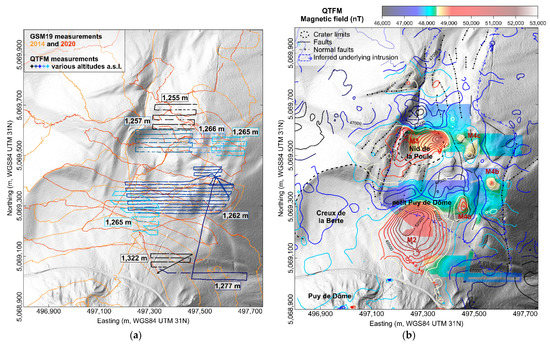
Figure 4.
(a) Location of the magnetic measurements on the scale of the petit Puy de Dôme volcano. (b) QTFM total magnetic field interpolated and gridded at an averaged altitude (grid cell: 2 m). The GSM19 total magnetic field is superimposed as isocontours (500 nT spacing, same grid cell size and color scale).
A more detailed comparison between the QTFM and GSM19 measurements is provided along a south to north profile crossing the maxima of anomalies M2 and M3 (Figure 5). The shift between both datasets is related to the difference in altitude of the surveys, as already inferred from the tests on the scale of the Laschamps site. Since magnetic data are difficult to extend downwards and drape on the topography at a lower altitude, the ground measurements were extended upwards at different altitudes depending on the elevation of the area. Therefore, the averaged altitude at which the QTFM measurements are taken are considered to be gridded. For the southern part of the profile, in the continuation of the northeastern flank of the Puy de Dôme volcano (anomaly M2), QTFM measurements are thought to be knitted at an averaged altitude of around 1320 m. In the area of Nid de la Poule (anomaly M3), a lower altitude is expected, of around 1250 m. A high consistency is demonstrated between the two datasets in terms of both amplitude and wavelength of the considered anomalies.
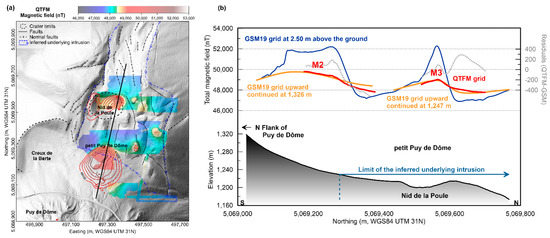
Figure 5.
(a,b) Comparison of QTFM and GSM19 magnetic measurements along the south to north profile (black line on the left-hand diagram) crossing the two main positive anomalies. Residuals are shown by a grey dotted line.
5. Discussion and Conclusions for Potential Applications
The tests carried out to validate the QTFM sensor onboard a light drone led us to several conclusions:
- UAV carrier has a small but constant electromagnetic effect on the measurements.
- Environmental effects, such as wind, does not seem to clearly affect the measurements. Gusts of wind (which generate variations in the rotor speed) can create noise and high amplitudes, but they are not critical in terms of the data homogeneity. According to the tests carried out, it mainly affects the quality index, as shown by spikes on the recording.
The directional effects are very low compared with the amplitude of the measured signal, but automatic flights should be favored in order to limit the effects of altitude variations.
The maps comparison shows a very good level of consistency between the ground and drone measurements, with a maximum difference of the total magnetic field of 300 nT between the ground and UAV surveys. This is very low compared to the large amplitudes of the field variations.
Accordingly, this study confirms the high sensitivity of the QTFM sensor, in particular for achieving the high amplitudes of the magnetic signal commonly recorded in volcanic contexts, without any calibration procedure before or after the flight. The main advantage is therefore to provide near real time interpretation of the data.
Since merging several surveys performed at different altitudes remains due to small variations in altitude during the flights, it is necessary to use a terrain follow up algorithm. The main goals are now to remain at a constant distance from surveyed structures and to provide higher resolution detection and imaging without any detrimental loss of information. This will make it possible to compare ground measurements that have been extended directly upwards with UAV ones at a similar altitude above the topography.
Thanks to the easy, practical and rapid response of the sensor, there are numerous promising applications. Because magnetization is very sensitive to alteration (e.g., [20]) and temperature (e.g., [21]), repeated UAV magnetic surveys will be powerful for imaging and monitoring the thermal state of the volcanic edifice at depth [5]. It will also be suitable for mapping buried hydrothermal alteration (e.g., [22]) and associated faulting. One interesting feature is therefore to envision loading the QTFM with an IR sensor in order to record magnetic and temperature measurements simultaneously at the surface. For instance, this could be very useful for following the evolution of the hydrothermal system of the Kilauea summit caldera since its collapse in 2018 [23], a highly unstable area that is now inaccessible except via UAV measurements.
Author Contributions
Conceptualization, E.R., L.G., P.L.; methodology, L.G., P.L., E.R. and B.C.; investigation and field validation, L.G., P.L., E.R., M.B., T.S., G.B., B.C.; resources and data curation, L.G. and P.L.; writing—original draft preparation, L.G.; writing—review and editing, L.G., P.L., E.R., M.B., T.S., G.B., B.C.; funding acquisition, P.L. and L.G. All authors have read and agreed to the published version of the manuscript.
Funding
This research was funded by CNES (Volcadrone project), by the Laboratory of Excellence ClerVolc (Laboratoire Magmas et Volcans), and by the ‘Actions Incitatives’ program of the Observatoire de Physique du Globe de Clermont. This is Laboratory of Excellence ClerVolc contribution number 460.
Data Availability Statement
The data presented in this study are available on request from the corresponding author.
Acknowledgments
This research was led in the frame of the EUROVOLC project. We are grateful to Jeff Orton and the QuSpin’s staff for their scientific and logistic support, Guillaume Martelet and Raphaël Antoine for fruitful discussions around magnetic sensors, UAV and associated applications. We also warmly acknowledge the Parc Naturel des Volcans d’Auvergne, the Association Dômes Union and the Conseil Départemental du Puy de Dôme for their support during the different field surveys.
Conflicts of Interest
The authors declare no conflict of interest.
References
- Antoine, R.; Lissak, C.; Lopez, T.; Tangy, M.; Gailler, L.; Labazuy, P.; Fauchard, C. Geoscientists in the Sky: Unmanned Aerial Vehicles for Geohazards Response. Surv. Geophys. 2020, 41, 1285–1321. [Google Scholar] [CrossRef]
- James, M.R.; Carr, B.B.; Arcy, F.D.; Diefenbach, A.K.; Dietterich, H.R.; Fornaciai, A.; Lev, E.; Liu, E.J.; Pieri, D.C.; Rodgers, M.; et al. Volcanological Applications of Unoccupied Aircraft Systems (UAS): Developments, Strategies, and Future Challenges. Volcanica 2020, 3, 67114. [Google Scholar] [CrossRef]
- Walter, T.R.; Jousset, P.; Allahbakhshi, M.; Witt, T.; Gudmundsson, M.T.; Hersir, P. Underwater and Drone Based Photogrammetry Reveals Structural Control at Geysir Geothermal Fi Eld in Iceland. J. Volcanol. Geotherm. Res. 2018, 391, 106282. [Google Scholar] [CrossRef]
- Gailler, L.-S.; Lénat, J.-F. Internal Architecture of La Réunion (Indian Ocean) Inferred from Geophysical Data. J. Volcanol. Geotherm. Res. 2012, 221–222, 83–98. [Google Scholar] [CrossRef]
- Gailler, L.; Kauahikaua, J. Monitoring the Cooling of the 1959 Kīlauea Iki Lava Lake Using Surface Magnetic Measurements. Bull. Volcanol. 2017, 79, 1–7. [Google Scholar] [CrossRef]
- Catalán, M.; Martos, Y.M.; Galindo-Zaldívar, J.; Funaki, M. Monitoring the Evolution of Deception Island Volcano from Magnetic Anomaly Data (South Shetland Islands, Antarctica). Glob. Planet. Change 2014, 123, 199–212. [Google Scholar] [CrossRef]
- Bonhommet, N.; Babkine, J. Sur La Présence d’aimantations Inversées Dans La Chaîne Des Puys. Comptes Rendus Hebd. des Séances l’Académies Sci. Série B 1967, 92, 264. [Google Scholar]
- Boivin, P.; Besson, J.-C.; Briot, D.; Camus, G.; de Goër de Herve, A.; Gourgaud, A.; Labazuy, P.; Langlois, E.; de Larouzière, F.-D.; Livet, M.; et al. Volcanologie de La Chaîne Des Puys, 5th ed.; Parc Naturel Régional des Volcans d’Auvergne: Rochefort-Montagne, France, 2009; p. 200. [Google Scholar]
- Plenier, G.; Valet, J.-P.; Guérin, G.; Lefèvre, J.-C.; LeGoff, M.; Carter-Stiglitz, B. Origin and Age of the Directions Recorded during the Laschamp Event in the Chaîne Des Puys (France). Earth Planet. Sci. Lett. 2007, 259, 414–431. [Google Scholar] [CrossRef]
- Guérin, G. La Thermoluminescence des Plagioclases: Méthode de Datation Du Volcanisme: Applications Au Domaine Volcanique Français: Chaîne Des Puys, Mont Dore et Cézallier, Bas Vivarais; Université Pierre et Marie Curie-Paris VI: Paris, France, 1983. [Google Scholar]
- de Vries, B.v.W.; Márquez, A.; Herrera, R.; Bruña, J.L.G.; Llanes, P.; Delcamp, A. Craters of Elevation Revisited: Forced-Folds, Bulging and Uplift of Volcanoes. Bull. Volcanol. 2014, 76, 875. [Google Scholar] [CrossRef]
- Portal, A.; Gailler, L.-S.; Labazuy, P.; Lénat, J.-F. Geophysical Imaging of the Inner Structure of a Lava Dome and Its Environment through Gravimetry and Magnetism. J. Volcanol. Geotherm. Res. 2016, 320, 88–99. [Google Scholar] [CrossRef]
- Boivin, P.; Besson, J.C.; Briot, D.; Deniel, C.; Gourgaud, A.; Labazuy, P.; Langlois, E.; de Larouzière, F.D.; Livet, M.; Merciecca, C.; et al. Volcanologie de La Chaîne des Puys Massif Central Français, Bilingue. Carte 1/25000, 6th ed.; Parc Naturel Régional des Volcans d’Auvergne: Rochefort-Montagne, France, 2017; p. 200. [Google Scholar]
- Gavazzi, B.; Bertrand, L.; Munschy, M.; de Lépinay, J.M.; Diraison, M.; Géraud, Y. On the Use of Aeromagnetism for Geological Interpretation: 1 Comparison of Scalar and Vector Magnetometers for Aeromagnetic Surveys and an Equivalent Source Interpolator for Combining, Gridding, and Transforming Fixed Altitude and Draping Data Sets Journal of Geophysical Research. Solid Earth 2020, 125, e2019JB018870. [Google Scholar] [CrossRef]
- Munschy, M.; Boulanger, D.; Ulrich, P.; Bouiflane, M. Magnetic Mapping for the Detection and Characterization of UXO: Use of Multi-Sensor Fluxgate 3-Axis Magnetometers and Methods of Interpretation. J. Appl. Geophys. 2007, 61, 168–183. [Google Scholar] [CrossRef]
- Olsen, N.; Tøffner-Clausen, L.; Sabaka, T.J.; Brauer, P.; Merayo, J.M.G.; Jørgensen, J.L.; Léger, J.M.; Nielsen, O.V.; Primdahl, F.; Risbo, T. Calibration of the Ørsted Vector Magnetometer Calibration of the Ørsted Vector Magnetometer. Earth Planets Space 2003, 55, 11–18. [Google Scholar] [CrossRef]
- Miallier, D.; Pilleyre, T.; Boivin, P.; Labazuy, P.; Gailler, L.-S.; Rico, J. Grand Sarcoui Volcano (Chaîne Des Puys, Massif Central, France), a Case Study for Monogenetic Trachytic Lava Domes. J. Volcanol. Geotherm. Res. 2017, 345, 125–141. [Google Scholar] [CrossRef]
- Jonhson, A.C.; Sarris, A.; Amza-Prein, M.E. A New Interactive FFT-Based Grid Suturing Technique Applied to Ground GeoPhysical Surveys in Greece. In Proceedings of the Second Balkan Geophysical Congress and Exhibition, Istanbul, Turkey, 5–9 July 1999; p. 3. [Google Scholar]
- Zurek, J.; Williams-Jones, G. The shallow structure of Kīlauea caldera from high-resolution Bouguer gravity and total magnetic anomaly mapping: Insights into progressive magma reservoir growth. JGR 2013, 118, 3742–3752. [Google Scholar] [CrossRef]
- Ade-Hall, J.M.; Palmer, H.C.; Hubbard, T.P. The Magnetic and Opaque Petrological Response of Basalts to Regional Hydrothermal Alteration. Geophys J R Astron Soc 1971, 24, 137–174. [Google Scholar] [CrossRef]
- Hunt, C.P.; Moskowitz, B.M.; Banerjee, S.K. Magnetic Properties of Rocks and Minerals. In Rock Physics & Phase Relations: A Handbook of Physical Constants. AGU Reference Shelf 3; Ahrens, T.J., Ed.; Wiley: Hoboken, NJ, USA, 1995. [Google Scholar]
- Bouligand, C.; Glen, J.M.G.; Blakely, R.J. Distribution of Buried Hydrothermal Alteration Deduced from High-Resolution Magnetic Surveys in Yellowstone National Park. J. Geophys. Res. Solid Earth 2014, 119, 2595–2630. [Google Scholar] [CrossRef]
- Neal, C.A.; Brantley, S.R.; Antolik, L.; Babb, J.L.; Burgess, M.; Calles, K.; Cappos, M.; Chang, J.C.; Conway, S.; Desmither, L.; et al. The 2018 Rift Eruption and Summit Collapse of K ī Lauea Volcano. Science 2019, 363, 367–374. [Google Scholar] [CrossRef] [PubMed]


Publisher’s Note: MDPI stays neutral with regard to jurisdictional claims in published maps and institutional affiliations. |
© 2021 by the authors. Licensee MDPI, Basel, Switzerland. This article is an open access article distributed under the terms and conditions of the Creative Commons Attribution (CC BY) license (http://creativecommons.org/licenses/by/4.0/).