Abstract
This paper studied the method for converting the aerosol extinction to the mass concentration of particulate matter (PM) and obtained the spatio-temporal distribution and transportation of aerosol, nitrogen dioxide (NO2), sulfur dioxide (SO2), and formaldehyde (HCHO) based on multi-axis differential optical absorption spectroscopy (MAX-DOAS) observations in Dalian (38.85°N, 121.36°E), Qingdao (36.35°N, 120.69°E), and Shanghai (31.60°N, 121.80°E) from 2019 to 2020. The PM2.5 measured by the in situ instrument and the PM2.5 simulated by the conversion formula showed a good correlation. The correlation coefficients R were 0.93 (Dalian), 0.90 (Qingdao), and 0.88 (Shanghai). A regular seasonality of the three trace gases is found, but not for aerosols. Considerable amplitudes in the weekly cycles were determined for NO2 and aerosols, but not for SO2 and HCHO. The aerosol profiles were nearly Gaussian, and the shapes of the trace gas profiles were nearly exponential, except for SO2 in Shanghai and HCHO in Qingdao. PM2.5 presented the largest transport flux, followed by NO2 and SO2. The main transport flux was the output flux from inland to sea in spring and winter. The MAX-DOAS and the Copernicus Atmosphere Monitoring Service (CAMS) models’ results were compared. The overestimation of NO2 and SO2 by CAMS is due to its overestimation of near-surface gas volume mixing ratios.
1. Introduction
Atmospheric aerosols play an important role in atmospheric physics and chemistry and affect the atmospheric radiation budget by absorbing and scattering radiation [1]. Nitrogen dioxide (NO2), sulfur dioxide (SO2), and formaldehyde (HCHO) are important atmospheric trace gases (TGs) that play a major role in atmospheric chemical processes. The observed high NO2 and volatile organic compounds (VOCs) reflect the anthropogenic emission sources, e.g., power plants, industry, and vehicle emissions [2]. SO2 contributes to the formation of sulfate aerosols and acid rain, both of which have negative effects on the climate and human health and lead to increasing acid corrosion [3]. The dominant anthropogenic emissions of SO2 are the burning of fossil fuels and oil refineries, whereas the discharge of active volcanoes is the major natural source. HCHO is mainly produced through the oxidation of VOCs, and the HCHO level and distribution can be used as an indicator of the photochemical turnover capacity in the atmosphere [4].
Multi-axis differential optical absorption spectroscopy (MAX-DOAS) is a passive remote sensing technique that can provide column densities and vertical distribution information about aerosol extinction and trace gas concentration in the troposphere by measuring scattered sunlight at different elevations [5]. The MAX-DOAS technique is suitable for long-term observations of aerosols and trace gases with a relatively high time resolution (i.e., several minutes) because of its simple instrument concept and its low-cost and automatic operation. At present, many research institutions have carried out atmospheric aerosol and TGs observation research in the inner cities of China based on MAX-DOAS technology [6,7,8,9,10]. Xing, et al. [11] researched the wintertime sources of VOCsfrom MAX-DOAS measured formaldehyde and glyoxal in Chongqing. Hendrick, et al. [12] suggested a stronger correlation of HONO with NO2 and a larger proportion of NO2 converted into HONO in Beijing city center than that in Xianghe. Ma, et al. [13] estimated the mixing ratios of NO2, SO2, and HCHO in the lower troposphere in the Tibetan Plateau. Hong, et al. [14] studied the vertical profiles of NO2, SO2, HCHO, and aerosols in Hefei and their relationship with emission sources and the effects of regional transport.
In recent years, an increasing number of scientific studies have addressed aerosol levels, chemical compositions, and TG levels and sources in Chinese coastal regions. Most of these studies have focused on the cities of Dalian [15,16,17], Qingdao [18,19], Guangzhou [20], and Shanghai [21,22]. However, each of these studies was conducted in one city and analyzed the change characteristics of only a single pollutant. Few studies of the temporal and spatial changes of multiple pollutants have been done in the three coastal cities.
This study used one year of ground-based MAX-DOAS observations to study the temporal and spatial variation characteristics and transport characteristics of aerosol, NO2, SO2, and HCHO in the three coastal cities of Dalian, Qingdao, and Shanghai. The remainder of this paper is organized as follows: In Section 2, the MAX-DOAS instrument, the retrieval method, and the flux calculation method of particulate matter are described. In Section 3, the seasonal variations and diurnal variations, weekly cycles, vertical distribution, and seasonal flux variations of aerosol and trace gas are investigated, and a pollution process covering the three cities is analyzed. In Section 4, the comparisons between MAX-DOAS and Copernicus Atmosphere Monitoring Service (CAMS) data are discussed. In Section 5, conclusions are presented.
2. MAX-DOAS Measurement
2.1. Instrument
The MAX-DOAS system includes a UV–visible band spectrometer, quartz optical fiber, high-precision two-dimensional rotating platform, high-precision temperature control system, high-performance computer, etc. Scattered sunlight collected by the telescope is redirected by quartz fibers to the spectrometer for spectral analysis. The thin back-illuminated charge-coupled device (CCD) Avantes (http://www.avantes.com/, accessed on 1 January 2021) is then used to measure spectra in the UV wavelength with a spectral resolution of 0.50 nm (full width half maximum, FWHM). The bands of the three stations’ spectra are slightly different (Table 1). The telescope collected the scattered sunlight spectrum at 11 elevation angles (1°, 2°, 3°, 4°, 5°, 6°, 8°, 10°, 20°, 30°, and 90°), and the azimuth angle was oriented in the northern direction [5,10,23,24]. The observation direction was not blocked and was not affected by the topography. The single exposure time was under 300 ms, and the number of spectral averaging was 100 times. The optical fiber was multimode quartz fiber with a length of 10 m and a diameter of 400 μm. By setting up a wireless routing module, unattended and remote data transmission can be achieved.

Table 1.
The site differences between Dalian, Qingdao, and Shanghai.
The mercury lamp spectrum was collected, and the three peaks of 296.7, 302.15, and 334.148 nm, along with the corresponding numbers of channels, were selected for calibration. The spectrometer without shutter was placed in a temperature control system, therefore, dark backgrounds and offsets were collected at night. When retrieving the spectrum, the dark background and offset of the night were deducted. The error of the motor rotation was less than 0.06° (minimum possible step). An angle measuring instrument was then used to determine the horizontal inclination of the motor in the vertical scanning direction, and the horizontal inclination error in other directions was ±0.10°.
2.2. Site
Dalian, Qingdao, and Shanghai are located in eastern coastal China. Figure 1 shows the locations of the Dalian, Qingdao, and Shanghai monitoring stations. The climate of Dalian and Qingdao is typically a territorial monsoon system within a warm-temperate zone, and the climate of Shanghai is a subtropical monsoon climate. The main industries in Dalian are shipbuilding, chemical engineering, and locomotive building, and the main industries in Qingdao are electronics, petrochemicals, and textiles and clothing. In Dalian and Qingdao, coal gas is the primary fuel for household cooking, and coal is the main fuel used for central heating in winter [25]. The MAX-DOAS instrument in Shanghai is located in the Chongming Island, which is an alluvial island at the mouth of the Yangtze River. Table 1 shows the differences in the three monitoring stations, such as the site locations, site types, altitudes, spectral bands, and observation times.
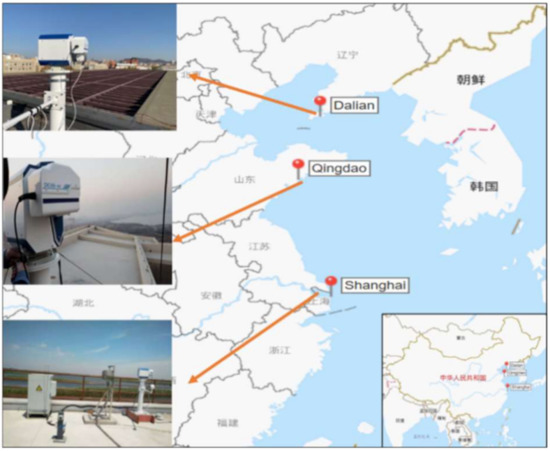
Figure 1.
The locations of multi-axis differential optical absorption spectroscopy (MAX-DOAS) instruments.
2.3. Spectral Analysis
The spectra measured with MAX-DOAS were analyzed using the QDOAS software (version 3.2) [26]. The spectrum in the zenith direction of the current circle was used as the Fraunhofer reference spectrum (FRS) in a complete cycle, and the slanted column density (SCD) of O4, NO2, SO2, and HCHO was calculated. The TG cross sections, wavelength ranges, and additional properties of the DOAS analyses are provided in Table 2. Figure 2 shows typical DOAS fit examples at Qingdao station. The bands absorbed by water vapor is mainly the infrared and the blue band while the O4 retrieve band is 337–370 nm. Therefore, water vapor absorption interference is neglected in this study. The cloud effect was considered by screening the data with cloud affection.
Table 2.
QDOAS parameter settings.
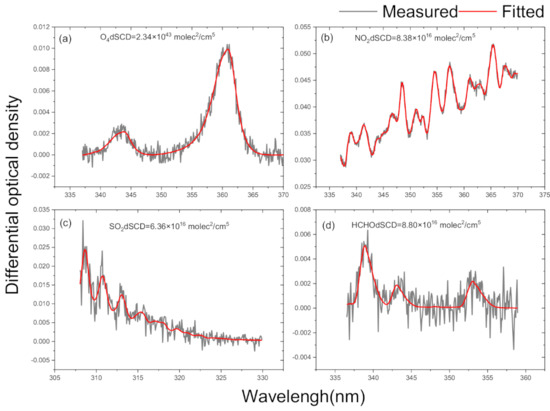
Figure 2.
Examples of typical DOAS fits of O4 (a), NO2 (b) and SO2 (c) at 11:48 local time (LT) on 11 December 2019 as well as HCHO (d) at 11:03 LT on 21 July 2019 at Qingdao station. The fitted differential slanted column densities (dSCDs) of NO2, O4, SO2, and HCHO are given in the corresponding subfigures. The black and red curves indicate the fitted absorption structures and the derived absorption structures from the measured spectra, respectively.
2.4. Profile Retrieval
We used the aerosol extinction and trace gas concentration PRofile Inversion AlgorithM (PriAM) [32,33,34], developed by the Anhui Institute of Optics and Fine Mechanics (AIOFM) of the Chinese Academy of Sciences and the Max Planck Institute of Chemistry (MPIC), combined with the multi-angle dSCD retrieval of aerosol and trace gas profile information. PriAM used a two-step inversion process. The first step was to retrieve the aerosol extinction profile from the O4 dSCD. Then, the vertical distribution of NO2 and SO2 and the HCHO volume mixing ratio (VMR) were retrieved from the corresponding dSCD. The Gauss–Newton numerical iteration program modified by Levenberg–Marquardt solved the inversion problem, as shown in Equation (1):
is the state parameter, is the prior state parameter, Ki is the weight function, Sa is the covariance of the prior error, and is the covariance of the measurement error. The vertical distribution of the aerosol extinction coefficient and the gas volume mixing ratio were retrieved using the PriAM algorithm, PriAM used SCIATRAN radiative transfer model (RTM). RTM parameters for SCIATRAN are listed in supplementary materials Table S1.
2.5. Flux Calculation Method
2.5.1. Method for Calculating Mass Concentration of Particulate Matter
It is difficult to obtain the vertical distribution of particulate matter concentration, which is usually converted by the aerosol extinction coefficient via, e.g., lidar. However, lidar has a blind zone under 200 m [35]. MAX-DOAS, a technique to detect the vertical distribution of aerosols, can be used to obtain the vertical distribution of the aerosol from 0.05 to 4 km with vertical resolution of 200 m [36]. The conversion methods for the aerosol extinction and particulate matter concentration were then studied [37,38].
Firstly, the particulate matter (PM)2.5 data for the environmental monitoring station and the aerosol extinction over 50 m measured by MAX-DOAS were used to establish a conversion model. At present, the most commonly used models are the linear model and power function model.
The Conversion Model of the Particle Mass Concentration and Extinction Coefficient
(1) Linear model
According to the basic theory of Mie scattering [39], the aerosol extinction coefficient α can be expressed as [40]
where r is the particle size radius, Qext is the extinction efficiency, and n (r) is the particle size distribution. The density of the aerosol is considered as ρ. The total mass concentration of the particulate matter (MTotal) can thus be expressed as
Then, the relationship between the aerosol extinction coefficient measured by MAX-DOAS and the mass concentration of the total particulate matter is
where reff is the effective radius of the particle.
The proportion of the mass concentration of fine particles (d ≤ 2.5 μm) among the total particles is η; then, the relationship between the mass concentration of fine particles and the extinction coefficient is
where a is related to the particle size spectrum distribution, optical refraction, environmental humidity, and other factors. When the humidity is greater than 80%, the hygroscopicity of the particles becomes obvious, and the extinction properties of the particles are enhanced [41]. To eliminate humidity, a stepwise conversion method for humidity is adopted. A detailed analysis and discussion will be given later. Under the assumption that the scale spectrum distribution of aerosol particles and the light refractive index are constant, the scale factor can be considered as a constant a that does not change with the height.
Thus, the linear model is
(2) Power function model
The empirical formula is based on long-term data of the aerosol extinction coefficient and particle mass concentration:
where a and b are model parameters related to aerosol morphology and meteorological conditions, and c is a constant related to factors such as aerosol composition.
Conversion Formula
The observation sites are all located along the coast, and the relative humidity is high, but the influence of humidity in different regions on the extinction characteristics of aerosols is different. This factor is related to the differences in the chemical composition of aerosols in different regions, especially the proportion of inorganic water-soluble ions, such as SO42−, NO3−, and NH4+. There is also influence from sea salt aerosol. The proportion of inorganic water-soluble ions, Cl−, and Na+ to particulate matter in Dalian in the spring is 72.7–81.6%, 4.1–4.6%, and 2.4–2.7%, respectively, and that in autumn is 42.2–55.9%, 6.8–9.1%, and 3.8–5.1%, respectively [42]. The contribution of the inorganic water-soluble ions SO42− (12%), NO3− (15%), and NH4+ (10%) to PM2.5 is 37% [18], and marine aerosols (Cl− and Na+) account for 1.3–2.5% of the aerosols in Qingdao [19]. The contribution rates of sulfate, nitrate, ammonium salt, Cl−, and Na+ to PM2.5 in Shanghai urban are 25.1 ± 8.1%, 18.5 ± 8.3%, 13.3 ± 3.8%, 3.32%, and 0.76%, respectively [21]. The contribution rate of sulfate, nitrate, ammonium salt, Cl−, and Na+ to PM2.5 was 25.9%, 12.2%, 11.5%, 0.60%, and 0.87%, respectively, in Shanghai Chongming Island in June 2006 [43]. The proportion of marine aerosols in northern coastal cities was larger than that in southern coastal cities [42].
Figure 3 shows the influence of relative humidity (RH) on the aerosol extinction during the observation period. In Dalian, when the RH is greater than 50%, the extinction coefficient begins to increase by 51.09%, and when the RH is greater than 70%, the extinction coefficient increases significantly by 78.75% (Figure 3a). The extinction coefficient of Qingdao increases by 48.26% when the RH is greater than 70% (Figure 3b). In Shanghai, the extinction coefficient begins to increase by 56.76% when the RH is greater than 50%. However, when the RH is greater than 80%, the extinction coefficient does not increase significantly (Figure 3c). This is related to the low water-soluble ions in the chemical composition of aerosols in Chongming, Shanghai. Therefore, the conversion method for particle mass concentration and the extinction coefficients at different RH levels was applied to different cities (Supplementary Materials Figure S1a–i). Table 3 shows the conversion formulas for the aerosol extinction coefficient and PM2.5 under different RHs in the three cities. The linear model and the power function model have the same effect. According to the conversion formulas, the PM2.5 measured by the in situ instrument and the PM2.5 simulated by the conversion formulas showed good correlation in whole observation period. The correlation coefficients R were 0.93 (Dalian), 0.90 (Qingdao), and 0.88 (Shanghai), respectively (Figure 4).
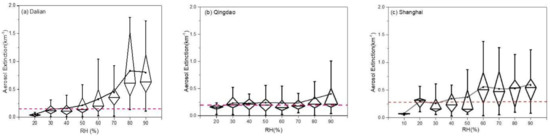
Figure 3.
The relationship between the aerosol extinction and the relative humidity (RH) in Dalian (a), Qingdao (b) and Shanghai (c).
Table 3.
Conversion formulas for the aerosol extinction coefficient and the particulate matter (PM)2.5 under different RHs.
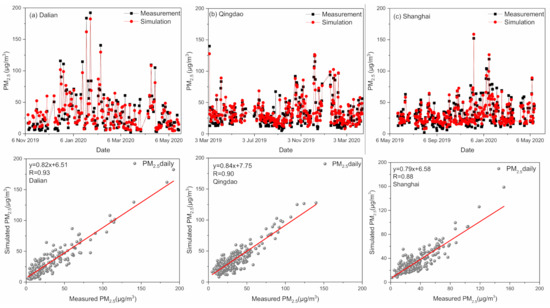
Figure 4.
The correlation of the PM2.5 measured by the in situ instrument and the PM2.5 simulated by conversion formulas in Dalian (a), Qingdao (b), and Shanghai (c).
2.5.2. Transport Flux Calculation
The transport flux is defined as the product of wind speed and pollutant concentration at the corresponding layer using the flux calculation formula [44]:
where C is PM2.5 or trace gas concentration of different height layers, and W is the wind filed. The wind field data and relative humidity data at different levels are derived from the Copernicus Climate Change Service (C3S) provided by the European Center for Medium-Range Weather Forecasts (ECMWF) (https://cds.climate.copernicus.eu/cdsapp#!/dataset/reanalysis-era5-pressure-levels?tab=form, accessed on 1 January 2021). We used the zonal (U) wind field to calculate the flux between inland and sea. The Wind field’s horizontal resolution was 0.25° × 0.25°, and wind field’s uncertainty was about 15% [45,46].
3. Results
3.1. Seasonal Variation
In Figure 5, an unpronounced and consistent aerosol optical depth (AOD) seasonal cycle is shown for three coastal cities. The AOD has high values (0.88 and 0.97 in Qingdao and Dalian, respectively) in winter. NO2 and SO2 have obvious seasonal characteristics. The seasonal cycles of NO2 and SO2 displayed minimum values (NO2 vertical column density (VCD) of 3.78 × 10¹⁵ and 3.39 × 10¹⁵ molec./cm2 in Qingdao and Shanghai, respectively; SO2 VCD of 6.77 × 10¹⁵ and 4.70 × 10¹⁵ molec./cm2 in Qingdao and Shanghai, respectively) in summer, and maximum values (NO2 VCD values of 1.37 × 10¹⁶, 7.04 × 10¹⁵, and 1.63 × 10¹⁶ molec./cm2 in Qingdao, Shanghai, and Dalian, respectively; SO2 VCD values of 1.05 × 10¹⁶, 5.96 × 10¹⁵ and 1.01 × 10¹⁶ molec./cm2 in Qingdao, Shanghai, and Dalian, respectively) in winter. These characteristics are already well established for urban areas in the eastern region of China [12,47]. In contrast, HCHO shows the opposite seasonality trend to NO2 and SO2, which was related to the strengthening of photochemical reactions in summer. The HCHO VCD maximum values (1.01 × 10¹⁶ and 1.85 × 10¹⁶ molec./cm2 in Qingdao and Shanghai, respectively) were found in summer, and its minimum values (5.96 × 10¹⁵, 5.40 × 10¹⁵, and 6.42 × 10¹⁵ molec./cm2 in Qingdao, Shanghai, and Dalian, respectively) in winter. A similar seasonality trend of HCHO in the eastern region of China has already been reported [48]. Since the observation data in Dalian are less than one year, the complete seasonal variation cannot be shown.
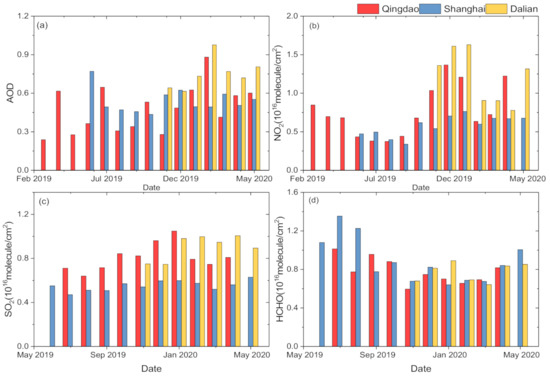
Figure 5.
Monthly average aerosol optical depth (AOD) (a) and vertical column densities (VCDs) for NO2 (b), SO2 (c) and HCHO (d) in Qingdao, Shanghai, and Dalian.
Although the three MAX-DOAS sites are all located in coastal cities, their geographic locations are different (such as urban and rural and the north and south of China). Therefore, the differences in aerosol and trace gas values between the stations were studied. The MAX-DOAS site in Shanghai is located at the atmospheric background station and can be used as a reference to study the impact of the city’s pollutant emissions. The site distribution of quantities of AOD, NO2, and SO2 manifest in the following order: Dalian > Qingdao > Shanghai. The average annual AOD value of the Shanghai site is 0.43, while the values of Dalian and Qingdao are 88.31% and 10.14% higher than Shanghai, respectively. The annual average NO2 value of Shanghai is 5.81 × 10¹⁵ molec./cm2, while the values of Dalian and Qingdao are 110.21% and 31.99% higher than that of Shanghai, respectively. Shanghai’s SO2 VCD is 5.55 × 10¹⁵ molec./cm2, while the values for Dalian and Qingdao are 62.70% and 45.71% higher than that of Shanghai, respectively, which is related to the coal-fired heating in winter in northern China. The Dalian site is located in an urban area and is affected by industrial and traffic emissions. Further, due to the lack of summer data for the Dalian site, the annual average values of AOD, NO2, and SO2 are larger, and HCHO is smaller in Dalian. However, the HCHO VCD is the largest in Shanghai, and the values for Dalian and Qingdao are similar. The annual average value of HCHO in Shanghai is 9.15 × 10¹⁵ molec./cm2, while the values for Dalian and Qingdao are 15.62% and 14.35% lower than that of Shanghai, respectively. This is related to the longer light period in the south, and the stronger photochemical reactions. Urban emissions contribute significantly to the concentration of NO2, SO2, and aerosols, but not HCHO. The secondary formation of HCHO is reportedly the largest ambient HCHO source in summer [49], with reduced photochemical reactions in winter.
3.2. Diurnal Variation
The AOD reaches its maximum value at 10:00 local time (LT) in the morning, and then rapidly decreases. The diurnal variation is the largest in spring, with a difference of 0.8 in Dalian (Figure 6a). The AOD has no obvious daily change, but is slightly higher in the morning and evening in Shanghai. In winter, the AOD has high value in the morning and evening and a low value at noon, while other seasons show a decline starting in the morning in Qingdao. The NO2 VCD in Qingdao presents the characteristics of daily changes, with high values in the morning and evening and low values at noon, which similar to that of Dalian in autumn and spring. (Figure 6b). The lowest value is reached at 1 p.m. throughout the day and the largest daily variation occurred in spring. This may be related to the peaks of traffic emissions in the morning and evening. The NO2 VCD in Shanghai has no obvious diurnal variation because it is far away from the urban area and has no traffic emissions. This is similar to the MAX-DOAS observation results at the Beijing Shangdianzi Atmospheric Background Station [50]. The NO2 VCD at Dalian maintained a high level of concentration throughout the day in winter. This is similar to the MAX-DOAS observations in Beijing and Wuxi [6,51]. This phenomenon may be caused by complex chemical reactions and transportation, with generally higher emission rates, a longer NO2 lifetime, and less dispersion efficiency in winter. As shown in Figure 6c, the SO2 VCD has similar diurnal variation to NO2 in Qingdao. Further, the maximum daily change occurs in autumn. In contrast, the SO2 VCD reaches a high value at noon and then decreases rapidly in autumn and winter in Dalian, which is similar to the observation results for Wuxi [6]. As shown in Figure 6d, as the light intensity increases, the photochemical reaction intensifies, and HCHO VCD rises, and reaches the peak value at 10:00–14:00 LT. Then, with a further enhancement of light and the consumption of formaldehyde precursors, the growth rate of HCHO is lower than its consumption rate. Thus, HCHO VCD decreases. Our result is consistent with a ship-based MAX-DOAS observation in Jiangsu, China in terms of daily HCHO VCD variations [51]. In Shanghai, HCHO VCD has the highest concentration in summer, and HCHO VCD experiences the largest daily change in spring.
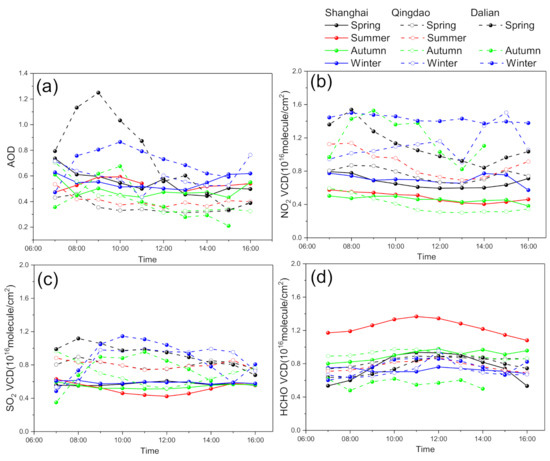
Figure 6.
Seasonally averaged diurnal variations of AOD (a) and trace gas VCDs for NO2 (b), SO2 (c) and HCHO (d) in different seasons in Qingdao, Shanghai, and Dalian.
3.3. Weekly Variation
In urban areas, industrial and transportation emissions affect the level of pollutants, and human production activities have a certain periodicity. The traffic load on the roads on weekends and the slowdown of industrial activities produce lower pollutant emissions levels [52,53]. Previous studies have shown that there are no significant weekend effects in many major cities in China. NO2 and SO2 experience weekend effects, and HCHO VCD experiences few weekend changes, while aerosols have no weekend effects in Wuxi [6]. NO2 and HCHO VCD did not decrease over the weekend in Baoding and Beijing [12,54]. While SO2 and HCHO did not show a weekend decrease, with values similar to those of the weekdays, NO2 slightly decreased by 2.45% (Shanghai), 3.83% (Qingdao), and 3.20% (Dalian) on weekends (Figure 7b–d). However, AOD was 13.84% higher on weekends in Dalian (Figure 7a). Similarly, Xu, et al. reported that PM2.5 concentrations were, on average, 18% higher on weekends in five inland cities (Changchun, Beijing, Zhengzhou, Taiyuan, and Hefei) during 2013–2014, likely due to the additional traffic on weekends, although heating and cooking might be contributing factors [55]. This may be related to China’s industrial production model of uninterrupted production.
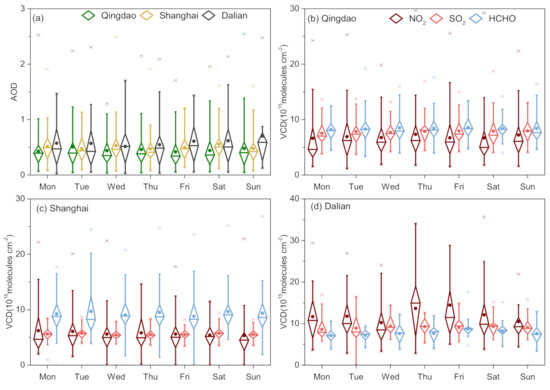
Figure 7.
Mean weekly cycles for (a) AOD in three sites, and NO2, SO2, and HCHO VCDs in (b) Qingdao, (c) Shanghai, (d) Dalian.
3.4. Vertical Distribution
In Figure 8, the aerosol extinction coefficient of Qingdao was found to have higher values near the surface of about 0.45 km−1 at 0.2 km (in winter) and of 0.25 to 0.3 km−1 at 0.4 km (in other seasons). The aerosol extinction profile of Shanghai has no obvious seasonal varieties, and the maximum extinction height is 0.4 km. However, the aerosol extinction profile of Dalian is seasonally different. The maximum extinction height in spring is 1 km, and the shapes of the aerosol profiles are similar to those of a Gaussian vertical distribution. The aerosols are concentrated near the ground and decrease with height in winter. The extinction coefficient decreases sharply at 0.4 km and is discontinuously distributed with the upper layer in autumn. The NO2 profiles show exponential decay in all seasons at the three sites, indicating that NO2 is mainly concentrated near the ground, which is consistent with the MAX-DOAS observations in Wuxi [6] and similar to the vertical distribution of NOx measured at the Yangtze River Delta [56]. The profile shape of NO2 is mainly attributed to near-surface emission sources and a short lifetime. The SO2 seasonal profiles of Qingdao and Dalian decayed exponentially, indicating that local source emissions are the main cause. The maximum concentration of SO2 in Shanghai is located at 0.4 km and is significant in spring and winter, which may be related to the transportation in downtown Shanghai and the surrounding provinces and cities because no artificial emission sources are near the site. The HCHO profile shape of Qingdao consists of two parts: a box-shape near the ground and an exponential decrease from 0.4 to 2 km, which is similar to the MAX-DOAS observation results in Hefei [14]. The high values near the ground may be caused by the main emissions and the rapid formation of specific VOCs. The HCHO profiles of Shanghai and Dalian decrease exponentially, and the decrease rate slows in summer.
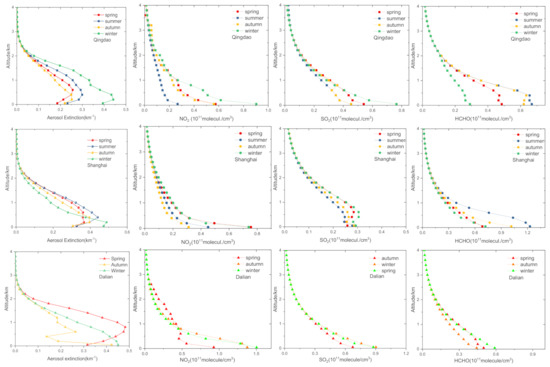
Figure 8.
Seasonal mean profile of Qingdao, Shanghai, and Dalian sites.
3.5. Pollution Transport between Inland and Sea
We define the output flux with pollutant transport from inland to sea as positive and the input flux with pollutant transport from sea to inland as negative (see Figure 9).
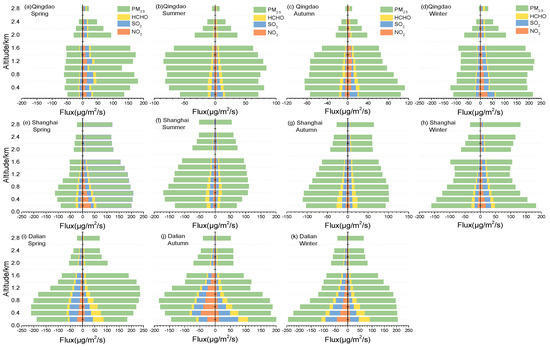
Figure 9.
The input and output flux of particulate mass, NO2, SO2, and HCHO at Qingdao (a–d), Shanghai (e–h), and Dalian (i–k) in different seasons. The output flux of pollutant transport from inland to the sea was defined as positive, and the input flux of pollutant transport from the sea to inland was defined as negative.
(1) Qingdao
In spring and winter, the output fluxes of particulates and trace gases are greater than the input fluxes. In summer and autumn, the output fluxes of particulate and trace gas are similar to the input fluxes. The maximum output fluxes of particulates, NO2, and SO2 can reach values of 145.84, 14.64, and 21.69 μg/m2/s, respectively, which are expected to be 2.5 times the values of the input fluxes in spring. The output fluxes are mainly distributed at 0.6–1.2 km, and the input fluxes have a uniform vertical distribution (Figure 9a). In summer, the input flux increases, the maximum input flux values of particulates and HCHO increases to 77.76 and 6.67 μg/m2/s, while the output decreases, and the transport flux of NO2 does not change significantly in the vertical distribution (Figure 9b). The vertical distribution of transportation is concentrated below 2 km, and the transportation near the ground is large, decreasing with height in summer and autumn. The output fluxes of particulates and SO2 are dominant, with maximum values of 151.08 and 29.45 μg/m2/s, respectively, near 200 m in winter (Figure 9d).
(2) Shanghai
The transport flux of trace gas decreases with height, but the particle transport flux does not vary significantly in the vertical direction over the four seasons. The output flux in spring is twice the input flux, and the input in summer is greater than the output (greater than 1.5 times the output). The output flux in winter is slightly greater than the input flux, and the output flux is equivalent to the input in autumn. In spring, particulates and NO2 output transportation are mainly at 0.2–0.6 km, while the maximum flux can reach 163.11 and 33.52 μg/m2/s, respectively (Figure 9e). In summer, the main transport heights are 0.2 to 0.6 km near the ground, and the maximum input fluxes of particulates and HCHO are 138.31 and 21.62 μg/m2/s, respectively (Figure 9f). In autumn and winter, the particle output flux has a high value at 2.8 km. The transportation height of trace gas is mainly concentrated at 0.2–0.8 km, and the maximum SO2 flux can reach 9.73 μg/m2/s. The HCHO input and output are equivalent, and the maximum output fluxes of NO2, SO2, and HCHO are 11.63, 17.81, and 9.69 μg/m2/s, respectively. The main transport height is 0.2 to 1 km near the ground (Figure 9g–h).
(3) Dalian
In spring, the trace gas output flux is mainly HCHO flux with a maximum of 44.37 μg/m2/s, and the input flux is mainly SO2 flux with a maximum of 38.99 μg/m2/s. Above 0.6 km, the output flux of particles is greater than the input (Figure 9i). In autumn, a strong SO2 output flux (62.91 μg/m2/s) appears at 0.2 km near the ground. The NO2 input flux is mainly above 0.2 km, and the maximum value can reach 47.20 μg/m2/s. The output flux of particulate matter is slightly larger than the input in autumn (Figure 9j). The NO2 and SO2 input flux is greater than output flux in winter, showing an obvious stepped shape. For particulate matter, the input flux is greater than the output below 0.4 km, and the output flux is greater than the input above 0.4 km. The maximum input and output fluxes are 135.45 and 158.42 μg/m2/s, respectively (Figure 9k).
3.6. Analysis of a Pollution Process
Heavily pollution process mainly occurred in winter. From 6 to 11 December 2019, a strong pollution event occurred in Dalian, Qingdao, and Shanghai. According to the data displayed by the ground monitoring station (Figure 10), the PM2.5 concentration increased sharply from 33 to 123 μg/m3, and the growth rate was 45 μg/m3/h, while the wind direction changed from northerly to southwesterly, the temperature and humidity increased from 8:00 to 10:00 LT (T1) on 8 December in Dalian. However, the NO2 and SO2 concentrations did not change significantly. At 20:00 LT on the 10th (T2), the PM2.5 and NO2 concentrations reached maximum values (178 and 60 μg/m3, respectively). There was no obvious time consistency observed between NO2 and PM2.5 concentration variations, which may be relate to the interference of local traffic emissions in low wind speed (WS>1.5 m/s). At 17:00 LT on the 6th (T3), both NO2 and PM2.5 increased slightly in Qingdao, the wind direction changed from north to south, and the temperature increased by 7 °C, which indicates warm air from the south. At 8:00 LT on the 9th (T4) and 18:00 LT on the 10th (T5), NO2 and PM2.5 increased while the wind direction changed from south to northwest, and wind speed was 4m/s, which indicate air pollution from northwest. While the humidity was greater than 80%, the PM2.5 and NO2 concentrations reached their maximum values (267 μg/m3 and 94 μg/m3, respectively). The variation in NO2 and particulates was synchronized in Qingdao, and SO2 only slightly increased. At 22:00 LT on the 10th (T6), NO2 reached a maximum of 153 μg/m3. Then, the maximum value of PM2.5 (185 μg/m3) appeared with high RH at 12:00 on the 11th (T7). The accumulation of PM2.5 may be converted to nitrate by gas reaction of NO2 [57]. During the pollution period, the ratios of PM2.5 and PM10 in Dalian, Qingdao, and Shanghai were 65.68%, 70.94%, and 85.67%, respectively. Furthermore, the NO2 high value in Shanghai was nearly twice that of Qingdao and Dalian. The differences in the proportion of fine particles in the particulate matter and NO2 high value indicate that the pollution sources of the three regions may be different. The pollution event exhibited a significant relative humidity increase to nearly 80%–90%, indicating the contribution of water vapor transport. During the pollution process, the average temperature increased by 6.3 (Dalian), 7.2 (Qingdao), and 3.5 °C (Shanghai), which indicated that warm air was another meteorological feature of the pollution event [58].

Figure 10.
PM2.5, PM10, NO2, SO2, wind direction (WD), wind speed (WS), temperature (T) and relative humidity (RH) in Dalian (a), Qingdao (b), and Shanghai (c) from 6 December 2019 to 11 December 2019.
In Figure 11, the vertical distribution characteristics of pollutant transport were observed via MAX-DOAS during the pollution process. AOD reached its maximum values of 3.09 (Dalian), 2.71 (Qingdao), and 2.19 (Shanghai), and aerosols accumulated below 1.5 km. Both Dalian and Qingdao evidenced the NO2 transportation process on 7 December. The transport height of NO2 was below 1 km in Dalian and Shanghai, but the vertical distribution of NO2 transportation experienced a clear increase and was lower in Qingdao. The transport height of NO2 rose from 0.8 to 1.5 km on the 7 December, accumulated near the surface on 9 December, and then dropped from 2 km to near the surface on the 11th in Qingdao. The transport flux profiles of PM2.5 and NO2 between land and sea for the pollution period are shown in Figure 12. There was mutual transportation between sea and land in Dalian and Qingdao, which may be related to the whirling airflow, while output transportation was mainly identified in Shanghai. The maximum output flux and input flux of PM2.5 were 1758.25 μg/m2/s (Dalian) and 591.44 μg/m2/s (Qingdao), respectively. The maximum output flux and input flux of NO2 were 267.62 μg /m2/s (Dalian) and 79.18 μg/m2/s (Qingdao), respectively. Based on the Hysplit model (http://www.ready.noaa.gov/hysplit/hysplit/, accessed on 1 January 2021), the 24 h backward trajectory of the wind field at 500 m during December 6th to 11th shown in Figure 13, the polluted air masses in Qingdao and Shanghai mainly come from North China, but the main source of pollution in Dalian is northwest and northern transmission. This may be the reason for the differences in the proportion of fine particles in different cities.
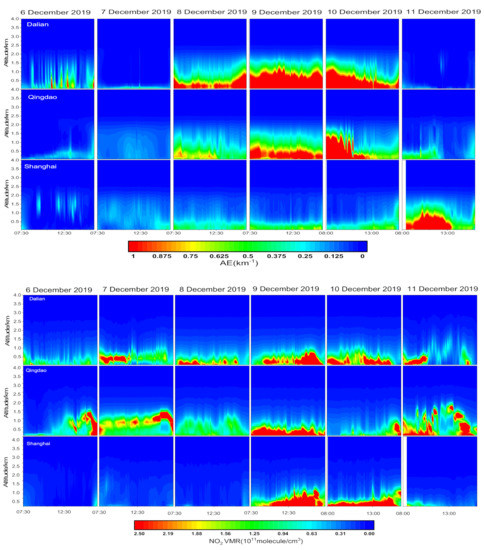
Figure 11.
AOD and NO2 profiles in Dalian, Qingdao, and Shanghai from 6 December 2019 to 11 December 2019.
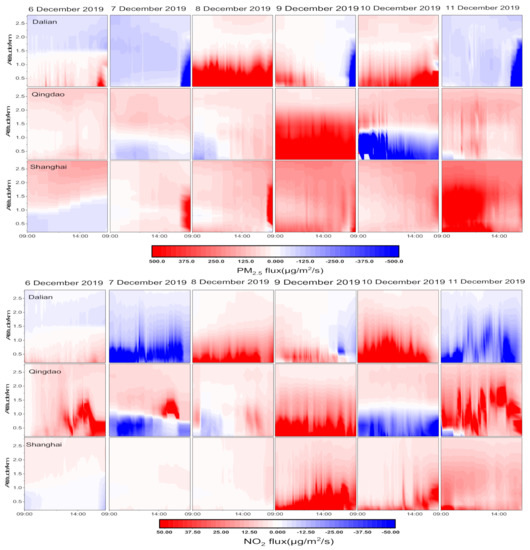
Figure 12.
PM2.5 and NO2 flux profiles in Dalian, Qingdao, and Shanghai from 6 December 2019 to 11 December 2019. The red indicates output flux from inland to sea, and the blue indicates input flux from sea to inland.
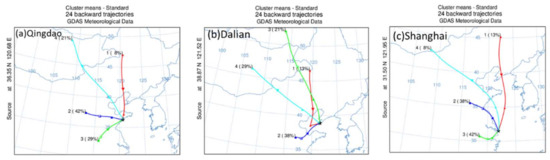
Figure 13.
The 24 h backward trajectory of wind fields in Qingdao (a), Dalian (b) and Shanghai (c) from 6 December 2019 to 11 December 2019.
4. Discussion
One of the service products of CAMS is global reanalysis concentrations of various reactive gases. The CAMS reanalysis is produced using 4DVar data assimilation in CY42R1 of ECMWF’s Integrated Forecast System (IFS) and available through ECMWF data archive. CAMS real-time products can be freely downloaded via a platform (http://apps.ecmwf.int/datasets/data/cams-nrealtime/levtype=sfc/, accessed on 1 January 2021). AOD (550 nm and 469 nm) and total column of NO2, SO2, and HCHO are available at 00:00 UTC (8:00 LT) and 06:00 UTC (14:00 LT) over 0.125° × 0.125° lat.–long. grid. According to the Junge spectrum distribution of aerosol, the CAMS AOD (360 nm) was calculated from AODs at 550 nm and 469 nm [59]. The monthly average values of AOD and trace gas VCDs from MAX-DOAS were compared with the CAMS data (Figure 14). The CAMS model overestimated AOD by 16–48%, NO2 VCD by 52–196%, and SO2 VCDs by 1.15–4.19 times compared to the MAX-DOAS measurements in three cities. K RENUKA et al. also found that the annual mean SO2 mixing ratios were overestimated by a factor of 7.8 by CAMS [60], and they suggest this overestimation is possibly due to an incorrect vertical distribution of SO2 in the models. On the contrary, the CAMS model underestimated HCHO VCD by 23–37% compared to the MAX-DOAS measurements. This is similar to the CAMS model’s underestimation of HCHO VCD by about 24% in Beijing [61], which is related to the CAMS model’s underestimation of the local primary emissions of HCHO, however, the MAX-DOAS measurements could effectively obtain the HCHO from both local primary emissions and secondary generation. The correlation coefficients and linear regressions between the MAX-DOAS data and the model results are shown in Figure 15a–c. The correlation coefficient R of AOD was above 0.80 in three cities. The correlation coefficient R of NO2 VCD was more than 0.81 in Qingdao and Dalian. However, the CAMS NO2 VCD and MAX-DOAS results did not significantly agree for Shanghai, and the R was only 0.64. These results related to the CAMS grid accuracy and traffic emission from urban area. The CAMS SO2 VCD and MAX-DOAS results showed no correlation. The seasonal variation in AOD, NO2 and HCHO VCD from the CAMS model and MAX-DOAS displayed consistency.
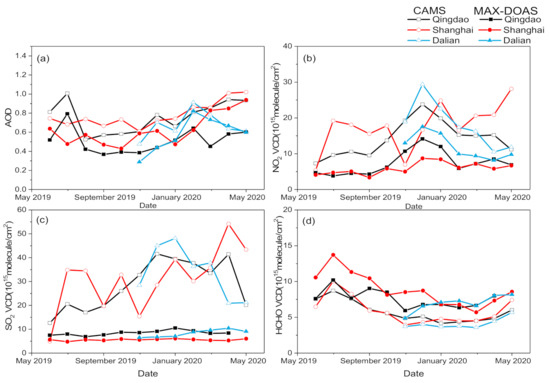
Figure 14.
Monthly averaged AOD (a) and trace gas VCDs (b–d) derived from the coincident Copernicus Atmosphere Monitoring Service (CAMS) model and MAX-DOAS observations in Qingdao, Shanghai, and Dalian from June 2019 to May 2020.
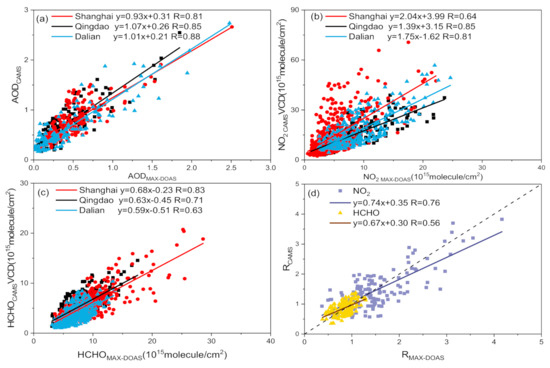
Figure 15.
Correlation between AOD, NO2, and HCHO VCDs retrieved from the MAX-DOAS measurements and those obtained from the CAMS model (a–c), scatter plots and linear regression of NO2 and HCHO of RModel against RMAX-DOAS (d).
In Section 3.2, the obvious daily variation of AOD, NO2, and HCHO VCDs for Qingdao and Dalian are shown. Due to the lack of the CAMS AOD at 14:00 LT, only the diurnal variation of the CAMS NO2 and HCHO VCDs were analyzed. R represents the ratio of trace gas VCDs in the morning (08:00 LT) and noon (14:00 LT). If RModel is close to RMAX-DOAS, it indicates that the trend in diurnal variation of NO2 and HCHO from the model simulation and MAX-DOAS observation is consistent, suggesting that the model can reasonably simulate the systematic diurnal variation of NO2 and HCHO. The consistency of RMAX-DOAS and RModel can be used to qualitative characterize the ability of the model to simulate the diurnal variation of NO2 and HCHO. The scatter plots and linear regressions of daily RMAX-DOAS and RModel are provided in Figure 15d. The R between RMAX-DOAS and RModel of NO2 and HCHO are 0.75 and 0.54, respectively. Most of the dots were around the 1:1 line. Thus, the model can reasonably simulate the systematic diurnal variation in NO2 and HCHO. The weekend effect of AOD and NO2 are shown in Section 3.3. In Figure 16, the CAMS AOD increased by 3.57–16.22% in weekend in three cities, which are similar to MAX-DOAS results. The CAMS NO2 VCD decreased by 14.93% in Dalian in weekend, but slightly increased by 8.76% and 1.57% in Qingdao and Shanghai, respectively, which is different from the decreased weekend effect shown in the MAX-DOAS results. The model can reasonably simulate the systematic weekly variation in aerosol.
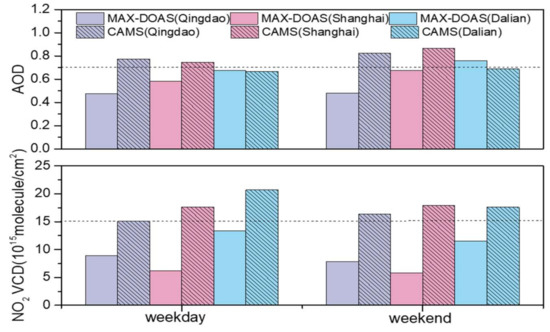
Figure 16.
Mean weekly cycles for AOD and NO2 VCD derived from the CAMS model and MAX-DOAS observations in Qingdao, Shanghai and Dalian.
The NO2, SO2 and HCHO volume mixing ratios (VMR) are available as profiles over seven pressure levels from 700 to 1000 hPa and at 00:00 UTC (8:00 LT) and 06:00 UTC (14:00 LT), over a 0.125° × 0.125° lat.–long. grid in the CAMS model. The NO2, SO2 and HCHO profiles derived from the CAMS model and MAX-DOAS were shown in Figure 17. The height of profiles is 0.2–2.8 km. The CAMS model overestimated the NO2 and SO2 VMRs 5–10-fold compared with the MAX-DOAS results below 1 km, which is the reason for the CAMS model’s overestimation of NO2 and SO2 VCDs. The HCHO profiles from CAMS and MAX-DOAS were consistent, and CAMS underestimated HCHO VMR 30% compared MAX-DOAS results below 0.5 km in Qingdao.
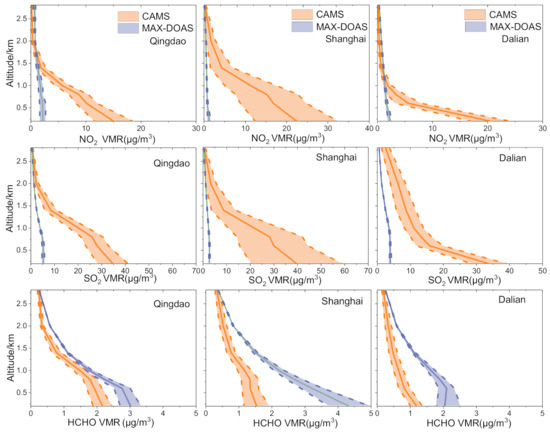
Figure 17.
The NO2, SO2, and HCHO volume mixing ratios (VMR) derived from the CAMS model and MAX-DOAS observations in Qingdao, Shanghai, and Dalian.
5. Conclusions
In this work, we presented MAX-DOAS measurements in Dalian, Qingdao, and Shanghai for around one year. A method of converting the aerosol extinction coefficient to the mass concentration of particulate matter was also introduced and applied. Due to the differences in the chemical compositions of aerosols at different sites, the conversion formulas were significantly different depending on the relative humidity of the three sites. The PM2.5 measured by the in situ instrument and the PM2.5 simulated by the conversion formula showed a good correlation. The correlation R coefficients were 0.93 (Dalian), 0.90 (Qingdao), and 0.88 (Shanghai). The characteristics of monthly, diurnal, and weekly variations, vertical distributions, and fluxes of aerosol and trace gas VCDs of the three stations were also studied.
In the eastern coastal areas, the diurnal variations of AOD, NO2, and SO2 VCDs mainly had high values in the morning and afternoon, with low values at noon, which contrasts with the values of HCHO VCD, but the greatest daily variations all occurred in spring. We studied the weekend effect of AOD and trace gas VCDs in three coastal cities. NO2 had slight decreases by 2.45 % (Shanghai), 3.83 % (Qingdao), and 3.20 % (Dalian) on weekends. However, the AOD was 13.84% higher on weekends in Dalian, and the weekend AOD was also higher than the weekday AOD in some inland cities. The aerosol seasonal profile shapes were mainly Gaussian. Aerosols mainly gathered below the surface of 200 m in winter and gathered from 200 to 800 m in other seasons. The vertical distributions of trace gas were nearly exponential in the three coastal cities, except for the vertical distributions of SO2 in Shanghai and HCHO in Qingdao, indicating that combustion heating and other local sources account for the greatest portion of NO2. The pollution transmission of the surrounding provinces and cities also affected the SO2 concentration in Shanghai.
The input and output fluxes of the three coastal stations were affected by meteorological factors such as wind fields, showing seasonal and regional difference. Particulate matter accounted for the largest proportion of transmission, followed by NO2 and SO2. The main transport flux was output flux in spring and winter, and the input flux was greater than the output flux in Shanghai in summer. The process of pollution from December 6th to 11th, 2019, was a pollution diffusion mainly from Northwest and North China to the eastern coast. The main pollutants were aerosol and NO2. There was mutual transportation between sea and land in Dalian and Qingdao.
The seasonal variation of AOD, NO2, and HCHO of the CAMS model and MAX-DOAS were consistent. The model can reasonably simulate the systematic diurnal variation in NO2 and HCHO, and simulate the systematic weekly variation in aerosol. The CAMS model overestimated AOD by 16–48%, NO2 VCD by 52–196%, SO2 VCDs 1.15–4.19 fold, and underestimated HCHO VCD by 23–37%, compared to the MAX-DOAS measurements in three cities. These results relate to the overestimation of NO2 and SO2 VMR below 1 km and underestimation of HCHO VMR below 0.5 km in model. We suggest that the parameters calculated the near-surface gas VMR in the CAMS model should be adjusted to fit coastal cities in China.
Supplementary Materials
The following are available online at https://www.mdpi.com/2072-4292/13/5/892/s1. Table S1: RTM parameters, Figure S1: Scatter plot of PM2.5 mass concentration and the aerosol extinction coefficient under different RHs at two cities, (a) RH < 50%, (b) 50% < RH < 70%, (c) 70% < RH < 80%, (d) 80% < RH < 100% at Dalian, (e) RH < 70%, (f) RH < 80%, (g) RH < 100% at Qingdao, (h) RH < 50%, (i) 50% < RH < 100% at Shanghai.
Author Contributions
X.L. and A.L. developed the method. Z.H. and H.Z. provided software support for data collection and processing. X.L., B.R., and H.R. performed MAX-DOAS experiment. W.C. and S.W. provided ground environmental monitoring station data. Q.L. helped instrument maintenance. X.T. and Y.H. helped data curation. X.L. analyzed the data and wrote the paper. A.L. and J.X. reviewed the paper. P.X. supervised this study. All authors have read and agreed to the published version of the manuscript.
Funding
This work was supported by grants from the National Key Research and Development Program of China (No.: 2018YFC0213201, 2017YFC0209902, and 2018YFC0213801), the National Natural Science Foundation of China (No.: 41530644, 41775029, 41975037, U19A2044).
Data Availability Statement
The data are available upon request by email to Xiaomei Li at xmli@aiofm.ac.cn.
Conflicts of Interest
The authors declare no conflict of interest.
References
- Charlson, R.J.; Schwartz, S.E.; Hales, J.M.; Cess, R.D.; Coakley, J.A.; Hansen, J.E.; Hofmann, D.J. Climate forcing by anthropogenic aerosols. Science 1992, 255, 423–430. [Google Scholar] [CrossRef]
- Bouwman, A.F.; Boumans, L.J.M.; Batjes, N.H. Emissions of N2O and NO from fertilized fields: Summary of available measurement data. Glob. Biogeochem. Cycles 2002, 16, 6-1–6-13. [Google Scholar] [CrossRef]
- Longo, B.M.; Yang, W.; Green, J.B.; Crosby, F.L.; Crosby, V.L. Acute health effects associated with exposure to volcanic air pollution (vog) from increased activity at Kilauea Volcano in 2008. J. Toxicol. Environ. Health Part A 2010, 73, 1370–1381. [Google Scholar] [CrossRef] [PubMed]
- Heckel, A.; Richter, A.; Tarsu, T.; Wittrock, F.; Hak, C.; Pundt, I.; Junkermann, W.; Burrows, J.P. MAX-DOAS measurements of formaldehyde in the Po-Valley. Atmos. Chem. Phys. Discuss. 2005, 5, 909–918. [Google Scholar] [CrossRef]
- Hönninger, G.; Von Friedeburg, C.; Platt, U. Multi axis differential optical absorption spectroscopy (MAX-DOAS). Atmos. Chem. Phys. Discuss. 2004, 4, 231–254. [Google Scholar] [CrossRef]
- Wu, J.; Li, G.; Cao, J.; Bei, N.; Wang, Y.; Feng, T.; Huang, R.; Liu, S.; Zhang, Q.; Tie, X. Contributions of trans-boundary transport to summertime air quality in Beijing, China. Atmos. Chem. Phys. Discuss. 2017, 17, 2035–2051. [Google Scholar] [CrossRef]
- Wang, S.; Cuevas, C.A.; Frieß, U.; Saiz-Lopez, A. MAX-DOAS retrieval of aerosol extinction properties in Madrid, Spain. Atmos. Meas. Tech. 2016, 9, 5089–5101. [Google Scholar] [CrossRef]
- Wagner, T.; Beirle, S.; Remmers, J.; Shaiganfar, R.; Wang, Y. Absolute calibration of the colour index and O4 absorption derived from Multi AXis (MAX-)DOAS measurements and their application to a standardised cloud classification algorithm. Atmos. Meas. Tech. 2016, 9, 4803–4823. [Google Scholar] [CrossRef]
- Kassianov, E.I.; Chong, J.; Comeron, A.; Shin, D.H.; Kim, K.C.; Picard, R.H.; Schäfer, K.; Lee, K.-H.; Shin, S.; Noh, Y.M.; et al. Atmospheric aerosol characterization combining multi-wavelength Raman lidar and MAX-DOAS meas-urements in Gwanjgu. Remote Sens. Clouds Atoms. XVI 2011, 8177, 817706. [Google Scholar]
- Wagner, T.; Dix, B.; Friedeburg, C.V.; Frieß, U.; Sanghavi, S.; Sinreich, R.; Platt, U. MAX-DOAS O4 measurements: A new technique to derive information on atmospheric aerosols-principles and information content. J. Geophys. Res. Space Phys. 2004, 109, 205–223. [Google Scholar] [CrossRef]
- Xing, C.Z.; Liu, C.; Hu, Q.H.; Fu, Q.Y.; Lin, H.; Wang, S.T.; Su, W.J.; Wang, W.W.; Javed, Z.; Liu, J.G. Identifying the winter-time sources of volatile organic compounds (VOCs) from MAX-DOAS measured formaldehyde and glyoxal in Chongqing, southwest China. Sci. Total Environ. 2020, 715, 136258. [Google Scholar] [CrossRef]
- Hendrick, F.; Müller, J.-F.; Clémer, K.; Wang, P.; De Mazière, M.; Fayt, C.; Gielen, C.; Hermans, C.; Ma, J.Z.; Pinardi, G.; et al. Four years of ground-based MAX-DOAS observations of HONO and NO2 in the Beijing area. Atmos. Chem. Phys. Discuss. 2014, 14, 765–781. [Google Scholar] [CrossRef]
- Ma, J.; Dörner, S.; Donner, S.; Jin, J.; Cheng, S.; Guo, J.; Zhang, Z.; Wang, J.; Liu, P.; Zhang, G.; et al. MAX-DOAS measurements of NO2, SO2, HCHO, and BrO at the Mt. Waliguan WMO GAW global baseline station in the Tibetan Plateau. Atmos. Chem. Phys. Discuss. 2020, 20, 6973–6990. [Google Scholar] [CrossRef]
- Hong, Q.Q.; Liu, C.; Hu, Q.H.; Xing, C.Z.; Tan, W.; Liu, H.R.; Huang, Y.; Zhu, Y.; Zhang, J.S.; Geng, T.Z.; et al. Evolution of the vertical structure of air pollutants during winter heavy pollution episodes: The role of regional transport and poten-tial sources. Atmos. Res. 2019, 228, 206–222. [Google Scholar] [CrossRef]
- Mei, L.; Kong, Z.; Ma, T. Dual-wavelength Mie-scattering Scheimpflug lidar system developed for the studies of the aerosol extinction coefficient and the Ångström exponent. Opt. Express 2018, 26, 31942–31956. [Google Scholar] [CrossRef] [PubMed]
- Zhao, H.; Che, H.; Wang, Y.; Wang, H.; Ma, Y.; Wang, Y.; Zhang, X. Investigation of the optical properties of aerosols over the coastal region at Dalian, Northeast China. Atmosphere 2016, 7, 103. [Google Scholar] [CrossRef]
- Zhang, G.; Gao, Y.; Cai, W.; Leung, L.R.; Wang, S.; Zhao, B.; Wang, M.; Shan, H.; Yao, X.; Gao, H. Seesaw haze pollution in North China modulated by the sub-seasonal variability of atmospheric circulation. Atmos. Chem. Phys. Discuss. 2019, 19, 565–576. [Google Scholar] [CrossRef]
- Gao, Y.; Shan, H.; Zhang, S.; Sheng, L.; Li, J.; Zhang, J.; Ma, M.; Meng, H.; Luo, K.; Gao, H.; et al. Characteristics and sources of PM2.5 with focus on two severe pollution events in a coastal city of Qingdao, China. Chemosphere 2020, 247, 125861. [Google Scholar] [CrossRef]
- Wu, R.; Zhou, X.; Wang, L.; Wang, Z.; Zhou, Y.; Zhang, J.; Wang, W. PM2.5 characteristics in Qingdao and across coastal cities in China. Atmosphere 2017, 8, 77. [Google Scholar] [CrossRef]
- Luo, Y.H.; Dou, K.; Fan, G.Q.; Huang, S.; Si, F.Q.; Zhou, H.J.; Wang, Y.J.; Pei, C.L.; Tang, F.Y.; Yang, D.S.; et al. Vertical distributions of tropospheric formaldehyde, nitrogen dioxide, ozone and aerosol in south-ern China by ground-based MAX-DOAS and LIDAR measurements during PRIDE-GBA 2018 campaign. Atmos. Environ. 2020, 226, 117384. [Google Scholar] [CrossRef]
- Zhang, C.; Zou, Z.; Chang, Y.; Zhang, Y.; Wang, X.; Yang, X. Source assessment of atmospheric fine particulate matter in a Chinese megacity: Insights from long-term, high-time resolution chemical composition measurements from Shanghai flagship monitoring supersite. Chemosphere 2020, 251, 126598. [Google Scholar] [CrossRef] [PubMed]
- Xing, C.; Liu, C.; Wang, S.; Chan, K.L.; Gao, Y.; Huang, X.; Su, W.; Zhang, C.; Dong, Y.; Fan, G.; et al. Observations of the vertical distributions of summertime atmospheric pollutants and the corresponding ozone production in Shanghai, China. Atmos. Chem. Phys. Discuss. 2017, 17, 14275–14289. [Google Scholar] [CrossRef]
- Frieß, U.; Beirle, S.; Bonilla, L.A.; Bösch, T.; Friedrich, M.M.; Hendrick, F.; Piters, A.; Richter, A.; Van Roozendael, M.; Rozanov, V.V.; et al. Intercomparison of MAX-DOAS vertical profile retrieval algorithms: Studies using synthetic data. Atmos. Meas. Tech. 2019, 12, 2155–2181. [Google Scholar] [CrossRef]
- Peters, E.; Ostendorf, M.; Bösch, T.; Seyler, A.; Schönhardt, A.; Schreier, S.F.; Henzing, J.S.; Wittrock, F.; Richter, A.; Vrekous-sis, M.; et al. Full-azimuthal imaging-DOAS observations of NO2 and O4 during CINDI-2. Atmos. Meas. Tech. 2019, 12, 4171–4190. [Google Scholar] [CrossRef]
- Wan, X.; Chen, J.; Tian, F.; Sun, W.; Yang, F.; Saiki, K. Source apportionment of PAHs in atmospheric particulates of Dalian: Factor analysis with nonnegative constraints and emission inventory analysis. Atmos. Environ. 2006, 40, 6666–6675. [Google Scholar] [CrossRef]
- Danckaert, T.; Fayt, C.; Van Roozendael, M.; De Smedt, I.; Letocart, V.; Merlaud, A.; Pinardi, G. QDOAS Software User Manual Version 3.2; BIRA-IASB: Brussels, Belgium, 2017. [Google Scholar]
- Vandaele, A.C.; Hermans, C.; Simon, P.C.; Carleer, M.; Colin, R.; Fally, S.; Merienne, M.F.; Jenouvrier, A.; Coquart, B. Measurements of the NO2 absorption cross-section from 42,000 cm−1 to 10,000 cm−1 (238–1000 nm) at 220 K and 294 K. J. Quant. Spectrosc. Radiat. Transf. 1998, 59, 171–184. [Google Scholar] [CrossRef]
- Bogumil, K.; Orphal, J.; Homann, T.; Voigt, S.; Spietz, P.; Fleischmann, O.; Vogel, A.; Hartmann, M.; Kromminga, H.; Bovensmann, H.; et al. Measurements of molecular absorption spectra with the SCIAMACHY pre-flight model: Instrument characterization and reference data for atmospheric remote-sensing in the 230–2380 nm region. J. Photochem. Photobiol. A Chem. 2003, 157, 167–184. [Google Scholar] [CrossRef]
- Thalman, R.; Volkamer, R. Temperature dependent absorption cross-sections of O2–O2 collision pairs between 340 and 630 nm and at atmospherically relevant pressure. Phys. Chem. Chem. Phys. 2013, 15, 15371–15381. [Google Scholar] [CrossRef]
- Meller, R.; Moortgat, G.K. Temperature dependence of the absorption cross sections of formaldehyde between 223 and 323 K in the wavelength range 225-375 nm. J. Geophys. Res. Space Phys. 2000, 105, 7089–7101. [Google Scholar] [CrossRef]
- Fleischmann, O.C.; Hartmann, M.; Burrows, J.P.; Orphal, J. New ultraviolet absorption cross-sections of BrO at atmospheric temperatures measured by time-windowing Fourier transform spectroscopy. J. Photochem. Photobiol. A Chem. 2004, 168, 117–132. [Google Scholar] [CrossRef]
- Wang, Y.; Li, A.; Xie, P.H.; Chen, H.; Xu, J.; Wu, F.C.; Liu, J.G.; Liu, W.Q. Retrieving vertical profile of aerosol extinction by multi-axis differential optical absorption spectroscopy. Acta Phys. Sin. 2013, 62, 12. [Google Scholar]
- Wang, Y.; Li, A.; Xie, P.H.; Chen, H.; Mou, F.S.; Xu, J.; Wu, F.C.; Zeng, Y.; Liu, J.G.; Liu, W.Q. Measuring tropospheric verti-cal distribution and vertical column density of NO2 by multi-axis differential optical absorption spectroscopy. Acta Phys. Sin. 2013, 62, 14. [Google Scholar]
- Wang, Y.; Beirle, S.; Hendrick, F.; Hilboll, A.; Jin, J.; Kyuberis, A.A.; Lampel, J.; Li, A.; Luo, Y.; Lodi, L.; et al. MAX-DOAS measurements of HONO slant column densities during the MAD-CAT campaign: Inter-comparison, sensitivity studies on spectral analysis settings, and error budget. Atmos. Meas. Tech. 2017, 10, 3719–3742. [Google Scholar] [CrossRef]
- Meng, L.; Wang, G.; Augustin, P.; Fourmentin, M.; Gou, Q.; Fertein, E.; Nguyen Ba, T.; Coeur, C.; Tomas, A.; Chen, W. Inco-herent broadband cavity enhanced absorption spectroscopy (IBBCEAS)-based strategy for direct measurement of aerosol extinction in a lidar blind zone. Opt. Lett. 2020, 45, 1611–1614. [Google Scholar] [CrossRef]
- Wang, Y.; Lampel, J.; Xie, P.; Beirle, S.; Li, A.; Wu, D.; Wagner, T. Ground-based MAX-DOAS observations of tropospheric aerosols, NO2, SO2 and HCHO in Wuxi, China, from 2011 to 2014. Atmos. Chem. Phys. Discuss. 2017, 17, 2189–2215. [Google Scholar] [CrossRef]
- Lv, L.; Liu, W.; Zhang, T.; Chen, Z.; Dong, Y.; Fan, G.; Xiang, Y.; Yao, Y.; Yang, N.; Chu, B.; et al. Observations of particle extinction, PM2.5 mass concentration profile and flux in north China based on mobile lidar technique. Atmos. Environ. 2017, 164, 360–369. [Google Scholar] [CrossRef]
- Tao, Z.; Wang, Z.; Yang, S.; Shan, H.; Ma, X.; Zhang, H.; Zhao, S.; Liu, D.; Xie, C.; Wang, Y. Profiling the PM2.5 mass concentration vertical distribution in the boundary layer. Atmos. Meas. Tech. 2016, 9, 1369–1376. [Google Scholar] [CrossRef]
- Mie, G. Articles on the optical characteristics of turbid tubes, especially colloidal metal solutions. Ann. Phys. 1908, 25, 377–445. [Google Scholar] [CrossRef]
- Li, Q.; Li, C.; Wang, Y.; Lin, C.; Yang, D.; Li, Y. Retrieval on mass concentration of urban surface suspended paticulate matter with LIDAR and satellite remotesensing. Acta Sci. Nat. Univ. Pekin. 2013, 49, 673–682. [Google Scholar]
- Wu, Y.; Wang, X.; Yan, P.; Zhang, L.; Tao, J.; Liu, X.; Tian, P.; Han, Z.; Zhang, R. Investigation of hygroscopic growth effect on aerosol scattering coefficient at a rural site in the southern North China Plain. Sci. Total Environ. 2017, 599–600, 76–84. [Google Scholar] [CrossRef] [PubMed]
- Ma, Y.; Wang, Z.; Tan, Y.; Xu, S.; Kong, S.; Wu, G.; Wu, X.; Li, H. Comparison of inorganic chemical compositions of at-mospheric TSP, PM10 and PM2.5 in northern and southern Chinese coastal cities. J. Environ. Sci. 2017, 55, 339–353. [Google Scholar] [CrossRef] [PubMed]
- Li, L.; Wang, W.; Feng, J.; Zhang, D.; Li, H.; Gu, Z.; Wang, B.; Sheng, G.; Fu, J. Composition, source, mass closure of PM2.5 aerosols for four forests in eastern China. J. Environ. Sci. 2010, 22, 405–412. [Google Scholar] [CrossRef]
- Liu, Y.S.; Tang, G.Q.; Zhou, L.B.; Hu, B.; Liu, B.X.; Li, Y.T.; Liu, S.; Wang, Y.S. Mixing layer transport flux of particulate mat-ter in Beijing, China. Atmos. Chem. Phys. 2019, 19, 9531–9540. [Google Scholar] [CrossRef]
- Hersbach, H.; Bell, B.; Berrisford, P.; Hirahara, S.; Horányi, A.; Muñoz-Sabater, J.; Nicolas, J.; Peubey, C.; Radu, R.; Schepers, D.; et al. The ERA5 global reanalysis. Q. J. R. Meteorol. Soc. 2020, 146, 1999–2049. [Google Scholar] [CrossRef]
- Beirle, S.; Borger, C.; Dörner, S.; Li, A.; Hu, Z.; Liu, F.; Wang, Y.; Wagner, T. Pinpointing nitrogen oxide emissions from space. Sci. Adv. 2019, 5, eaax9800. [Google Scholar] [CrossRef] [PubMed]
- Ma, J.Z.; Beirle, S.; Jin, J.L.; Shaiganfar, R.; Yan, P.; Wagner, T. Tropospheric NO2 vertical column densities over Beijing: Results of the first three years of ground-based MAX-DOAS measurements (2008–2011) and satellite validation (Volume 13, p. 1547, 2013). Atmos. Chem. Phys. 2013, 13, 5629. [Google Scholar] [CrossRef]
- De Smedt, I.; Stavrakou, T.; Hendrick, F.; Danckaert, T.; Vlemmix, T.; Pinardi, G.; Theys, N.; Lerot, C.; Gielen, C.; Vigouroux, C.; et al. Diurnal, seasonal and long-term variations of global formaldehyde columns inferred from combined OMI and GOME-2 observations. Atmos. Chem. Phys. Discuss. 2015, 15, 12519–12545. [Google Scholar] [CrossRef]
- Ling, Z.; Zhao, J.; Fan, S.; Wang, X. Sources of formaldehyde and their contributions to photochemical O3 formation at an urban site in the Pearl River Delta, southern China. Chemosphere. 2017, 168, 1293–1301. [Google Scholar] [CrossRef] [PubMed]
- Cheng, S.; Ma, J.; Cheng, W.; Yang, P.; Zhou, H.; Zhou, L. Tropospheric NO2 vertical column densities retrieved from ground-based MAX-DOAS measurements at Shangdianzi regional atmospheric background station in China. J. Environ. Sci. 2019, 80, 186–196. [Google Scholar] [CrossRef] [PubMed]
- Hong, Q.; Liu, C.; Chan, K.L.; Hu, Q.; Xie, Z.; Liu, H.; Si, F.; Liu, J. Ship-based MAX-DOAS measurements of tropospheric NO2, SO2, and HCHO distribution along the Yangtze River. Atmos. Chem. Phys. Discuss. 2018, 18, 5931–5951. [Google Scholar] [CrossRef]
- Blechschmidt, A.-M.; Arteta, J.; Coman, A.; Curier, L.; Eskes, H.; Foret, G.; Gielen, C.; Hendrick, F.; Marécal, V.; Meleux, F.; et al. Comparison of tropospheric NO2 columns from MAX-DOAS retrievals and regional air quality model simulations. Atmos. Chem. Phys. Discuss. 2020, 20, 2795–2823. [Google Scholar] [CrossRef]
- Beirle, S.; Platt, U.; Wenig, M.; Wagner, T. Weekly cycle of NO2 by GOME measurements: A signature of anthropogenic sources. Atmos. Chem. Phys. Discuss. 2003, 3, 2225–2232. [Google Scholar] [CrossRef]
- Javed, Z.; Liu, C.; Khokhar, M.F.; Tan, W.; Liu, H.; Xing, C.; Ji, X.; Tanvir, A.; Hong, Q.; Sandhu, O.; et al. Ground-based MAX-DOAS observations of CHOCHO and HCHO in Beijing and Baoding, China. Remote Sens. 2019, 11, 1524. [Google Scholar] [CrossRef]
- Xu, L.; Batterman, S.; Chen, F.; Li, J.; Zhong, X.; Feng, Y.; Rao, Q.; Chen, F. Spatiotemporal characteristics of PM2.5 and PM10 at urban and corresponding background sites in 23 cities in China. Sci. Total Environ. 2017, 2074–2084. [Google Scholar] [CrossRef]
- Geng, F.; Zhang, Q.; Tie, X.; Huang, M.; Ma, X.; Deng, Z.; Yu, Q.; Quan, J.; Zhao, C. Aircraft measurements of O3, NOx, CO, VOCs, and SO2 in the Yangtze River Delta region. Atmos. Environ. 2009, 43, 584–593. [Google Scholar] [CrossRef]
- Luo, L.; Zhu, R.-G.; Song, C.-B.; Peng, J.-F.; Guo, W.; Liu, Y.; Zheng, N.; Xiao, H.; Xiao, H.-Y. Changes in nitrate accumulation mechanisms as PM2.5 levels increase on the North China Plain: A perspective from the dual isotopic compositions of nitrate. Chemosphere 2021, 263, 127915. [Google Scholar] [CrossRef] [PubMed]
- Zhao, H.; Che, H.; Zhang, L.; Gui, K.; Ma, Y.; Wang, Y.; Wang, H.; Zheng, Y.; Zhang, X. How aerosol transport from the North China plain contributes to air quality in northeast China. Sci. Total Environ. 2020, 738, 139555. [Google Scholar] [CrossRef]
- Chen, H.; Shi, G.; Uchiyama, A.; Yamazaki, A.; Goloub, P.; Zhang, X. Intercomparison between aerosol optical properties by a PREDE skyradiometer and CIMEL sunphotometer over Beijing, China. Atmos. Chem. Phys. Discuss. 2008, 8, 3199–3214. [Google Scholar] [CrossRef]
- Renuka, K.; Gadhavi, H.; Jayaraman, A.; Rao, S.V.B.; Lal, S. Study of mixing ratios of SO2 in a tropical rural environment in south India. J. Earth Syst. Sci. 2020, 129, 1–14. [Google Scholar] [CrossRef]
- Tian, X.; Xie, P.; Xu, J.; Wang, Y.; Li, A.; Wu, F.; Hu, Z.; Liu, C.; Zhang, Q. Ground-based MAX-DOAS observations of tropo-spheric formaldehyde VCDs and comparisons with the CAMS model at a rural site near Beijing during APEC 2014. Atmos. Chem. Phys. 2019, 19, 3375–3393. [Google Scholar] [CrossRef]


Publisher’s Note: MDPI stays neutral with regard to jurisdictional claims in published maps and institutional affiliations. |
© 2021 by the authors. Licensee MDPI, Basel, Switzerland. This article is an open access article distributed under the terms and conditions of the Creative Commons Attribution (CC BY) license (http://creativecommons.org/licenses/by/4.0/).