Article

Accuracy Evaluation of CFOSAT SWIM L2 Products Based on NDBC Buoy and Jason-3 Altimeter Data

1
College of Geodesy and Geomatics, Shandong University of Science and Technology, Qingdao 266590, China
2
First Institute of Oceanography, Ministry of Natural Resources, Qingdao 266061, China
3
College of Science, China University of Petroleum, Qingdao 266580, China
*
Author to whom correspondence should be addressed.
Remote Sens. 2021, 13(5), 887; https://doi.org/10.3390/rs13050887
Submission received: 22 January 2021 / Revised: 19 February 2021 / Accepted: 24 February 2021 / Published: 26 February 2021

Abstract

:
Chinese-French Oceanography Satellite (CFOSAT), the first satellite which can observe global ocean wave and wind synchronously, was successfully launched On 29 October 2018. The CFOSAT carries SWIM that can observe ocean wave on a global scale. Based on National Data Buoy Center (NDBC) buoys and Jason-3 altimeter data, this study evaluated the accuracy of L2 level products of CFOSAT SWIM from August 2019 to September 2020. The results show that the accuracy of the nadir Significant Wave Height (SWH) data of the SWIM wave spectrometer is good. Compared with the data of the NDBC buoys and Jason-3 altimeter, the RMSE of the nadir box SWH were 0.39 and 0.21 m, respectively. The variation trend of SWH were first increasing and then decreasing with the increasing of the wave height. The precision of off-nadir wave spectrum SWH is not better than nadir box SWH data. Accuracy was evaluated for off-nadir data from August 2019 to June 2020 and after June 2020, respectively. After linear regression correction, the accuracy of off-nadir wave spectrum SWH was improved. The data accuracy evaluation and comparison of different time period showed that the off-nadir wave spectrum SWH accuracy was improved after the data version was updated in June 2020, especially for 6° and 8° wave spectrum. The precision of off-nadir wave spectrum SWH decreases with the increasing of wave height. The accuracy of the dominant wave direction of each wave spectrum is also not very good, and the accuracy of the dominant wave direction of 10° wave spectrum is slightly better than the others. In general, the accuracy of SWIM nadir beam SWH data reaches the high data accuracy of traditional altimeter, while the accuracy of off-nadir wave spectrum SWH is less than that of nadir beam SWH data. The off-nadir SWH data accuracy after June 2020 has been greatly improved.

Graphical Abstract

1. Introduction

Ocean wave is one of the important marine motion forms. The parameters to describe ocean wave mainly include wave height, wavelength and direction, etc., and the sea state can be clearly described by using these parameters. Therefore, the wave parameters with high enough precision should be obtained in the study of ocean wave [1]. Ocean wave parameters can be obtained by buoy observation or satellite remote sensing. Buoy can observe continuously for a long time, but it can only observe at a limited fixed position and cannot obtain the observation data of large spatial coverage. The main ocean wave observation means of satellite remote sensing are satellite altimeter, Synthetic Aperture Radar (SAR) and Real Aperture Radar. Since the 1990s, several satellites with altimeters on board have been launched, including T/P, ERS-1/2, ENVISAT, Jason-1/2/3, Sentinel-3A/B and HY-2A/B/C [2]. Compared with buoys, the ocean wave data obtained by satellite altimeters cover a much larger area. Even so, there is a defect of satellite altimeter that the altimeter can only get the information of wave height, but not the information of wave energy distribution and propagation direction. SAR can estimate two-dimensional wave spectrum [3], but it is vulnerable to the influence of velocity bunching, so that only waves with a wavelength of more than 200 m can be detected [4]. The real aperture radar (RAR) is not affected by the velocity bunching, but an important problem is to find a suitable scanning method to avoid making the antenna of the real aperture radar very large in order to obtain the appropriate resolution. The emergence of Surface Wave Investigation and Monitoring (SWIM) has solved this problem, making it possible to obtain more accurate and large-scale wave spectrum [5,6].
The appearance of SWIM provides a more comprehensive observation data for ocean wave research compared with the previous data, but the data has not been validated. Therefore, the primary data accuracy of the SWIM carried by CFOSAT satellite is evaluated in this study. The acquisition of SWH data of nadir beam is similar to that of the traditional altimeter, so the accuracy can be verified by using the buoy data and altimeter data with similar temporal and spatial scales. The specific evaluation method has been studied by predecessors. Zieger et al. verified the SWH data of the satellite radar altimeter in 23 years by using the buoy of the National Oceanic Data Center of the United States and concluded that their RMSE were all less than 0.25 m, and corrected the SWH data of the radar altimeter by using the correction equation [7]; Durrant et al. evaluated the accuracy of Jason-1 altimeter by using the NDBC buoy, and concluded that the overall root-mean-square error of the two was 0.227 m [8]; Chen et al. used buoys and Jason-2 altimeter data to verify the accuracy of HY-2 altimeter SWH data, and concluded that the RMSE of HY-2 altimeter SWH was 0.33 m; the results showed that HY-2 altimeter and Jason-2 altimeter had similar accuracy [9]. Yang et al. used buoys to verify the accuracy of sentinel-3A/3B and Jason-3 satellite altimeter data; the results showed that the accuracy of SWH data of Jason-3 satellite altimeter was slightly lower than that of Sentinel-3A/3B, and the accuracy of both data decreased with the increase of SWH [10]. There are few studies on the accuracy evaluation of the wave spectrum, and it is usually compared with the wave parameters indirectly. Merle et al. analyzed the wave spectrum observed by KuROS airborne synthetic pore radar and wave parameters and believed that this radar has a better accuracy in wave spectrum inversion for ocean wave with the main wave length less than 200 m, which is a powerful supplement to satellite and buoy data [11]. Shao et al. used Parameterized First-guess Spectrum Method (PFSM) to estimate wave parameters from TerraSAR-X images, including SWH and MWP, and compared them with field buoy measurement results and Wavewatch-III model. RMSE of SWH comparison results were 0.26 and 0.43 m, respectively, and SI was 19.8% and 32.8%, respectively. The results show that the PFSM algorithm is suitable to estimate wave parameters from X-band TerraSAR-X data [12].
In this study, data accuracy assessment was carried out for SWIM L2-level data products of CFOSAT satellite. Section 2 introduces the data used in this study and matching methods. Section 3 uses the NDBC buoy and the Jason-3 altimeter to evaluate the accuracy of nadir SWH data. Section 4 evaluates the precision of off-nadir wave parameters, which is divided into the precision evaluation of SWH and the precision evaluation of dominant wave direction. Section 5 summarizes the results of this study’s accuracy assessment of SWIM L2 product data.

2. Materials and Methods

2.1. Data

This study assessed three kinds of SWIM data: nadir SWH data, SWH and Main Wave Direction data of off-nadir wave spectrum, and NDBC buoy and Jason-3 satellite altimeter data are used in this study as comparative data.

2.1.1. SWIM Spectrometer Data

The China-France Oceanographic Satellite (CFOSAT), developed jointly by the China National Space Administration (CNSA) and the Centre National D’ Etudes Spatiales (CNES) of France, was launched on 29 October 2018, and formally delivered in orbit in February 2020. It is the first satellite capable of joint observation of wind and waves on global scale [13]. The CFOSAT satellite is equipped with a wave spectrometer and a radar scatterometer. The SWIM (Surface Wave Investigation and Monitoring) spectrometer is the first instrument of capturing directional wave spectrum with high precision on a global scale. SWIM wave spectrometer is a Ku-band real aperture radar with six different beams, one pointing to nadir and the other five pointing to 2, 4, 6, 8 and 10 degrees. SWIM obtained the two-dimensional wave spectrum based on the principle that large-scale waves would be inclined on the sea surface, which would affect the backscattering coefficient of the sea surface, resulting in the connection between its Fourier spectrum and the directional spectrum of the sea surface, and then, the wave wavelength, direction and other information could be calculated. By using this principle, 6°, 8° and 10° beam, which are called spectral beams, are used to obtain the modulation information of radar signals in their respective directions. Using these modulation information, two-dimensional wave spectrum can be obtained. Further processing of wave spectrum information can obtain the wave parameters such as significant wave height, dominant wavelength and dominant direction [14].
The accuracy of SWIM spectrometer L2 product data from 29 July 2019 to 30 September 2020 is evaluated in this study, covering a time span of 14 months and 7792 observation passes. The SWH data collected by nadir beam includes three different data: native data, nsec data and box data. Native data are obtained from a single independent echo processing, and the time interval between adjacent data acquisition is 220 ms. Nsec data are obtained after editing, smoothing and equalization of 19 to 20 native data, and the adjacent data acquisition time interval is 220 ms too. Box data are obtained after editing and averaging 45 to 50 native data within 70 km, which is the length of one box, and their time interval between adjacent data acquisition is 10 s. Figure 1 gives an example of these three kinds of data. It can be seen that native data are relatively scattered, and the missing of some data collection results in zero value. Nsec data which have been smoothed are more concentrated and the divergence of data is smaller. It has the same amount with native SWH data. Box data are similar to nsec data, except in small quantities. In addition to the nadir beam SWH data, off-nadir beam SWH can also be calculated from the two-dimensional wave spectrum generated by SWIM. There are four kinds of two-dimensional wave spectrum: obtained through 6° beam, 8° beam, 10° beam and combination of all three spectral beams. Figure 2 shows the relative spatial position relationship between nadir SWH data and SWH of off-nadir wave spectrum data used in this study.

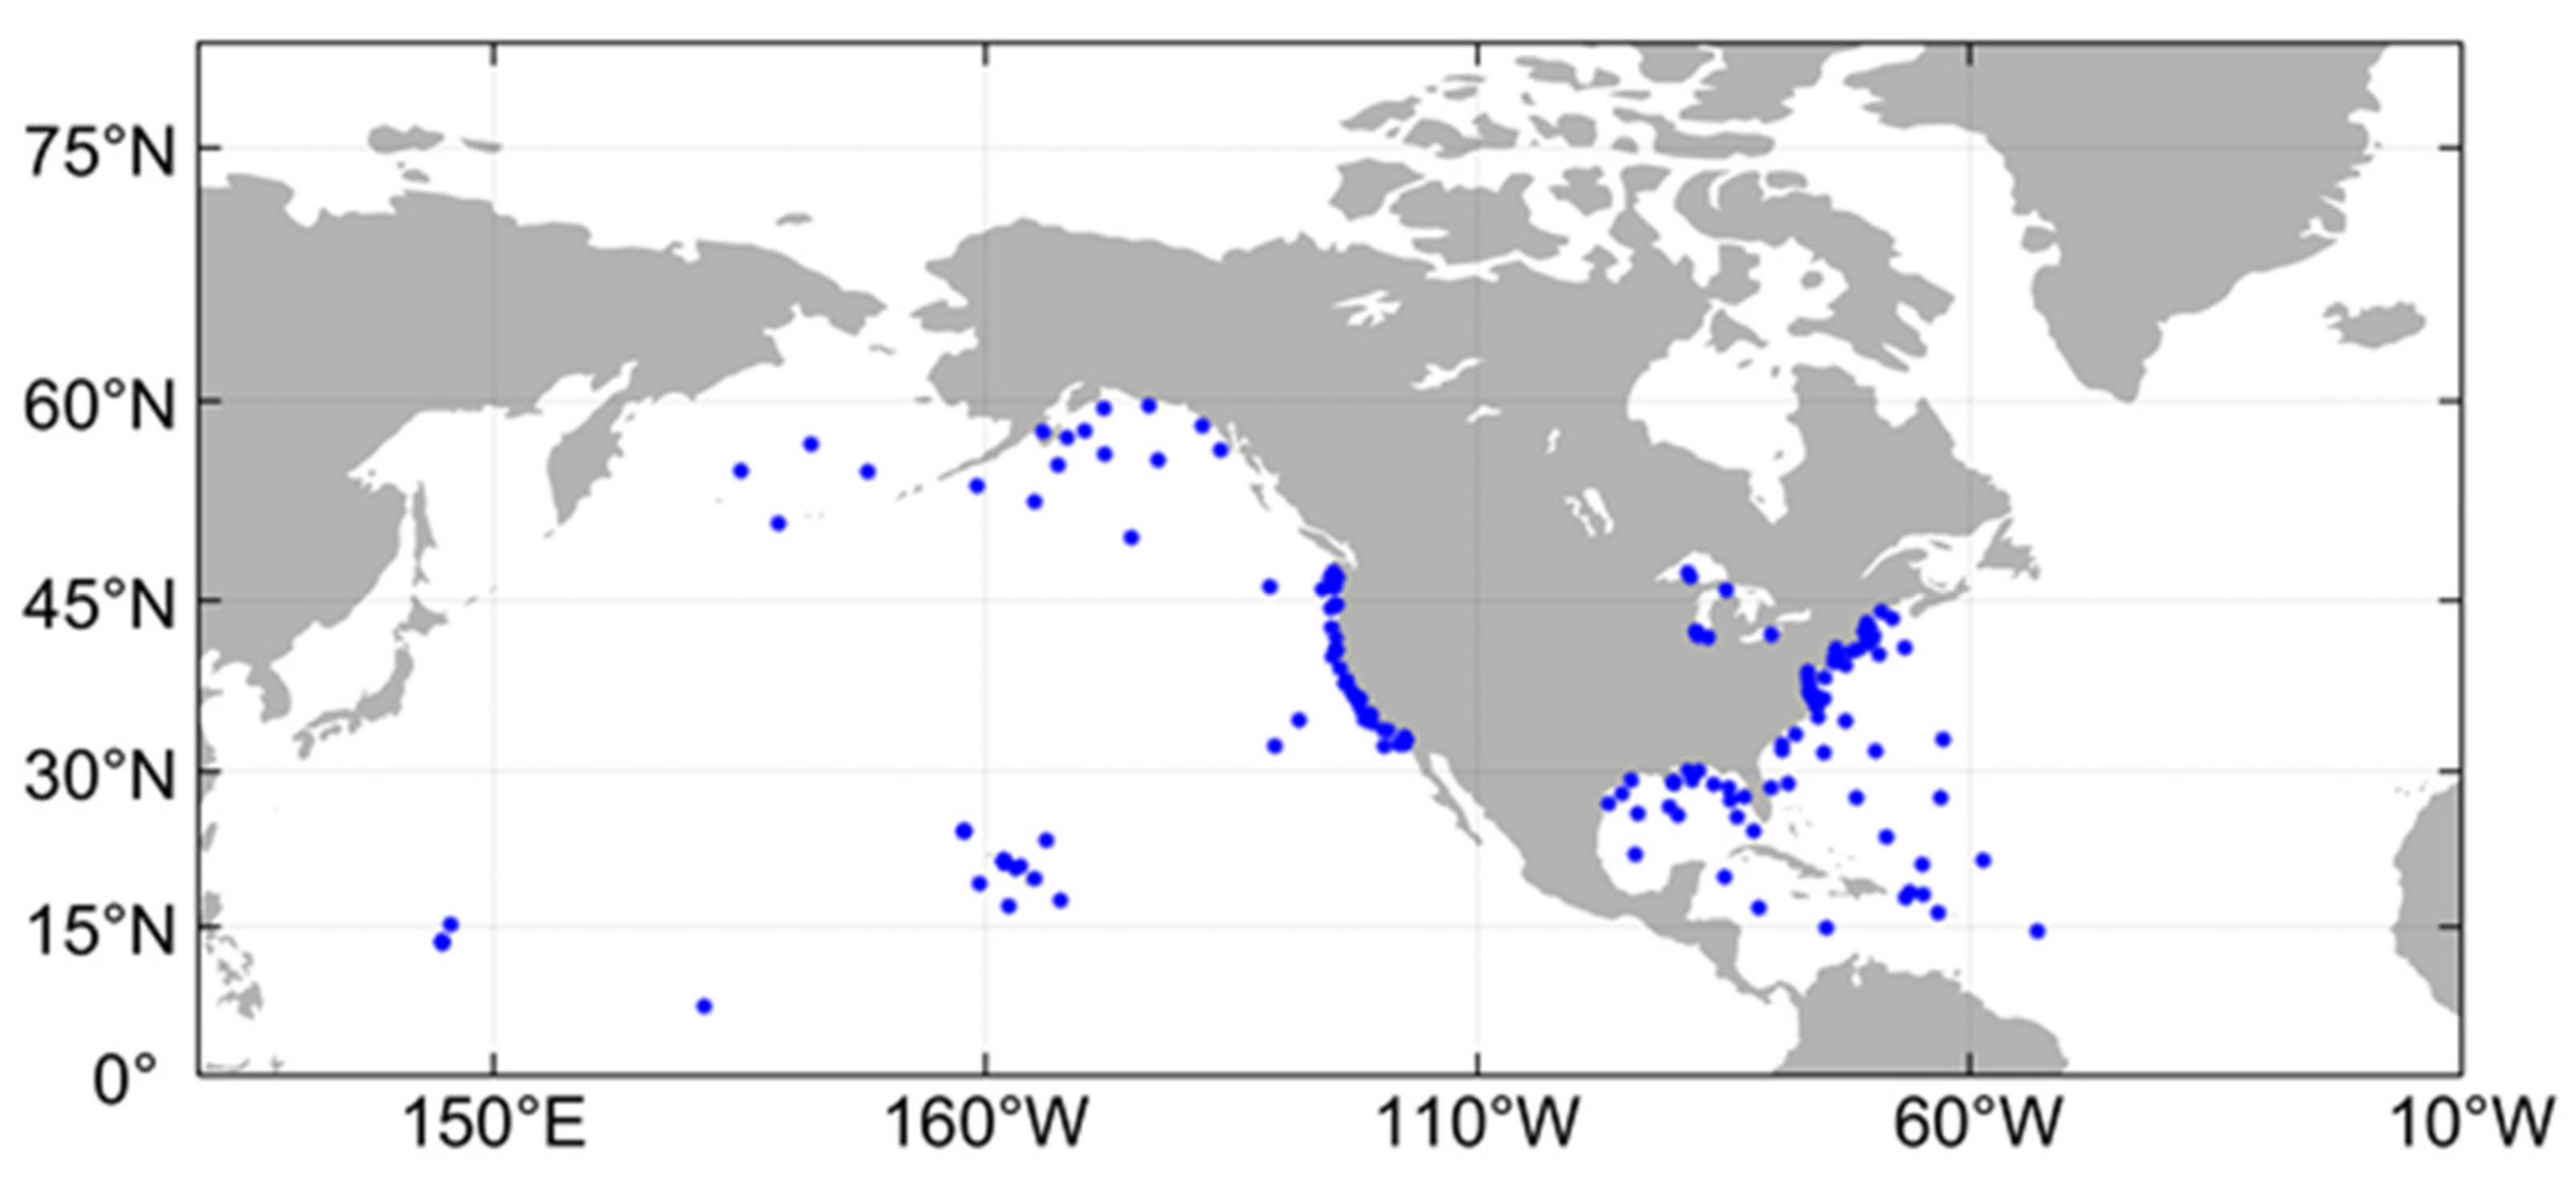
2.1.2. NDBC Buoy Data

Buoy Data from the National Data Buoy Center (NDBC) of the National Oceanic and Atmospheric Administration (NOAA) are used in this study. The NDBC buoy data include wave parameters such as the wave height, period, and direction of ocean wave at a fixed position, which are obtained every hour. A total of 159 NDBC buoys are used in this study, and their positions are shown in Figure 3. Part of the NDBC buoys matched with SWIM are close to shore which could affect the observations. Therefore, it is necessary to use land and sea ice index of spectrometer data to eliminate this effect in data evaluation. In this study, 14 months of NDBC buoy data have been used, from August 2019 to September 2020.

2.1.3. Jason-3 Altimeter Data

Due to the limited spatial distribution of the buoy data, in order to evaluate the accuracy of SWIM data in global ocean, Jason-3 altimeter data are used to compare with SWIM data. The Jason-3 satellite altimeter developed jointly by NOAA, European Meteorological Satellite Development Organization (EUMETSAT) and French Centre National d’ Etudes Spatiales (CNES) is a successor to the T/P, Jason-1/2 series of satellites and was launched on 17 January 2016. In this study, Jason-3 altimeter data were used from August 2019 to August 2020, covering a period of 13 months. Before using the Jason-3 satellite altimeter data, quality control should be carried out. Previous studies have proved that the SWH data accuracy of Jason-3 altimeter meets the usable requirement [10]. As for the Jason-3 altimeter used in this study, in addition to its own quality control index, the abnormal value should also be removed. When the difference between two spatial consecutive SWHs is too large (more than 10 m), it is considered as abnormal data and removed.

2.2. Methods

The evaluation of SWIM wave data is mainly divided into two steps: data space-time matching and error analysis. The match between SWIM data, buoy data and Jason-3 altimeter data follows the principle of matching space firstly and matching time secondly. The spatial distance between the matched data is within 25 km and the temporal interval is within 30 min [15]. The error parameters used in this study include Root Mean Square Error (RMSE), Correlation Coefficient (R), Scatter Index (SI) and bias, these computational formulas are as follows:
bias = 1 n i = 1 n x i y i
RSME = 1 n i = 1 n ( x i y i ) 2
R = i = 1 n x i x ¯ y i y ¯ i = 1 n ( x i x ¯ ) 2 i = 1 n ( y i y ¯ ) 2
SI = 1 n i = 1 n [ x i x ¯ y i y ¯ ] 2 y ¯
In those equations, n means number of matching points, xi means a single SWIM data, x ¯ means the average of all used SWIM data, yi means a single buoy or altimeter data, and y ¯ means the average of all used compared data.

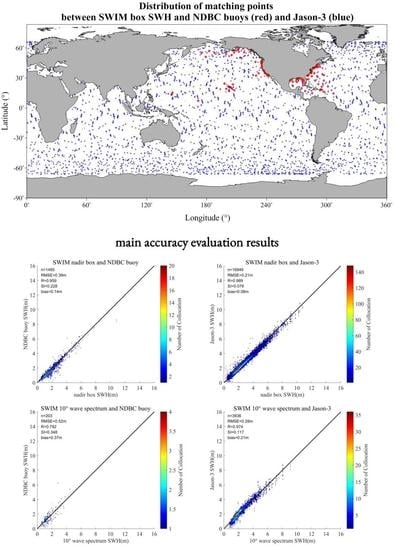
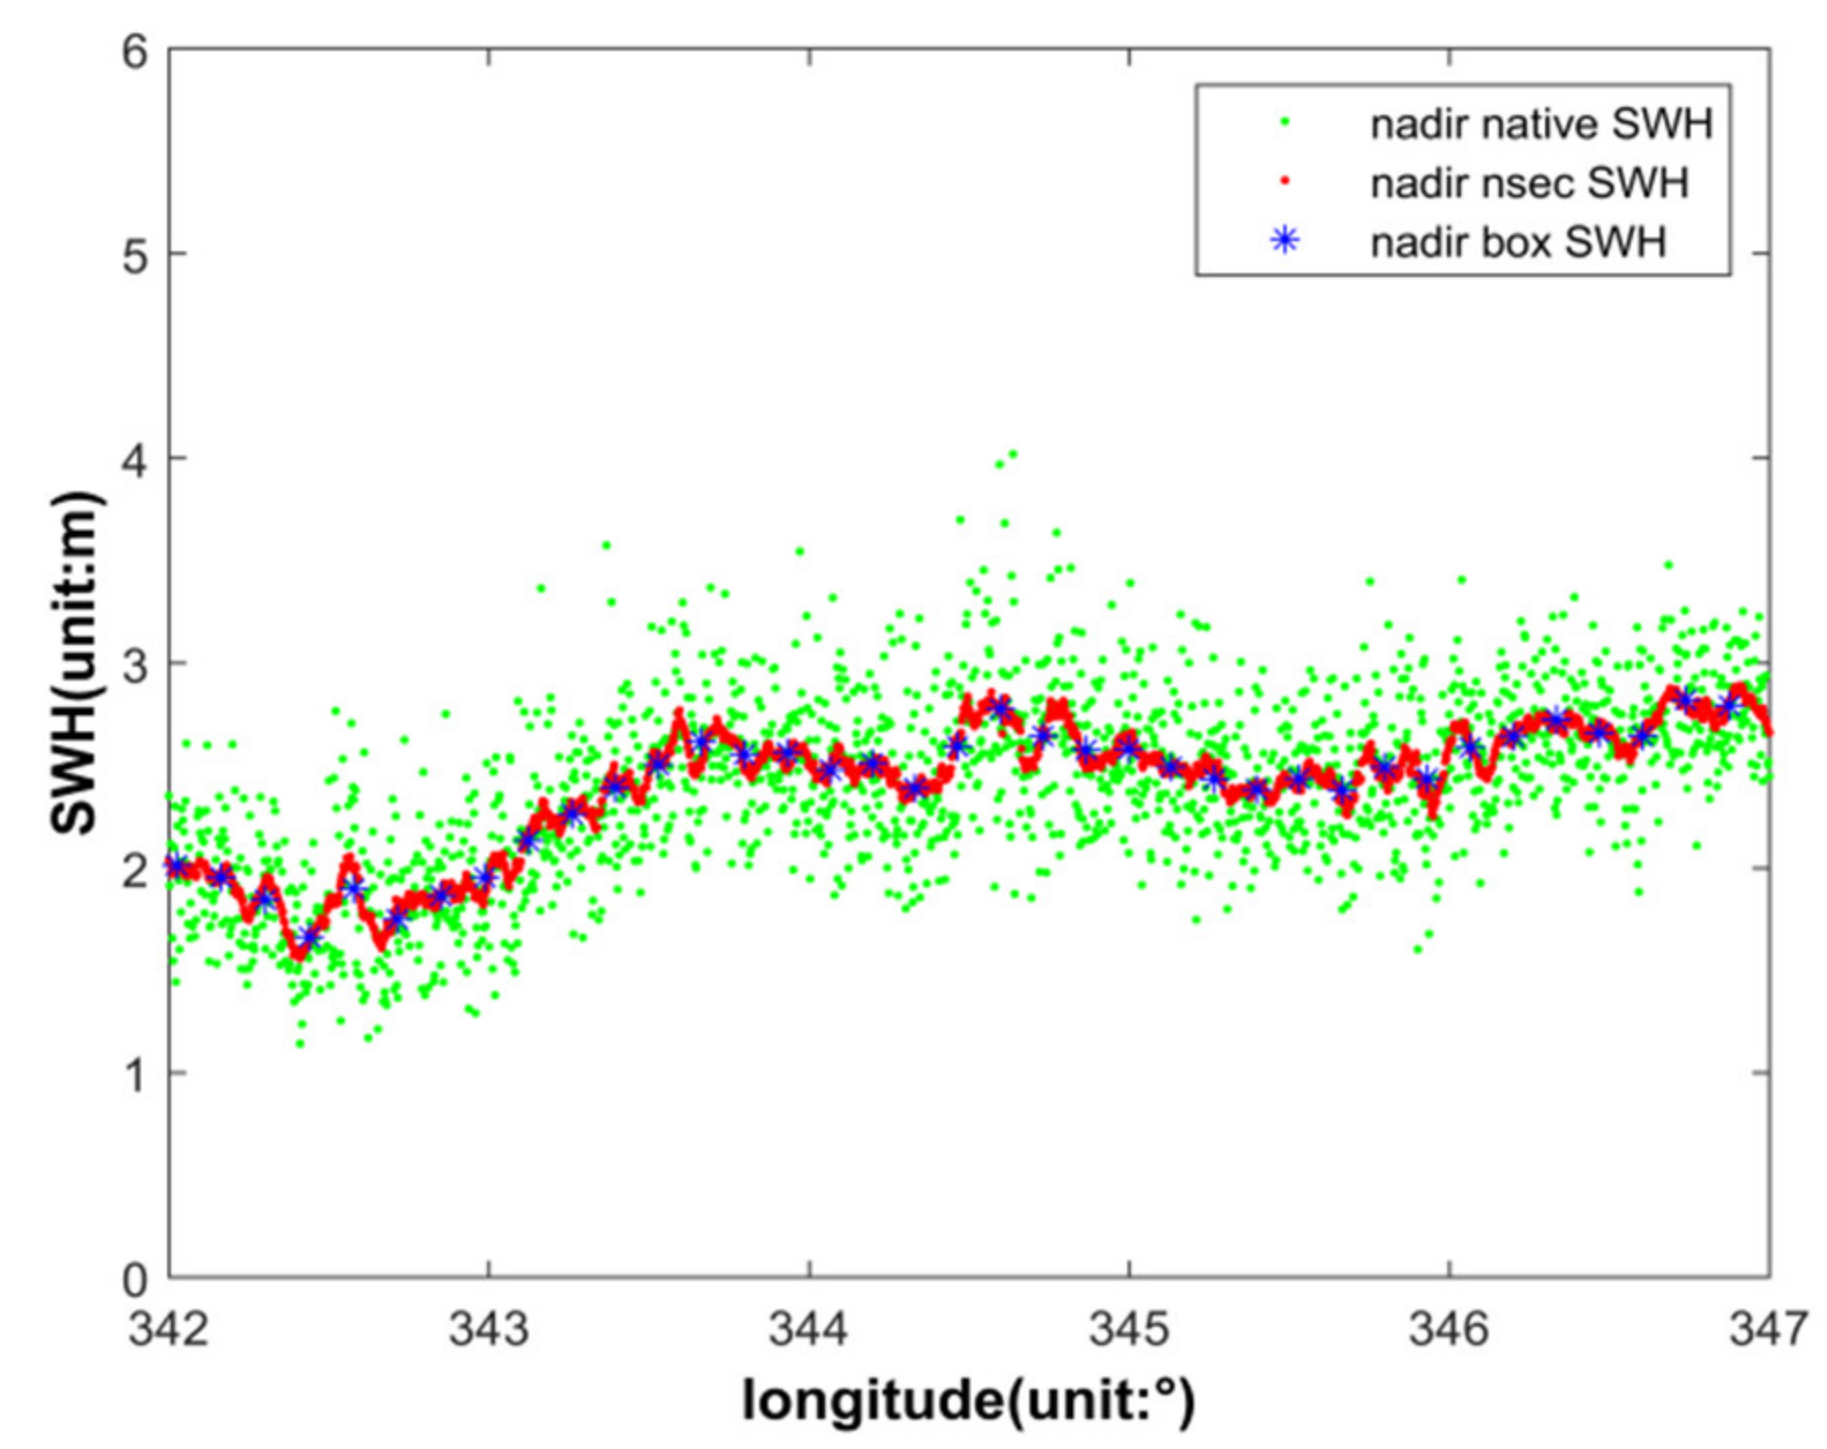
3. Nadir SWIM SWH Accuracy Evaluation

Significant wave height is the most important altimeter product which is defined as the mean of the one-third of the highest surface ocean waves. In this study, the accuracy of nadir SWH data are evaluated by NDBC buoy and Jason-3 altimeter data. In Section 3.1, basing on the principle of less than 25 km in space and 30 min in time, 14-month NDBC buoy data have been matched with SWIM nadir SWH data, and calculate error parameters mentioned in Section 2.2. In Section 3.2, the nadir SWH data have been matched with 13-month Jason-3 SWH data in the same way.

3.1. Comparison with NDBC Buoy

NDBC buoy data are used to evaluate the accuracy of three kinds of nadir SWH data, namely, native, nsec and box data. Firstly, SWIM nadir SWH data and NDBC buoy data are matched according to the criteria introduced in Section 2.2. The temporal and spatial scale of data matching is 30 min and 25 km. SWIM nadir SWH data have no quality control index such as land, sea ice, rain, etc., so the quality control index of off-nadir wave spectrum is used. Then, the error parameters are calculated, and the accuracies of three kinds of nadir SWH data are analyzed. Comparison and error statistical analysis are shown in Figure 4. It can be seen from Figure 4, the error of native SWH data is larger when the native SWH data are more than 2 m, while the accuracy of nsec SWH data compared to native SWH is improved, and RMSE of comparison result drops from 1.57 m of native data to about 1 m. However, the error of nsec SWH data larger than 2 m is still large. The accuracy of box SWH data is analyzed under different quality control conditions. The results show that the accuracy of box SWH data improves significantly after eliminating completely the effect of sea ice and land. One can also find that RMSE with no quality control is reduced from 0.94 m to 0.39 m after excluding the data with land or sea ice index of 100%. SWIM Data Users Guide suggests to delete all those data with quality control index of more than 1%, but the results show that the RMSE increases to 0.45 m except for reducing the amount of data.
In order to analyze the variation of SWIM nadir box SWH data accuracy with wave height, evaluation of nadir SWH is carried out with 1 m intervals, and error statistical parameters are calculated, respectively. The results are shown in Figure 5. In the figure, X-axis represents the segmentation range. For example, 1 represents the SWH value between 0 and 1 m (6 represents the data with SWH greater than 5 m), the center point is bias value, and the upper and lower limits are RMSE value.
It can be seen from Figure 5, the trend of SWIM nadir box SWH accuracy increases firstly and then decreases with the increase of wave height. When the nadir box SWH is 2~3 m, the accuracy is the best, and the bias and RMSE are 0.23 and 0.29 m, respectively. It should be noted that there may be errors in the data accuracy of SWH larger than 4 m results due to the few matching points.

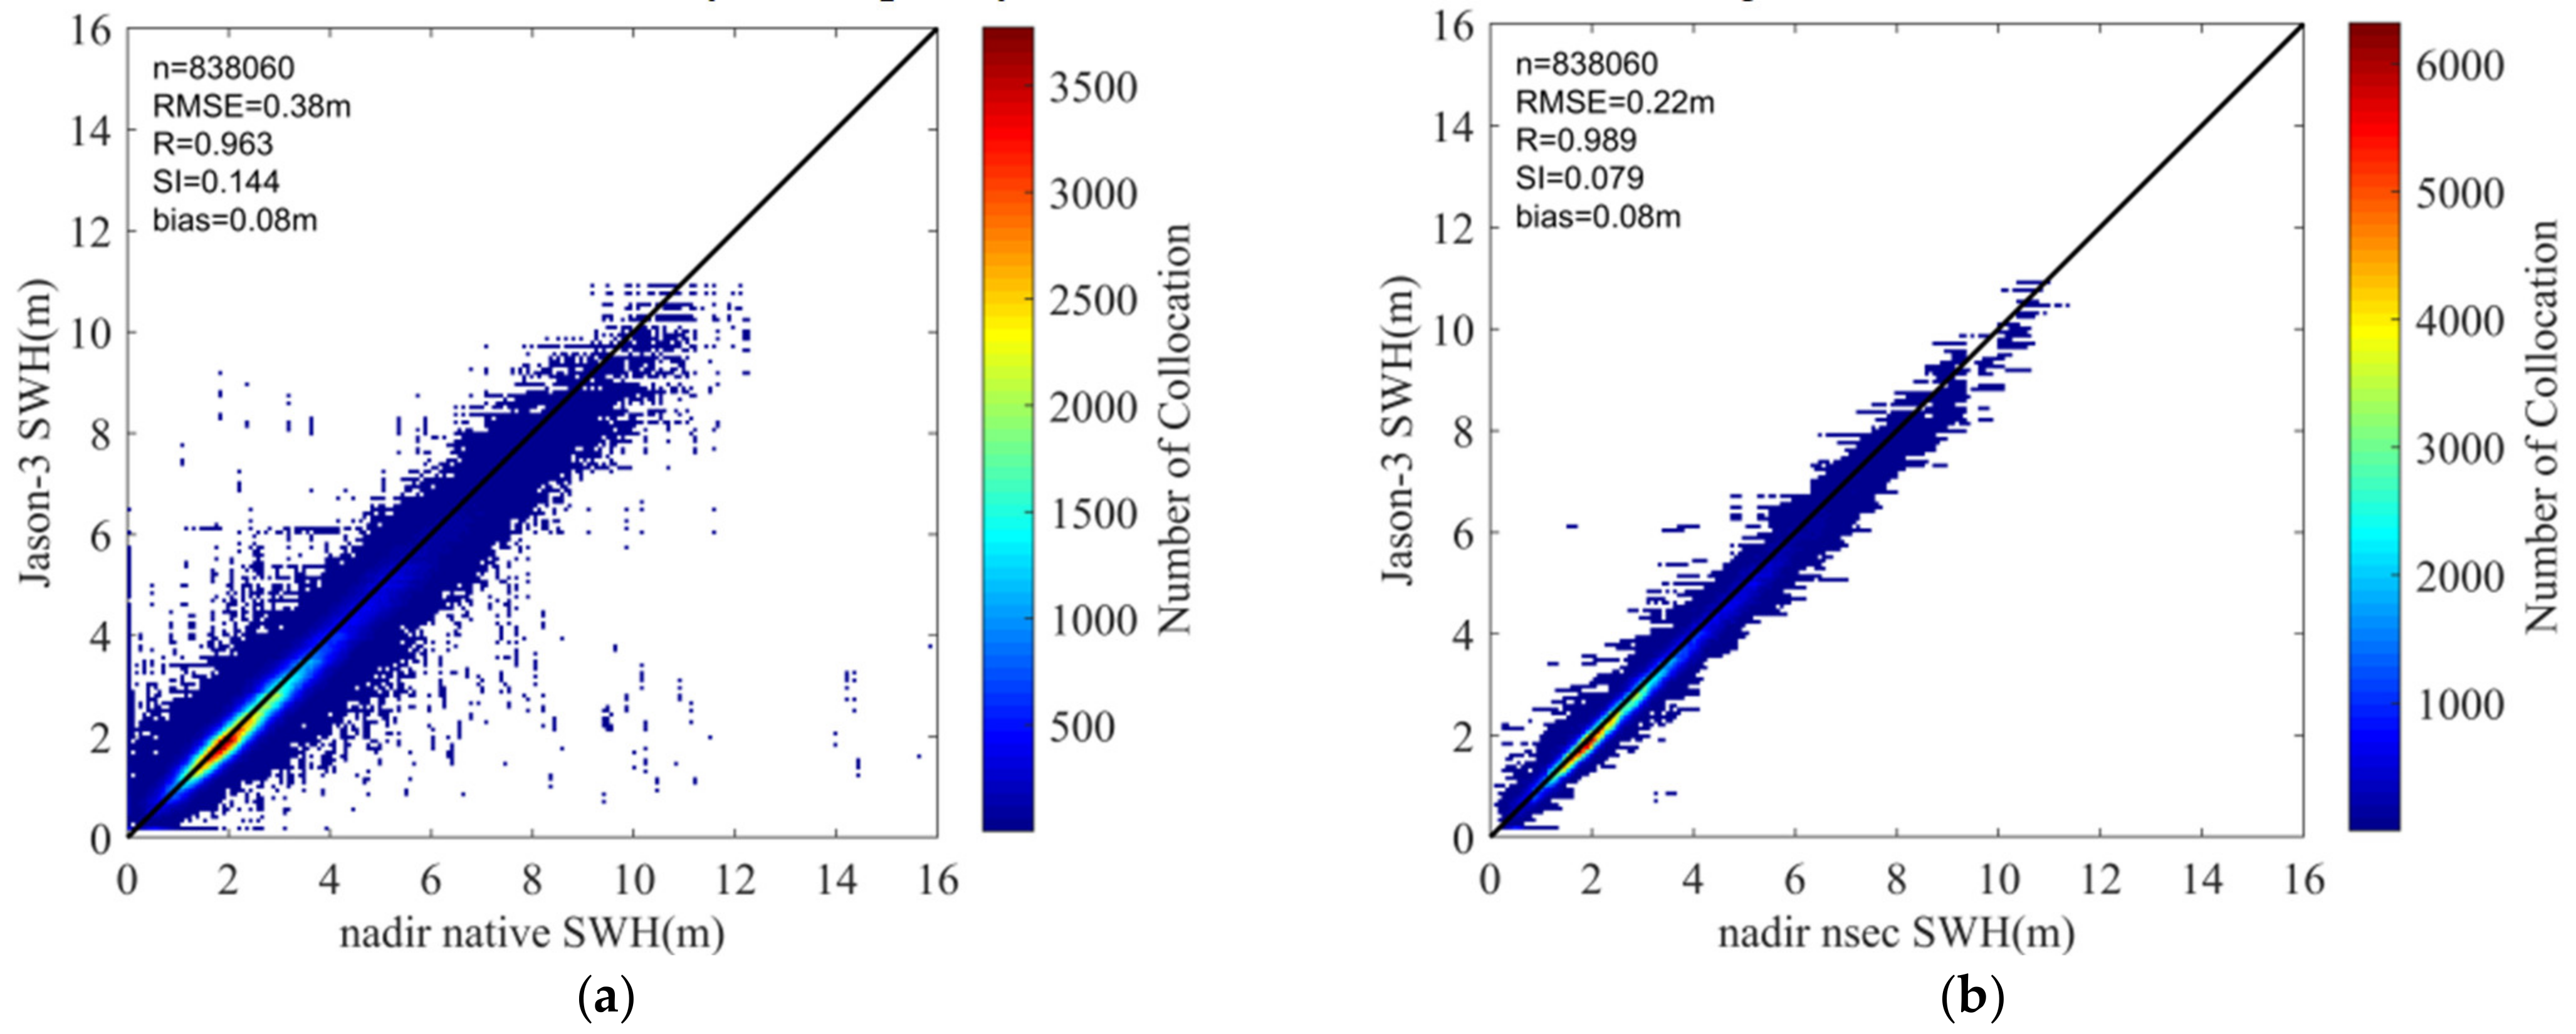
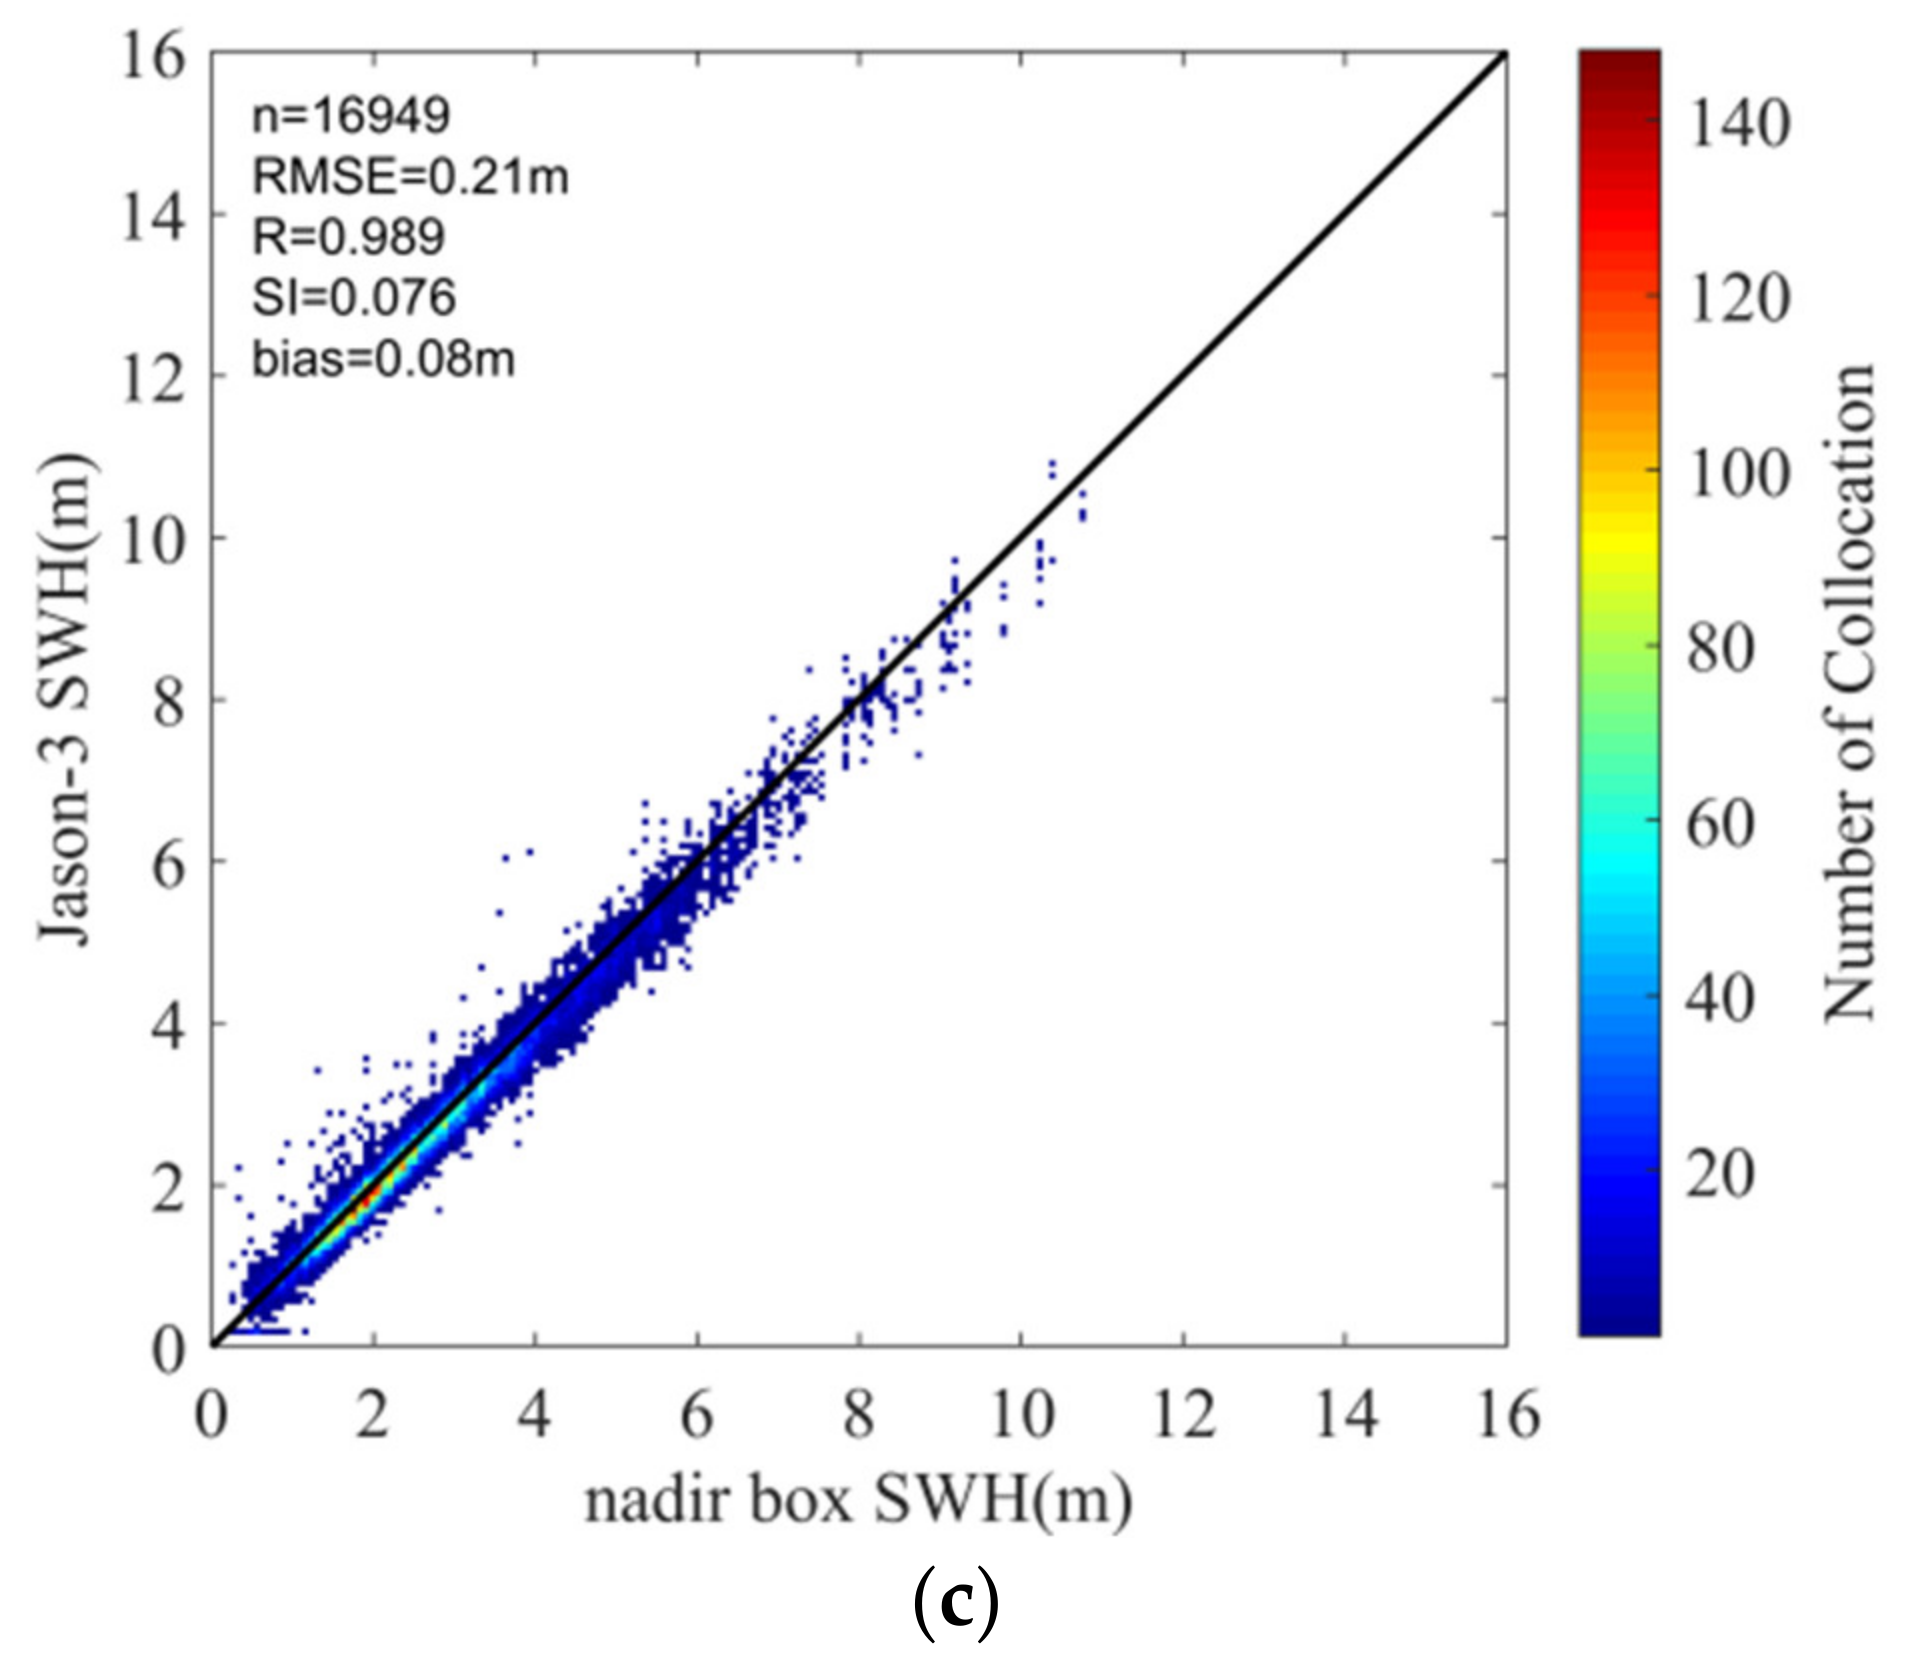
3.2. Comparison with Jason-3 Altimeter

In order to make up for the lack of evaluation of nadir SWH data in global ocean without buoy data, the accuracy of nadir SWH data are compared to SWH data of Jason 3 altimeter. As similar as buoy data, the temporal and spatial scales are also 30 min and 25 km. As the quality control of altimeter data has been carried out, the influence of sea ice or land has been eliminated and the abnormal wave high value is eliminated, there is no quality control treatment for the nadir SWH data. As shown in Figure 6, the location of matching data between SWIM nadir box and the Jason-3 altimeter SWH data shows that there are more matching results of Jason-3 altimeter than NDBC buoy, and they are uniformly distributed in the global ocean. This makes the results of data accuracy assessment more representative.
The matching results of the three kinds of SWIM nadir SWH and Jason-3 altimeter data are shown in Figure 7. Figure 7a–c, respectively, correspond to the comparison results with nadir native, nadir nsec and nadir box SWH data. Like the accuracy assessment results based on buoy data, the accuracy of nadir native SWH data is worse than the other two kinds of nadir SWH data. The RMSE of nadir native SWH data is 0.38 m, and the quality of nadir nsec SWH data after smoothing is greatly improved. The RMSE is reduced from 0.38 m to 0.22 m. The RMSE and bias of box SWH data are 0.21 and 0.08 m, respectively. The quality of box SWH data is best among the three.
The variation of SWIM nadir box SWH data accuracy with wave height is also evaluated by the comparison between nadir SWH and Jason-3 data in the bin of 1 m. The results are shown in Figure 8a, and the numbers of each part of the matching result are shown in Figure 8b. It can be seen that the accuracy of nadir box SWH data firstly increases and then decreases with the increasing of wave height. In general, the accuracy of the box SWH data decreases as the wave height increases. However, the RSME is below 0.5 m and was far better than that of NDBC buoy.

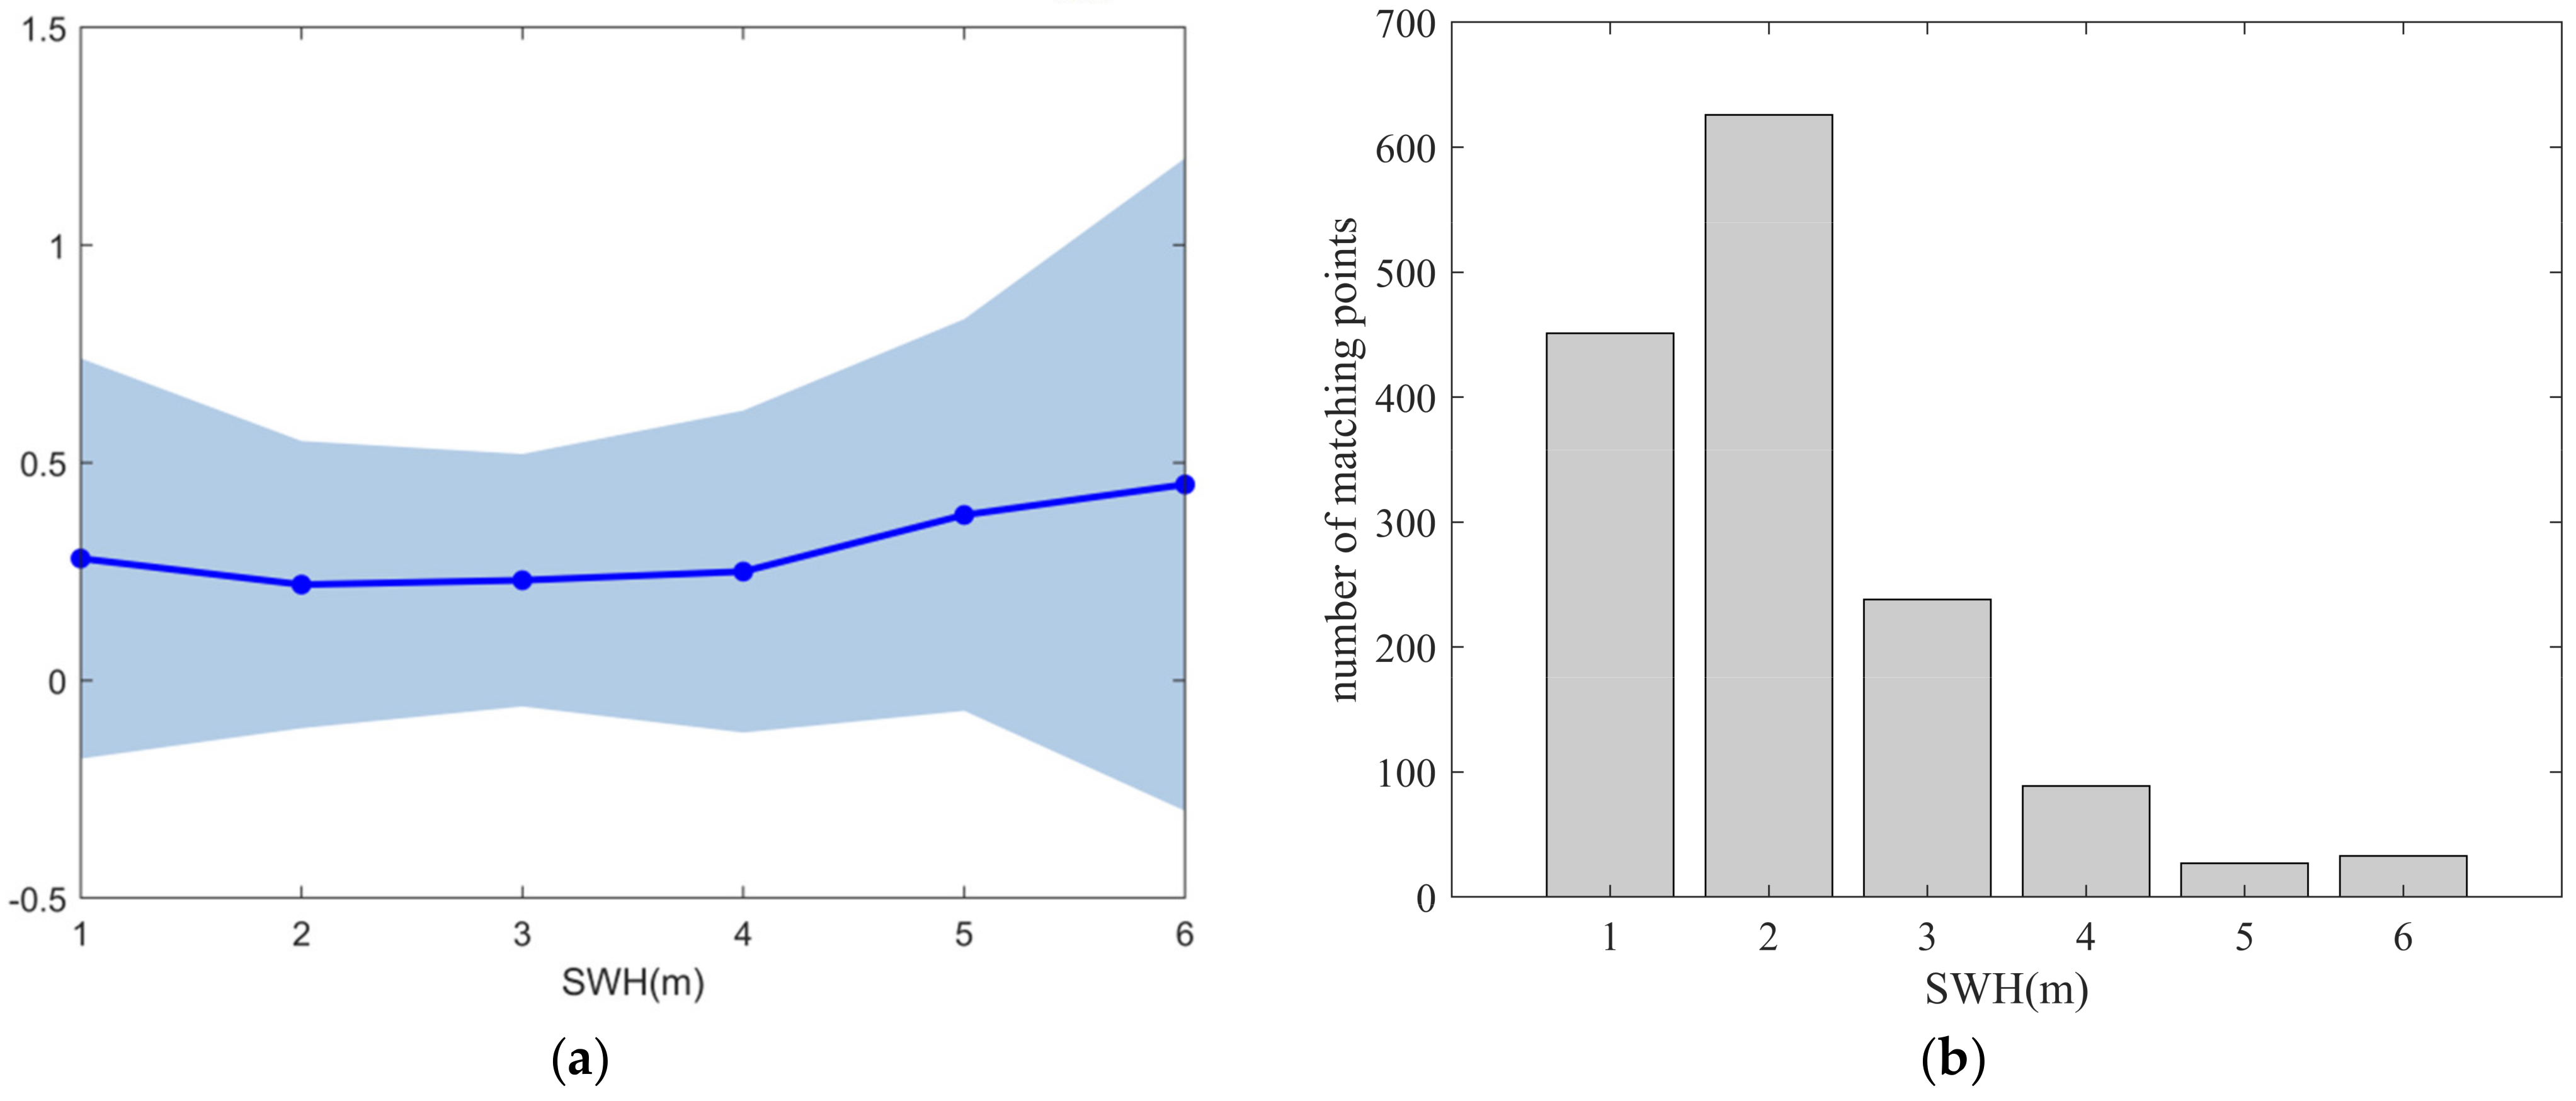
4. Off-nadir SWIM Wave Parameter Accuracy Evaluation

The SWIM can generate four kinds of wave spectrum data in each box region (70 × 90 km), which are wave spectrum data based on the beam of 6°, 8° and 10° and wave spectrum data of the combination of three spectral beams. The wave parameters generated by each wave spectrum include significant wave height, dominant wavelength, dominant direction, etc. In this study, the accuracy assessment of ocean wave parameters is mainly divided into the accuracy assessment of SWH (Section 4.1) and dominant direction (Section 4.2) of off-nadir wave spectrum.

4.1. Comparison of SWH with NDBC Buoy and Jason-3 Altimeter

The data processing algorithm for SWIM spectrometer was updated in June 2020. Therefore, the accuracy assessment is carried out, respectively, for the data from August 2019 to June 2020 and after June 2020. Firstly, quality control of off-nadir wave spectrum SWH data is conducted. Off-nadir SWIM wave spectrum SWH data with land or sea ice identification of non-zero should be eliminated, as well as the abnormal SWH data which are greater than 16 m. Secondly, off-nadir SWIM data are self-corrected. The standard deviation of the wave spectrum SWH generated by three different single beams is calculated for the same box region, and the off-nadir SWH data with the maximum error are eliminated when the standard deviation is greater than 2 m. Furthermore, the off-nadir wave spectrum SWH is matched with NDBC buoy and Jason-3 data by the same method as the comparison of nadir SWH data. Finally, the error statistical parameters are analyzed. The results show that the accuracy of off-nadir wave spectrum SWH data before data update in June 2020 is less than that after data updating. The matching data are corrected by fitting the linear regression equation. The linear regression equation and errors after correction are shown in Table 1.
The data accuracy of off-nadir SWH is improved after linear regression correction. For data matching with NDBC buoys, the bias of 10° wave spectrum SWH decreases by 48.4%, while the bias of the other three decreases by more than 60%. The RMSE of 10° wave spectrum SWH data improves by 24%. The highest decrease was 6° which is improved by 51.5%. For data matching with Jason-3, the minimum accuracy improvement is 10° wave spectrum SWH data, and the bias is improved by 36.7%, and the RMSE is improved by 20%. The highest accuracy improvement was 6° wave spectrum SWH data; the bias is improved by 54.9%, and the RMSE is improved by 38.7%. Therefore, it can be considered that the linear regression equation for correction is effective to improve the data accuracy.
For the data after June 2020, the matching data are corrected by the linear regression correction, and one can also find that the data accuracy is significantly improved. Matching results with buoy and altimeter are shown in Figure 9 and Figure 10, respectively.
As can be seen from Figure 9, the data accuracy becomes better after linear regression correction. The bias of all four kinds of off-nadir wave spectrum SWH data is between 0.37–0.40 m, and the RMSE is between 0.52–0.55 m. It should be noted that the largest decrease of bias and RMSE after linear regression correction is about 43.1% and 31.8%, respectively, which is less than that of the data before June 2020. The possible reason for this situation is that the accuracy of the original off-nadir wave spectrum SWH data after June 2020 has been improved.
It can be seen from Figure 10 that, similar to the matching with buoy result, the matching with Jason-3 altimeter data accuracy after linear regression correction is also improved to a certain extent. The bias value is between 0.21 and 0.30 m, and the maximum increase was 39.5%. The RMSE ranges from 0.28 m to 0.44 m, with a maximum increase of 30%. Because the matching result with Jason-3 altimeter is more accurate than the matching result with NDBC buoy, the accuracy improvement of the matching with Jason-3 data after linear regression correction is smaller than with NDBC buoy.
In order to analyze the variation of wave spectrum SWH data accuracy with time, the accuracy of off-nadir SWIM wave spectrum SWH data matching with Jason-3 after linear regression correction are evaluated month by month, and the monthly bias and RMSE are calculated. The results are shown in Figure 11.
It can be seen that the accuracy stability of 6° wave spectrum SWH data is the worst, and the standard deviations of its bias and RMSE are 0.20 and 0.40 m, respectively. The accuracy stability of 10° wave spectrum is the best; the standard deviations of bias and RMSE are 0.10 and 0.18 m, respectively. The precision stability of combined wave spectrum is roughly consistent with that of 10° wave spectrum. Secondly, from the perspective of time sequence, the data accuracies in November 2019 and March 2020 are the worst, while the data accuracy gradually improves after May 2020, which confirms the improvement of the accuracy after the data update in June 2020.
The accuracy evaluation of off-nadir wave spectrum SWH data is carried out according to wave height in the bin of 1 m. Here, 10° wave spectrum SWH data with good consistency before and after data update was selected for matching analysis with Jason-3 SWH data. The comparison results are shown in Figure 12.
It can be seen from Figure 12 that the data accuracy of wave spectrum SWH data decreases with the increasing of wave height. When the wave spectrum SWH is within the range of 0~1 m, the data accuracy is best, and the bias and RMSE are 0.24 and 0.29 m, respectively. When the wave height is above 7 m, the data accuracy is poor due to the few matched data.
It should be noted that the error analysis of different wave height ranges in here and in Section 3 are all based on the matching results of compared with NDBC buoy or Jason-3 altimeter. The numbers of matching points in each wave height interval are not similar, and a small number of matching points will result in a large deviation between the compared data accuracy and the real SWIM SWH data accuracy. Thus, this work can only assess that the accuracy of the SWIM nadir or wave spectrum SWH in some wave height ranges with relatively large amount of matching data. It cannot be easily assumed that the SWIM SWH data in some wave height intervals with poor error parameters are authentically worse than others.

4.2. Comparison of Dominant Direction with NDBC Buoy

The innovation of SWIM is that it can provide two-dimensional wave spectrum and provide not only the wave height information but also the wavelength and wave direction information. The accuracy of the dominant wave direction data of SWIM wave spectrum is evaluated by wave direction data provided by NDBC buoy in this study. The specific matching process is similar to that of SWH data assessment. The wave direction data provided by the NDBC buoy are between 0 and 360°, while the dominant wave direction data provided by the SWIM spectrometer are between 0 and 180°. There are two possibilities for the actual propagation direction of SWIM data. Therefore, the differences of dominant wave direction between SWIM and NDBC buoy data are restricted to no more than 90° during the data matching. The comparisons of dominant wave direction between SWIM wave spectrum and NDBC data are shown in Figure 13.
It can be seen from Figure 13 that the RMSE of all kinds of off-nadir SWIM wave spectrum dominant wave directions are above 40°, and the bias was above 30°. The comparisons of different off-nadir wave spectrum show that the accuracy of 10° wave spectrum is better than that of the other three, and its RMSE and bias are 41.79° and 30.72°, respectively.

5. Conclusions

Since CFOSAT’s successful launch in 2018, SWIM has captured more than two years of global ocean wave observations. In this study, NDBC buoy and Jason-3 altimeter data are used to evaluate the accuracy of L2 product data of SWIM spectrometer from August 2019 to September 2020, including the evaluation of nadir SWH data and off-nadir wave parameters such as SWH and dominant wave direction of four different (6°, 8°, 10° beam and combination) off-nadir wave spectrums. The main conclusions are as follows:
(1)
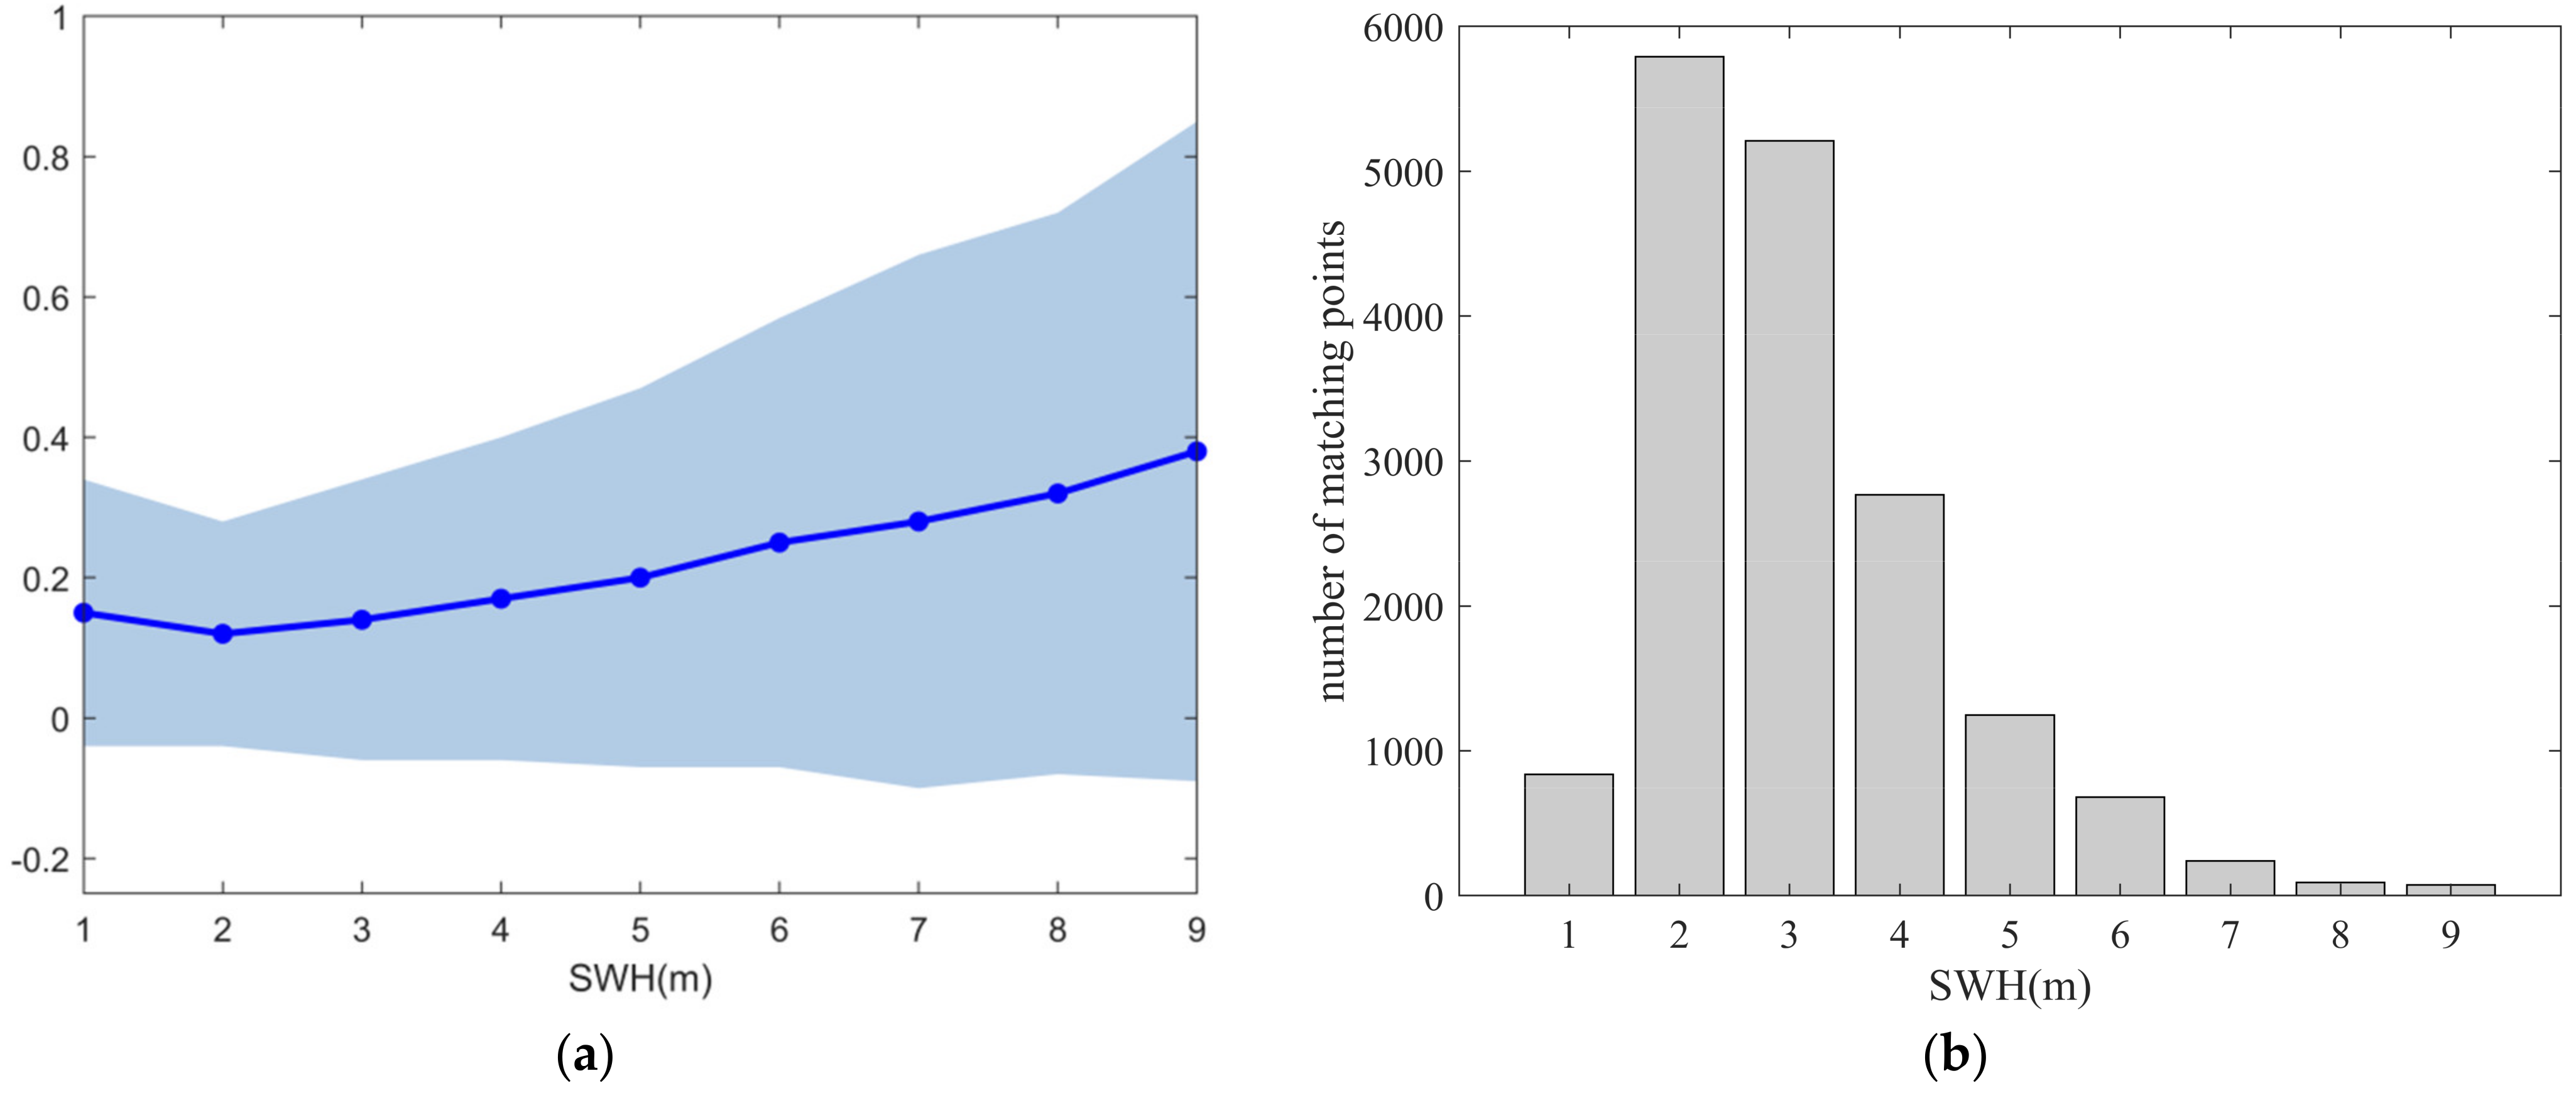
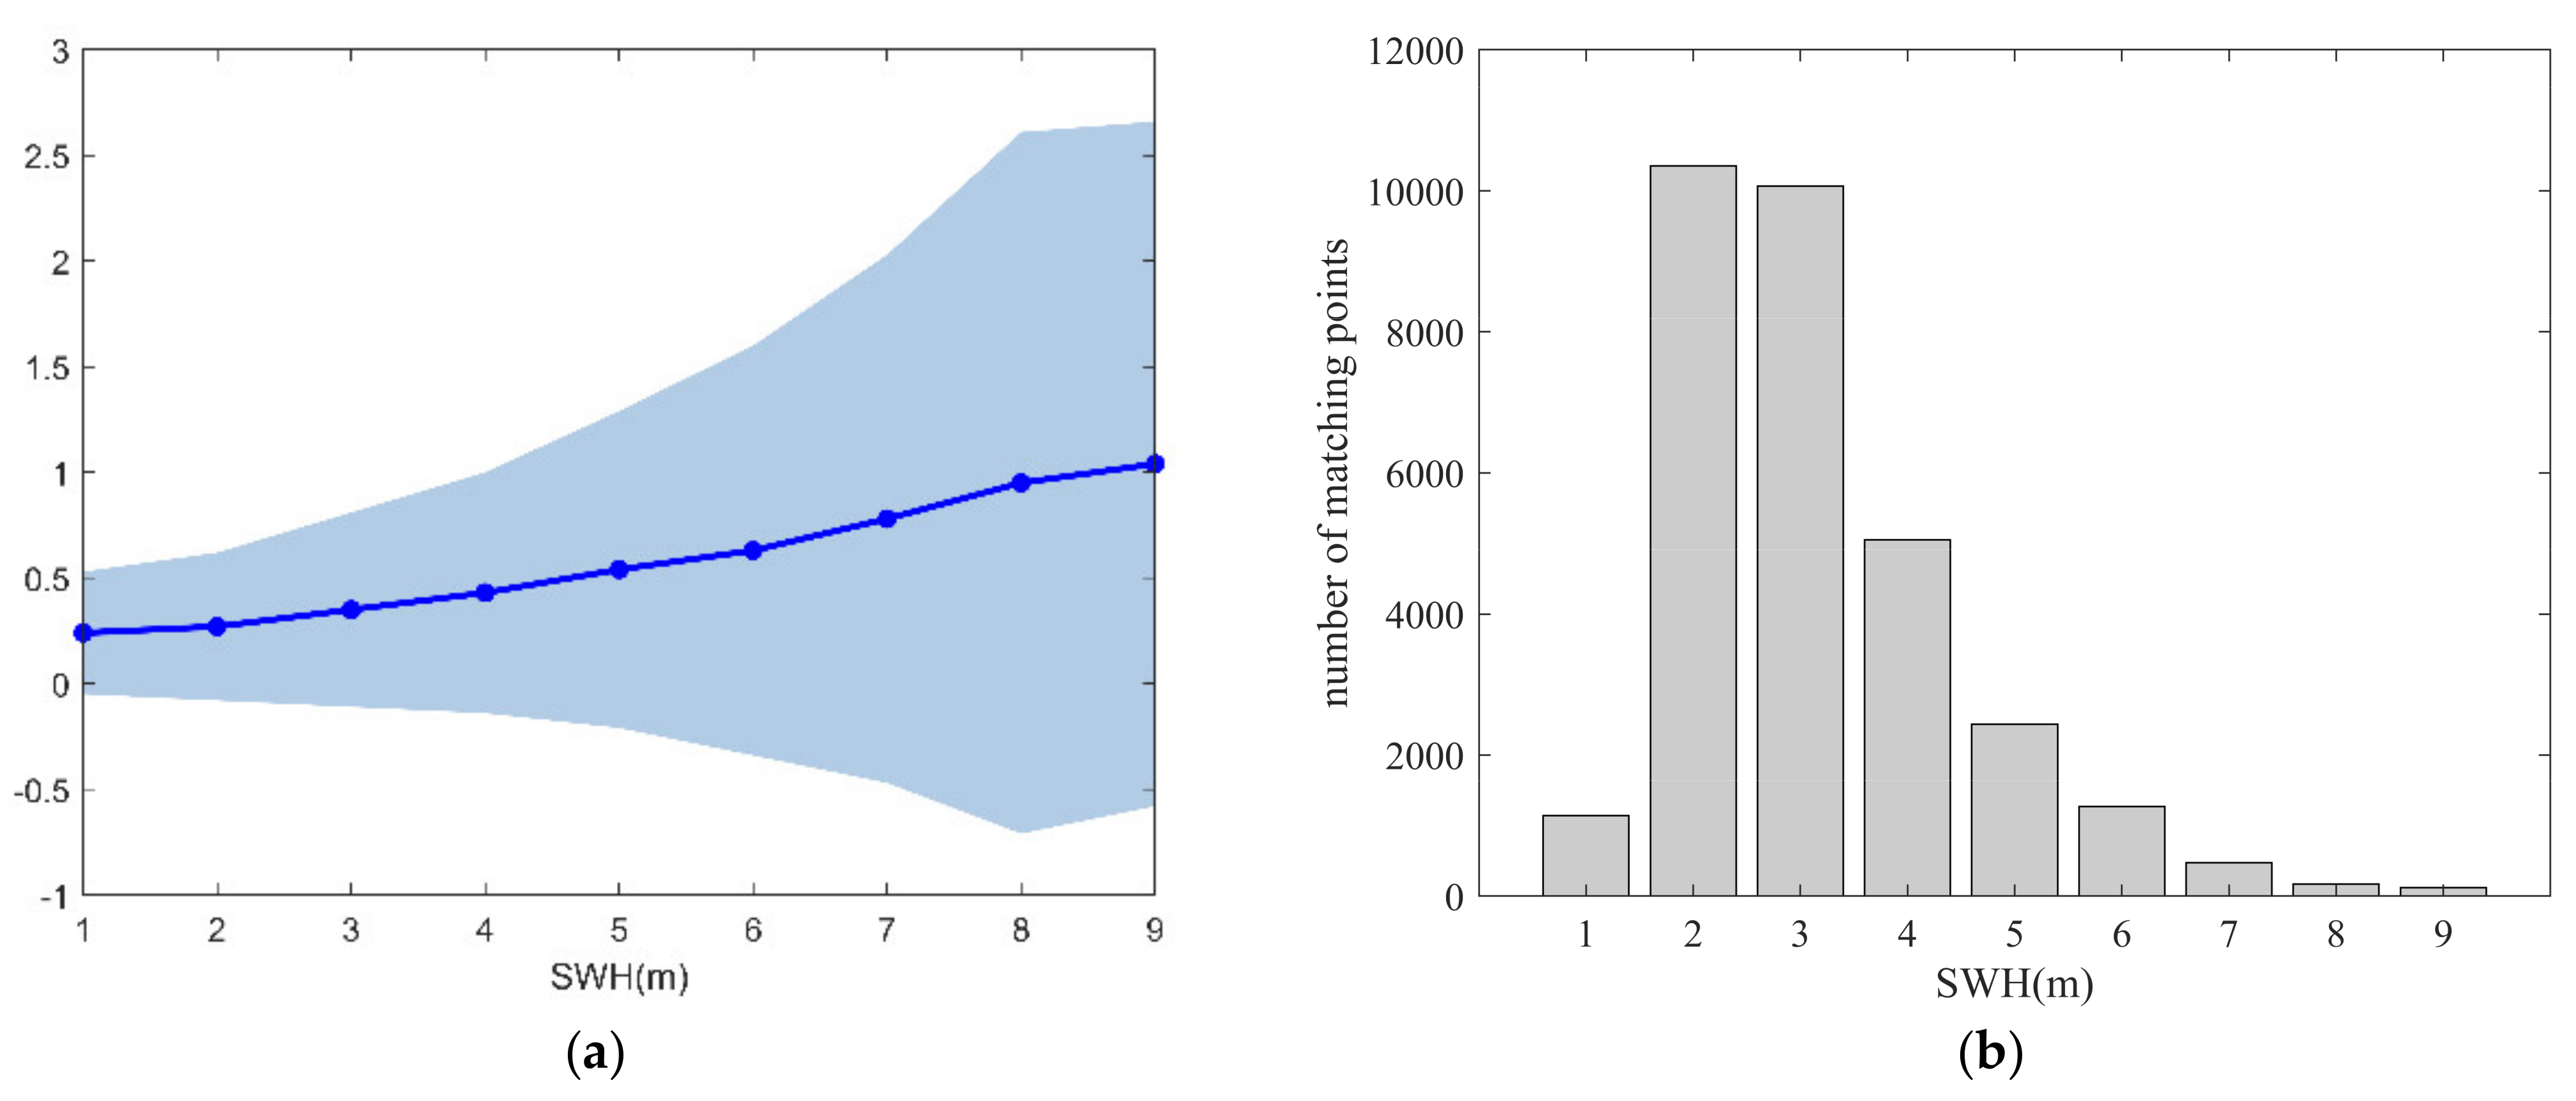
For SWIM nadir SWH data, the accuracy of nsec and box data is better than that of native data. The accuracy of box SWH data is further promoted after quality control, and the RMSE are 0.39 and 0.21 m compared with NDBC buoy and Jason-3, respectively. The analysis of nadir beam SWH in different wave height by the bin of 1 m shows that the precision increases first and then decreases with the increasing of wave height.
(2)
For SWIM off-nadir wave spectrum parameters, the data accuracy before June 2020 is less than that after June 2020. After linear regression correction, the accuracy is greatly improved. The maximum increases of bias and RMSE of matching with buoy data are 64.2% and 51.5%, respectively, and the maximum decreases of bias and RMSE of matching with Jason-3 data are 54.9% and 39.7%, respectively. For the off-nadir wave spectrum SWH data after June 2020, the best result compared with buoy is 10° wave spectrum, and its bias and RMSE are 0.37 and 0.52 m, respectively. The best result compared with Jason-3 is also 10° wave spectrum, and its bias and RMSE were 0.21 and 0.28 m, respectively. The evaluation of wave spectrum SWH in different time periods shows that the SWH precision of 6° and 8° beam wave spectrum is significantly improved after the update of SWIM L2 product in June 2020, and 10° wave spectrum SWH precision is still the best. The analysis results of 10° beam wave spectrum SWH in different wave heights by the bin of 1 m show that the error increases with the increasing of SWH. The results of the accuracy evaluation of the dominant wave direction based on the buoy data show that the RMSEs of the dominant wave direction of all wave spectra are greater than 40° relatively.
In summary, SWIM’s L2 data products show that the nadir SWH data have excellent high precision, which is comparable to the traditional satellite altimeter. For the parameters of off-nadir wave spectra, the accuracy of SWH was not very good before June 2020 and can be improved by the linear regression correction. After data acquisition algorithm update in June 2020, the accuracy of off-nadir wave spectrums is improved obviously. This indicated that the new algorithm can be used sequentially in the future, and the data before June 2020 should be updated with this algorithm. It can be predicted that when the data before June 2020 is updated with the new algorithm, the data accuracy will be greatly improved.

Author Contributions

Conceptualization, G.L. and J.Y.; formal analysis, G.L., J.Y. and J.W.; funding acquisition, J.Y.; investigation, G.L., J.Y. and J.W.; methodology, J.Y.; validation, G.L. and J.Y.; writing—original draft, G.L.; writing—review and editing, J.Y. All authors have read and agreed to the published version of the manuscript.

Funding

This research was funded by National Key R&D Program of China (grant number 2016YFC1401800) and the National Natural Science Foundation of China (No. 51839002).

Data Availability Statement

Publicly available datasets were analyzed in this study. The CFOSAT SWIM and Jason-3 data can be download through AVISO+ Products FTP website (ftp://ftp-access.aviso.altimetry.fr). The NDBC buoy data can be download from National Data Buoy Center (NDBC) of National Oceanic and Atmospheric Administration (NOAA) (https://www.ndbc.noaa.gov/data/).

Acknowledgments

The authors would like to thank CNES AVISO for the distribution of the CFOSAT SWIM and Jason-3 data, the NOAA for the distribution of NDBC buoy data.

Conflicts of Interest

The authors declare no conflict of interest.

References

  1. Timmermans, B.W.; Gommenginger, C.P.; Dodet, G.; Bidlot, J.R. Global Wave Height Trends and Variability from New Multimission Satellite Altimeter Products, Reanalyses, and Wave Buoys. Geophys. Res. Lett. 2020, 47, e2019GL086880. [Google Scholar] [CrossRef]
  2. Ribal, A.; Young, I.R. 33 years of globally calibrated wave height and wind speed data based on altimeter observations. Sci. Data 2019, 6, 77. [Google Scholar] [CrossRef] [PubMed] [Green Version]
  3. Liu, X.; Yang, Q.; Wang, S.; Zhou, Y. Retrieval of Ocean Wave Parameters Using Envisat Advanced Synthetic Aperture Radar Data and Its Verification Analysis. J. Phys. Conf. Ser. 2020, 1631, 012129. [Google Scholar] [CrossRef]
  4. Ren, L.; Yang, J.; Zheng, G.; Wang, J. A joint method to retrieve directional ocean wave spectra from SAR and wave spectrometer data. Chin. J. Oceanol. Limn. 2016, 34, 847–858. [Google Scholar] [CrossRef]
  5. Hauser, D.; Tourain, C.; Lachiver, J.M. CFOSAT: A new mission in orbit to observe simultaneously wind and waves at the ocean surface. Space Res. Today 2019, 206, 15–21. [Google Scholar]
  6. Hauser, D.; Tison, C.; Amiot, T.; Delaye, L.; Corcoral, N.; Castillan, P. SWIM: The first spaceborne wave scatterometer. IEEE Trans. Geosci. Remote Sens. 2017, 55, 3000–3014. [Google Scholar]
  7. Zieger, S.; Vinoth, J.; Young, I.R. Joint calibration of multiplatform altimeter measurements of wind speed and wave height over the past 20 years. J. Atmos. Ocean Tech. 2009, 26, 2549–2564. [Google Scholar] [CrossRef]
  8. Durrant, T.H.; Greenslade, D.J.M.; Simmonds, I. Validation of Jason-1 and Envisat remotely sensed wave heights. J. Atmos. Ocean Tech. 2009, 26, 123–134. [Google Scholar] [CrossRef]
  9. Chen, C.; Zhu, J.; Lin, M.; Zhao, Y.; Wang, H.; Wang, J. Validation of the Significant Wave Height Product of HY-2 Altimeter. Remote Sens. 2017, 9, 1016. [Google Scholar] [CrossRef] [Green Version]
  10. Yang, J.; Zhang, J.; Jia, Y.; Fan, C.; Cui, W. Validation of sentinel-3a/3b and Jason-3 altimeter wind speeds and significant wave heights using buoy and ASCAT data. Remote Sens. 2020, 12, 2079. [Google Scholar] [CrossRef]
  11. Le Merle, E.; Hauser, D.; Tison, C. Directional wave spectra at the regional scale with the KuROS airborne radar: Comparisons with models. Ocean. Dynam. 2019, 69, 679–699. [Google Scholar] [CrossRef] [Green Version]
  12. Shao, W.Z.; Li, X.F.; Sun, J. Ocean Wave Parameters Retrieval from TerraSAR-X Images Validated against Buoy Measurements and Model Results. Remote Sens. 2015, 7, 12815–12828. [Google Scholar] [CrossRef] [Green Version]
  13. Xu, Y.; Liu, J.; Xie, L.; Sun, C.; Liu, J.; Li, J.; Di, X. China-France oceanography satellite (CFOSAT) simultaneously observes the typhoon-induced wind and wave fields. Acta Oceanol. Sin. 2019, 38, 158–161. [Google Scholar] [CrossRef]
  14. Stammer, D.; Cazenave, A. Satellite Altimetry over Oceans and Land Surfaces, 1st ed.; CRC Press: Boca Raton, FL, USA, 2017; pp. 418–420. [Google Scholar]
  15. Monaldo, F. Expected differences between buoy and radar altimeter estimates of wind speed and significant wave height and their implications on buoy-altimeter comparisons. J. Geophys. Res. 1988, 93, 2285–2302. [Google Scholar] [CrossRef]
Figure 1. Comparison of three kinds of nadir Significant Wave Height (SWH) data.
Remotesensing 13 00887 g001
Figure 2. Diagram of locations of different SWH data.
Remotesensing 13 00887 g002
Figure 3. Location of National Data Buoy Center (NDBC) buoy used in the study.
Remotesensing 13 00887 g003
Figure 4. Comparison between nadir SWH and NDBC buoy data: (a) native data, (b) nsec data, (c) box data without quality control, (d) box data with quality control index of 100% and (e) box data with quality control index of more than 1%.
Remotesensing 13 00887 g004aRemotesensing 13 00887 g004b
Figure 5. Comparison between nadir box SWH and NDBC buoy data with quality control in the bin of 1 m: (a) bias and RMSE and (b) histogram of matching data.
Remotesensing 13 00887 g005
Figure 6. Location of matching data between Jason-3 altimeter and SWIM nadir box SWH data.
Remotesensing 13 00887 g006
Figure 7. Comparisons between nadir SWH and Jason-3 altimeter data: (a) native data, (b) nsec data and (c) box data.
Remotesensing 13 00887 g007aRemotesensing 13 00887 g007b
Figure 8. Comparison between nadir box SWH and Jason-3 data in the bin of 1 m: (a) bias and RMSE and (b) histogram of matching data.
Remotesensing 13 00887 g008
Figure 9. Comparisons between off-nadir SWIM SWH and NDBC buoy data after June 2020: (a) 6° beam, (b) 8° beam, (c) 10° beam and (d) combination of three beams.
Remotesensing 13 00887 g009
Figure 10. Wave spectrum SWH from Jul. to Sep. 2020 compared with Jason-3: (a) 6° wave spectrum, (b) 8° wave spectrum, (c) 10° wave spectrum and (d) combined wave spectrum.
Remotesensing 13 00887 g010
Figure 11. Monthly biases and RMSEs of off-nadir SWIM SWH data compared to Jason-3 data: (a) 6° beam, (b) 8° beam, (c) 10° beam and (d) combination of three beams.
Remotesensing 13 00887 g011
Figure 12. Comparison between 10° wave spectrum SWH and Jason-3 data: (a) bias and RMSE and (b) histogram of matching data.
Remotesensing 13 00887 g012
Figure 13. Comparisons of dominant wave direction between SWIM and NDBC buoy data: (a) 6° beam, (b) 8° beam, (c) 10° beam and (d) combination of three beams.
Remotesensing 13 00887 g013
Table 1. Error parameters of off-nadir SWH data after linear regression correction.
BeamnEquation of Linear RegressionBiasRMSERSI
Comparison with
NDBC buoy
1114y = 1.02x − 1.700.67 m1.11 m0.5650.594
1076y = 0.91x − 1.030.58 m0.85 m0.6610.461
10°986y = 1.14x − 1.180.48 m0.95 m0.6570.508
combination929y = 1.10x − 1.600.53 m1.04 m0.6060.559
Comparison with
Jason-3
18,413y = 1.13x − 1.710.61 m1.00 m0.7340.367
18,143y = 1.03x − 1.080.55 m0.87 m0.7870.320
10°17,745y = 1.15x − 0.960.38 m0.64 m0.8850.235
combination17,543y = 1.15x − 1.480.45 m0.70 m0.8580.260
Publisher’s Note: MDPI stays neutral with regard to jurisdictional claims in published maps and institutional affiliations.

