Article

The Influence of ENSO and MJO on Drought in Different Ecological Geographic Regions in China

School of Geomatics and Urban Spatial Informatics, Beijing University of Civil Engineering and Architecture, Beijing 102616, China
*
Author to whom correspondence should be addressed.
Remote Sens. 2021, 13(5), 875; https://doi.org/10.3390/rs13050875
Submission received: 14 January 2021 / Revised: 19 February 2021 / Accepted: 23 February 2021 / Published: 26 February 2021

Abstract

:
Mastering the spatial and temporal differences of ENSO (EI Niño-Southern Oscillation) and MJO (Madden–Julian Oscillation) and their influence on drought is very important for accurately monitoring and forecasting drought. In this study, spatiotemporal characteristics and variability of the impact of ENSO and MJO on drought were analyzed from the perspectives of meteorological drought and agricultural drought through temporal and spatial correlation analyses of China’s 48 eco-geographical regions. The results show a strong correlation between drought and ENSO and MJO in general. The spatial correlation coefficients are different, and the response of extreme events varies in different regions. The influence of ENSO and MJO on agricultural drought is higher than that on meteorological drought. ENSO and MJO have a considerable influence on agricultural drought in regions such as the Qinghai-Tibet Plateau and Xinjiang, with the highest correlation coefficient of 0.72. A significant influence of ENSO and MJO on meteorological drought was found in the Jiangnan region with the highest correlation coefficient of 0.40. In addition, agricultural drought shows a significant time lag in response to ENSO events. When the lag time is six months, the time series presents the highest correlation coefficient with the mean value of the correlation coefficient reaching 0.38 and the maximum value reaching 0.75. This research is of great significance for understanding the spatiotemporal correlation between climate patterns and drought on a large regional scale and it provides further insights into the teleconnection mechanisms of drought.

Graphical Abstract

1. Introduction

Drought ranks first among natural disasters in terms of frequency, duration, coverage and economic losses [1]. In recent years, under the background of global climate change, relevant studies have predicted that extreme disasters will occur frequently in the future [2,3]. As a frequent extreme disaster on land, drought severely affects the ecological environment, agricultural production, socioeconomic status and other aspects [4,5,6,7]. It is crucial to reduce the loss of drought and achieve the goal of sustainable development by exploring the teleconnection mechanism of drought and improving the level of monitoring and forecasting for it [8]. Several studies have indicated the correlation between ENSO (EI Niño-Southern Oscillation) and MJO (Madden–Julian Oscillation) and drought, but the characteristics and spatiotemporal differences of the correlation have not been systematically determined.
ENSO and MJO are typical oscillations affecting climate change. The El Niño phenomenon and Southern Oscillation are collectively known as ENSO. ENSO events increase the possibility of global extreme drought events [9], and it can change the frequency and intensity of drought [10]. ENSO cold and warm events lead to different rainfall distributions in different regions of the Philippines [11]. In Florida, the USA and Rio Grande do Sul, Brazil, El Niño causes below-normal agricultural reference index for drought (ARID) values [12]. The interaction between the MJO and ENSO [13] makes it necessary to study the correlation between the MJO and drought. Numerous studies worldwide have shown that the MJO leads to changes in rainfall, which is one of the main parameters underlying meteorological drought [14]. Furthermore, the MJO phase and amplitude activity play an important role in rainfall variability [15].
With the recent occurrence of ENSO warm and cold events, extreme weather disasters, such as drought and flood, have occurred in most parts of the world. Many researchers have explored and quantified the link between El Niño and precipitation by applying various methods. The influence of the ENSO on drought was confirmed in India by a correlation analysis of the ENSO index with the standard precipitation index (SPI) and the standardized precipitation evapotranspiration index (SPEI) using the nonlinear Granger causality [16], while empirical mode decomposition was applied in the Nile River Basin [17]. In the semi-arid region of Northern Chile, there is a negative correlation between the ENSO index and SPEI in spring and summer [18]. A similar negative correlation between the normalized difference vegetation index (NDVI) and ENSO was found in 87.3% of southern Africa during DJF (December–January–February) [19]. In addition, there was a time lag between dry-hot conditions and ENSO [19]. In the arid and semi-arid regions in Northeast Brazil and East Africa and arid to semi-arid subtropical regions, ENSO and drought were closely correlated in different periods with a certain degree of time lag [20,21,22]. In view of the MJO, most researchers have analyzed the influence of MJO on drought mainly by studying the correlation between it and rainfall. For example, in Indonesia and Katulampa, rainfall is obviously affected by MJO activity [15,23]. In summary, in different regions around the world, both ENSO and MJO have different degrees of impact on drought [24]. The correlation is complex and has not been studied systematically because of the different mechanisms of ENSO warm and cold events and the different phases and amplitudes of MJO.
China includes regions that are sensitive to climate change. The impact of ENSO and MJO on drought varies by the region of the country [25,26]. Under the influence of ENSO events, the precipitation in China is changed [27]. Summer, autumn and winter precipitation and annual precipitation were lower in the northern part of eastern China, while autumn precipitation in the southern part and winter precipitation in southeastern China apparently increased [28,29]. For most regions of Shanxi Province, the wavelet coherence between winter dry–wet conditions and ENSO was generally dominated by a negative multiscale relationship [30]. In southwestern China, there was a drier summer with less precipitation and it was more prone to drought after La Niña events [31]. However, the Poyang Lake basin is more likely to experience drought when there is an El Niño event [32]. Studies on the influence of MJO on China’s weather have indicated that MJO has a modulating effect on China’s precipitation process, showing that it is an important factor influencing precipitation [33,34]. Different MJO activity periods also lead to different precipitation characteristics in China [35]. Because China has multiple temperature–precipitation subdivisions, the spatiotemporal differences in the influences of ENSO and MJO on drought are more complicated. In summary, it is of great significance to study the influences of ENSO and MJO on drought in different regions of China and the characteristics and spatiotemporal differences of the correlations are important to further understand the mechanism of drought.
Drought is a state of surface water imbalance in which water supply cannot satisfy normal water demand [36]. The temporal and spatial characteristics of drought are complex. Normally, it is classified into meteorological drought, agricultural drought, hydro-drought and socioeconomic drought [37]. Among them, meteorological drought is the phenomenon of abnormal water shortage caused by the imbalance between precipitation and evaporation in a period. Agricultural drought refers to the growth and development of crops being inhibited due to water deficit during the growing season. Moreover, hydrological drought refers to the decrease of water storage in rivers and runoff or the lowering of water level in underground aquifers. Due to the economic and social development of water demand is increasing, water affecting production and consumption activities is called socioeconomic drought [38,39]. Drought is often quantified using drought indices, which have been constructed as the main indicators for monitoring the severity and spatial distribution of drought [40]. The existing drought indices can be divided according to the category and characteristic differences of drought. McKee et al. [41] proposed SPI, which is based on the standard deviation of actual measured precipitation relative to the distribution function of precipitation probability. Serrano et al. [42] proposed the SPEI, which replaces the precipitation with the difference between precipitation and evaporation during the calculation of the SPI. The Palmer drought severity index (PDSI), which is a classical index in meteorological drought monitoring, was proposed by considering various factors [43]. At the beginning of the 21st century, the self-calibrating Palmer drought severity index (SC-PDSI) was proposed on the basis of the PDSI [44]. Percentage of precipitation anomaly (Pa) is used to characterize precipitation over or under normal years in a given period. Furthermore, remote sensing drought monitoring indices have been established for the quantitative assessment of agricultural drought conditions. Among them, NDVI was proposed for monitoring drought using remotely sensed vegetation signals. The vegetation condition index (VCI) was proposed by Kogan based on NDVI. VCI considers vegetation condition variations caused by environmental change. It was found that VCI can better explain the relationship between vegetation conditions and drought [45,46]. Anomalous vegetation index (AVI) and enhanced vegetation index (EVI) are also drought indices based on vegetation conditions [47]. Additionally, the occurrence of drought can also cause changes in canopy temperature. The temperature condition index (TCI) was constructed using the land surface temperature (LST) [48]. The surface water supply index (SWSI) monitors hydrological drought [49]. Crop water stress indicator (CWSI) is used to monitor crop water stress [50]. Within these different kinds of drought indices, PDSI is universal in China and the multiscale properties of SPEI enable the identification of different drought types and effects on different systems. While VCI can well show the plant growth status and TCI is not limited by the plant growing season, both are considered as being able to better express agricultural drought. Therefore, we selected these indices for our research [51].
Taking eco-geographical regions into consideration, it is necessary to systematically analyze the spatiotemporal correlation of ENSO and MJO indices with drought indices from the perspective of meteorological drought and agricultural drought. The following research objectives are proposed in this study: (1) The characteristics and spatiotemporal differences of the influences of ENSO and MJO on drought were analyzed from the perspective of meteorological drought and agricultural drought in China. (2) The time lag of the agricultural drought response to the ENSO was investigated and quantified through time series analysis. This research can help to explore the mechanism of drought, thus providing a basis for accurate monitoring and predictions of drought and further improving drought management levels.

2. Materials and Methods

2.1. Study Area and Data

China is a vast country that spans a wide range of latitudes with large disparities in terrain, landforms and distance from the ocean in different areas, resulting in a wide variety of temperature and precipitation combinations [52]. Most parts of China have a monsoon climate. There are several temperature zones including tropics, subtropics, warm-temperate zones, moderate temperate zones, cold temperate zones and the Qinghai-Tibet Plateau region over China. In terms of dry and wet conditions, China can be divided into arid, semi-arid, semi-humid and humid regions. Therefore, based on temperature and precipitation, China can be divided into several ecological geographic regions. In Table 1, Roman numerals I–IX stand for cold temperate zone to the equatorial tropical zone. HI and HII stand for plateau sub-cold temperate and plateau temperate zones [53]. Due to the differences in various factors, the climate differences in various regions are obvious.

2.1.1. Basic and Meteorological Data

The eco-geographical region data were obtained from the Resource and Environment Science and Data Center (http://www.resdc.cn/data.aspx?DATAID=125 (accessed on 11 January 2021)) [54,55]. According to the combination of temperature and wet–dry condition differences, there are 48 eco-geographical regions in China. The indicators for the division of temperature zones are the number of days (d) and the accumulated temperature (°C) with temperature greater than or equal to 10 °C, the average temperature of the coldest month (°C) and the average temperature of the warmest month (°C). The indicator for the division of dry and wet conditions is the annual aridity and precipitation (mm) [53]. Meteorological data were derived from the China Meteorological Data Network (http://data.cma.cn/ (accessed on 11 January 2021)) [56]. The meteorological data include temperature, relative humidity, wind speed, sunshine data, precipitation and evaporation, which were from the China Surface Climate Data Diurnal Dataset (V3.0) produced by the National Meteorological Information Center and have undergone quality control. Additionally, as shown in Figure 1, the meteorological data from 577 meteorological stations that met the conditions were finally selected since there were several meteorological stations with missing data, such as in Tibet, Guizhou, Jiangxi, Zhejiang, the south-central part of Hebei and the western part of Inner Mongolia.

2.1.2. Remote Sensing Data

The daily observation values from 1980 to 2018 from the selected stations were used to calculate meteorological drought indices. The Advanced Very High Resolution Radiometer (AVHRR)–Health Product (VHP) set of global scales provided by the National Oceanic and Atmospheric Administration (NOAA) of America (ftp://ftp.star.nesdis.noaa.gov/pub/corp/scsb/wguo/data/Blended_VH_4km/ (accessed on 11 January 2021)) [57] was selected as the source of agricultural drought indices, including VCI and TCI data from 2006 to 2019. The spatial resolution of VCI and TCI is 4 km, and the temporal resolution is seven days. The monthly mean values of VCI and TCI were synthesized and clipped for the study area before being used for correlation analysis.
VCI is an index widely used in drought monitoring based on NDVI. NDVI is an index that quantifies vegetation by measuring the difference between near-infrared light (vegetation strongly reflected) and red light (vegetation absorption). Kogan et al. proposed TCI according to the principle that, when vegetation is subjected to water stress, the stomata of the leaves are closed to reduce transpiration, which leads to a decrease in the latent heat flux and an increase in the sensible heat flux in the vegetation canopy, resulting in an increase in land surface temperature that can reflect the energy flow and material exchange of the soil–vegetation–atmosphere system. The smaller are VCI and TCI, the more serious is the drought.
The expressions of V C I [58] and T C I [48] are as follows:
V C I = 100 × N D V I i N D V I min N D V I max N D V I min
where N D V I i is the NDVI value of the i period of a specific year and N D V I max and N D V I min are the maximum and minimum values of the NDVI in the i period of multiple years, respectively.
T C I i = 100 × L S T max L S T i L S T max L S T min
where T C I i is the temperature condition index of month i of the year, L S T i is the LST value of i month, and L S T max and L S T min are the maximum and minimum LST values of the corresponding month in multiple years, respectively.

2.1.3. Climatic Indices

Sea surface temperature (SST) data from the Niño 3.4 area were selected to characterize the ENSO phenomenon. The data were derived from the National Climate Center of China Meteorological Administration (https://cmdp.ncc-cma.net/pred/cn_enso.php?product=cn_enso_nino_indices (accessed on 11 January 2021)) [59]. Distribution of the Niño 3.4 index (three-month moving average) from 1980 to 2020 is shown in Figure 2. Trenberth [60] found that the area for monitoring should be in the Niño 3.4 area, which covers the range of 5°N–5°S, 170°W–120°W. The type of the ENSO event in the Niño 3.4 region is between the eastern and central types, and the influence of its sea surface temperature anomaly is also between the effects of the two types of indices.
The intensity of the MJO phenomenon is mainly characterized by the real-time multivariate MJO series (RMM) proposed by Wheeler et al., who divided the MJO into eight phases [61]. The MJO data were obtained from the National Climate Center of America (https://www.cpc.ncep.noaa.gov/products/precip/CWlink/MJO/mjo.shtml (accessed on 11 January 2021)) [62]. RMM is the most widely used MJO index, and a strong MJO corresponds to a RMM greater than or equal to 1, and vice versa [14].

2.2. Methods

2.2.1. Calculation of Drought Indices

In this study, the selected remote sensing drought indices include the monthly scale TCI and VCI from 2006 to 2019. The meteorological drought indices (PDSI, SC-PDSI and SPEI of 1-, 3-, 6-, 9- and 12-month scales) were constructed based on averaged monthly scale meteorological data during 1980–2018.
PDSI is a traditional drought index based on the soil water balance model [43]. SC-PDSI corrects the spatial incompatibility of PDSI by replacing its empirical constant with the dynamic calculated values of the study area. PDSI is constructed by establishing the water balance equation suitable for the climate first based on the water balance principle and calculating the water departure d :
d = P P ¯ = P ( α P E + β P R + γ P R O δ P L )
where P is the actual precipitation (mm), P ¯ is the precipitation under suitable climate conditions (mm), P E is the possible evapotranspiration (mm), P R is the possible soil water supply (mm), P R O is the soil possible runoff (mm) and P L is the soil possible water loss (mm). These values are calculated from precipitation (mm), temperature (°C) and available water holding capacity (AWC) (mm). α , β , γ , δ are the evapotranspiration coefficient, soil water supply coefficient, runoff coefficient and soil loss coefficient, respectively. Each region has four corresponding constant coefficient values every month.
SPEI is mainly used to express drought severity by the average deviation degree between precipitation and evapotranspiration. SPEI has multiple time scales. In this study, the 1-, 3-, 6-, 9- and 12-month scale SPEIs were calculated. In the SPEI generation process, the potential evapotranspiration is calculated by the Thornthwaite method and the difference D i between precipitation and evapotranspiration at various time scales is estimated according to the potential evapotranspiration. Then, the cumulative probability function density of the LOG distribution P is calculated. Finally, the data sequence is normalized to calculate the SPEI value corresponding to each value. The magnitude of S P E I can be defined by the following mathematical expression:
S P E I = S × ( ω c 0 + c 1 ω + c 1 ω 2 1 + d 1 ω + d 2 ω 2 + d 3 ω 3 )
where S = ± 1 , ω = 2 ln P and P is the value of the distribution probability calculated before. When P 0.5 , P = F ( x ) and S = 1 , while, when P > 0.5 , P = 1 F ( x ) and S = 1 . In Equation (4), c 0 , c 1 , c 2 , d 1 , d 2 and d 3 are constants.

2.2.2. Statistic and Spatiotemporal Analysis of Correlation

To study the correlation of ENSO and MJO with drought in different eco-geographical regions in China, we carried out an exploratory analysis on meteorological drought and agricultural drought. The variability in spatial and temporal correlations in different eco-geographical regions was studied, and the time-lag phenomenon of agricultural drought in response to ENSO events and its lag period were determined.

2.2.3. Spatiotemporal Analysis of Correlation

Due to the different data sources of remote sensing drought indices and meteorological drought indices, the data processing and analysis between sources and climate index methods are different. VCI and TCI were used in this study to characterize agricultural drought; they are global-scale raster data with a time scale of seven days and 1456 images from 2006 to 2019. Before analyzing the correlation, we performed batch clipping and calculated the monthly mean of remote sensing images in China. Then, the correlation coefficients between the remote sensing drought indices for each pixel and ENSO and MJO were calculated after extracting the remote sensing drought index value pixel by pixel. Finally, the time series of the mean values over the 48 eco-geographical regions were extracted by zonal statistics. To investigate the responses of agricultural drought after the period of the ENSO events, the time series of the Niño 3.4 index was shifted on the scale of 1–12 months. Spatial and temporal correlation analyses were used to explore whether there was a lag in the agricultural drought response to ENSO events and determine its lag time.
For the purpose of exploring the correlation between the meteorological drought and climate anomaly indices, the daily meteorological data of 577 stations from 1982 to 2018 were used to calculate the monthly average value. The PDSI, SC_PDSI and SPEI (with 1-, 3-, 6-, 9- and 12-month scales) were calculated based on the monthly meteorological data. The correlation coefficients between the meteorological drought indices and ENSO and MJO indices were calculated for each station. The results were spatially visualized and analyzed. Next, we extracted the mean values of meteorological drought indices for each of the 48 eco-geographical regions. The time series meteorological drought index values from 1982 to 2018 were constructed for comparative analysis with the series of ENSO and MJO. The correlations between the meteorological drought indices and ENSO and MJO were determined by spatial and temporal correlation analysis at 577 stations.

2.2.4. Zonal Statistics

The spatiotemporal characteristics of the correlations between the drought indices and ENSO and MJO were analyzed by zonal statistics. Based on zonal statistics, the maximum, minimum and mean values of the correlation coefficients were calculated for each eco-geographical region. Combining the statistical results and spatiotemporal analysis methods, we can further confirm the degree of influence of ENSO and MJO on both meteorological drought and agricultural drought and analyze their causes in various eco-geographical regions of China.

3. Result

3.1. Both ENSO and MJO Oscillations Influenced Drought in Various Ecological Geographical Regions

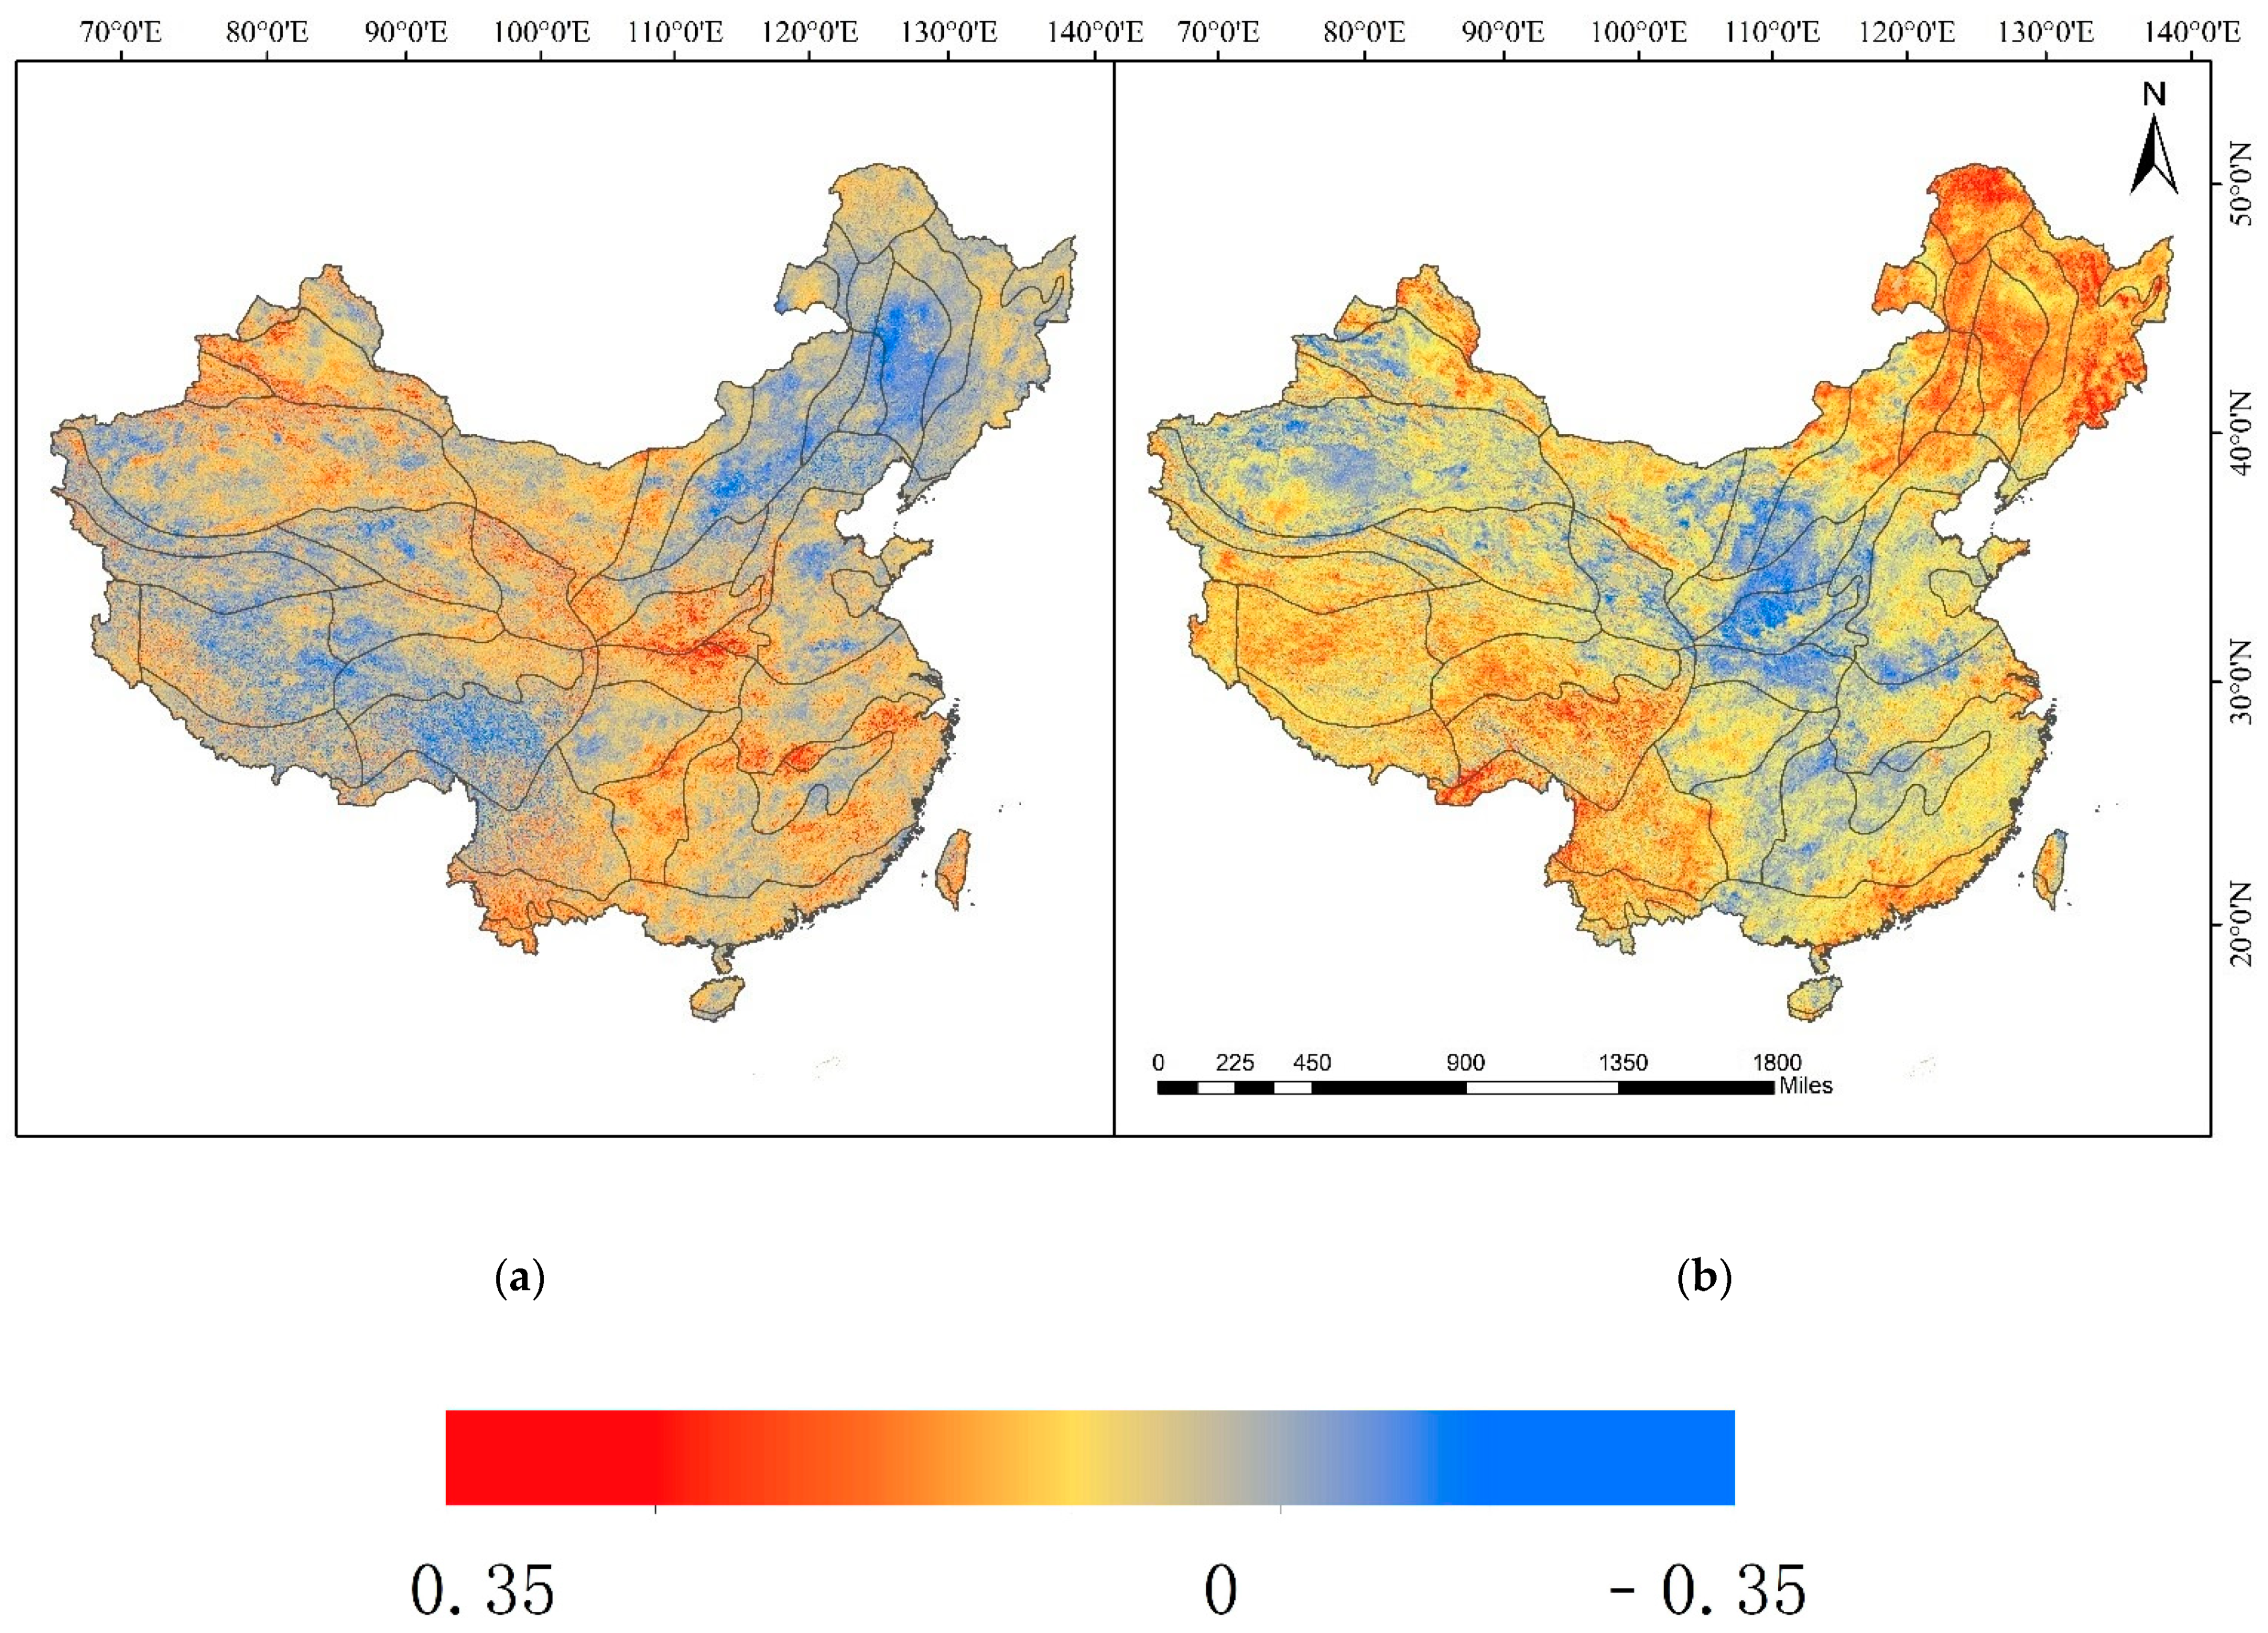
In general, there is a strong correlation between remote sensing drought indices and ENSO and MJO, which shows that ENSO and MJO have a significant impact on drought. The influences are relatively obvious in the Tibetan region, which has plateaus and mountains, the Southeastern Coastal Area and most of the central region in China. As shown in Figure 3a,b, Niño 3.4 and TCI in Tibet are positively correlated, but there is a negative correlation between Niño 3.4 and VCI. The maximum correlation coefficient between the remote sensing drought indices and Niño 3.4 is 0.72, and the maximum correlation coefficient between the remote sensing drought indices and RMM is 0.31. The MJO anomaly mainly affected the northeastern, western and central parts of China (Figure 4a,b). The spatial correlations between RMM and two different remote sensing drought indices are in the opposite conditions. For example, in northeast China, MJO is mainly negatively correlated with TCI but positively correlated with VCI. At the same time, the areas with high correlation between MJO and remote sensing drought indices are mostly distributed in humid and semi humid regions.
The selected remote sensing indices are based on different principles and data. TCI is based on LST, while VCI is based on NDVI. In addition, the topography and geomorphology of China are complex, and temperature zones which result in the climatic patterns vary considerably in different regions. This leads to various effects of ENSO and MJO on drought in different regions. By calculating and sorting the mean values of the correlation coefficients, the difference in spatial correlation between the Niño 3.4 index and VCI is mainly related to the temperature zones, dry–wet conditions of the region and vegetation coverage. The eastern part of China is mainly humid or semi-humid with excellent water supply, agricultural land and forest with high vegetation coverage [63]; therefore, it is mainly a positive correlation area. China’s arid or semi-arid regions are mainly negative correlation zones, especially in northwestern China, where there are mostly deserts and low vegetation coverage [64]. The correlation differences between Niño 3.4 and TCI in various regions are mainly related to the topography and geomorphology of the region. The statistical results show that the regions with high correlations are mostly distributed in plateaus, hillsides and plains. Because of the altitude, these areas are more sensitive to land surface temperature, which tends to be more changeable. Therefore, TCI is more influenced by atmospheric circulation in areas with plateaus, hillsides and plains. However, the correlation is obviously low in areas with basins, which have low terrain and are surrounded by high mountains. The atmospheric circulation in the basin is difficult to spread, and the surface temperatures are usually high and slightly variable [65].
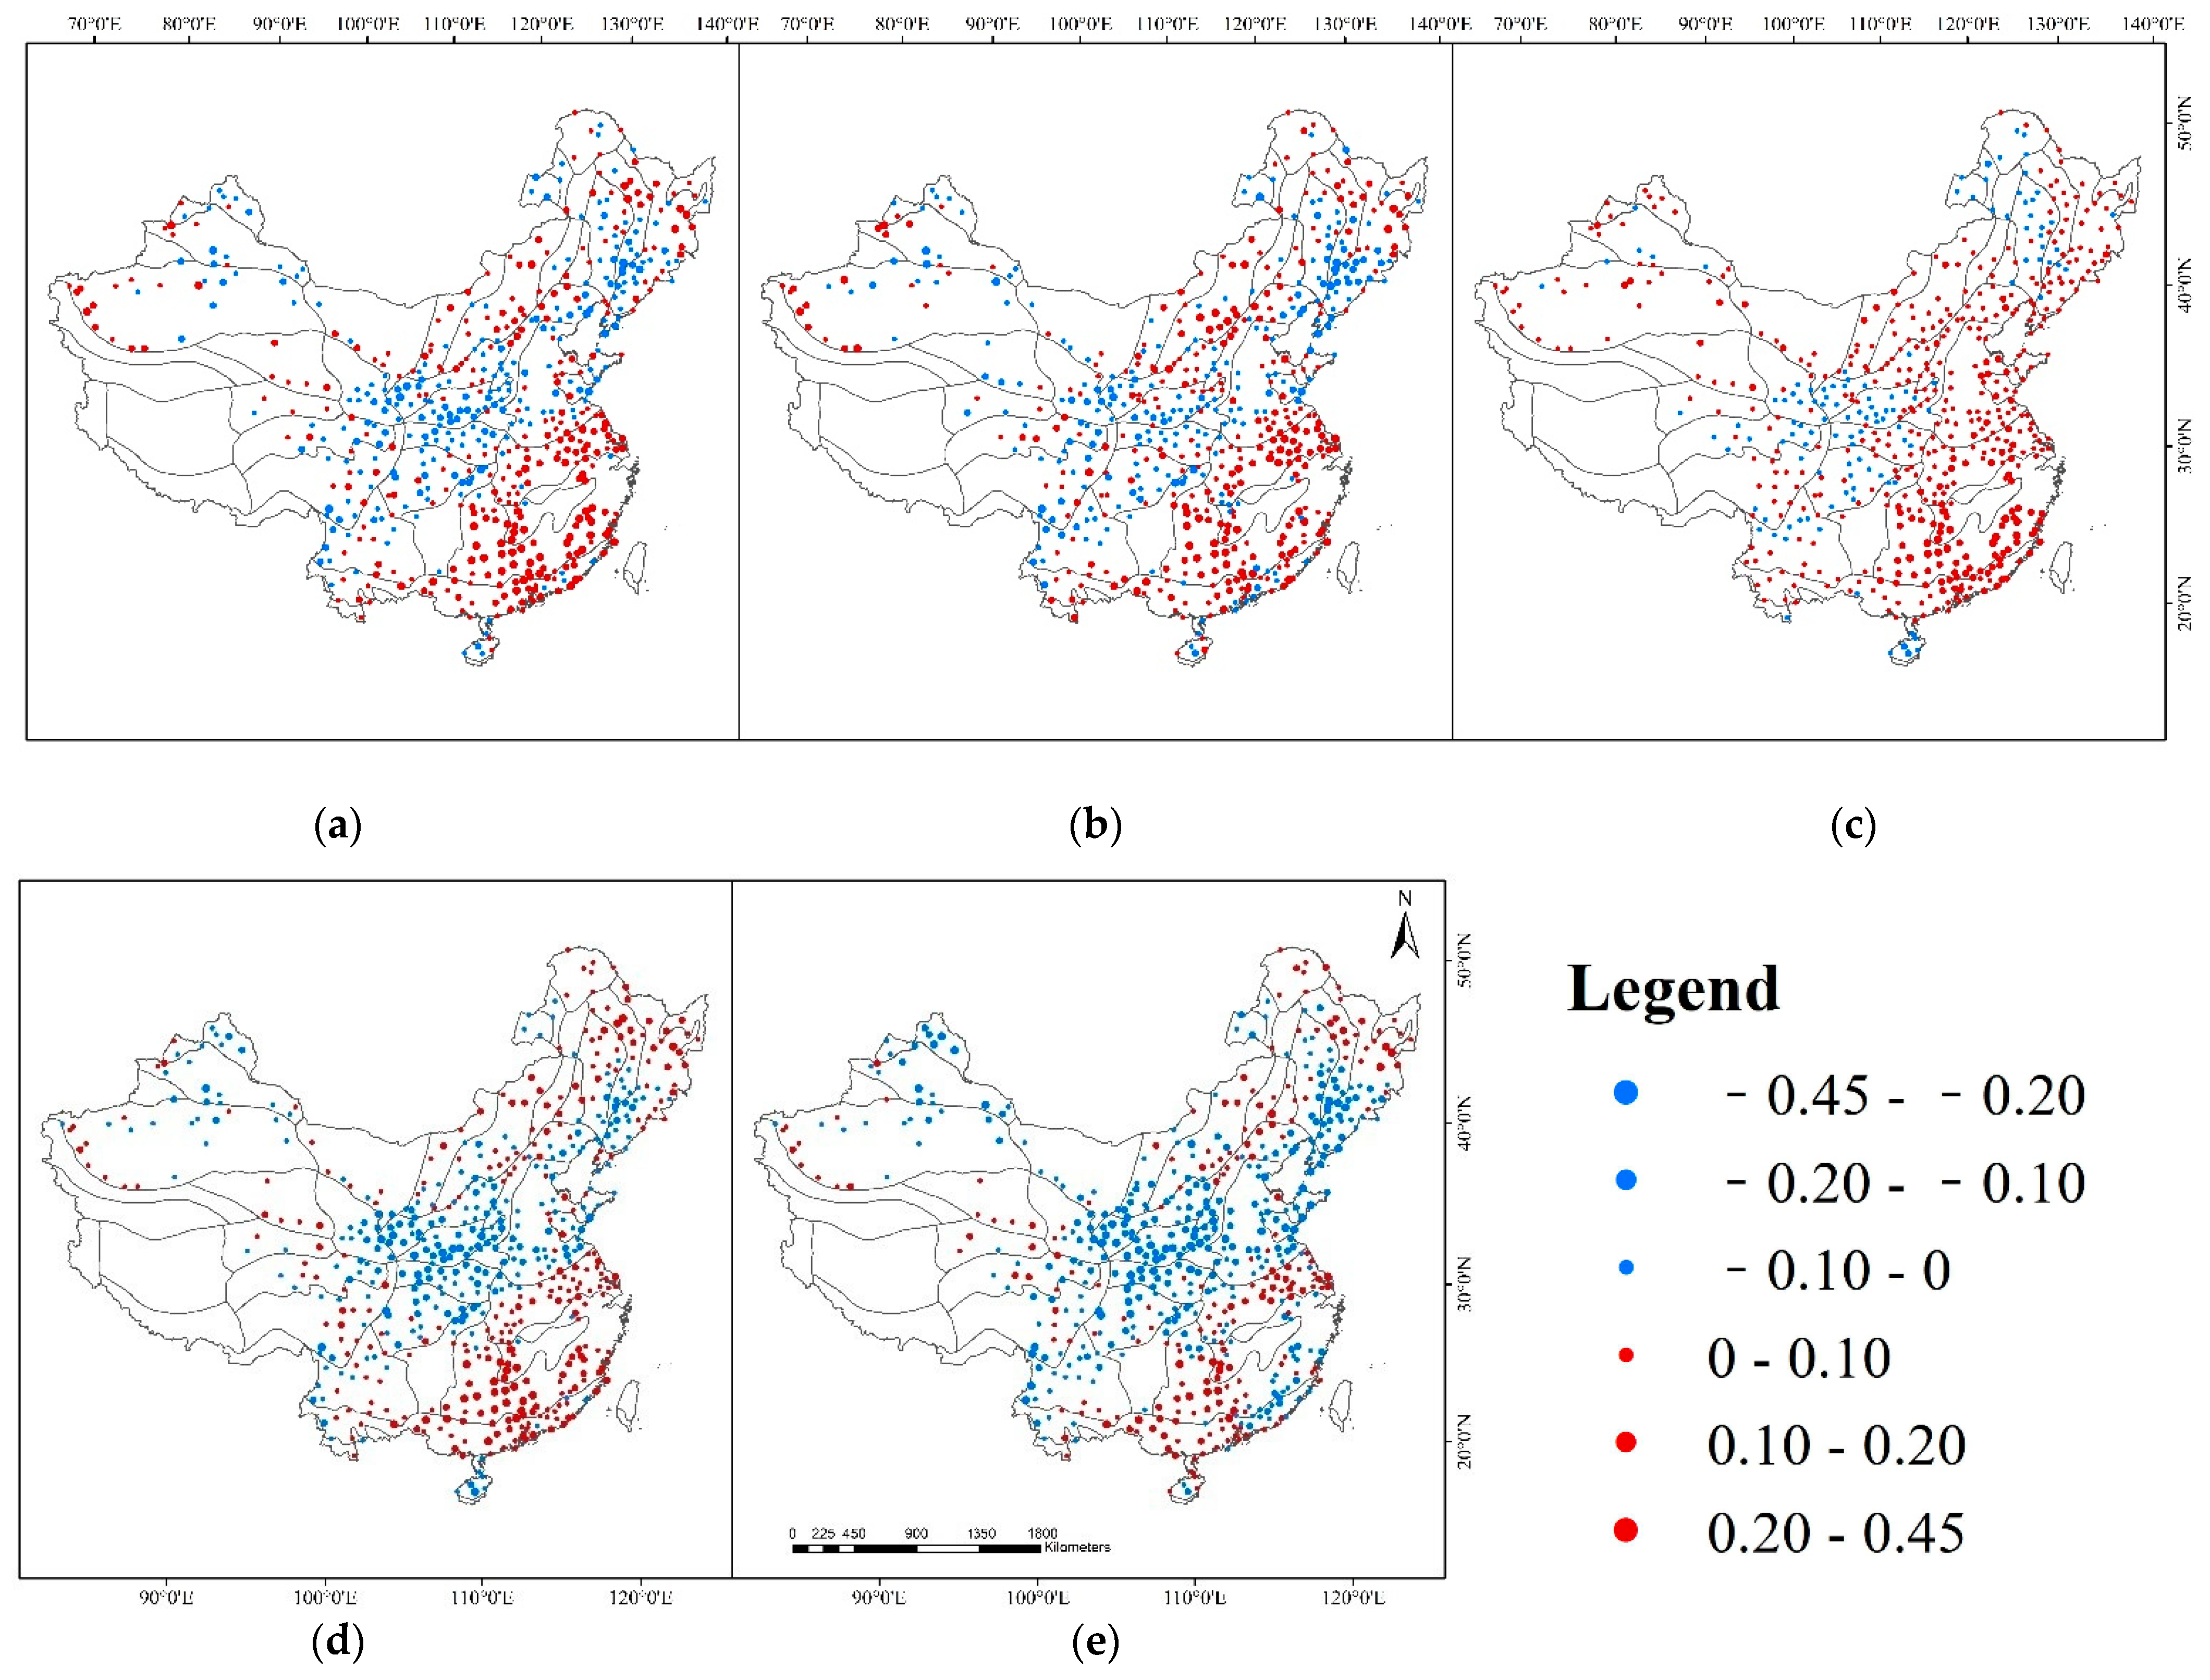
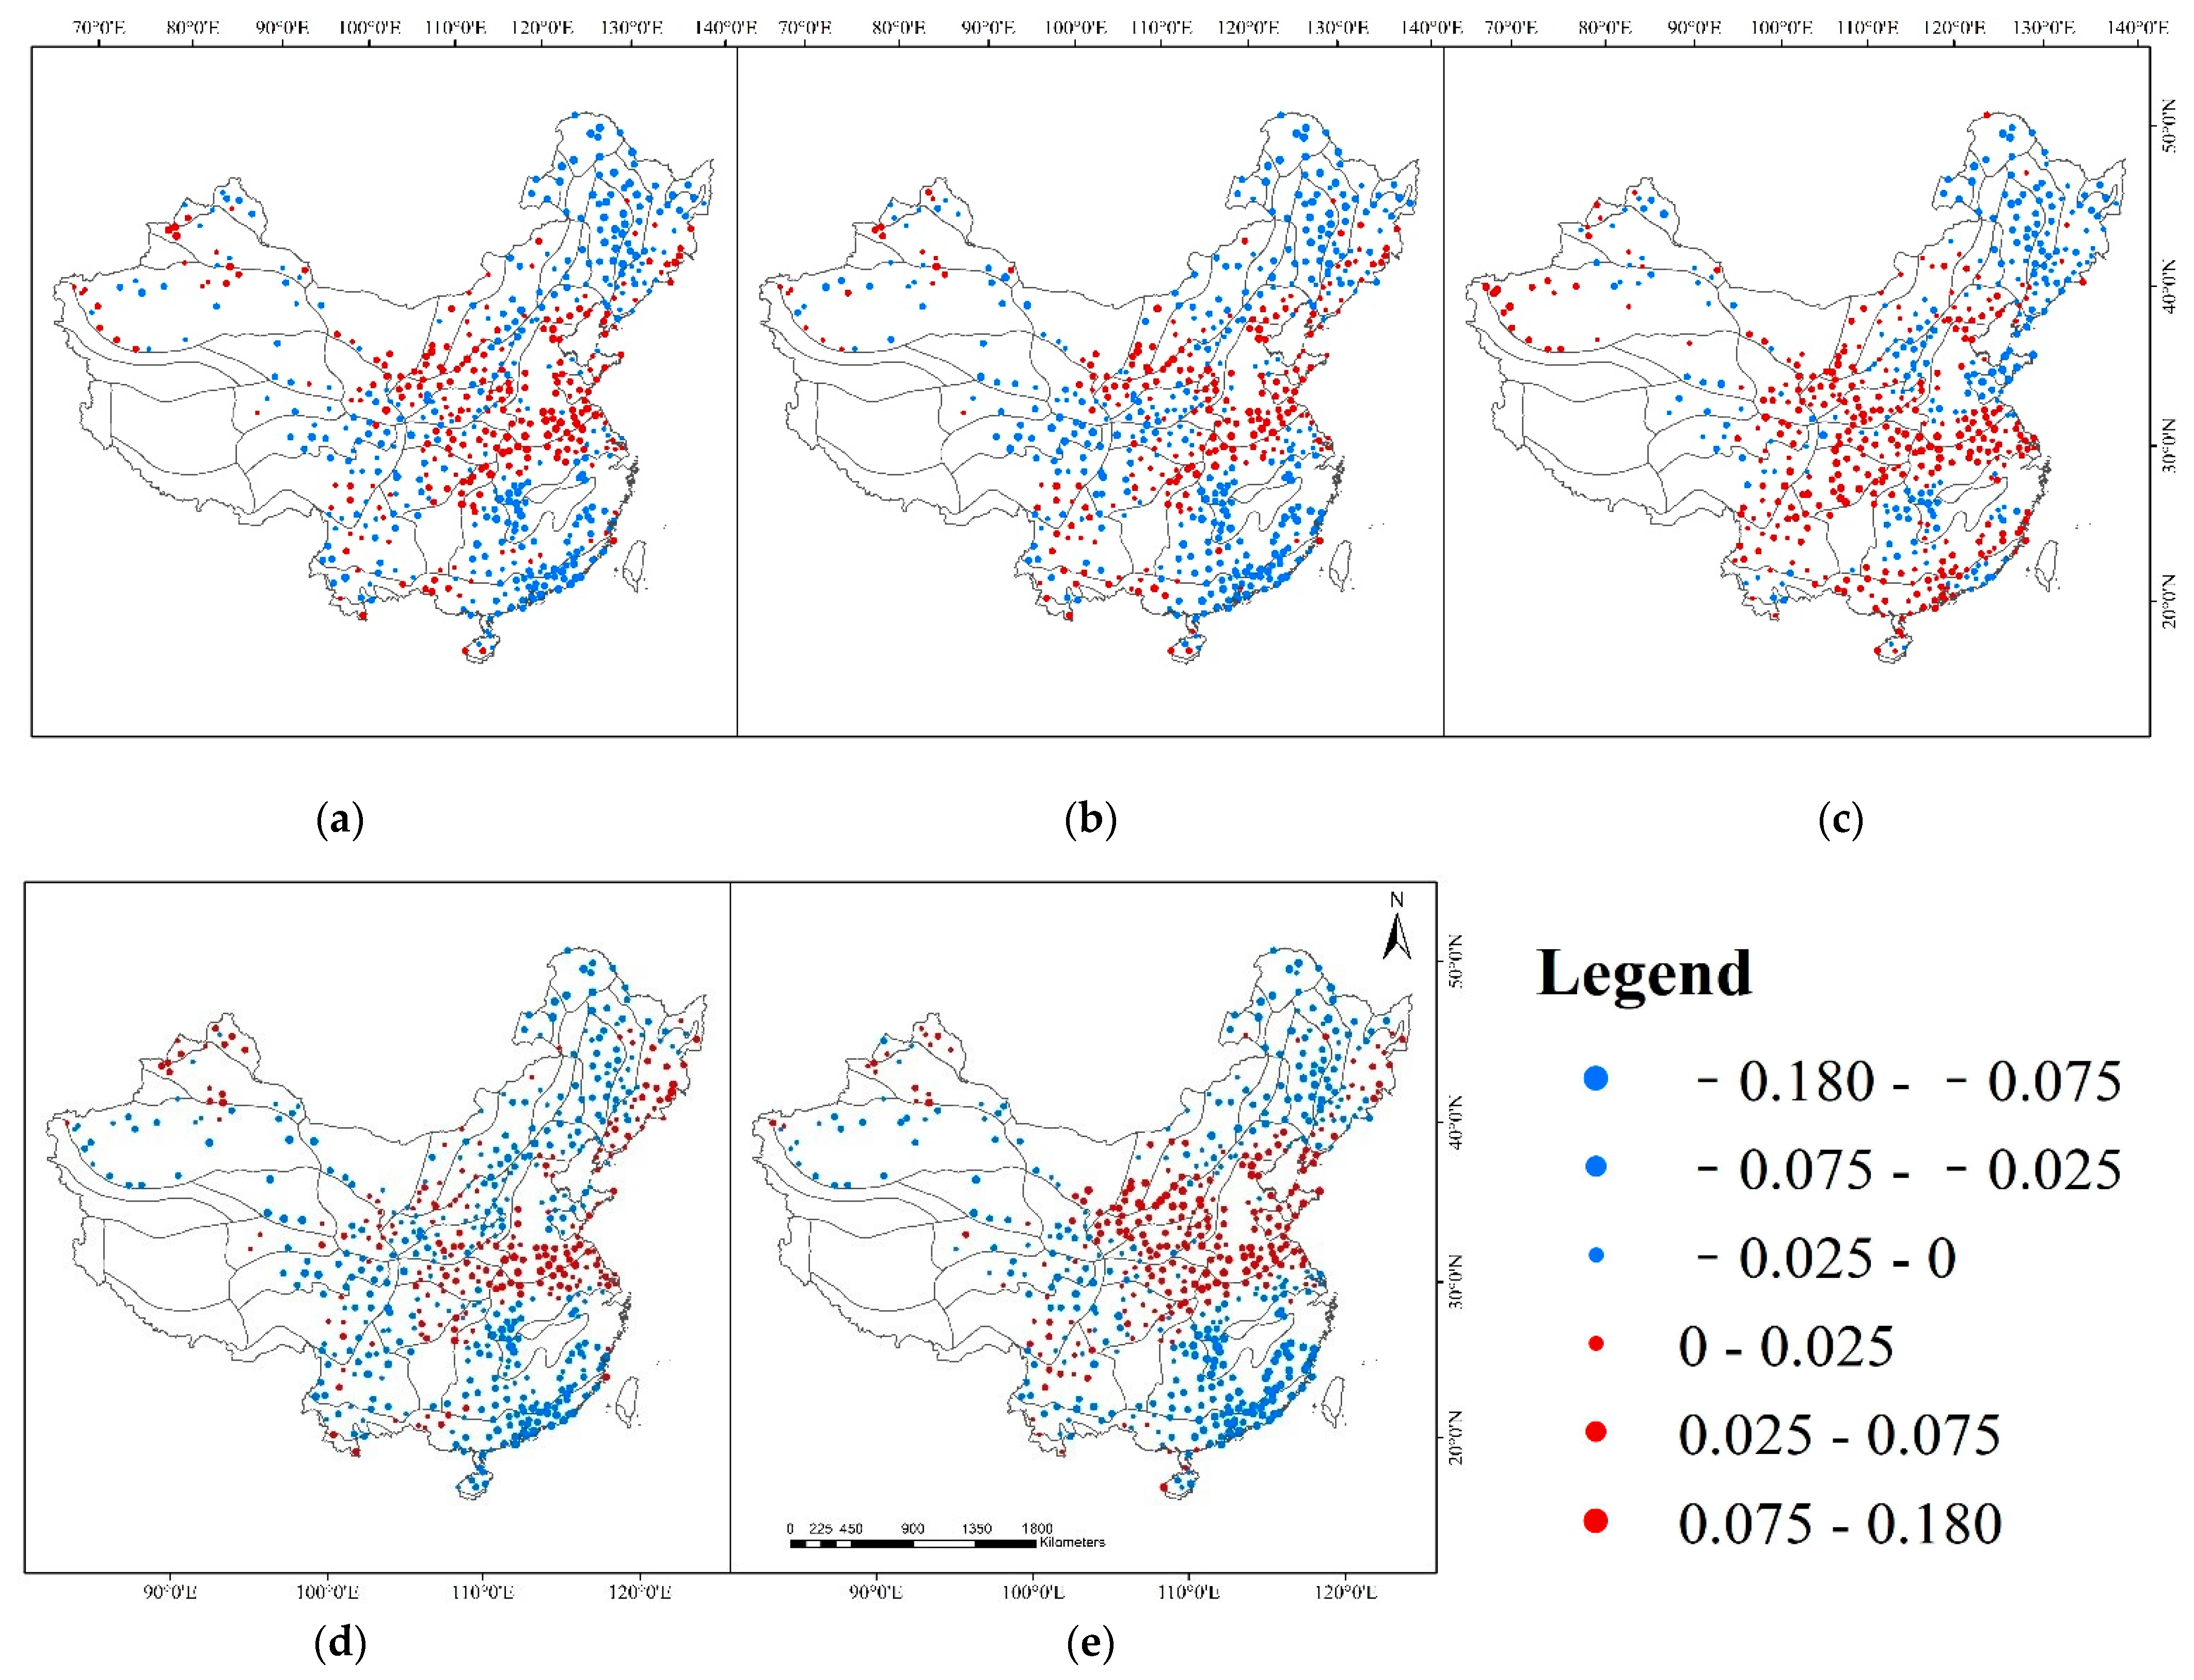
ENSO and MJO also have a significant correlation with meteorological drought. From a spatial perspective (Figure 5 and Figure 6), the positive correlation between the ENSO and meteorological drought is mainly distributed in southern China, the Jiangnan region, the middle and lower reaches of the Yangtze River, the arid and semi-arid areas in northwestern China and the northern part of northeastern China. The eastern part of northeastern China, the central part and northern China are negative correlation areas. In addition, the correlation was significantly stronger in areas close to the ocean. MJO and meteorological drought mainly show a positive correlation in northern and central China while a negative correlation in northeastern and southern China.
As the time scale of SPEI increases, the correlation between SPEI and ENSO and MJO indices becomes stronger. The correlation coefficients between SPEI-12 and ENSO and MJO indices are the highest. The highest correlation coefficient between SPEI and Niño 3.4 is 0.40, while the highest correlation coefficient between SPEI and MJO is 0.15. The multi-timescale SPEI reflects the different drought conditions in China. The correlation analysis of the multi-timescale SPEI and ENSO and MJO indices further reveals the sensitivity of meteorological drought to ENSO and MJO.

3.2. ENSO and MJO Oscillations Have a Significant Correspondence with Drought in the Long-Term Series

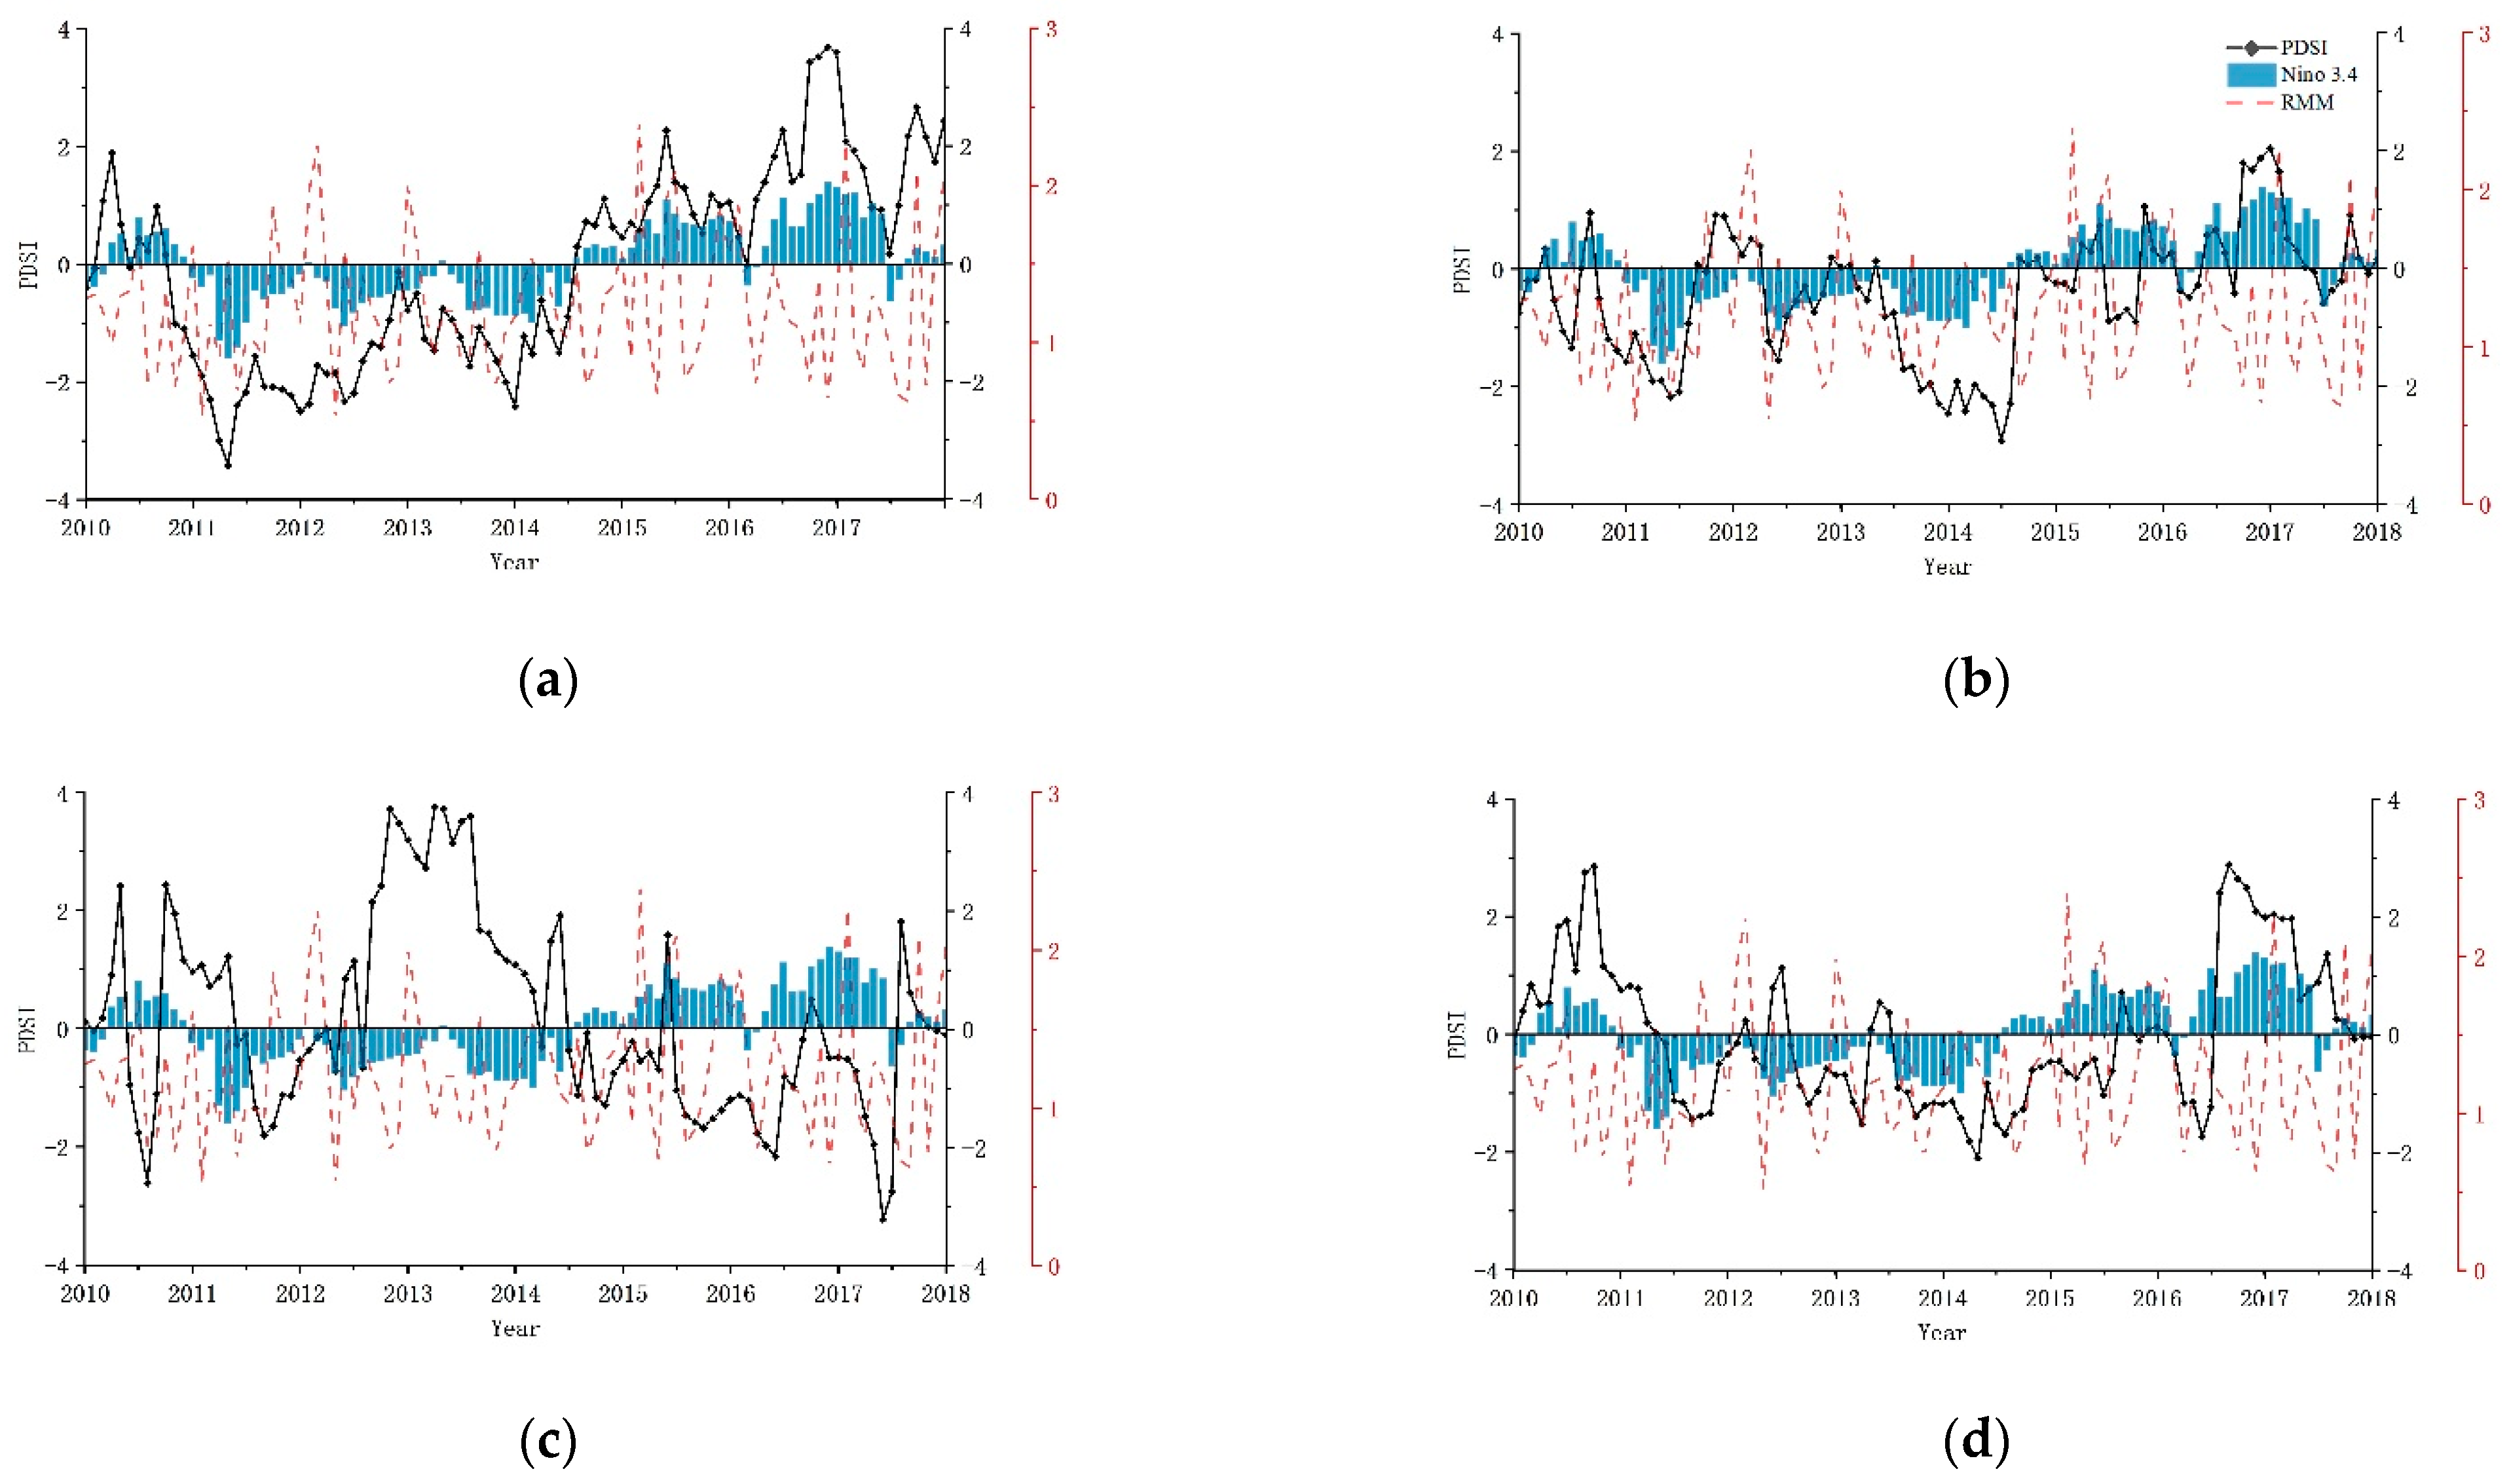
The time series of the two types of drought indices and ENSO and MJO indices in China’s 48 eco-geographical regions also have corresponding correlations. Their relationships vary from region to region. To clearly show the differences in correlation between drought indices and ENSO and MJO indices in various eco-geographical regions, we selected four typical eco-geographic regions of historically drought-prone regions located in the humid, sub-humid, semi-arid and arid zones. For the analysis of drought conditions when ENSO events or MJO anomalies occurred, a time series was extracted from 2010 to 2018, during which both warm and cold ENSO events occurred. As shown in Figure 7, ENSO and MJO are cyclical. In the south of the Huai River and the middle and lower reaches of the Yangtze River, which are the representative humid regions of China (Figure 7a), the trends of ENSO and MJO indices are consistent with the drought indices. In the Tarim and Turpan basins, which are located in the arid areas (Figure 7d), when higher or lower ENSO and MJO indices occur, consistent trends are observed in the drought indices. The results indicate that ENSO correlates with drought events in arid or humid areas. However, in the semi-humid North China Plain (Figure 7b) and the semi-arid Southwest Songliao Plain (Figure 7c), the drought indices show different trends during the alternating periods of ENSO warm and cold events, and ENSO events occurred in different seasons.
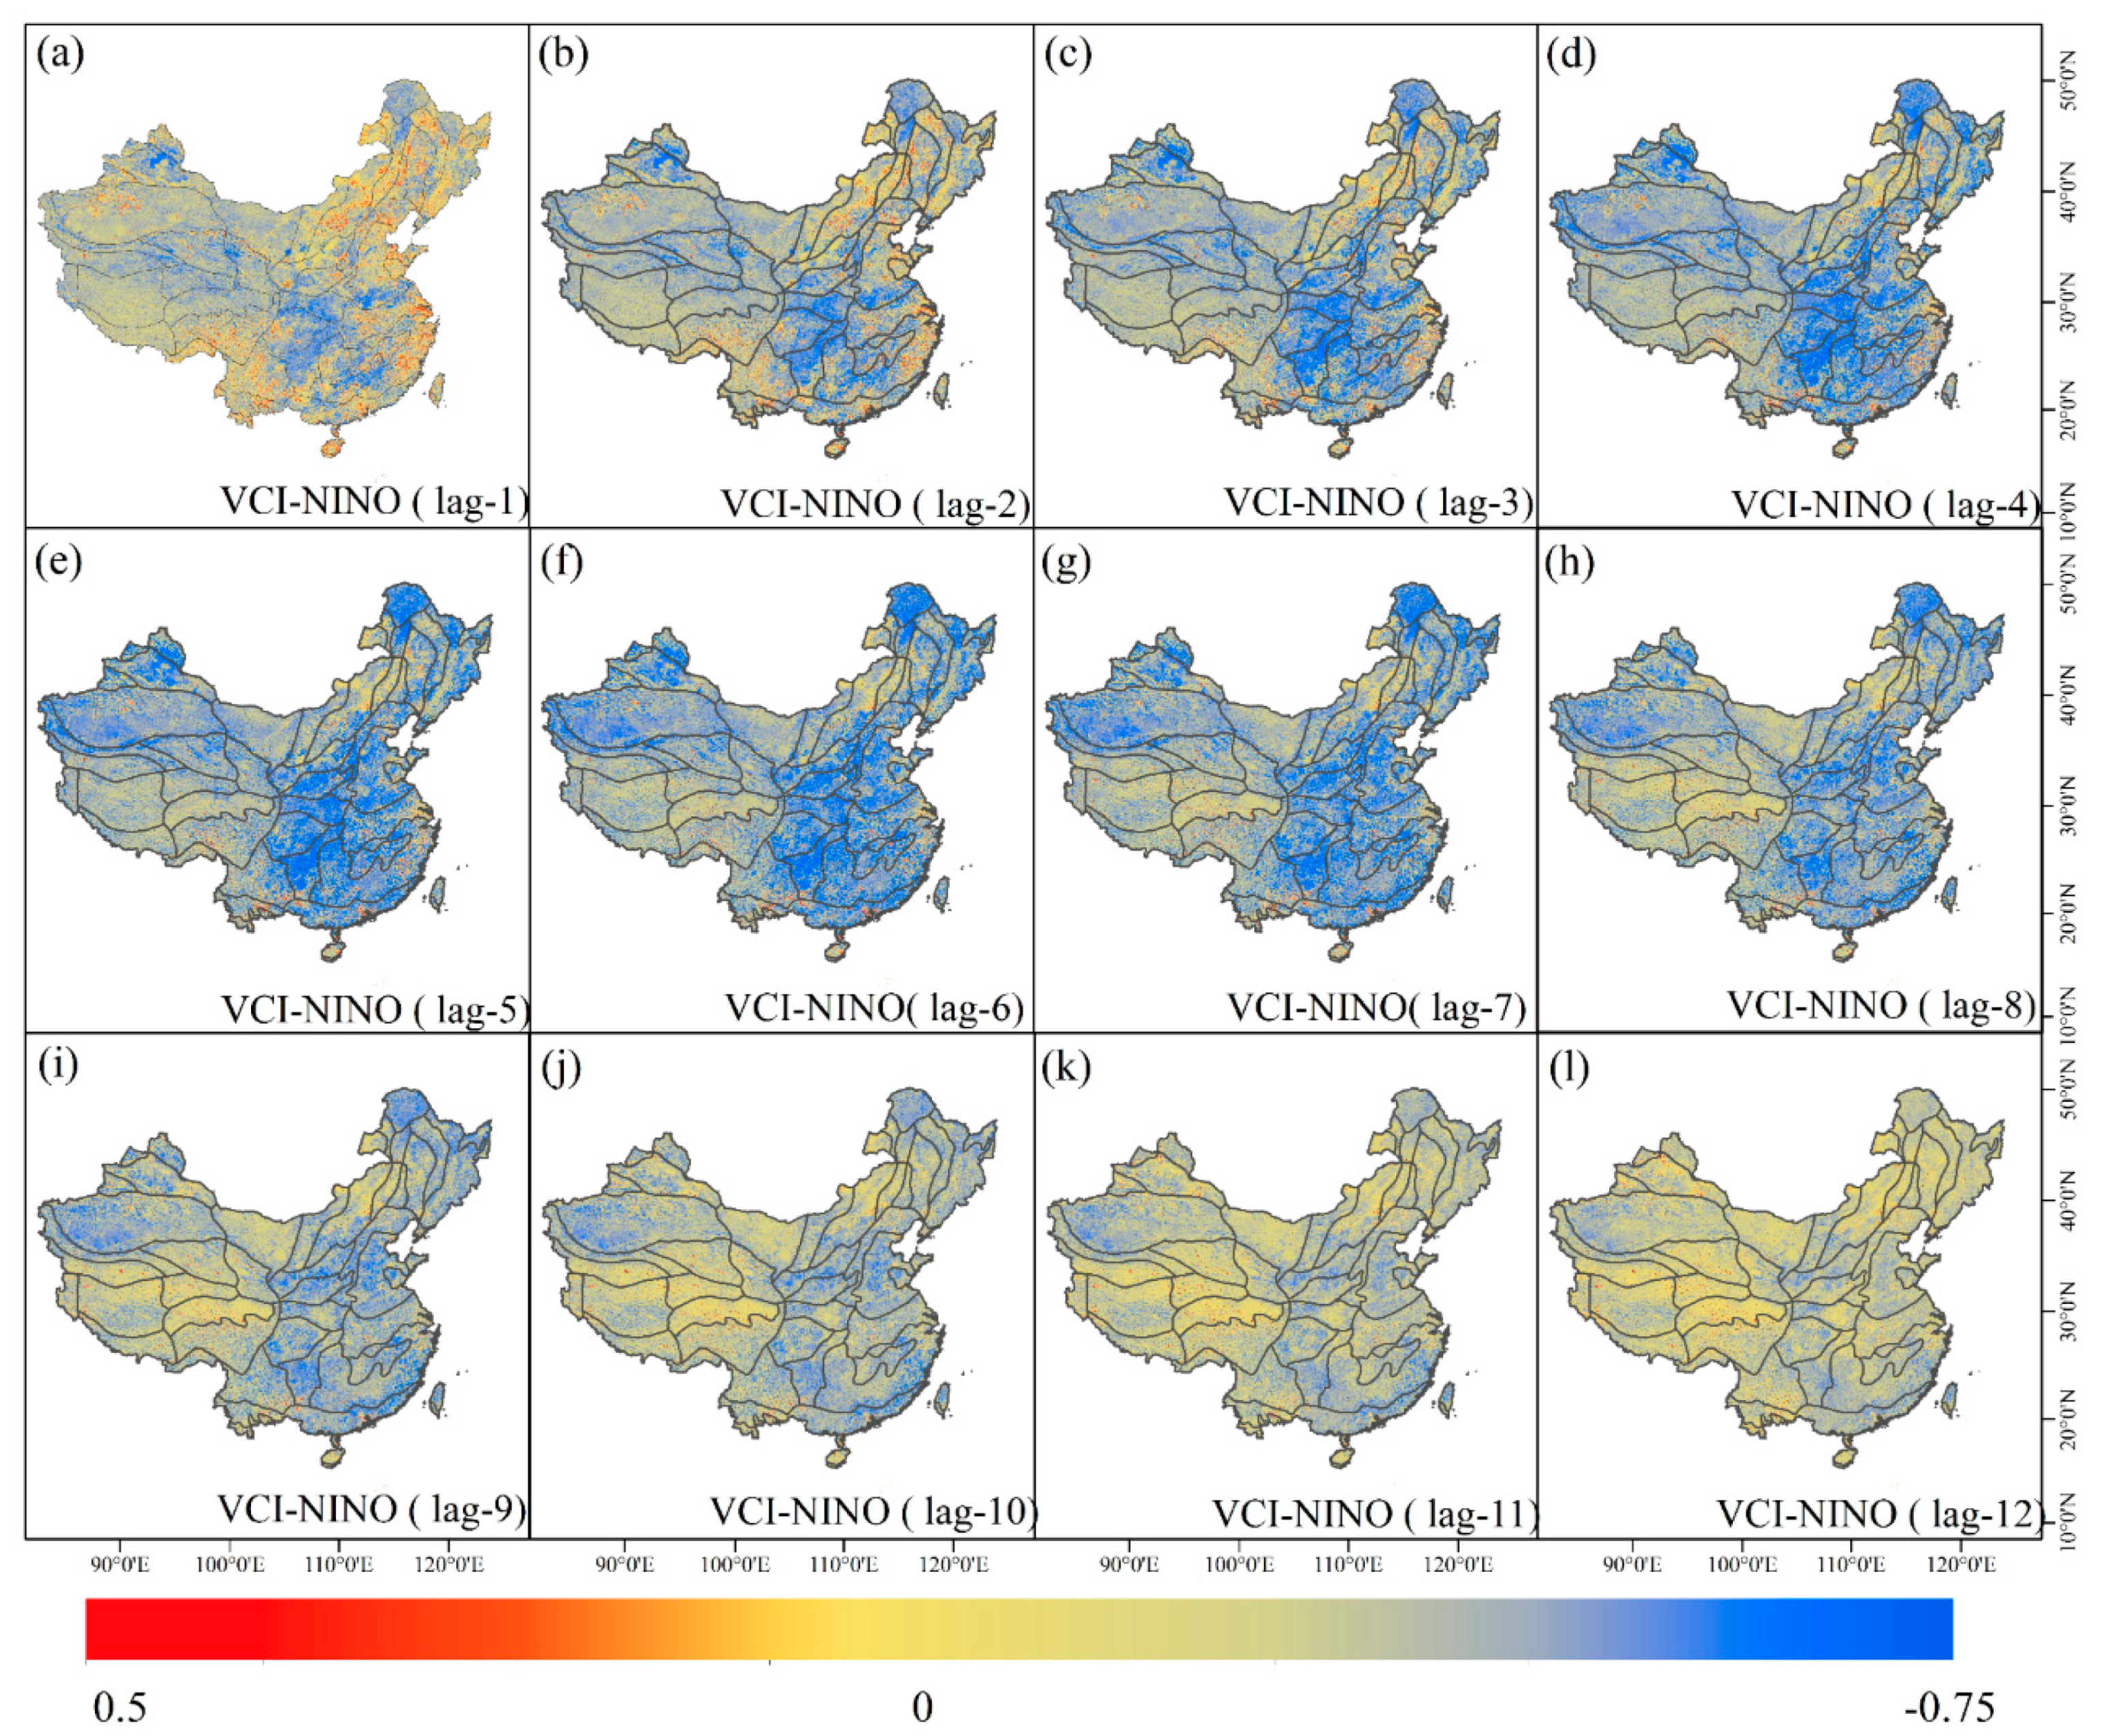
Agricultural droughts have a “lagged response” to ENSO, as shown by the overall changes in the time series. We shifted Niño 3.4 from 1 to 12 months for the time-series analysis when calculating the correlation coefficients between climate indices and drought indices and found an obvious lag between them. As shown in Figure 8, the same time lag can be seen clearly in space by combining with the spatial correlation analysis of the 12 shifted timeseries. Moreover, the correlation between agricultural drought and ENSO and MJO indices reached a maximum of 0.75 at a lag of six months. By extracting the mean and maximum values of the correlation coefficients at different shifting times, when the time lag is six months, the mean value reached a maximum of 0.38 and the maximum value also reached the maximum value of 0.75 (Table 2). This indicates that the lag time of agricultural drought to ENSO events is six months. The strongest correlation was also found in previous studies, which also found that the response time of agricultural drought to a lack of precipitation was six months [66].

4. Discussion

The maximum, minimum and mean values of the correlation coefficients between drought indices and ENSO and MJO indices were extracted from different eco-geographical regions by zonal statistics. It was found that the impact of ENSO and MJO on drought in different eco-geographical regions has temporal and spatial variations. However, regions relatively prone to drought, such as northwest China, northeast China, north China, Yungui, Guizhou, middle and lower Yangtze River and southeast coastal areas, are more likely affected by ENSO and MJO. In addition, we found that, in north China, for example, the distribution of precipitation and response to drought differ between seasons when an ENSO event occurs [25]. Most of China has a typical monsoon climate caused by the temperature difference between the ocean and land. This climate type is affected by ENSO events, which cause high anomalies in the western Pacific subtropical area. The anomalies affect moisture transport, resulting in droughts and floods in some regions of China [27], such as the temperate monsoon climate in north China and subtropical monsoon climate in the south of the Huaihe River and the middle and lower reaches of the Yangtze River. Southwest China, a transitional crossroads of multiple monsoon circulation influences, experiences varying degrees of drought almost every year, with major severe droughts occurring every 5–10 years. This region is mainly a negatively correlated region, meaning that it is more prone to drought when an El Niño event occurs [67,68]. Northwest China is primarily an arid and semi-arid region with complex topography. It is also dominated by plateaus and basins and is far from the ocean. Therefore, in most of northwest China, a warm ENSO event leads to drought; that is, the higher is the Niño 3.4 index, the greater is the possibility of severe drought [69,70].
The correlation coefficients of ENSO and MJO with the drought indices have both positive and negative spatial correlation zones. The reason for the different correlations is that ENSO is divided into El Niño and La Niña when the sea temperature is higher or lower than usual [71]. Due to the combined effects of distance from the ocean, climate and geography, the response to ENSO varies from region to region. ENSO warm and cold events can lead to different types of extreme events. MJO is active at different phases in different seasons, so it has varying degrees of impact on drought in each region of China. Related studies have shown that MJO does not directly contribute to the occurrence of ENSO events, although it indirectly contributes to the intensity and development of the climate system during its 30–60-day activity cycle. MJO interacts with ENSO, and, whether MJO is unusually strong or weak, an El Niño or La Niña event may occur, which results in extreme climate events [72].
The characteristics of drought are complex and can be reflected not only by factors such as rainfall and groundwater but also by surface temperature and vegetation coverage. The meteorological drought indices are mainly based on rainfall, evapotranspiration and other direct indicators, while agricultural drought is mainly based on vegetation conditions and the water resources, which have a response time to drought, especially in the areas of low vegetation coverage.

5. Conclusions

We analyzed the influences of ENSO and MJO on drought in different regions of China by assessing the spatial and temporal distributions of the correlation coefficients between ENSO and MJO indices and drought indices. The study found that ENSO and MJO are significantly correlated with both agricultural drought and meteorological drought throughout China. This is especially true in the drought-prone regions of northwest China, northeast China, north China, Yunnan, Guizhou, the middle and lower reaches of the Yangtze River and the eastern regions near the ocean. The spatial and temporal correlations varied due to the different eco-geographic regions located in different dry–wet partitions, the distance from the ocean, climate, topography and vegetation coverage. According to the distribution of positive and negative correlations between the meteorological drought and agricultural drought indices and ENSO and MJO, we conclude that, when El Niño occurs, the risk of drought increases in northern regions, especially in northern China, while, when La Niña occurs, there is a possibility of drought in southern China. The correlation between MJO and drought indices also varied, but it had a relatively more obvious impact on the southeastern coastal area of China, northern China and the middle and lower reaches of the Yangtze River than the other regions. The response of agricultural droughts to ENSO events has a time lag; the correlation of shifting data on different time scales is better than that of contemporaneous data; and the best lag time is six months. Exploring the teleconnection mechanism of ENSO and MJO with drought in China and analyzing them quantitatively, this study provides a theoretical basis for accurate monitoring and forecasting of drought.

Author Contributions

Conceptualization, L.Z. and S.W.; Data curation, L.Z. and S.W.; Formal analysis, L.Z. and S.W.; Funding acquisition, L.Z. and M.D.; Investigation, L.Z. and S.W.; Methodology, S.W.; Project administration, L.Z. and M.D.; Resources, S.W. and L.Z.; Software, S.W.; Supervision, L.Z., M.D. and Q.C.; Validation, S.W.; Visualization, S.W.; Writing—original draft, S.W. and L.Z.; and Writing—review and editing, L.Z., S.W., M.D., Q.C., C.H., J.Z., Y.Z. and Y.G. All authors have read and agreed to the published version of the manuscript.

Funding

This research was funded by the National Natural Science Foundation (NSFC) (Key Project No. 42077439), the National Key Research and Development Program of China (2017YFC1502402 and 2018YFC0706003) and the Beijing Advanced Innovation Center for Future Urban Design (UDC2018030611).

Acknowledgments

We are grateful to the Resource and Environment Science and Data Center, China Meteorological Data Network, National Oceanic and Atmospheric Administration (NOAA) of America, National Climate Center of China Meteorological Administration and National Climate Center of America for providing the meteorological and remote sensing data used in our research.

Conflicts of Interest

On behalf of all authors, the corresponding author states that there is no conflict of interest.

References

  1. Mitchell, J.K.; Bryant, E.A. Natural Hazards. Geogr. Rev. 1992, 82, 478. [Google Scholar] [CrossRef]
  2. Field, C.; Barros, V.; Change, I. Climate Change 2014: Impacts, Adaptation, and Vulnerability: Working Group II Contribution to the Fifth Assessment Report of the Intergovernmental Panel on Climate Change; IPCC: Geneva, Switzerland, 2014. [Google Scholar]
  3. Almazroui, M.; Saeed, S.; Saeed, F.; Islam, M.N.; Ismail, M. Projections of Precipitation and Temperature over the South Asian Countries in CMIP6. Earth Syst. Environ. 2020, 4, 297–320. [Google Scholar] [CrossRef]
  4. Dai, A. Drought under global warming: A review. Wiley Interdiscip. Rev. Clim. Chang. 2010, 2, 45–65. [Google Scholar] [CrossRef] [Green Version]
  5. Pereira, M.P.S.; Mendes, K.R.; Justino, F.; Couto, F.; Da Silva, A.S.; Da Silva, D.F.; Malhado, A.C.M. Brazilian Dry Forest (Caatinga) Response To Multiple ENSO: The role of Atlantic and Pacific Ocean. Sci. Total. Environ. 2020, 705, 135717. [Google Scholar] [CrossRef] [PubMed]
  6. Júnior, R.D.S.N.; Fraisse, C.W.; Karrei, M.A.Z.; Cerbaro, V.A.; Perondi, D. Effects of the El Niño Southern Oscillation phenomenon and sowing dates on soybean yield and on the occurrence of extreme weather events in southern Brazil. Agric. For. Meteorol. 2020, 290, 108038. [Google Scholar] [CrossRef]
  7. Brum, M.; Oliveira, R.S.; López, J.G.; Licata, J.; Pypker, T.; Chia, G.S.; Tinôco, R.S.; Asbjornsen, H. Effects of irrigation on oil palm transpiration during ENSO-induced drought in the Brazilian Eastern Amazon. Agric. Water Manag. 2021, 245, 106569. [Google Scholar] [CrossRef]
  8. Hamdi, R.; Kusaka, H.; Doan, Q.-V.; Cai, P.; He, H.; Luo, G.; Kuang, W.; Caluwaerts, S.; Duchêne, F.; Van Schaeybroek, B.; et al. The State-of-the-Art of Urban Climate Change Modeling and Observations. Earth Syst. Environ. 2020, 4, 631–646. [Google Scholar] [CrossRef]
  9. Santoso, A.; Mcphaden, M.J.; Cai, W. The Defining Characteristics of ENSO Extremes and the Strong 2015/2016 El Niño. Rev Geophys. 2017, 55. [Google Scholar] [CrossRef]
  10. Wang, H.; Kumar, A. Assessing the impact of ENSO on drought in the U.S. Southwest with NCEP climate model simulations. J. Hydrol. 2015, 526, 30–41. [Google Scholar] [CrossRef]
  11. Lyon, B.; Cristi, H.; Verceles, E.R.; Hilario, F.D.; Abastillas, R. Seasonal reversal of the ENSO rainfall signal in the Philippines. Geophys. Res. Lett. 2006, 33. [Google Scholar] [CrossRef]
  12. Gelcer, E.; Fraisse, C.W.; Dzotsi, K.; Hu, Z.; Mendes, R.; Zotarelli, L. Effects of El Niño Southern Oscillation on the space–time variability of Agricultural Reference Index for Drought in midlatitudes. Agric. For. Meteorol. 2013, 174–175, 110–128. [Google Scholar] [CrossRef]
  13. Bellenger, H.; Duvel, J.-P. The event-to-event variability of the boreal winter MJO. Geophys. Res. Lett. 2012, 39, 8701. [Google Scholar] [CrossRef]
  14. Zaitchik, B.F. Madden-Julian Oscillation impacts on tropical African precipitation. Atmospheric Res. 2017, 184, 88–102. [Google Scholar] [CrossRef]
  15. Hidayat, R. Modulation of Indonesian Rainfall Variability by the Madden-julian Oscillation. Procedia Environ. Sci. 2016, 33, 167–177. [Google Scholar] [CrossRef] [Green Version]
  16. Gupta, V.; Jain, M.K. Unravelling the teleconnections between ENSO and dry/wet conditions over India using nonlinear Granger causality. Atmospheric Res. 2021, 247, 105168. [Google Scholar] [CrossRef]
  17. Le, J.A.; El-Askary, H.M.; Allali, M.; Sayed, E.; Sweliem, H.; Piechota, T.C.; Struppa, D.C. Characterizing El Niño-Southern Oscillation Effects on the Blue Nile Yield and the Nile River Basin Precipitation using Empirical Mode Decomposition. Earth Syst. Environ. 2020, 4, 699–711. [Google Scholar] [CrossRef]
  18. Meza, F.J. Recent trends and ENSO influence on droughts in Northern Chile: An application of the Standardized Precipitation Evapotranspiration Index. Weather. Clim. Extremes 2013, 1, 51–58. [Google Scholar] [CrossRef] [Green Version]
  19. Shi, S.; Shi, J.; Xu, C.; Leavitt, S.W.; Wright, W.E.; Cai, Z.; Zhang, H.; Sun, X.; Zhao, Y.; Ma, X.; et al. Tree-ring δ18O from Southeast China reveals monsoon precipitation and ENSO variability. Palaeogeogr. Palaeoclim. Palaeoecol. 2020, 558, 109954. [Google Scholar] [CrossRef]
  20. Park, S.; Kang, D.; Yoo, C.; Im, J.; Lee, M.-I. Recent ENSO influence on East African drought during rainy seasons through the synergistic use of satellite and reanalysis data. ISPRS J. Photogramm. Remote. Sens. 2020, 162, 17–26. [Google Scholar] [CrossRef]
  21. Costa, M.D.S.; De Oliveira-Júnior, J.F.; Dos Santos, P.J.; Filho, W.L.F.C.; De Gois, G.; Blanco, C.J.C.; Teodoro, P.E.; Junior, C.A.D.S.; Santiago, D.D.B.; Souza, E.D.O.; et al. Rainfall extremes and drought in Northeast Brazil and its relationship with El Niño–Southern Oscillation. Int. J. Clim. 2021, 41. [Google Scholar] [CrossRef]
  22. Ortega, C.; Vargas, G.; Rojas, M.; Rutllant, J.A.; Muñoz, P.; Lange, C.B.; Pantoja, S.; Dezileau, L.; Ortlieb, L. Extreme ENSO-driven torrential rainfalls at the southern edge of the Atacama Desert during the Late Holocene and their projection into the 21th century. Glob. Planet. Chang. 2019, 175, 226–237. [Google Scholar] [CrossRef]
  23. Wicaksono, G.B.; Hidayat, R. Extreme Rainfall in Katulampa Associated with the Atmospheric Circulation. Procedia Environ. Sci. 2016, 33, 155–166. [Google Scholar] [CrossRef] [Green Version]
  24. Kalisa, W.; Zhang, J.; Igbawua, T.; Ujoh, F.; Ebohon, O.J.; Namugize, J.N.; Yao, F. Spatio-temporal analysis of drought and return periods over the East African region using Standardized Precipitation Index from 1920 to 2016. Agric. Water Manag. 2020, 237, 106195. [Google Scholar] [CrossRef]
  25. Li, W.; Zhai, P.; Cai, J. Research on the Relationship of ENSO and the Frequency of Extreme Precipitation Events in China. Adv. Clim. Chang. Res. 2011, 2, 101–107. [Google Scholar] [CrossRef]
  26. Wang, H.; Chen, Y.; Pan, Y.; Chen, Z.; Ren, Z. Assessment of candidate distributions for SPI/SPEI and sensitivity of drought to climatic variables in China. Int. J. Clim. 2019, 39, 4392–4412. [Google Scholar] [CrossRef]
  27. Ma, F.; Ye, A.; You, J.; Duan, Q. 2015–16 floods and droughts in China, and its response to the strong El Niño. Sci. Total. Environ. 2018, 627, 1473–1484. [Google Scholar] [CrossRef] [PubMed]
  28. Li, J. Impact of El Nino Phenomenon on Temperature and Precipitation in Eastern China. China-Arab States Sci. Technol. Forum 2020, 07, 113–115. [Google Scholar]
  29. Chen, X.; Li, C.; Li, X.; Yang, M.; Li, L. Modulation of the impacts of Madden–Julian Oscillation on winter rainfall in China by El Niño-Southern Oscillation. Int. J. Clim. 2020, 40, 4039–4052. [Google Scholar] [CrossRef]
  30. Liu, Z.; Zhang, X.; Fang, R. Multi-scale linkages of winter drought variability to ENSO and the Arctic Oscillation: A case study in Shaanxi, North China. Atmos. Res. 2018, 200, 117–125. [Google Scholar] [CrossRef]
  31. Wei, W.; Shuang, F. The Correlation Analysis between Summer Droughts & Floods in the Southwest and ENSO. J. Chengdu Univ. Inf. Technol. 2012, 27, 412–418. [Google Scholar]
  32. Zhou, S. Temporal and Spatial Evolution and Prediction of Meteorological Drought in the Poyang Lake Basin under Climate Change. Mastere’s Thesis, Nanchang Institute of Technology, Nanchang, China, 2019. [Google Scholar]
  33. Yang, S.-Y.; Li, T.; Niu, F.-B.; Ju, J.-H. Possible Impacts of the MJO on once Heavy Rain During Fall Drought of 2011 over Yunnan. J. Chengdu Univ. Inf. Technol. 2013, 28, 175–180. [Google Scholar]
  34. Yuan, W.; Yang, H. On the Modulation of MJO to the Precipitation of Southeast China in Winter Season. Acta Sci. Nat. Univ. Pekin. 2010, 46, 207–214. [Google Scholar]
  35. Zheng, Y.; Zhang, Q.; Luo, M.; Sun, P.; Singh, V.P. Wintertime precipitation in eastern China and relation to the Madden-Julian oscillation: Spatiotemporal properties, impacts and causes. J. Hydrol. 2020, 582, 124477. [Google Scholar] [CrossRef]
  36. Zhang, Q.; Zhang, L.; Cui, X.; Zeng, J. Progresses and Challenges in Drought Assessment and Monitoring. Adv. Earth Sci. 2011, 26, 763–778. [Google Scholar]
  37. Amin, Z.; Rehan, S.; Bahman, N.; Faisal, I.K. A review of drought indices. Environ. Rev. 2011, 19, 333–349. [Google Scholar]
  38. Du, L.; Tian, Q.; Yu, T.; Meng, Q.; Jancso, T.; Udvardy, P.; Huang, Y. A comprehensive drought monitoring method integrating MODIS and TRMM data. Int. J. Appl. Earth Obs. Geoinf. 2013, 23, 245–253. [Google Scholar] [CrossRef]
  39. Hao, Z.; Singh, V.P. Drought characterization from a multivariate perspective: A review. J. Hydrol. 2015, 527, 668–678. [Google Scholar] [CrossRef]
  40. Vicente-Serrano, S.M.; Beguería, S.; Lorenzo-Lacruz, J.; Camarero, J.J.; López-Moreno, J.I.; Azorin-Molina, C.; Revuelto, J.; Morán-Tejeda, E.; Sanchez-Lorenzo, A. Performance of Drought Indices for Ecological, Agricultural, and Hydrological Applications. Earth Interact. 2012, 16, 1–27. [Google Scholar] [CrossRef] [Green Version]
  41. McKee, T.B.N.; Doeskin, N.; Kleist, J. Drought Monitoring With Multiple Time Scales. In Proceedings of the 9th Conference on Applied Climatology, Dallas, TX, USA, 15–20 January 1995; pp. 233–236. [Google Scholar]
  42. Vicente-Serrano, S.M.; Beguería, S.; López-Moreno, J.I. A Multiscalar Drought Index Sensitive to Global Warming: The Standardized Precipitation Evapotranspiration Index. J. Clim. 2010, 23, 1696–1718. [Google Scholar] [CrossRef] [Green Version]
  43. Palmer, W.C. Meteorological Drought; US. Weather Bureau Research Paper; US Department of Commerce Weather Bureau: Washington, DC, USA, 1965; 45, p. 58.
  44. Wells, N.; Goddard, S.; Hayes, M.J. A self-calibrating Palmer drought severity index. J. Clim. 2004, 17, 2335–2351. [Google Scholar] [CrossRef]
  45. Kogan, F.N. Global Drought Watch from Space. Bull. Am. Meteorol. Soc. 1997, 78, 621–636. [Google Scholar] [CrossRef]
  46. Kogan, F. World droughts in the new millennium from AVHRR-based vegetation health indices. Eos 2002, 83, 557–563. [Google Scholar] [CrossRef]
  47. Liu, H.Q.; Huete, A. A feedback based modification of the NDVI to minimize canopy background and atmospheric noise. IEEE Trans. Geosci. Remote Sens. Appl. Soc. Environ. 1995, 33, 457–465. [Google Scholar] [CrossRef]
  48. Kogan, F. Application of vegetation index and brightness temperature for drought detection. Adv. Space Res. 1995, 15, 91–100. [Google Scholar] [CrossRef]
  49. Garen, D.C. Revised Surface-Water Supply Index for Western United States. J. Water Resour. Plan. Manag. 1993, 119, 437–454. [Google Scholar] [CrossRef]
  50. Jackson, R.D.; Idso, S.B.; Reginato, R.J.; Pinter, P.J. Canopy temperature as a crop water stress indicator. Water Resour. Res. 1981, 17, 1133–1138. [Google Scholar] [CrossRef]
  51. Zhou, L.; Zhang, J.; Wu, J.; Zhao, L.; Liu, M.; Lü, A.; Wu, Z. Comparison of remotely sensed and meteorological data-derived drought indices in mid-eastern China. Int. J. Remote. Sens. 2011, 33, 1755–1779. [Google Scholar] [CrossRef]
  52. Liang, L.; Zhao, S.-H.; Qin, Z.-H.; He, K.-X.; Chen, C.; Luo, Y.-X.; Zhou, X.-D. Drought Change Trend Using MODIS TVDI and Its Relationship with Climate Factors in China from 2001 to 2010. J. Integr. Agric. 2014, 13, 1501–1508. [Google Scholar] [CrossRef]
  53. Shaohong, W.; Qinye, Y.; Du, Z. Delineation of eco—geographic regional system of China. J. Geogr. Sci. 2003, 13, 309–315. [Google Scholar] [CrossRef]
  54. Resource and Environment Science and Data Center. Available online: http://www.resdc.cn/data.aspx?DATAID=125 (accessed on 11 January 2021).
  55. Du, Z.; Fao, R. A Study on the Eco-Geographic Regional System of China. In Proceedings of the FAO FRA2000 Global Ecological Zoning Workshop, Cambridge, UK, 28–30 January 1999. [Google Scholar]
  56. China Meteorological Data Network. Available online: http://data.cma.cn/ (accessed on 11 January 2021).
  57. National Oceanic and Atmospheric Administration. US Standard Atmosphere, 1976; National Oceanic and Atmospheric Administration: Washington, DC, USA, 1976; Volume 76.
  58. Kogan, F.N. Remote sensing of weather impacts on vegetation in non-homogeneous areas. Int. J. Remote. Sens. 1990, 11, 1405–1419. [Google Scholar] [CrossRef]
  59. National Climate Center of China Meteorological Administration. Available online: https://cmdp.ncc-cma.net/pred/cn_enso.php?product=cn_enso_nino_indices (accessed on 11 January 2021).
  60. Trenberth, K.E. The Definition of El Niño. Bull. Am. Meteor. Soc 1997, 78, 2771–2777. [Google Scholar] [CrossRef] [Green Version]
  61. Wheeler, M.C.; Hendon, H.H. An All-Season Real-Time Multivariate MJO Index: Development of an Index for Monitoring and Prediction. Mon. Weather Rev. 2004, 132, 1917–1932. [Google Scholar] [CrossRef]
  62. National Climate Center of America. Available online: https://www.cpc.ncep.noaa.gov/products/precip/CWlink/MJO/mjo.shtml (accessed on 11 January 2021).
  63. Ronghui, H. Progresses in Research on the Formation Mechanism and Prediction Theory of Severe Climatic Disasters in China. Adv. Earth Sci. 2006, 21, 564–575. [Google Scholar] [CrossRef]
  64. Li, Q.; Xue, Y. Simulated impacts of land cover change on summer climate in the Tibetan Plateau. Environ. Res. Lett. 2010, 5, 015102. [Google Scholar] [CrossRef]
  65. Zhou, C.; Li, Y.; Bu, Q.; Peng, J. Features of Drought-Flood Coexistence in West and East of of Sichuan-Chongqing Basin in Midsummer and Its Relating Background with Atmospheric Circulation. Plateau Meteorol. 2011, 30, 620–627. [Google Scholar]
  66. Wang, M.; Guo, J.-R.; Song, J.; Fu, Y.-Z.; Sui, W.-Y.; Li, Y.-Q.; Zhu, Z.-M.; Li, S.; Li, L.-L.; Guo, X.-F.; et al. The correlation between ENSO events and sea surface temperature anomaly in the Bohai Sea and Yellow Sea. Reg. Stud. Mar. Sci. 2020, 35, 101228. [Google Scholar] [CrossRef]
  67. Zhang, Z.; Chao, B.F.; Chen, J.; Wilson, C.R. Terrestrial water storage anomalies of Yangtze River Basin droughts observed by GRACE and connections with ENSO. Glob. Planet. Chang. 2015, 126, 35–45. [Google Scholar] [CrossRef]
  68. Cheng, Q.; Gao, L.; Zhong, F.; Zuo, X.; Ma, M. Spatiotemporal variations of drought in the Yunnan-Guizhou Plateau, southwest China, during 1960–2013 and their association with large-scale circulations and historical records. Ecol. Indic. 2020, 112, 106041. [Google Scholar] [CrossRef]
  69. Li, S.-Y.; Miao, L.-J.; Jiang, Z.-H.; Wang, G.-J.; Gnyawali, K.R.; Zhang, J.; Zhang, H.; Fang, K.; He, Y.; Li, C. Projected drought conditions in Northwest China with CMIP6 models under combined SSPs and RCPs for 2015–2099. Adv. Clim. Chang. Res. 2020, 11, 210–217. [Google Scholar] [CrossRef]
  70. Liu, Z.; Menzel, L.; Dong, C.; Fang, R. Temporal dynamics and spatial patterns of drought and the relation to ENSO: A case study in Northwest China. Int. J. Clim. 2015, 36, 2886–2898. [Google Scholar] [CrossRef]
  71. Wang, Z.; Wei, G.; Chen, J.; Liu, Y.; Ma, J.; Xie, L.; Deng, W.; Ke, T. El Nio–Southern Oscillation variability recorded in estuarine sediments of the Changjiang River, China. Quat. Int. 2017, 441, 18–28. [Google Scholar] [CrossRef]
  72. Ju, J.; Lv, J.; Xie, G.; Huang, Z. Studies on the Influences of Persistent Anomalies of MJO and AO on Drought Appeared in Yunnan. J. Arid Meteorol. 2011, 29, 401–406. [Google Scholar]
Figure 1. Distribution of eco-geographical regions and meteorological stations in China. The study area does not include South China Sea islands. Because there are many barren areas in the northwest, the density of the stations is low. The labels in the figure are the codes of eco-geographical regions. In the code, the Roman numerals represent different temperature zones, the letters indicate dry–wet regions and the Arabic numbers represent different natural regions in the same temperature zones and dry–wet regions. For example, code IA1 indicates the Daxing’an Mountains, which are located in the humid region of the cool temperature zone.
Remotesensing 13 00875 g001
Figure 2. Distribution of the Niño 3.4 index (three-month moving average) from 1980 to 2020. ENSO events are mainly identified by the three-month moving average absolute value of Niño 3.4. The three-month moving average of Niño 3.4 index was derived from the National Climate Center of China Meteorological Administration (https://cmdp.ncc-cma.net/pred/cn_enso.php?product=cn_enso_nino_indices (accessed on 11 January 2021)).
Remotesensing 13 00875 g002
Figure 3. Correlation between remote sensing drought indices and ENSO (Except the South China Sea Islands): (a) spatial distribution of the correlation coefficient between TCI and Niño 3.4; and (b) spatial distribution of the correlation coefficient between VCI and Niño 3.4.
Remotesensing 13 00875 g003
Figure 4. Correlation between remote sensing drought indices and MJO (Except the South China Sea Islands): (a) spatial distribution of the correlation coefficient between TCI and RMM; and (b) spatial distribution of the correlation coefficient between VCI and RMM.
Remotesensing 13 00875 g004
Figure 5. Correlation between the meteorological drought indices and Niño 3.4 (except the South China Sea Islands): (ae) spatial distribution of the correlation coefficient between PDSI, SC_PDSI, SPEI- 1, SPEI- 6, SPEI- 12 and Niño 3.4.
Remotesensing 13 00875 g005
Figure 6. Correlation between the meteorological drought indices and RMM (except the South China Sea Islands): (ae) spatial distribution of the correlation coefficient between PDSI, SC_PDSI, SPEI- 1, SPEI- 6, SPEI- 12 and RMM.
Remotesensing 13 00875 g006
Figure 7. Time series of PDSI with ENSO and MJO: (a) south of the Huaihe River and the middle and lower reaches of the Yangtze River; (b) North China Plain; (c) Southwest Songliao Plain; and (d) Tarim and Turpan basins.
Remotesensing 13 00875 g007
Figure 8. Distribution of correlation coefficients between the VCI and Niño 3.4 in different lag periods: (al) the spatial distribution of the correlation between Niño 3.4 and VCI when Niño 3.4 is shifted 1–12 months.
Remotesensing 13 00875 g008
Table 1. Codes of eco-geographical regions.
Temperature ZoneDry–Wet PartitionNatural Region
I Cool Temperate ZoneA Humid RegionIA1 Daxing’an Mountains
II Mid-Temperate ZoneA Humid RegionIIA1 Sanjiang Plain
IIA2 East Upland Area of Northeast China
IIA3 Front Mountain Plain of Eastern Northeast China
B Semi-Humid RegionIIB1 Central Songliao Plain
IIB2 Southern Daxing’an Mountains
IIB3 Plain and Hills Sanhe Piedmont
C Semi-arid RegionIIC1 Southwestern Songliao Plain
IIC2 Northern Daxing’an Mountains
IIC3 Eastern Inner Mongolia Plateau
IID1 Western Inner Mongolia Plateau and Hetao
IID2 Alxa and Hexi Corridor
D Arid RegionIID3 Junggar Basin
IID4 Altai Mountain and Tacheng Basin
IID5 Ili River Basin
III Warm Temperate ZoneA Humid RegionIIIA1 Jiaodong Mountain Hills in Eastern Liaoning Province
B Semi-Humid RegionIIIB1 Mountain and Hills in Central Shandong
IIIB2 North China Plain
IIIB3 Mountain and Hills in North China
IIIB4 Guanzhong Basin in South Shanxi
C Semi-arid RegionIIIC1 Hilly and Plateau in Central Shanxi, Northern Shanxi and Eastern Gansu
D Arid RegionIIID1 Tarim and Turpan Basins
IV Northern Subtropical ZoneA Humid RegionIVA1 South of the Huaihe River and Middle and Lower Reaches of the Yangtze River
IVA2 Hanzhong Basin
V Middle Subtropical ZoneA Humid RegionVA1 Jiangnan Hills
VA2 Jiangnan and Nanling Mountains
VA3 Guizhou Plateau
VA4 Sichuan Basin
VA5 Yunnan Plateau
VA6 South Limb of Eastern Himalayan
VI Southern Subtropical ZoneA Humid RegionVIA1 Mountain Plain in Central and Northern Taiwan
VIA2 Hilly Plain of Fujian, Guangdong and Guangxi
VIA3 Mountain Hills in Central Yunnan
VII Edge Tropical ZoneA Humid RegionVIIA1 Lowlands in Southern Taiwan
VIIA2 Mountain Hills in Qionglei
VIIA3 Valley Hills in South Yunnan
VIII Central Tropical ZoneA Humid RegionVIIIA1 Qionglei Lowland and Dongsha, Zhongsha and Xisha Islands
IX Equatorial Tropical ZoneA Humid RegionIXA1 Nansha Islands
HI Highland Subduction ZoneB Semi-Humid RegionHIB1 Hilly Plateau in Guoluo and Naqu
C Semi-arid RegionHIC1 Wide Valley of the South Qinghai Plateau
HIC2 Qiangtang Plateau Lake Basin
D Arid RegionHID1 Plateau of Kunlun Mountain
HII Highland Temperate ZoneA/B Humid Region/Semi-Humid RegionHIIA/B1 High Mountains and Canyon in Eastern Sichuan and Tibet
C Semi-arid RegionHIIC1 Eastern Qilian Mountains
HIIC2 Mountain South Tibet
D Arid RegionHIID1 Qaidam Basin
HIID2 North Limb of Kunlun Mountain
HIID3 Ali Mountain
Table 2. Extraction results of the mean and maximum values of the correlation coefficients between the VCI and Niño 3.4 in different lag periods.
Time Lag123456789101112
Mean Value of Correlation Coefficient0.270.310.340.360.370.380.370.350.320.300.270.25
Max Value of Correlation Coefficient0.650.670.680.690.730.750.740.730.720.710.670.68
Publisher’s Note: MDPI stays neutral with regard to jurisdictional claims in published maps and institutional affiliations.